


1. Introduction
Fluid–structure interactions (FSIs) are present in many natural and industrial phenomena. Investigating the fundamental mechanics of FSIs is paramount to advancing knowledge of geological (MacMinn, Dufresne & Wettlaufer Reference MacMinn, Dufresne and Wettlaufer2015), microfluidic (Weaver et al. Reference Weaver, Melin, Stark, Quake and Horowitz2010), rheological (Kargar-Estahbanati & Rallabandi Reference Kargar-Estahbanati and Rallabandi2021) and biological systems. For example, intratumoral infusion is a form of treatment that relies on the flow of chemotheraputic drugs through a porous tumour. Tumours are made of soft tissues and blood vessels, which can deform under the pressure of the injected fluid. Knowledge of the FSI coupling the deformation of the tumour with the change in permeability affecting the fluid flow is integral to the efficacy of this medical procedure (Bottaro & Ansaldi Reference Bottaro and Ansaldi2012).
Analogously, in geological carbon sequestration, carbon is injected into porous rock at high pressures, such that the elasticity of the domain cannot be ignored (Verdon et al. Reference Verdon, Kendall, Stork, Chadwick, White and Bissell2013). Impermeable caprock prevents the buoyant carbon from escaping, but also confines the poroelastic region, possibly affecting the influx of carbon and the caprock integrity (Bissell et al. Reference Bissell, Vasco, Atbi, Hamdani, Okwelegbe and Goldwater2011). Damage to storage sites because of imprecise modelling is both environmentally and economically costly (Ringrose et al. Reference Ringrose, Mathieson, Wright, Selama, Hansen, Bissell, Saoula and Midgley2013).
Likewise, in the laboratory, FSIs have been exploited in the fabrication of microfluidic devices that passively control fluid without the need for external actuation. Such devices can mimic electronic components, such as capacitors (Leslie et al. Reference Leslie, Easley, Seker, Karlinsey, Utz, Begley and Landers2009), transistors (Mosadegh et al. Reference Mosadegh, Kuo, Tung, Torisawa, Bersano-Begey, Tavana and Takayama2010; Gopinathan et al. Reference Gopinathan, Mishra, Mutlu, Edd and Toner2023) and flow switches (Gomez, Moulton & Vella Reference Gomez, Moulton and Vella2017; Garg et al. Reference Garg, Ledda, Pedersen and Pezzulla2024). These typically employ thin elastic sheets, the bending or inflation of which is controlled by either the fluid in the channel itself or another ‘control’ line of fluid (Weaver et al. Reference Weaver, Melin, Stark, Quake and Horowitz2010).
Fluid-structure interactions can generate a nonlinear pressure–flow-rate relation, because soft components deform in response to pressure changes and thereby alter the flow geometry. Alvarado et al. (Reference Alvarado, Comtet, De Langre and Hosoi2017) showed that the flow over a bed of soft hairs is affected by the deformation of the hairs, which is in turn affected by the rate of flow over the hairs. The coupling of these two interactions leads to distinct states of the system, causing a diode-like flow behaviour. A dramatic example of a nonlinear flow relation is flow-rate-limiting behaviour, where an increase in input fluid pressure does not necessarily translate to an increase in flux. Examples include forced exhalation (Elad, Kamm & Shapiro Reference Elad, Kamm and Shapiro1988) and, more generally, the collapse of fluid-carrying tubes in physiology (Heil Reference Heil1997). Flows in poroelastic media can also exhibit flow-rate limitation (Hewitt et al. Reference Hewitt, Nijjer, Worster and Neufeld2016) and are mathematically equivalent to Hele-Shaw flows, which are often more convenient to study in laboratory settings.
Schematic diagram of an axisymmetric Hele-Shaw channel between a rigid plate and a confined, deformable elastomer: (a) for a thin slab, $R_0 \gg d$
, and (b) for a thick block,
$R_0 \gg d$
, and (b) for a thick block, $R_0 \lesssim d$
. The deformable surface is one face of a cylindrical elastic block, with radius
$R_0 \lesssim d$
. The deformable surface is one face of a cylindrical elastic block, with radius $R_0$
and depth
$R_0$
and depth $d$
. The ratio between these,
$d$
. The ratio between these, $\mathcal{A} \equiv R_0/d$
, qualitatively changes the deformation of the block in response to fluid pressure.
$\mathcal{A} \equiv R_0/d$
, qualitatively changes the deformation of the block in response to fluid pressure.

Here, we study a soft, radial Hele-Shaw cell, i.e. a thin fluid-filled gap formed between one rigid plate and one side of a deformable block of elastomer that is confined on all other sides by a rigid mould, as shown in figure 1. Fluid flows radially outwards, from an injection port located in the centre of the rigid plate, towards the rim, where it exits the cell to the atmosphere. Pressure gradients inside the fluid cause the bulk of elastomer to deform, and when the magnitude of the deformation is significantly large, the surface of the elastomer alters the gap size of the cell, affecting the viscous resistance to flow. Previous work (Box et al. Reference Box, Peng, Pihler-Puzović and Juel2020; Peng et al. Reference Peng, Cuttle, Box, Guan, Juel, MacMinn and Pihler-Puzović2022, Reference Peng, Cuttle, MacMinn and Pihler-Puzović2023) has demonstrated that this system exhibits flow-induced ‘choking’; fluid pressure causes the displacement of elastomer towards the rim, and the confinement imposed by the side walls causes the nearby elastomer to deform towards the rigid plate, forming a bulge. Beyond a critical injection rate, the bulge peak will make contact with the rigid plate, occluding the flow entirely. This critical flow rate depends on the physical parameters of the system as well as the geometry– in particular, the aspect ratio of the elastomer. Box et al. (Reference Box, Peng, Pihler-Puzović and Juel2020) explored the case of a thin slab of elastomer whose radius is much larger than its depth, derived an explicit order-of-magnitude estimate for the critical flow rate, and demonstrated that bulging occurs in a near-rim boundary layer, the size of which is comparable to the elastomer depth.
In the case of a thick block of elastomer, whose radius is equal to or less than its depth, it is not immediately clear that the system can choke, given that the equivalent boundary layer is as large as the whole fluid plane. So here, we numerically study the role of elastomer geometry on the choking phenomenon, specifically the case of a thick elastomer block. After building a full model of the system in § 2, in § 3 we examine surface deformation profiles of the elastomer to identify two separate regimes for which pressures in the elastomer are of different scales. We then construct an approximate choking criterion appropriate for a wide range of geometries, which includes a thick block whose radial extent is much smaller than its depth. We confirm these estimates in § 3 with further numerical results, and conclude with a discussion of our results in § 4.
2. Modelling
Here, we re-state the model that was derived in previous work (Box et al. Reference Box, Peng, Pihler-Puzović and Juel2020). We consider a viscous, incompressible fluid that occupies the gap between a solid plate and one wall of a soft deformable block of elastomer, which forms a circular Hele-Shaw cell of initial (relaxed) gap $b_0$
, as shown in figure 1. The elastomer block is a solid, impermeable and incompressible cylinder of radius
$b_0$
, as shown in figure 1. The elastomer block is a solid, impermeable and incompressible cylinder of radius $R_0$
, depth
$R_0$
, depth $d$
, and shear modulus
$d$
, and shear modulus $G$
, which is confined on the top and sides, whilst the bottom surface forms the deformable ceiling of the Hele-Shaw channel.
$G$
, which is confined on the top and sides, whilst the bottom surface forms the deformable ceiling of the Hele-Shaw channel.
We use a tilde to denote a dimensional variable. From time $\tilde {t}=0$
, fluid is injected at a constant flow rate at the centre of the fluid-filled cell, the origin
$\tilde {t}=0$
, fluid is injected at a constant flow rate at the centre of the fluid-filled cell, the origin $\tilde {r}=0$
, where
$\tilde {r}=0$
, where $\tilde {r}$
is the dimensional radial coordinate in the direction of the channel. In response to pressure in the fluid, the deformable wall deflects by
$\tilde {r}$
is the dimensional radial coordinate in the direction of the channel. In response to pressure in the fluid, the deformable wall deflects by $\tilde {w}_f(\tilde {r},\tilde {t})$
, so that the effective gap size has radial distribution
$\tilde {w}_f(\tilde {r},\tilde {t})$
, so that the effective gap size has radial distribution $b = b_0 + \tilde {w}_f(\tilde {r},\tilde {t})$
. Assuming the gap to be thin compared to the length of the channel, i.e.
$b = b_0 + \tilde {w}_f(\tilde {r},\tilde {t})$
. Assuming the gap to be thin compared to the length of the channel, i.e. $b \ll R_0$
, the evolution of
$b \ll R_0$
, the evolution of $\tilde {w}_f$
can be modelled using the axisymmetric depth-averaged lubrication equation
$\tilde {w}_f$
can be modelled using the axisymmetric depth-averaged lubrication equation
 \begin{equation} \dot {\tilde {w}}_f = \frac {1}{12 \mu } \tilde {\boldsymbol{\nabla} }_H \boldsymbol{\cdot } ((b_0+\tilde {w}_f)^3\, \tilde {\boldsymbol{\nabla} }_H \tilde {p}_f), \end{equation}
where $\tilde {p}_f(\tilde {r},\tilde {t})$
is the fluid pressure,
$\tilde {p}_f(\tilde {r},\tilde {t})$
is the fluid pressure, $\mu$
is the constant viscosity of the fluid, and
$\mu$
is the constant viscosity of the fluid, and $\boldsymbol{\nabla} _H$
represents gradients taken in the horizontal plane. Fluid injected at flow rate
$\boldsymbol{\nabla} _H$
represents gradients taken in the horizontal plane. Fluid injected at flow rate $Q$
from a point source at the centre of the cell flows radially outwards and exits into the atmosphere at the cell rim, resulting in the boundary conditions
$Q$
from a point source at the centre of the cell flows radially outwards and exits into the atmosphere at the cell rim, resulting in the boundary conditions
 \begin{equation} \tilde {r} (b_0+\tilde {w}_f)^3 \frac {\partial \tilde {p}_f}{\partial \tilde {r}} \sim - \frac {12 \mu Q}{2\unicode{x03C0} } \ \mathrm{as} \ \tilde {r} \rightarrow 0, \quad \tilde {p}_f = 0 \ \mathrm{at} \ \tilde {r} = R_0. \end{equation}
Inside the elastic slab with displacement ${\tilde{\boldsymbol{u}}}_s = \tilde {u}_s\boldsymbol{e}_r + \tilde {w}_s\boldsymbol{e}_z$
, we assume that material strains are small, i.e.
${\tilde{\boldsymbol{u}}}_s = \tilde {u}_s\boldsymbol{e}_r + \tilde {w}_s\boldsymbol{e}_z$
, we assume that material strains are small, i.e. $|{\tilde{\boldsymbol{u}}}_s |\ll d, R_0$
. We can therefore assume that the block is linearly elastic, and the axisymmetric displacements, stresses
$|{\tilde{\boldsymbol{u}}}_s |\ll d, R_0$
. We can therefore assume that the block is linearly elastic, and the axisymmetric displacements, stresses $\tilde {\sigma }$
, and solid pressure
$\tilde {\sigma }$
, and solid pressure $\tilde {p}_s \equiv -({\rm Tr} \ \tilde {\sigma })/3$
satisfy
$\tilde {p}_s \equiv -({\rm Tr} \ \tilde {\sigma })/3$
satisfy
 \begin{equation} \tilde {\sigma } = -\tilde {p}_s \boldsymbol{I} + G \big (\boldsymbol{\nabla} {\tilde{\boldsymbol{u}}}_s + \boldsymbol{\nabla} {\tilde{\boldsymbol{u}}}_s^{\rm T}\big), \quad \boldsymbol{\nabla} \boldsymbol{\cdot } \tilde {\sigma } = \boldsymbol{0}, \quad \boldsymbol{\nabla} \boldsymbol{\cdot } {\tilde{\boldsymbol{u}}}_s = 0. \end{equation}
Here, ${\rm Tr}$
represents the trace of a tensor,
${\rm Tr}$
represents the trace of a tensor, $\boldsymbol{I}$
is the identity matrix, and the solid is assumed to deform quasi-statically because the solid’s inertial time scale is much shorter than the viscous time scale even when the elastomer is thin. On the confining walls of the block, we impose the no-slip boundary condition
$\boldsymbol{I}$
is the identity matrix, and the solid is assumed to deform quasi-statically because the solid’s inertial time scale is much shorter than the viscous time scale even when the elastomer is thin. On the confining walls of the block, we impose the no-slip boundary condition ${\tilde{\boldsymbol{u}}}_s = \boldsymbol{0}$
at
${\tilde{\boldsymbol{u}}}_s = \boldsymbol{0}$
at $\tilde {r}=R_0$
and at
$\tilde {r}=R_0$
and at $\tilde {z}=d$
. At the fluid–solid interface
$\tilde {z}=d$
. At the fluid–solid interface $\tilde {z}=0$
, we have
$\tilde {z}=0$
, we have $\tilde {w}_s = \tilde {w}_f$
,
$\tilde {w}_s = \tilde {w}_f$
, $\tilde {\sigma }_{zz} = -\tilde {p}_f$
,
$\tilde {\sigma }_{zz} = -\tilde {p}_f$
, $\tilde {\sigma }_{rz}=0$
, and at the origin
$\tilde {\sigma }_{rz}=0$
, and at the origin $\tilde {r} = 0$
, we have
$\tilde {r} = 0$
, we have $\tilde {u}_s = 0$
and
$\tilde {u}_s = 0$
and $\tilde {\sigma }_{rz} = 0$
. By scaling distances with the elastomer depth, displacements with the initial gap size, pressures with the scale associated with elastic stress, and choosing an appropriate timescale, we formulate the non-dimensional variables
$\tilde {\sigma }_{rz} = 0$
. By scaling distances with the elastomer depth, displacements with the initial gap size, pressures with the scale associated with elastic stress, and choosing an appropriate timescale, we formulate the non-dimensional variables
 \begin{equation} \boldsymbol{x} = \frac {\tilde {\boldsymbol{x}}}{d}, \quad (\boldsymbol{u}_s,w_f) = \frac {(\tilde {\boldsymbol{u}}_s,\tilde {w}_f)}{b_0}, \quad (\sigma, p_s, p_f) = \frac {(\tilde {\sigma }, \tilde {p}_s, \tilde {p}_f)}{Gb_0/d}, \quad t = \frac {\tilde {t}}{12 \mu d^3/Gb_0^3}. \end{equation}
Note that we have chosen the length scale $d$
to be consistent with Box et al. (Reference Box, Peng, Pihler-Puzović and Juel2020), who found bulging to be confined to a boundary layer of size
$d$
to be consistent with Box et al. (Reference Box, Peng, Pihler-Puzović and Juel2020), who found bulging to be confined to a boundary layer of size $d$
near the rim.
$d$
near the rim.
Hence the non-dimensional governing equations are
 \begin{gather} \dot {w}_f = \boldsymbol{\nabla} _H \boldsymbol{\cdot } ((1+w_f)^3\, \boldsymbol{\nabla} _H p_f), \quad r (1+w_f)^3 \frac {\partial p_f}{\partial r} \sim - \mathcal{F} \ \mathrm{as} \ r \rightarrow 0, \quad p_f = 0 \ \mathrm{at} \ r = \mathcal{A}, \\[-24pt] \nonumber \end{gather}
 \begin{gather} \sigma = -p_s \boldsymbol{I} + \left (\boldsymbol{\nabla} \boldsymbol{u}_s + \boldsymbol{\nabla} \boldsymbol{u}_s^{\rm T}\right), \quad \boldsymbol{\nabla} \boldsymbol{\cdot } \sigma = \boldsymbol{0},\quad \boldsymbol{\nabla} \boldsymbol{\cdot } \boldsymbol{u}_s = 0, \quad \boldsymbol{u}_s = \boldsymbol{0} \ \mathrm{at} \ r=\mathcal{A} \text{ and at } z=1, \\[-24pt] \nonumber \end{gather}
 \begin{gather} w_s = w_f, \,\, \sigma _{zz} = -p_f, \,\,\sigma _{rz} = 0 \quad \mathrm{at} \ z = 0, \quad u_s = \sigma _{rz} = 0 \ \mathrm{at} \ r = 0, \end{gather}
where
 \begin{equation} \mathcal{F} = \frac {6\mu Q d}{\unicode{x03C0} G b_0^4} \quad \text{and} \quad \mathcal{A} = \frac {R_0}{d} \end{equation}
are the FSI parameter (or dimensionless flow rate), and the slab aspect ratio, respectively. Following non-dimensionalisation, these parameters control the system in its entirety.
We numerically solved this system using a custom finite-difference scheme in MATLAB® that utilises built-in routines for LU factorisation and solving sparse matrices. The details of the method are discussed in Peng et al. (Reference Peng, Cuttle, MacMinn and Pihler-Puzović2023), but we adapt it for our problem by discretising the solid domain $0\leqslant r \leqslant \mathcal{A}$
,
$0\leqslant r \leqslant \mathcal{A}$
, $0\leqslant z \leqslant 1$
on a non-uniform grid to achieve the same level of convergence. The grid is adjusted as the geometry of the system demands; a very thick block of elastomer has a uniform radial grid, and a vertical grid that is denser near the elastomer surface where gradients in displacement are larger. For a very thin slab of elastomer, the vertical grid is uniform, but the radial grid is much denser near the outlet at the rim to resolve the deformation that occurs there. From (2.2), we see that pressure in the fluid diverges logarithmically as
$0\leqslant z \leqslant 1$
on a non-uniform grid to achieve the same level of convergence. The grid is adjusted as the geometry of the system demands; a very thick block of elastomer has a uniform radial grid, and a vertical grid that is denser near the elastomer surface where gradients in displacement are larger. For a very thin slab of elastomer, the vertical grid is uniform, but the radial grid is much denser near the outlet at the rim to resolve the deformation that occurs there. From (2.2), we see that pressure in the fluid diverges logarithmically as $r\rightarrow 0$
. (In experiments, there would be no singularity since the injection port has a small but finite radius.) Hence we measure the injection pressure at
$r\rightarrow 0$
. (In experiments, there would be no singularity since the injection port has a small but finite radius.) Hence we measure the injection pressure at $\tilde {r} = 0.01 R_0$
to avoid the singularity at the origin:
$\tilde {r} = 0.01 R_0$
to avoid the singularity at the origin:
 \begin{equation} p_{inj}(t) = p(0.01 \mathcal{A},t). \end{equation}
We used two different approaches to map out the parameter space of our system. We initially found steady-state solutions by numerically solving the full time-dependent system until it stopped evolving in time. However, the majority of data were collected by numerically solving the time-independent system, i.e. by setting $\dot {w}_f = 0$
and computing steady states, having verified that the steady-state solver failing to converge was equivalent to
$\dot {w}_f = 0$
and computing steady states, having verified that the steady-state solver failing to converge was equivalent to $b$
decreasing to zero somewhere in the computational domain in the time-dependent problem (i.e. the elastomer developing a bulge that constricts the fluid gap in finite time).
$b$
decreasing to zero somewhere in the computational domain in the time-dependent problem (i.e. the elastomer developing a bulge that constricts the fluid gap in finite time).
3. Results
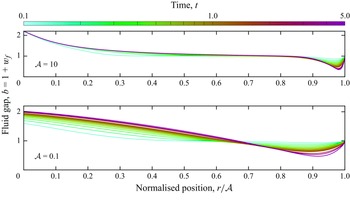
The time evolution of the system has previously been studied for a thin slab of elastomer (Box et al. Reference Box, Peng, Pihler-Puzović and Juel2020; Peng et al. Reference Peng, Cuttle, MacMinn and Pihler-Puzović2023). In figure 2, deflection profiles of the free surface of the elastomer demonstrate how the deformation can evolve in time to a steady state, for both large and small aspect ratio elastomers. In both cases, deformation leads to increasing constriction of the cell gap near the cell rim. However, the shapes of the steady-state deflection profiles are notably different. For a thin slab, $\mathcal{A}=10$
, the deformation is local to the injection port and the cell rim, where a pronounced bulge constricts the fluid gap. Yet for a thick block of elastomer,
$\mathcal{A}=10$
, the deformation is local to the injection port and the cell rim, where a pronounced bulge constricts the fluid gap. Yet for a thick block of elastomer, $\mathcal{A}=0.1$
, the deformation is distributed globally across the entire domain.
$\mathcal{A}=0.1$
, the deformation is distributed globally across the entire domain.
Instantaneous profiles of the surface deflection of the elastomer at different instances in (dimensionless) time $t$
, for a thin slab of elastomer (
$t$
, for a thin slab of elastomer ( $\mathcal{A} = 10$
top) and a thick block (
$\mathcal{A} = 10$
top) and a thick block ( $\mathcal{A} = 0.1$
bottom). As in previous work, the deformation of the thin (large aspect ratio) slab is confined to boundary layers at the rim and injection point, whilst the deformation of the thick (small aspect ratio) block is distributed more globally across the domain. We chose values of
$\mathcal{A} = 0.1$
bottom). As in previous work, the deformation of the thin (large aspect ratio) slab is confined to boundary layers at the rim and injection point, whilst the deformation of the thick (small aspect ratio) block is distributed more globally across the domain. We chose values of $\mathcal{F}$
so that each system would show significant deformation, but not choke, and settle into a steady state (
$\mathcal{F}$
so that each system would show significant deformation, but not choke, and settle into a steady state ( $\mathcal{F} = 13.5$
top,
$\mathcal{F} = 13.5$
top, $\mathcal{F} = 135$
bottom).
$\mathcal{F} = 135$
bottom).

Numerically determined surface deformation profiles of the elastic block, for various aspect ratios $\mathcal{A} = R_0/d$
, as indicated in the legend. A large amount of depressive deformation occurs near the inlet, where fluid pressure is the highest. For a thin slab of elastomer,
$\mathcal{A} = R_0/d$
, as indicated in the legend. A large amount of depressive deformation occurs near the inlet, where fluid pressure is the highest. For a thin slab of elastomer, $\mathcal{A}\gtrsim 1$
, a distinct bulge forms near the outlet. For a thick block of elastomer,
$\mathcal{A}\gtrsim 1$
, a distinct bulge forms near the outlet. For a thick block of elastomer, $\mathcal{A}\lesssim 1$
, the minimum gap size
$\mathcal{A}\lesssim 1$
, the minimum gap size $b_{min}$
still occurs near the cell rim; however, vertical displacements are not constrained to the inlet and outlet. As the aspect ratio tends to zero,
$b_{min}$
still occurs near the cell rim; however, vertical displacements are not constrained to the inlet and outlet. As the aspect ratio tends to zero, $\mathcal{A}\rightarrow 0$
, the profiles converge. The input flow rate was set so that the maximum bulge height
$\mathcal{A}\rightarrow 0$
, the profiles converge. The input flow rate was set so that the maximum bulge height $1 - b_{min}$
was the same for each profile.
$1 - b_{min}$
was the same for each profile.

To investigate the effect of elastomer depth, we studied a wide class of elastomer geometries from a thick block, with $\mathcal{A}$
down to
$\mathcal{A}$
down to $0.01$
, to a thin slab, with
$0.01$
, to a thin slab, with $\mathcal{A}$
up to
$\mathcal{A}$
up to $100$
. Using the height of the bulge as a way to quantify the level of deformation experienced by the block, we compare deformation profiles for blocks of different aspect ratio in figure 3. The deformation profile qualitatively changes depending on whether the aspect ratio is large,
$100$
. Using the height of the bulge as a way to quantify the level of deformation experienced by the block, we compare deformation profiles for blocks of different aspect ratio in figure 3. The deformation profile qualitatively changes depending on whether the aspect ratio is large, $\mathcal{A} \gtrsim 1$
, or small,
$\mathcal{A} \gtrsim 1$
, or small, $\mathcal{A} \lesssim 1$
. For large aspect ratios, the bulge position depends on slab geometry – approaching the rim with increasing aspect ratio – which demonstrates that bulging is confined to an elastic boundary layer. However, for small aspect ratios, the solutions converge to a single surface deformation profile, which suggests that in the limit of thick blocks, the deformation of the elastomer becomes independent of the depth of the elastomer.
$\mathcal{A} \lesssim 1$
. For large aspect ratios, the bulge position depends on slab geometry – approaching the rim with increasing aspect ratio – which demonstrates that bulging is confined to an elastic boundary layer. However, for small aspect ratios, the solutions converge to a single surface deformation profile, which suggests that in the limit of thick blocks, the deformation of the elastomer becomes independent of the depth of the elastomer.
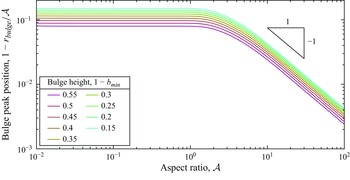
To quantify how flow-induced deformation is influenced by elastomer geometry, we examine the position of the bulge peak relative to the channel length for various maximum bulge heights (minimum gap size) as the aspect ratio is varied; see figure 4 where $r_{\textit{bulge}}$
is the position of the bulge peak relative to the injection point. Across all aspect ratios, the dependence of bulge position on
$r_{\textit{bulge}}$
is the position of the bulge peak relative to the injection point. Across all aspect ratios, the dependence of bulge position on $1-b_{min}$
is the same; bulges with larger peak form closer to the rim. However, these results reveal a clear distinction in the way that thin and thick blocks of elastomer respond to fluid forcing. As
$1-b_{min}$
is the same; bulges with larger peak form closer to the rim. However, these results reveal a clear distinction in the way that thin and thick blocks of elastomer respond to fluid forcing. As $\mathcal{A} \rightarrow \infty$
, the main deformation occurs in a radial boundary layer of (dimensional) width
$\mathcal{A} \rightarrow \infty$
, the main deformation occurs in a radial boundary layer of (dimensional) width $L^{R}_{\textit{BL}} = (R_0-\tilde {r}_{\textit{bulge}}) \sim d$
, and the normalised distance between the bulge peak and rim scales as
$L^{R}_{\textit{BL}} = (R_0-\tilde {r}_{\textit{bulge}}) \sim d$
, and the normalised distance between the bulge peak and rim scales as $1/\mathcal{A}$
. However, for
$1/\mathcal{A}$
. However, for $\mathcal{A} \lesssim 1$
, the bulge position remains fixed as
$\mathcal{A} \lesssim 1$
, the bulge position remains fixed as $\mathcal{A}$
is varied, which implies that for small enough aspect ratio, the effect of confinement at the top of the block becomes negligible, and the surface deformation is instead governed by pressure gradients across the whole channel.
$\mathcal{A}$
is varied, which implies that for small enough aspect ratio, the effect of confinement at the top of the block becomes negligible, and the surface deformation is instead governed by pressure gradients across the whole channel.
The normalised distance from the rim of the bulge peak, $1 - r_{\textit{bulge}}/\mathcal{A}$
, as a function of aspect ratio
$1 - r_{\textit{bulge}}/\mathcal{A}$
, as a function of aspect ratio $\mathcal{A}$
and bulge height
$\mathcal{A}$
and bulge height $1 - b_{min}$
. For all aspect ratios, the bulge peak moves closer to the rim as the bulge height increases. For
$1 - b_{min}$
. For all aspect ratios, the bulge peak moves closer to the rim as the bulge height increases. For $\mathcal{A} \lesssim 1$
, the normalised distance is independent of aspect ratio. As
$\mathcal{A} \lesssim 1$
, the normalised distance is independent of aspect ratio. As $\mathcal{A} \rightarrow \infty$
, the normalised distance approaches
$\mathcal{A} \rightarrow \infty$
, the normalised distance approaches $0$
, as the bulging occurs in a boundary layer of width
$0$
, as the bulging occurs in a boundary layer of width $L^{R}_{\textit{BL}} \sim d$
, represented non-dimensionally by
$L^{R}_{\textit{BL}} \sim d$
, represented non-dimensionally by $\mathcal{A}^{-1}$
.
$\mathcal{A}^{-1}$
.

We now turn our attention to how the magnitude of the deformation changes as the injection flow rate is varied. In figure 5(a), we show the evolution of the minimum gap size $b_{min}$
for a slab of aspect ratio
$b_{min}$
for a slab of aspect ratio $\mathcal{A}=10$
and two different values of the dimensionless injection flux
$\mathcal{A}=10$
and two different values of the dimensionless injection flux $\mathcal{F}$
. In one case, the minimum gap size evolves to a constant value, indicative of the system reaching steady state. The corresponding value of
$\mathcal{F}$
. In one case, the minimum gap size evolves to a constant value, indicative of the system reaching steady state. The corresponding value of $b_{min}$
was also computed independently using the steady-state solver (see the dashed line in figure 5
a). However, for a slightly higher
$b_{min}$
was also computed independently using the steady-state solver (see the dashed line in figure 5
a). However, for a slightly higher $\mathcal{F}$
, the minimum gap size decreases monotonically in time. This demonstrates that there is a critical value of the FSI parameter
$\mathcal{F}$
, the minimum gap size decreases monotonically in time. This demonstrates that there is a critical value of the FSI parameter $\mathcal{F}_c$
, beyond which no steady state exists. Instead, in time-dependent simulations, we observe a feedback loop of decreasing gap size and increasing injection pressure (which is needed to maintain the injection flow rate) until the simulations are interrupted when the maximum bulge height
$\mathcal{F}_c$
, beyond which no steady state exists. Instead, in time-dependent simulations, we observe a feedback loop of decreasing gap size and increasing injection pressure (which is needed to maintain the injection flow rate) until the simulations are interrupted when the maximum bulge height $1-b_{min}$
increases beyond 0.95 – our criterion for choking.
$1-b_{min}$
increases beyond 0.95 – our criterion for choking.
To quantify how flow-induced deformation is determined by system properties, and the parameter space in which choking occurs, we record the maximum height of the bulge as a function of elastomer aspect ratio $\mathcal{A}$
, and dimensionless flow rate
$\mathcal{A}$
, and dimensionless flow rate $\mathcal{F}$
, in figure 5(b). For a given aspect ratio, increasing
$\mathcal{F}$
, in figure 5(b). For a given aspect ratio, increasing $\mathcal{F}$
strictly increases the magnitude of deformation, and therefore the maximum bulge height. We find that, regardless of elastomer geometry, there always exists a critical flow rate
$\mathcal{F}$
strictly increases the magnitude of deformation, and therefore the maximum bulge height. We find that, regardless of elastomer geometry, there always exists a critical flow rate $\mathcal{F}_c$
above which the system will choke. However, our results demonstrate two separate scaling relations, corresponding to the two geometrically distinct regimes of deformation, for the choking flow rate
$\mathcal{F}_c$
above which the system will choke. However, our results demonstrate two separate scaling relations, corresponding to the two geometrically distinct regimes of deformation, for the choking flow rate $\mathcal{F}_c$
:
$\mathcal{F}_c$
:
 \begin{equation} \mathcal{F}_c \sim \mathcal{A}^{-1} \ \mathrm{for} \ \mathcal{A} \lesssim 1, \quad \mathcal{F}_c \sim \mathcal{A} \ \mathrm{for} \ \mathcal{A} \gtrsim 10. \end{equation}
In figure 5(c), we similarly record the maximum bulge height for a given injection pressure $p_{inj}$
defined in (2.9). In this case, there is no longer a feedback loop between gap size and injection pressure that limits the values of
$p_{inj}$
defined in (2.9). In this case, there is no longer a feedback loop between gap size and injection pressure that limits the values of $\mathcal{F}$
for which steady solutions exist. As the injection pressure is increased from zero, injection flow rate increases until it reaches the choking flow rate, at a finite injection pressure. As pressure is further increased, the injection flow rate decreases slightly, the magnitude of deformation increases, and steady states can be found even with a very small gap
$\mathcal{F}$
for which steady solutions exist. As the injection pressure is increased from zero, injection flow rate increases until it reaches the choking flow rate, at a finite injection pressure. As pressure is further increased, the injection flow rate decreases slightly, the magnitude of deformation increases, and steady states can be found even with a very small gap $b_{min}$
. In this model, there does not exist a maximum pressure above which the system chokes. This is consistent with other flow-rate limiting phenomena studied in laboratory settings (Hewitt et al. Reference Hewitt, Nijjer, Worster and Neufeld2016; Dumazer et al. Reference Dumazer, Sandnes, Ayaz, Måløy and Flekkøy2016). Practically, at very high pressure, the channel depth would become so small (i.e.
$b_{min}$
. In this model, there does not exist a maximum pressure above which the system chokes. This is consistent with other flow-rate limiting phenomena studied in laboratory settings (Hewitt et al. Reference Hewitt, Nijjer, Worster and Neufeld2016; Dumazer et al. Reference Dumazer, Sandnes, Ayaz, Måløy and Flekkøy2016). Practically, at very high pressure, the channel depth would become so small (i.e. $b_{min} \rightarrow 0$
) that other forces such as van der Waals, which are not accounted for in this model, could push the system towards choking, i.e. result in
$b_{min} \rightarrow 0$
) that other forces such as van der Waals, which are not accounted for in this model, could push the system towards choking, i.e. result in $b_{min} = 0$
.
$b_{min} = 0$
.
We now rationalise the distinct relations for $\mathcal{F}_c$
given by (3.1). Using scaling arguments based on the magnitude of pressures and displacements inside the slab, we construct order-of-magnitude estimates for the critical injection flow rate
$\mathcal{F}_c$
given by (3.1). Using scaling arguments based on the magnitude of pressures and displacements inside the slab, we construct order-of-magnitude estimates for the critical injection flow rate $Q$
that would result in choking. The choking of a thin slab of elastomer, studied previously by Box et al. (Reference Box, Peng, Pihler-Puzović and Juel2020), occurs when deformation is of order
$Q$
that would result in choking. The choking of a thin slab of elastomer, studied previously by Box et al. (Reference Box, Peng, Pihler-Puzović and Juel2020), occurs when deformation is of order $b_0$
such that strain in the elastomer is of order
$b_0$
such that strain in the elastomer is of order $b_0/d$
, so from (2.3), pressure in the solid scales as
$b_0/d$
, so from (2.3), pressure in the solid scales as $\tilde {p}_s \sim Gb_0/d$
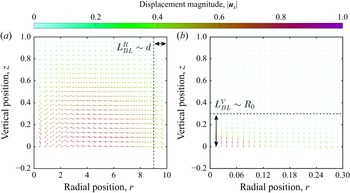
. From plots of the material displacement fields in the slab (see figure 6
a), we see that bulging occurs near the rim, in a boundary layer of size
$\tilde {p}_s \sim Gb_0/d$
. From plots of the material displacement fields in the slab (see figure 6
a), we see that bulging occurs near the rim, in a boundary layer of size $L^R_{\textit{BL}} = (R_0-\tilde {r}_{\textit{bulge}}) \sim d$
. Deformation is driven by local pressure gradients in the fluid,
$L^R_{\textit{BL}} = (R_0-\tilde {r}_{\textit{bulge}}) \sim d$
. Deformation is driven by local pressure gradients in the fluid, $\partial _{\tilde {r}} \tilde {p}_f \sim \tilde {p}_f/d$
, such that from (2.2),
$\partial _{\tilde {r}} \tilde {p}_f \sim \tilde {p}_f/d$
, such that from (2.2), $Q/2\unicode{x03C0} R_0 \sim b_0^3 \tilde {p}_f / 12 \mu d$
. Equating these two pressures and rearranging, we find a critical flow rate for a thin slab:
$Q/2\unicode{x03C0} R_0 \sim b_0^3 \tilde {p}_f / 12 \mu d$
. Equating these two pressures and rearranging, we find a critical flow rate for a thin slab:
 \begin{equation} Q^t_c \sim \frac {\unicode{x03C0} R_0 G b_0^4}{6 \mu d^2}. \end{equation}
(a) Time evolution of minimum gap size $b_{min}$
for
$b_{min}$
for $\mathcal{A}=10$
and two values of
$\mathcal{A}=10$
and two values of $\mathcal{F}$
,
$\mathcal{F}$
, $13.9$
and
$13.9$
and $14.1$
(indicated in (b) using the same colour-coding) when the flow rate is controlled. The dashed line indicates a prediction for the value of
$14.1$
(indicated in (b) using the same colour-coding) when the flow rate is controlled. The dashed line indicates a prediction for the value of $b_{min}$
obtained using the steady-state solver for
$b_{min}$
obtained using the steady-state solver for $\mathcal{A}=10$
and
$\mathcal{A}=10$
and $\mathcal{F}=13.9$
. The star indicates where the time-dependent computations were interrupted, i.e. when choking was observed in finite time. (b,c) The effect of aspect ratio on the magnitude of deformation when controlling for (b) flow rate or (c) injection pressure. In (b), the maximum bulge height scales like
$\mathcal{F}=13.9$
. The star indicates where the time-dependent computations were interrupted, i.e. when choking was observed in finite time. (b,c) The effect of aspect ratio on the magnitude of deformation when controlling for (b) flow rate or (c) injection pressure. In (b), the maximum bulge height scales like $\mathcal{F} / \mathcal{A}$
as
$\mathcal{F} / \mathcal{A}$
as $\mathcal{A} \rightarrow \infty$
, so the choking flow rate scales like
$\mathcal{A} \rightarrow \infty$
, so the choking flow rate scales like $\mathcal{F}_c \sim \mathcal{A}$
. Hence choking requires a larger
$\mathcal{F}_c \sim \mathcal{A}$
. Hence choking requires a larger $\mathcal{F}$
as the slab becomes thinner. For a thicker block, i.e.
$\mathcal{F}$
as the slab becomes thinner. For a thicker block, i.e. $\mathcal{A} \to 0$
, the maximum bulge height scales like
$\mathcal{A} \to 0$
, the maximum bulge height scales like $\mathcal{F}\mathcal{A}$
, so the choking flow rate scales like
$\mathcal{F}\mathcal{A}$
, so the choking flow rate scales like $\mathcal{F}_c \sim \mathcal{A}^{-1}$
. In (c), the same scalings are seen, but solutions can be extended to bulge heights of up to
$\mathcal{F}_c \sim \mathcal{A}^{-1}$
. In (c), the same scalings are seen, but solutions can be extended to bulge heights of up to $1 - b_{min} \approx 1$
.
$1 - b_{min} \approx 1$
.

For a thick block of elastomer, surface deformation is global, rather than being locally confined within a radial boundary layer (as is the case for a thin slab). As such, scaling displacements and pressures with elastomer depth $d$
is inappropriate. By examining displacements profiles inside the slab (see figure 6
b), we find instead that there exists a vertical boundary layer inside the slab of width
$d$
is inappropriate. By examining displacements profiles inside the slab (see figure 6
b), we find instead that there exists a vertical boundary layer inside the slab of width $L^V_{\textit{BL}}\sim R_0$
, beyond which the deformation is negligible. Hence near choking when deformation is of order
$L^V_{\textit{BL}}\sim R_0$
, beyond which the deformation is negligible. Hence near choking when deformation is of order $b_0$
, the pressure in the elastomer scales as
$b_0$
, the pressure in the elastomer scales as $\tilde {p}_s \sim Gb_0/R_0$
. To estimate the fluid pressure needed to maintain the flux, we use
$\tilde {p}_s \sim Gb_0/R_0$
. To estimate the fluid pressure needed to maintain the flux, we use $Q/2\unicode{x03C0} R_0 = (b_0^3 / 12 \mu) \partial _{\tilde {r}} \tilde {p}_f$
, with the pressure gradient acting across the whole cell, resulting in
$Q/2\unicode{x03C0} R_0 = (b_0^3 / 12 \mu) \partial _{\tilde {r}} \tilde {p}_f$
, with the pressure gradient acting across the whole cell, resulting in $\tilde {p}_f \sim 6 \mu Q/\unicode{x03C0} b_0^3$
. Balancing dimensional fluid and elastomer pressure scales gives a critical flow rate for a thick block:
$\tilde {p}_f \sim 6 \mu Q/\unicode{x03C0} b_0^3$
. Balancing dimensional fluid and elastomer pressure scales gives a critical flow rate for a thick block:
 \begin{equation} Q^d_c \sim \frac {\unicode{x03C0} G b_0^4 }{6 \mu R_0}. \end{equation}
Material displacements inside the slab for aspect ratios (a) $\mathcal{A} = 10$
and (b)
$\mathcal{A} = 10$
and (b) $\mathcal{A} = 0.3$
, for injection flow rates close to their respective choking thresholds (
$\mathcal{A} = 0.3$
, for injection flow rates close to their respective choking thresholds ( $\mathcal{F} = 14$
in (a),
$\mathcal{F} = 14$
in (a), $\mathcal{F} = 40$
in (b)). The magnitude and direction of displacements
$\mathcal{F} = 40$
in (b)). The magnitude and direction of displacements $\boldsymbol{u}_s$
are illustrated with the length/colour of the arrows and directions of the arrows, respectively. For a thin slab in (a), bulging occurs in a radial boundary layer of width
$\boldsymbol{u}_s$
are illustrated with the length/colour of the arrows and directions of the arrows, respectively. For a thin slab in (a), bulging occurs in a radial boundary layer of width $L^R_{\textit{BL}} \sim d$
near the rim; the dashed line shows
$L^R_{\textit{BL}} \sim d$
near the rim; the dashed line shows $r= \mathcal{A} - 1$
. Outside of this boundary layer, and far from the injection point, the deformation is predominantly shear towards the rim. For a thick block in (b), deformation is instead contained in a vertical boundary layer of depth
$r= \mathcal{A} - 1$
. Outside of this boundary layer, and far from the injection point, the deformation is predominantly shear towards the rim. For a thick block in (b), deformation is instead contained in a vertical boundary layer of depth $L^V_{\textit{BL}}\sim R_0$
near the surface
$L^V_{\textit{BL}}\sim R_0$
near the surface $z=0$
. Inside this region, there is both vertical and shear deformation, whilst outside of this region (for
$z=0$
. Inside this region, there is both vertical and shear deformation, whilst outside of this region (for $\tilde {z}\gtrsim R_0$
) there is negligible deformation; the dashed line shows
$\tilde {z}\gtrsim R_0$
) there is negligible deformation; the dashed line shows $z=\mathcal{A}$
.
$z=\mathcal{A}$
.

Depending on the geometry of the elastomer, we thus have two different scalings (3.2) and (3.3) for the critical flow rate $Q$
required to choke the system:
$Q$
required to choke the system:
 \begin{equation} \frac {Q}{Q^t_c} \sim \frac {\mathcal{F}}{\mathcal{A}} \ \mathrm{for} \ \mathcal{A} \gtrsim 1 \quad \text{and} \quad \frac {Q}{Q^d_c} \sim \mathcal{F}\mathcal{A} \ \mathrm{for} \ \mathcal{A} \lesssim 1, \end{equation}
respectively. Hence we expect $\mathcal{F}_c/\mathcal{A}$
to tend to a constant as
$\mathcal{F}_c/\mathcal{A}$
to tend to a constant as $\mathcal{A} \to \infty$
, and
$\mathcal{A} \to \infty$
, and $\mathcal{F}_c \mathcal{A}$
to tend to a constant as
$\mathcal{F}_c \mathcal{A}$
to tend to a constant as $\mathcal{A} \to 0$
, and obtain two different relations for the critical value of the dimensionless flow rate above which choking occurs, depending on the geometry of the elastomer:
$\mathcal{A} \to 0$
, and obtain two different relations for the critical value of the dimensionless flow rate above which choking occurs, depending on the geometry of the elastomer:
 \begin{equation} \mathcal{F}_c^t = \frac {6 \mu Q_c^t d}{\unicode{x03C0} G b_0^4} \sim \mathcal{A} \text{ for } \mathcal{A} \gtrsim 1, \quad \mathcal{F}_c^d = \frac {6 \mu Q_c^d d}{\unicode{x03C0} G b_0^4} \sim \frac {1}{\mathcal{A}} \text{ for } \mathcal{A} \lesssim 1, \end{equation}
in agreement with (3.1).
Finally, we show how the amplitude of bulging varies with dimensionless flow rate in both thick and thin blocks. In figure 7, we plot the magnitude of the deformation (characterised by the maximum bulge height) against $\mathcal{P} = \mathcal{F}(\mathcal{A} + \mathcal{A}^{-1})^{-1}$
. This parameter was chosen so that as
$\mathcal{P} = \mathcal{F}(\mathcal{A} + \mathcal{A}^{-1})^{-1}$
. This parameter was chosen so that as $\mathcal{A} \rightarrow \infty$
,
$\mathcal{A} \rightarrow \infty$
, $\mathcal{P} \rightarrow \mathcal{F}/\mathcal{A}$
; in this thin limit, the system chokes at a constant value
$\mathcal{P} \rightarrow \mathcal{F}/\mathcal{A}$
; in this thin limit, the system chokes at a constant value $\mathcal{P}^t_c = 1.4$
. As
$\mathcal{P}^t_c = 1.4$
. As $\mathcal{A} \rightarrow 0$
,
$\mathcal{A} \rightarrow 0$
, $\mathcal{P} \rightarrow \mathcal{F}\mathcal{A}$
; in this thick limit, the system chokes at a constant value
$\mathcal{P} \rightarrow \mathcal{F}\mathcal{A}$
; in this thick limit, the system chokes at a constant value $\mathcal{P}^d_c = 13.8$
. For all values of
$\mathcal{P}^d_c = 13.8$
. For all values of $\mathcal{A}$
and
$\mathcal{A}$
and $\mathcal{P}$
sufficiently far below the choking limits shown with markers in figure 7, the maximum bulge height depends linearly on
$\mathcal{P}$
sufficiently far below the choking limits shown with markers in figure 7, the maximum bulge height depends linearly on $\mathcal{P}$
. As demonstrated in figure 7, choking corresponds to each steady-solution branch turning back on itself at the critical value of
$\mathcal{P}$
. As demonstrated in figure 7, choking corresponds to each steady-solution branch turning back on itself at the critical value of $\mathcal{P}$
between the two thresholds given by
$\mathcal{P}$
between the two thresholds given by $\mathcal{P}^t_c$
and
$\mathcal{P}^t_c$
and $\mathcal{P}^d_c$
. These steady solutions were calculated using numerical continuation in the imposed flow rate and the injection pressure.
$\mathcal{P}^d_c$
. These steady solutions were calculated using numerical continuation in the imposed flow rate and the injection pressure.
The steady maximum bulge height $1-b_{min}$
as a function of the modified FSI parameter
$1-b_{min}$
as a function of the modified FSI parameter $\mathcal{P} = \mathcal{F}(\mathcal{A} + \mathcal{A}^{-1})^{-1}$
. Colours represent different aspect ratios (see legend). The markers show the choking limit for each
$\mathcal{P} = \mathcal{F}(\mathcal{A} + \mathcal{A}^{-1})^{-1}$
. Colours represent different aspect ratios (see legend). The markers show the choking limit for each $\mathcal{A}$
. All simulations are bounded by curves obtained for the two limits of the aspect ratio; thick blocks
$\mathcal{A}$
. All simulations are bounded by curves obtained for the two limits of the aspect ratio; thick blocks $\mathcal{A} \rightarrow 0$
, and thin slabs
$\mathcal{A} \rightarrow 0$
, and thin slabs $\mathcal{A} \rightarrow \infty$
, with the corresponding choking thresholds indicated using
$\mathcal{A} \rightarrow \infty$
, with the corresponding choking thresholds indicated using $\mathcal{P}^d_c$
and
$\mathcal{P}^d_c$
and $\mathcal{P}^t_c$
, respectively.
$\mathcal{P}^t_c$
, respectively.

4. Conclusion
A compliant Hele-Shaw cell, formed between a rigid wall and a soft wall made of a confined elastomer, can exhibit choking induced by a lubrication flow, regardless of the geometry of the elastic block even though the form of the flow-induced deformation depends sensitively on elastomer geometry. In thin slabs, a shear profile is established between the confining top wall and the elastomer surface which drives material to the cell rim where flow-induced bulging occurs locally. Yet thick blocks do not experience the confining influence of the top wall; instead, material is sheared within a vertical boundary layer of depth comparable to the cell radius, resulting in a global surface deformation profile, and suggesting that the gradient in normal pressure at the elastomer surface has a finite penetration depth that is imposed by elastomer geometry.
Our results demonstrate that choking occurs for flow rates above a critical threshold value that differs depending on the relative depth of the elastomer. However, for pressure-controlled flow, there is no critical pressure above which the system chokes; instead, as the injection pressure is ramped up, flow-induced deformation results in flow-rate limiting behaviour that is reminiscent of choking in collapsible tubes at finite Reynolds numbers (Heil Reference Heil1997).
Our findings may provide insight into the fluid–structure interactions (FSIs) that occur in geophysical applications that involve the injection of fluid into confined reservoirs under controlled pressures (Buscheck et al. Reference Buscheck, Sun, Chen, Hao, Wolery, Bourcier, Court, Celia, Friedmann and Aines2012). Sites such as In Salah in Algeria, for example, have been shut down due to fears of flow-induced deformation affecting storage-site integrity. This site is much smaller than its peers, so the confining caprock is closer to the injection site, rendering it more vulnerable to the effects of confinement. Similarly, albeit at a different length scale, the fabrication of some fluidic devices involves the confinement of an elastomer (typically PDMS) in between two rigid plates (Li et al. Reference Li, Juel, Box and Pihler-Puzović2023), and our work suggests that at high fluid pressures, the flow-induced deformation of a confined elastomer can alter the channel geometry which would affect flow resistances within the channels. Nonlinear pressure–flow relationships were found, for example, in microfluidics experiments by Gervais et al. (Reference Gervais, El-Ali, Günther and Jensen2006), who used channels with thick PDMS walls. As in our system, the elastic deformation in these microchannels is confined to a thin layer near the fluid–solid interface, and the characteristic length scale of the deformation is set by the width of the channel rather than the thickness of the block forming its wall (Wang & Christov Reference Wang and Christov2019). Finally, we highlight that biological soft tissue is often confined inside the body, typically by bone or other hard tissue. For example, the interaction between brain tissue and cerebrospinal fluid in the cranium (Linninger et al. Reference Linninger, Xenos, Sweetman, Ponkshe, Guo and Penn2009) leads to a confined FSI. Our observations suggest that the flow-induced deformation of confined tissue in the human body could indeed affect the shape and flow resistance of physiological fluid-conveying vessels, and we hope that this serves as inspiration for further research into confined FSIs in physiological flows.
Funding
F.B. would like to acknowledge the Royal Society (URF/R1/211730).
Declaration of interests
The authors report no conflict of interest.


 Open access