


Food environments are important influencers of food choice and behaviour. At the most basic level, what foods are available dictates what one can eat. Beyond simple availability, other aspects of the food environment interact with individual factors to influence food decision-making and diet quality(1,Reference Turner, Aggarwal and Walls2) . Price and affordability, convenience, quality and promotion have all been shown to have impacts on consumer food choices(Reference Downs and Demmler3). This is relevant for adolescents who are at a critical time of cognitive and social development and are susceptible to outside influences, including from peers, social media and marketing(Reference Neufeld, Andrade and Ballonoff Suleiman4). Moreover, adolescents are gaining increased autonomy and power over life decisions, including those around food(Reference Neufeld, Andrade and Ballonoff Suleiman4). Factors such as distance to vendors, branding and advertising, taste, convenience, time, visual appeal, price/value for money, portion size, peer influence and affordability all impact adolescent food choices(Reference Larson and Story5–Reference Fleming, De Oliveira and Sharma7). However, there is little research in low- and middle-income country settings, especially among adolescents(Reference Devine, Hill and Gallagher8,Reference Raghoebar, Mesch and Gulikers9) . For example, food safety and hygiene has emerged as a factor that may be uniquely important for adolescents in these contexts(Reference Karanja, Ickowitz and Stadlmayr10). Poor dietary intake during adolescence can have significant impacts on health and development, including risk of anaemia, stunting, overweight/obesity and cognitive development(Reference Norris, Frongillo and Black11,Reference Ferrara, Coppola and Coppola12) . Further, consistent evidence has shown that dietary habits during adolescence are significant predictors of diet quality and non-communicable disease (NCD) risk in adulthood(Reference Wu, Wu and Ishida13–Reference Raphael16). In Ghana, adolescent diet quality is low, with one study among adolescents aged 10–14 years estimating as many as 84 % of adolescents having inadequate dietary diversity(Reference Wiafe, Apprey and Annan17). Nutritional and micronutrient status for adolescents is also challenging with greater than 25 % of girls aged 15–19 years having anaemia, 57 % having folate deficiency, 6·2 % being stunted and over 20 % having overweight with even higher prevalences varying across region(Reference Azupogo, Abizari and Aurino18–Reference Akowuah and Kobia-Acquah20).
Globally, approximately 84 % of adolescents attend school. Among these growing numbers of school-going children, a large portion of their time is spent at school and in the surrounding environment(21,Reference Arthur, Mishra and Zenengeya22) . In Ghana, 47 % completed junior high schools (JHS) (usually aged 11–15 years), yet this age group does not have access to the national school feeding programme, which covers only primary school students. Thus, all food consumed during the school day must be brought from home or purchased from within the school food environment. In a study of Ghanaian adolescents, 86 % bought food while at school and rarely brought it from home(Reference Atsreh Buxton23). Similarly, another study conducted in the Ga East Municipality in Ghana also revealed that 78 % of break time purchases were made from food vendors within the school compound(Reference Ogum-Alangea, Aryeetey and Gray24). Understanding the school food environment is essential to understanding the many factors that influence adolescent food choices and dietary behaviour.
In high-income country programmes, school meals often have better diversity compared to meals brought from home. In the absence of such a programme, it is likely food and meals purchased from vendors at school may be of worse quality than meals brought from home(Reference Everitt, Engler-Stringer and Martin25,Reference Smith, Mojduszka and Chen26) . Eating food prepared outside of the home (i.e., food from a restaurant) has been associated with increased energy, fat, sugar, sodium and sugar-sweetened beverage consumption and decreased consumption of certain micronutrients, fibre, fruits and vegetables(Reference Gesteiro, García-Carro and Aparicio-Ugarriza27,Reference Lachat, Nago and Verstraeten28) . School policies may offer an avenue to regulate the quality of food sold on the school premises. In Ghana, national regulations require food vendors to undergo regular health screenings and obtain a certificate to sell; however, monitoring and enforcement is lacking(29–31). Local municipalities may have additional policies, but these may not focus on nutritional quality or food safety.
This study aimed to describe the characteristics (type, foods and hygiene) of food vendors who sell on and near JHSs in Cape Coast, Ghana, and to assess whether there are differences in characteristics by location. Additionally, we explore relationships between diet quality and where students procure their food during the day.
Methods
Study area, school selection and participant sampling
This study took place in the Cape Coast metropolitan area in the Central Region of Ghana between October 2023 and February 2024. Eight public JHS were selected for inclusion in the study. Convenience sampling was applied to select schools representing different geographical and socio-economic areas of the city. A 0·25-km radius (deemed the likely distance a student would travel during school break time for food based on local knowledge) was drawn around each school, and every vendor selling food and/or beverages within the radius, including those selling on the school campus, were surveyed.
Students who were between 11 and 17 years of age and currently enrolled at one of the selected schools in the JHS level were considered for inclusion. They had to be attending their current school for at least 1 month and had to live the majority of the year in the Cape Coast Metropolitan area. Children who had a physical or mental illness or disability that would impact their ability to participate or regular diet were excluded. We targeted enrolling a random selection of twenty-five adolescents from all eligible students from each school.
Data collection and variable definitions
Teams of two data collectors travelled the entire area of the 0·25-km radius around each school during a single weekday when school was in session. Data collectors worked in pairs to complete structured observations of all food vendors within the defined catchment areas. Observations began at 11.00, just before students started their lunch break, and were completed by 14.00, after field workers covered the entire area. Structured observation forms were developed by the research team to assess the vendor characteristics, including the type of vendor, the food sold and the food safety and hygiene practices. All assessments were done based on observation only, including all hygiene and safety assessments. Hygiene and safety assessments were modelled on the FAO street food vendor field survey for Ghana(Reference Marras, Bendech and Laar32). Only practices that could be assessed via observation were included. During the observation process, each vendor was classified by vendor type. We defined school campus vendors as those that were physically located on the property of the school campus, regardless of whether they were authorised by the school to be present or not. All other vendors were considered off-campus vendors. A pre-developed list of vendor types and foods available was created by a team of local researchers. Definitions of each were developed by group consensus and refined after field testing. Schools were defined by urban/peri-urban status based on the local investigator knowledge of the schools and areas which they serve. Each school was also categorised based on the primary income-generating activity of the community as a proxy measure for the income level of the community based on local investigator knowledge, consultation with regional educational officials and discussions with parents and community leaders. Urbanicity and income were selected as variables of interest to better understand how school food environments look in different settings and what factors or challenges might be particularly relevant in different school settings. While nutrition programmes cannot necessarily alter these factors, they can help inform how programmes are designed and targeted and how food environments and vendors are managed.
Adolescent dietary intake was assessed using the validated Diet Quality Questionnaire for Ghana(33) which asks twenty-nine questions about sentinel foods consumed in the previous day. All questions were read aloud to adolescents by data collectors in either English, Twi or Fante, depending on the adolescents’ preference. The responses to the questionnaire were used to estimate four diet quality indicators for each child: food group diversity score (FGDS), all-5, NCD-protect (NCD-P) and NCD-risk (NCD-R) scores(34).
Adolescents responded to a survey assessing their primary method of food procurement at school. Adolescents were asked a single question, ‘When you eat food while at school, where do you most often get this food?’. Adolescents could select from options of ‘bring it from home’, ‘purchase it while at school from vendors on the school campus’, ‘purchase it while at school from food vendors around the school or in the surrounding community’ or ‘other’.
Statistical analysis
A statistical analysis plan was developed prior to beginning analysis and posted publicly to Open Science Framework (https://osf.io/bwtc8). We described vendor characteristics of vendor type, foods sold, and food safety and hygiene practices overall and by urban status, primary income-generating activity of the community, and on-/off-school campus vendors.
For vendor-level analyses of categorical/dichotomous outcomes (vendor types, foods sold, and food hygiene and safety practices), we estimated prevalence ratios using modified Poisson regression with robust standard errors to account for clustering by school to test differences by urban status, primary income-generating activity of the community and whether a vendor was on- or off-campus. As this was an exploratory analysis, we used minimally adjusted models that only accounted for clustering by school. We present results below as prevalences with the 95 % CI and P-value.
We separately conducted child-level analyses to test the relationship between the primary method of food acquisition and diet quality outcomes. We tested the primary food procurement category as a predictor of the continuous food group diversity score, NCD-protect and NCD-risk scores using mixed-effects linear regression. For the binary all-5 indicator, we used modified Poisson regression with robust standard errors. All regressions were calculated both unadjusted and adjusted for pre-selected variables which were thought to potentially influence the relationship including parental education, household wealth quintile (categorical variable calculated based on asset ownership), household size (total number of people living in the household), adolescent sex, adolescent age in years, parental occupation, religion and ethnicity as fixed effects. We used a two-side superiority hypothesis testing framework with P-value less than 0·05 indicating significance. All analyses were conducted in Stata v.17 (StataCorp. 2021. Stata Statistical Software: Release 17. StataCorp LLC.).
Results
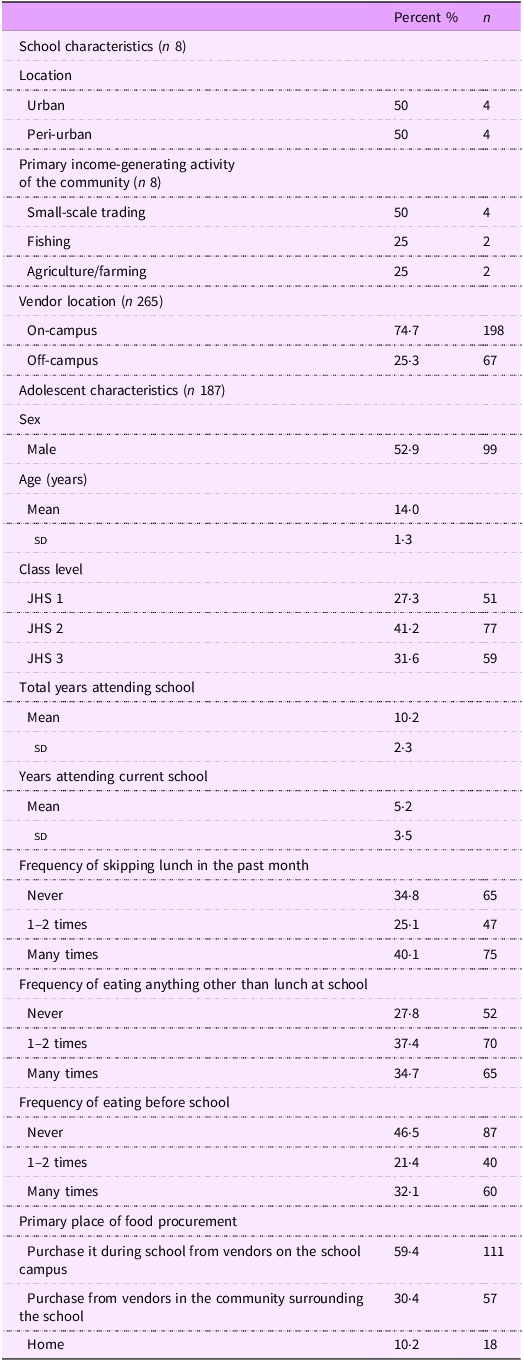
Four of the selected schools were located in urban communities within the metropolitan area, with the remaining four being located in peri-urban communities (Table 1). Two schools were in communities whose primary income-generating activity was fishing, two were primarily agriculture and four were primarily small-scale trading. Most adolescents were male (52·8 %) with an average age of 14·0 years.
Demographic characteristics of included participants and schools

JHS, junior high schools.
Vendor types
We identified a total of 265 food/beverage vendors across the eight schools for a mean of 33 vendors within a 0·25 km radius of each school (range: 22–46 vendors per school). 25·3 % of all the vendors sold food on the school campus grounds, corresponding to a mean of 8·4 school food vendors per school. Of all vendors, 30·6 % used tables or stalls and 25·7 % were stores or grocery stores. The remaining vendors included fixed kiosks (8·7 %), mobile hawkers (5·7 %), chop bars (fast/take-out-only restaurant or stall) (2·6 %) and restaurants (1·5 %) (Figure 1).
Percent of vendors in each vendor type category across all schools, by urban status and by community income activity.
*Significantly different at P < 0·05.

Foods sold
Cooked/prepared dishes (foods that were cooked/prepared by the vendor and ready to eat, e.g. banku, chicken, fried plantain, stewed beans (see full list in online supplementary material, Supplemental Table 1)) were the most commonly sold foods (37·4 % of vendors). Homemade snacks (smaller food items made by the vendor locally, e.g. spring rolls, bread, meat pie) (29·8 %) and branded industrial snacks (foods that are prepared by food companies and sealed and packaged by the company before sale, e.g. cookies, candy, popcorn, chips) (30·2 %) were also frequently sold along with branded industrial beverages (beverages that are prepared by food companies and sealed and packaged by the company before sale, e.g. carbonated soft drinks, juice drinks, energy drinks) (30·9 %). Very few vendors were identified as selling fresh fruits (10·6 %), fresh prepared vegetables (vegetables that have been modified so they are ready to eat, but not cooked, e.g. salad, coleslaw) (2·6 %) and fresh unprepared whole vegetables (e.g., tomato, cabbage) (11·3 %) (Figure 2).
Percent of vendors selling food categories across all schools, by urban status, by community income activity and by on- and off-campus vendors.
*Significantly different at P < 0·05.
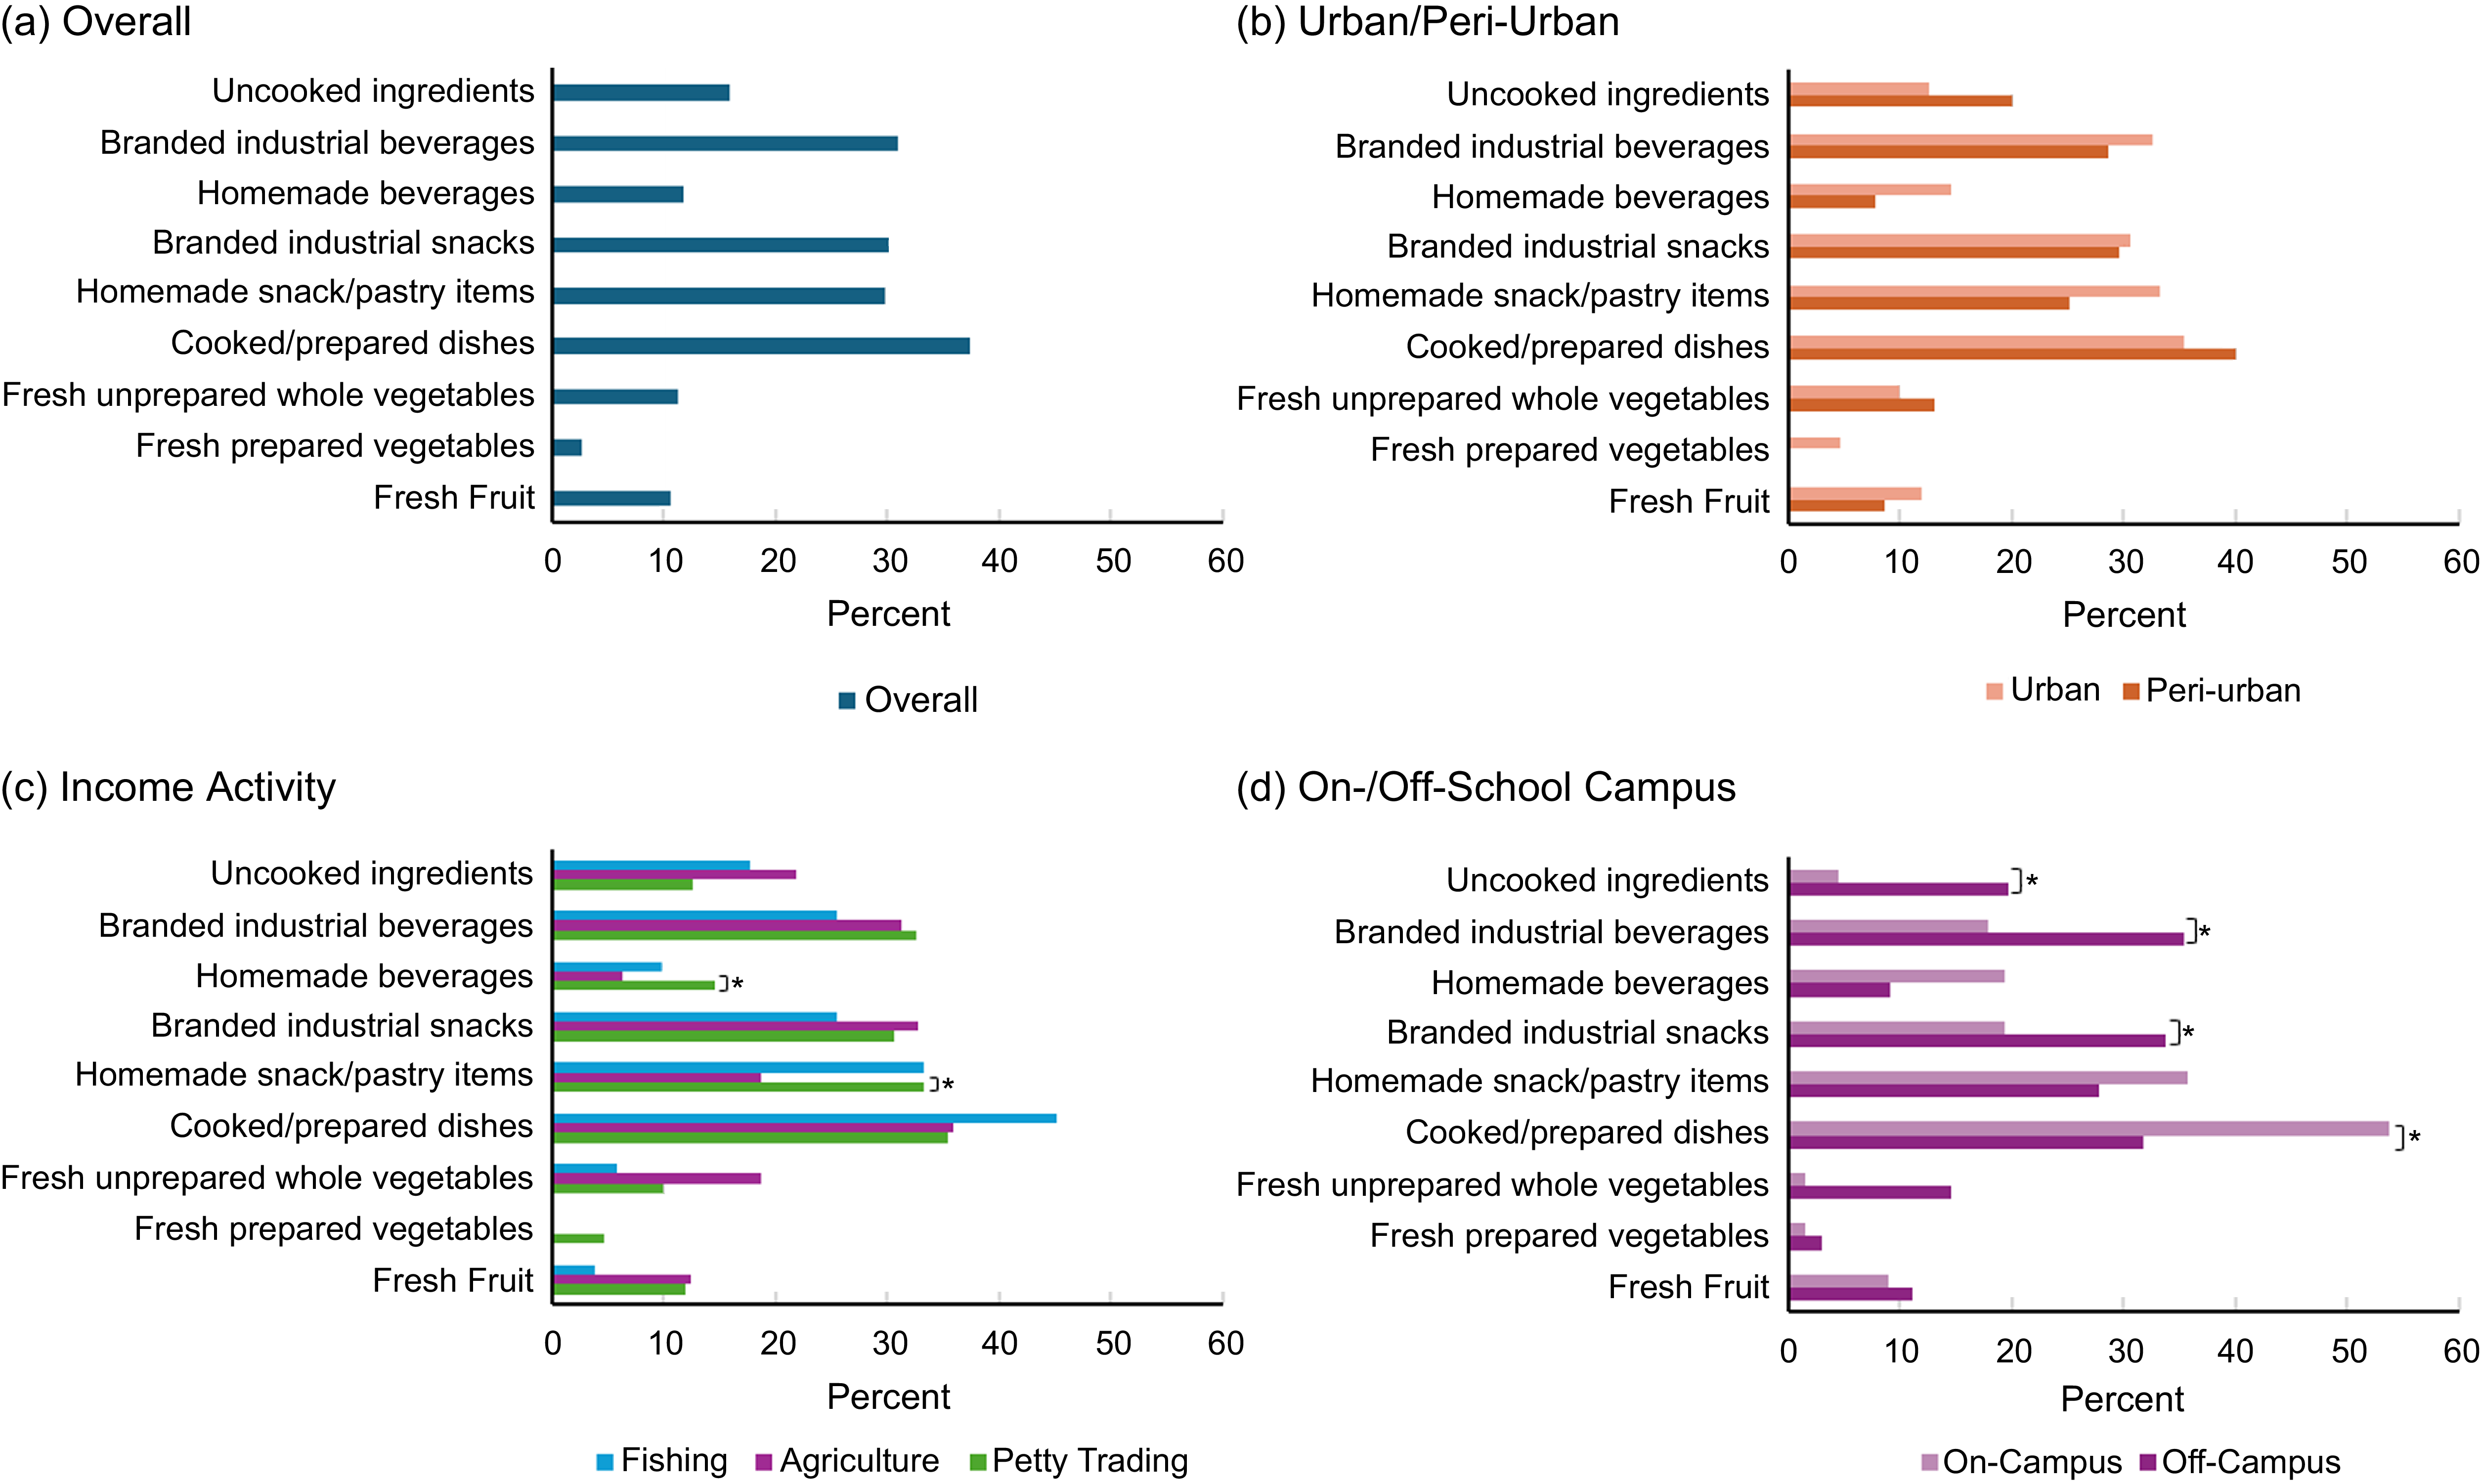
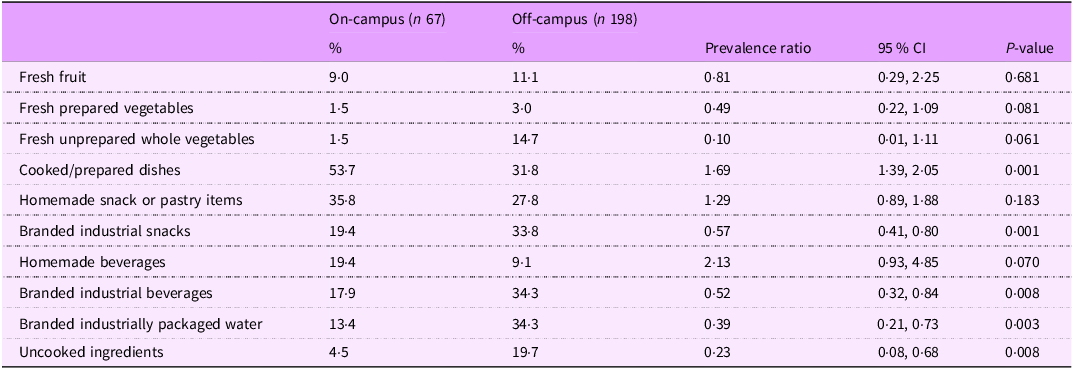
There were several significant differences between the types of foods sold among vendors on and off the school campus (Table 2). Vendors on the school campus had a lower likelihood of selling branded industrial snacks (19·4 % v. 33·8 %), branded industrial beverages (17·9 % v. 34·3 %), branded industrially packaged water (bottled and sachet water) (13·4 % v. 34·3 %) and uncooked ingredients (4·5 % v. 19·7 %) compared to off-campus vendors. On-campus vendors were also more likely than off-campus vendors to sell cooked/prepared dishes (53·7 % v. 31·8 %).
Percentage of vendors selling each food category by on-campus and off-campus vendors

We further explored which foods within the categories explained the differences between on- and off-campus vendors (see online supplementary material, Supplemental Table 1). For cooked/prepared dishes, we found the on-campus vendors were more likely to sell sausage (17·9 % v. 8·6 %), plain white rice (14·9 % v. 8·1 %), waakye (a beans/rice dish) (9·0 % v. 5·6 %) and fried plantain (9·0 % v. 2·5 %), as compared to the off-campus vendors. On-campus vendors were less likely to sell branded industrial snacks as compared to the off-campus vendors, including biscuits/cookies (17·9 % v. 30·8 %), sweets (13·4 % v. 30·3 %), breads (6·0 % v. 20·7 %) and chips (4·5 % v. 11·6 %). On-school campus vendors were also less likely to sell carbonated soft drinks (14·9 % v. 34·3 %), energy drinks (6·0 % v. 33·3 %), fruit juice drinks (7·5 % v. 26·3 %), milk-based beverages (7·5 % v. 21·2 %), chocolate beverages (3·0 % v. 21·7 %), bottled water (7·5 % v. 33·3 %) and sachet water (11·9 % v. 32·8 %) compared to the off-campus vendors.
The types of foods sold did not differ in prevalence by urban v. peri-urban vendors or vendors in the different income-generating communities, except for vendors in agricultural communities who were less likely to sell homemade snacks/pastries (18·8 % v. 33·3 %) (0·56 (0·39, 0·81)) and homemade beverages (6·3 % v. 14·7 %) (0·43 (0·24, 0·76)) as compared to vendors in trading communities (Figure 2).
Food hygiene and safety practices
Overall, vendors were only meeting 38·8 % of the assessed food safety practices applicable to them. The most common practices (> 70 % for whom the practice was applicable) were serving hot food at hot temperatures (based on visual observation), serving prepared foods with tongs or other utensils, protecting food from insects and dust, and serving unpackaged foods away from the ground and gutter (Figure 3). Almost all vendors were appropriately storing trash (96·6 % of vendors). However, having water (15·2 %) and soap (6·4 %) for washing dishes and hands and wearing gloves (4·2 %) was very uncommon. Similarly, use of clean cooking fuels (biogas, natural gas, liquefied petroleum gas (LPG) and alcohol fuels such as ethanol)(35) (24·4 %) was low.
Number of vendors meeting each food safety practice across all schools, by urban status, by community income activity and by on- and off-campus vendors.
The practices were applicable to the following vendor types- all vendors (n 265): appropriate trash storage is used, soap/hand sanitiser is available, water is available for washing; applicable to vendors selling unpackaged foods (n 125): using serving utensils, wearing clean gloves; applicable to vendors selling unpackaged or raw/fresh foods (n 150): food is sold near a gutter, food is sold near the ground, food is protected from dust and food is protected from insects; applicable to vendors selling hot cooked foods (n 99): hot food is served hot; applicable to vendors using cooking fuel (n 86): using clean cooking fuel (clean cooking fuels include biogas, natural gas, liquefied petroleum gas (LPG) and alcohol fuels including ethanol)(35); vendors selling raw meat or fish (n 15): raw meat/fish is kept cool.
*Significantly different at P < 0·05.
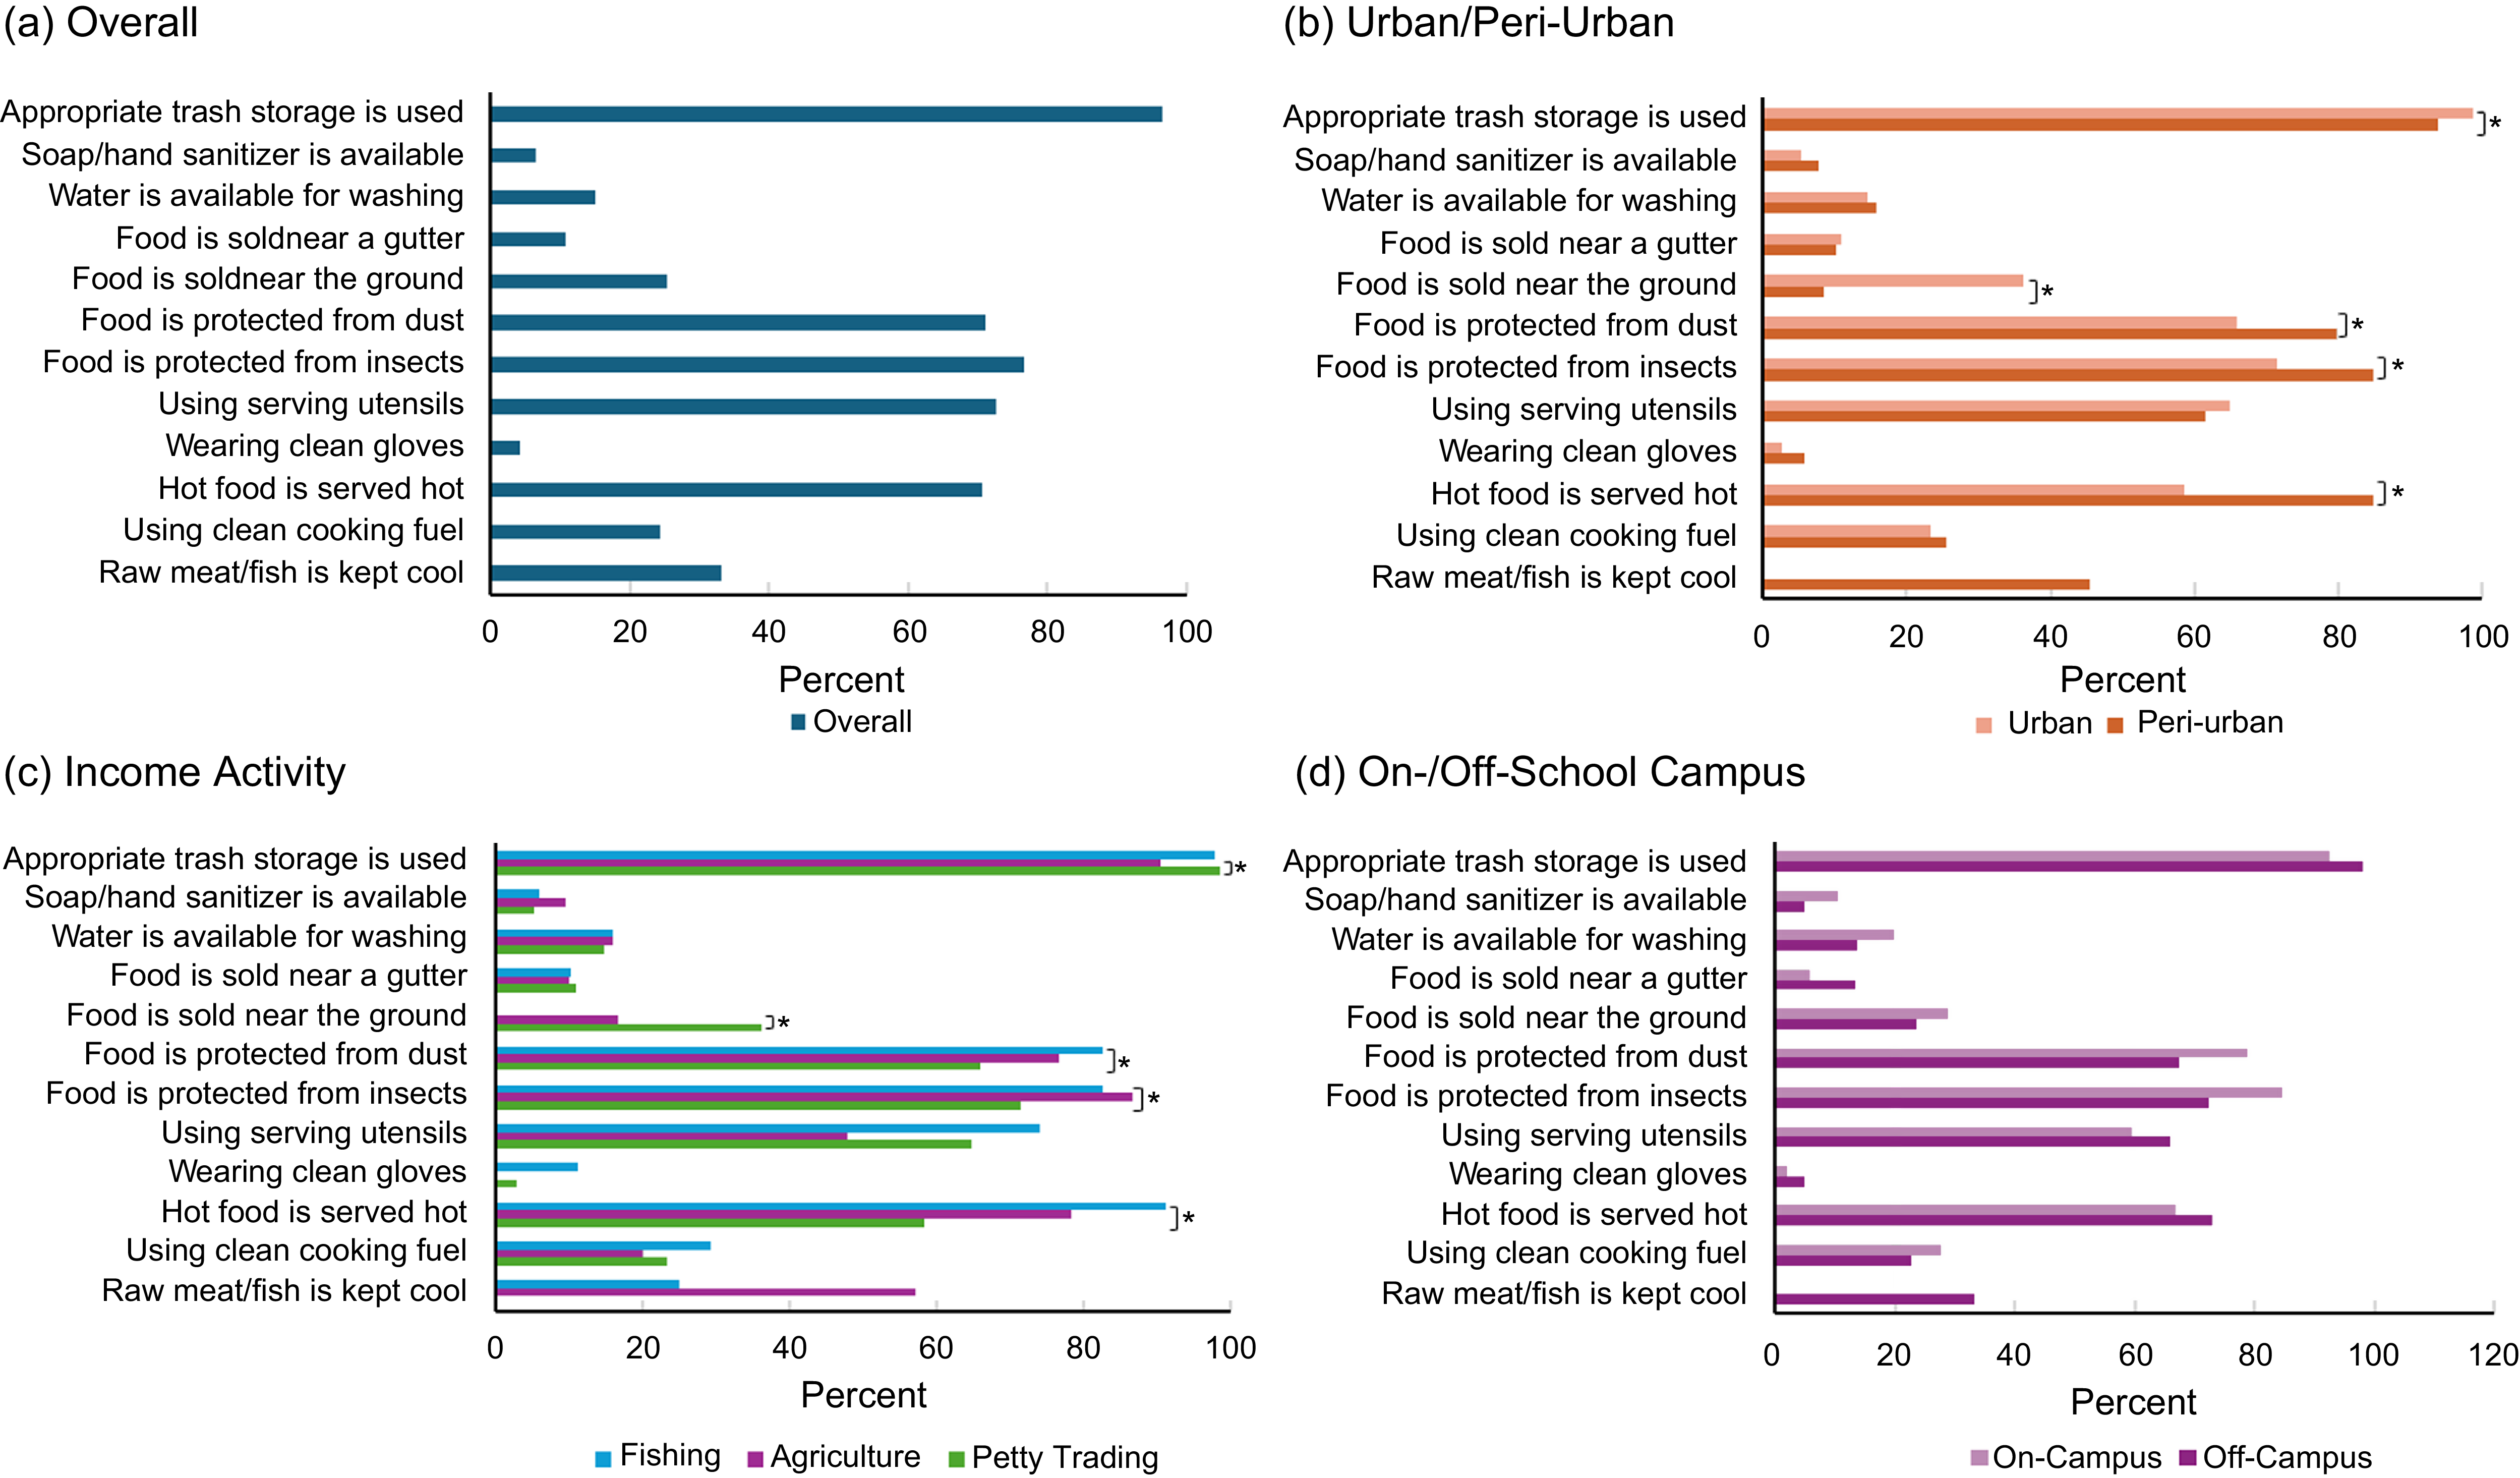
None of the food safety practices differed significantly between on- and off-campus vendors. Urban vendors had a lower likelihood of serving hot food at a hot temperature (58·5 % v. 84·8 %) (0·69 (0·57, 0·84)), protecting food from dust (65·9 % v. 79·7 %) (0·83 (0·69, 0·99)) and protecting food from insects (71·4 % v. 84·8 %) (0·84 (0·71, 0·99)) as compared to vendors in peri-urban settings. Urban vendors were also more likely to sell unpackaged foods close to the ground (36·3 % v. 8·5 %) (4·28 (1·18, 15·56)) and had appropriate trash storage (98·7 % v. 93·9 %) (1·05 (1·00, 1·10)) as compared to the peri-urban vendors.
Most food safety practices were implemented by a similar percentage of vendors across the different community income-generating activities, with a few exceptions. Vendors in agricultural communities were less likely to sell food close to the ground and have appropriate trash storage compared to vendors in trading communities. Vendors in fishing communities were also more likely to serve hot food at a hot food temperature, protect food from dust and protect food from insects compared to vendors in trading communities (Figure 3).
Relationship between primary place of food procurement and diet quality
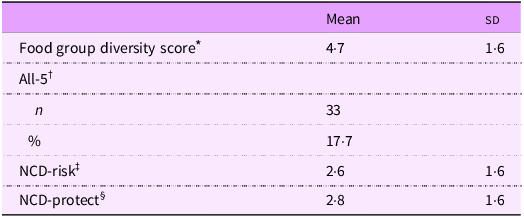
Overall, the mean (sd) food group diversity score among adolescents was 4·7 (sd 1·6) out of 10, NCD-protect score was 2·8 (sd 1·6) out of 9 and NCD-risk score was 2·6 (sd 1·6) out of 9 (Table 3). A total of 17·7 % of children consumed all five food groups in the previous day. The majority of adolescents (59·4 %) reported that their primary place to procure meals during school was on the school campus, while 30·5 % purchased food from vendors around the school or in the surrounding community, and only 10·2 % reported bringing food from home. We did not find any significant relationships between the primary place of food procurement (at-home, on-campus and off-campus) and any of the diet quality indicators among adolescents attending JHS in adjusted models. In sensitivity analyses, these results were similar when comparing those who purchase at all v. those who bring from home and just comparing on-campus purchasers v. off-campus purchasers.
Diet quality indicators of adolescents (n 187)

NCD, non-communicable disease.
* Food group diversity score is out of 10 indicating if the following food groups were consumed in the previous 24 h: grains, white roots and tubers, and plantains; pulses; nuts and seeds; dairy products; meat, poultry and fish; eggs; dark green leafy vegetables; other vitamin A-rich fruits and vegetables; other vegetables; and other fruits.
† All-5 is a binary score indicating if all of the following five food groups were consumed in the previous 24 h: fruits; vegetables; pulses, nuts, or seeds; animal-source foods; and starchy staples.
‡ The NCD-risk score reflects adherence to the global dietary recommendations on the following nine components of the diet to limit or avoid: soft drinks (sodas); baked/grain-based sweets; other sweets; processed meat; unprocessed red meat; deep-fried food; fast food and instant noodles; and packaged ultra-processed salty snacks.
§ The NCD-protect score reflects adherence to global dietary recommendations on the following nine healthy components of the diet: whole grains; pulses; nuts and seeds; vitamin A-rich orange vegetables; dark green leafy vegetables; other vegetables; vitamin A-rich fruits; citrus; and other fruits.
Discussion
These findings describe what foods were available to adolescents in their school food environments and the food safety and hygiene practices of those selling these foods. Importantly, the foods sold differed significantly by on- and off-campus vendors, with a lower prevalence of industrially branded foods and beverages available on-campus. This is notable as most adolescents reported that the primary place to purchase foods during the school day was from on-campus vendors. However, despite this, we did not find any differences in diet quality by place of primary food procurement (primarily on-campus v. off-campus purchasers). This may have important implications for policies that shape school food environments and vendors and the consumption of certain foods by adolescents while at school. There were relatively few differences between the types of vendors and types of food sold between different types of communities. Food safety and hygiene practices were highly variable, with no differences between on- and off-campus vendors, but some differences by type of community.
The dietary assessment found relatively low diet quality among the adolescents in the sample. Particularly, low diet diversity (mean 4·7 out of 10) and low consumption of foods recommended for regular consumption, including fruits and vitamin A-rich vegetables, were found. This mirrors similar trends seen for adolescents across low- and middle-income countries(Reference Keats, Rappaport and Jain36,Reference Madzorera, Bromage and Mwanyika-Sando37) . Foods such as fresh fruits and vegetables and prepared dishes with animal-source foods were relatively uncommon in our observation which was also seen in adolescent diets. Other factors beyond availability, for example, price and marketing, which were not measured in this study, may also be influencing the lack of purchase/consumption of these foods or increased purchase of other foods. While the results from this analysis suggest foods such as packaged snacks and beverages, which are often recommended for limited consumption, were sold by fewer on-campus than off-campus vendors, there was no relationship with the prevalence of fruits or vegetables sales. Food environment factors such as availability, promotion, access and affordability of foods like fruits and vegetables within the school food environment may be needed to increase consumption among adolescents at school.
There were significant differences between the types of foods sold by on- and off-campus vendors. On-campus vendors were less likely to sell branded industrial snacks and beverages, but there were no differences in percent of vendors selling homemade snacks and beverages. This may be because the majority of schools in our sample reported restrictions on these types of foods from being sold on the school premises. These school-level policies regarding the sale of such items may have been effective. More research is needed to confirm if these policies are in fact effective and, if so, could be expanded to improve the types of foods available on school campuses.
Branded industrial snacks and beverages can be calorie-dense, nutrient-poor and high in sugar, saturated fats and sodium,(Reference Hess, Rao and Slavin38), and they may be of poorer nutritional quality than homemade foods(Reference Gupta, Hawk and Aggarwal39,Reference Bernal, Roman and Klerks40) . Because of the branding and packaging of these foods, they may also be easily recognisable; therefore, school officials may be able to more easily regulate their sales. The nutrient value of homemade foods and beverages can vary widely, with some potentially adding beneficial contributions to the diet and others being calorie-dense, with little nutritional value. It is important to consider the role of snacks in the diet of adolescents in Ghana, a country undergoing the nutrition transition. In low- and middle-income country settings, snacks can be a significant contributor of calories for adolescents(Reference Keats, Rappaport and Shah41). These foods may therefore be a hygienically safe, affordable source of food that provide calories and nutrients in cases of nutrient insufficiency, which may be the case in this population where many students reported skipping lunch frequently. On the other hand, some of these foods can contribute to excessive energy, salt, fat and sugar intake and possibly contribute to the NCD-risk and burden of overweight and obesity. Thus, the nutritional quality of snack/beverage items and the role they serve for the student population should be considered when determining what can be sold on school campuses.
Despite a lower prevalence among off-campus vendors than on-campus vendors, nearly 20 % of on-campus vendors and more than 30 % of off-campus vendors in close proximity to the schools did sell these products. Therefore, adolescent exposure to and opportunities to purchase these items remains(Reference Amevinya, Vandevijvere and Kelly42). It is likely adolescents continue to purchase these items before or after school, as they trek to school and back home. Future research should also consider exposure to marketing in the school food environments. Another recommendation for future studies is to conduct structured observations during breaktimes, early morning and after-school hours to assess foods purchased and potential factors that lead to such food choices (e.g. skipping breakfast at home, peer influence, etc.). Policies that extend beyond school property may be necessary to truly transform school food environments and reduce exposures and opportunities for purchase of nutrient-poor foods(Reference Downs and Demmler3,Reference Pineda, Bascunan and Sassi43) .
Cooked and prepared dishes, including waakye, sausage, fried plantains and rice, were sold more often by on-campus vendors than off-campus vendors. These items can provide filling meals to adolescents during the day, but their quality and nutritional value can also vary. Foods like waakye can be a nutrient-rich meal. However, sausage is a processed meat, a category generally recommended to avoid for regular consumption(44). Plantains may offer some nutritional benefits, but the fried preparation is not as beneficial as roasting or boiling. White rice is a filling food that may keep students satisfied throughout the day but is not very nutrient-dense. However, when consumed in large quantities as a staple food, rice can contribute a percentage of intake for some important nutrients. More guidance is needed to inform school authorities and food vendors/caterers on what foods and local dishes can be prepared or how these foods can be consumed to better align with dietary guidelines. Ghana recently published their first food-based dietary guidelines, offering an opportunity to align foods offered at schools with recommended local dietary patterns(45). Costs are also important considerations, given that a high proportion of adolescents experience food insecurity and may have difficulties purchasing foods during the day(Reference Reynolds, Nsiah‐Asamoah and Okronipa46). Since school food sales are primarily regulated at the school level, guidance and more training for school health and nutrition coordinators are needed to empower schools to promote nutrient-dense foods aligned with dietary guidelines.
Despite some differences in the types of foods sold on- and off-campus, we did not find any differences in the students’ diet quality on the basis of where they primarily purchased their food. The differences were small between those who obtained their food from on- and off-campus vendors. However, studies from other settings show that school food programmes can make valuable contributions to overall diet quality(Reference Forrestal, Potamites and Guthrie47–Reference Smith49). Our study sample had a very small number of students bringing food from home, which may have impacted results. Students may also not strictly obtain food from the same place every day. They may use different methods or may use multiple methods on a single day. Additionally, the DQQ is a food group level assessment and limited in its ability to assess individual diets. A longer-term or more detailed diet assessment such as through a 24-h dietary recall with a larger sample size may have been able to detect differences in diet that are not captured by the DQQ. However, these findings combined with the above findings suggest that overall larger and specific food environment changes are needed to offer nutritionally dense and preferred foods to adolescents while at school. Small changes on the school campus are likely insufficient for dietary change, but rather environment-wide (both on- and off-campus) changes that alter the hygiene and availability of foods, as well as other dimensions such as cost and food promotion, are needed.
Food hygiene and safety are likely important considerations for adolescent food choice(Reference Karanja, Ickowitz and Stadlmayr10). In this sample, vendors were meeting less than half of applicable practices, indicating a great need for improvement overall. Those practices commonly implemented included some that are relatively cheap and easy to implement, including protecting foods from flies and dust, storing trash, using serving utensils and serving hot foods at hot temperatures. These practices are also usually clearly visible to a potential consumer. However, water and soap for washing, selling away from the ground and gutter and the use of clean cooking fuels were less frequently practised. These practices may cost more, require more knowledge or necessitate infrastructure changes. For example, careful site selection would be needed to identify clean locations away from gutters with easy access to clean water. Additionally, customers may not be as keenly aware of the type of cooking fuel or the washing of hands and cooking equipment resulting in little incentive for vendors to invest time and/or money in the necessary changes for these practices. Thus, development and enforcement of policies may be required to bring about these changes.
This study offers a comprehensive, objective assessment of the food environments in which adolescents attending JHS in Cape Coast interact on a regular basis. We used a structured food environment observation to capture all observable food vendor characteristics. We used a large radius that captured the likely daily interactions between students and their environments and included all the vendors in the area. While some vendors were mobile, most vendors were consistently in the area on school days at break time. We considered dimensions of food hygiene and safety, which have been relatively under-described in school food environments in low- and middle-income countries despite being an important influencer of food choice in these contexts. However, this study has some limitations. It is a descriptive, observational study and did not assess students’ purchasing patterns or link specific vendors to specific students. We also did not assess other important food environment characteristics that likely influence choice, including price and marketing. Further, we did not assess size or sales volume of each vendor, which may have important implications for the impact vendor characteristics have on students. The question assessing food procurement was only a single question about usual patterns and may have not captured nuances or day-to-day variations in food procurement behaviours.
Conclusion
This study finds that JHS food vendors in Cape Coast, Ghana, offer a variety of foods and practise some important food hygiene and safety measures. However, there is a need for a greater emphasis on dietary diversity and nutritional quality of the foods available for students, as well as improved food safety and hygiene. School policies offer a promising avenue to shape food availability and potentially consumption of safe, diverse, nutritionally dense foods during school. Infrastructure development to improve access to water, handwashing facilities and clean places to prepare food may also be beneficial. School food environments can be reimagined to better support student needs and have meaningful impacts on adolescent diets.
Supplementary material
For supplementary material accompanying this paper visit https://doi.org/10.1017/S1368980025101596.
Acknowledgements
The authors acknowledge the data collection work of the project field team including Nicholas Russell, Madina Habib, Safianu Osman, Esther Darkwa Entwi, Alvin Isaac Anane and Emil Amenu Kafui. The authors also thank Dr. Reina Engle-Stone and Dr. Isabel Madzorera for their review and feedback on this manuscript.
Financial support
This project was supported by the Office of Behavioral and Social Sciences Research (OBSSR) and the Fogarty International Center (FIC) of the National Institutes of Health (NIH) under Award Number D43TW009343. Additional support was provided by the University of California Global Health Institute (UCGHI), the US Student Fulbright Program, sponsored by the US Department of State, and the Corrine L. Rustici endowment at UC Davis. The content is solely the responsibility of the authors and does not necessarily represent the official views of the NIH, UCGHI, Fulbright or the US Department of State. The sponsors were not involved in any component of the study including study design, collection, analysis and interpretation of data, or writing of the report and provided no restrictions regarding publication.
Conflict of interest
There are no conflicts of interest.
Authorship
E.C.R., C.N-A., H.O. and C.P.S. designed the research study. E.C.R. and C.N-A. conducted the study. E.C.R. and C.D.A. analysed the data. E.C.R. wrote the paper with support from C.P.S. E.C.R. and C.P.S. have primary responsibility for the final content. All authors have read and approved the final manuscript.
Ethics of human subject participation
This study was conducted according to the guidelines laid down in the Declaration of Helsinki, and all procedures involving research study participants were approved by the University of Cape Coast, University of California, Davis, and Oklahoma State University institutional review boards. Written informed consent was obtained from all subjects.
Ethical approval for this research was obtained from the University of Cape Coast Institutional Review Board (IRB), the University of California, Davis IRB, and the Oklahoma State University IRB. The project and selection of schools was also approved by the Cape Coast Metro Director of Education and the Metro School Health and Education Program coordinator for the Ghana Education Service. All schools’ head teachers agreed to participate before any students were approached. Parents provided written informed consent for their child’s participation, and adolescents provided written informed assent.


 Open access