


1 Introduction
A high temporal contrast on the nano- and picosecond time scales has become an important laser parameter since the development of chirped pulse amplification (CPA)-based[
Reference Strickland and Mourou
1
] laser systems. With the development of the latest generation of petawatt-class lasers, which can reach peak intensities in the focal plane of up to ${10}^{23}$
W/cm
${10}^{23}$
W/cm ${}^2$
[
Reference Yoon, Kim, Choi, Sung, Lee, Lee and Nam
2
], this intensity-increasing trend continues, and the control and increase of the temporal contrast have gained more significance than ever before. Although there are experimental schemes that may exploit a given contrast level to their benefit, for example, by optimizing the target thickness and therefore the pre-plasma conditions, the ultimate goal is still to create an absolutely clean pulse that can be manipulated as desired. For this, every contrast-degrading feature, such as amplified spontaneous emission (ASE), pre-pulses and the ps-pedestal, must be either cleaned or completely avoided.
${}^2$
[
Reference Yoon, Kim, Choi, Sung, Lee, Lee and Nam
2
], this intensity-increasing trend continues, and the control and increase of the temporal contrast have gained more significance than ever before. Although there are experimental schemes that may exploit a given contrast level to their benefit, for example, by optimizing the target thickness and therefore the pre-plasma conditions, the ultimate goal is still to create an absolutely clean pulse that can be manipulated as desired. For this, every contrast-degrading feature, such as amplified spontaneous emission (ASE), pre-pulses and the ps-pedestal, must be either cleaned or completely avoided.
With respect to cleaning mechanisms, we can divide the methods into low- and high-energy methods. The former are used in the front-end of the system, whereas the latter are used after the main amplifier and recompression of the pulse. Popular methods on the low-energy side are cross-polarized wave generation (XPW)[ Reference Jullien, Albert, Burgy, Hamoniaux, Rousseau, Chambaret, Augé-Rochereau, Chériaux, Etchepare, Minkovski and Saltiel 3 , Reference Kalashnikov, Risse, Schönnagel and Sandner 4 ] and nonlinear ellipse rotation (NER)[ Reference Homoelle and Gaeta 5 ], which allow an ASE contrast enhancement by approximately three to five orders of magnitude[ Reference Jullien, Albert, Burgy, Hamoniaux, Rousseau, Chambaret, Augé-Rochereau, Chériaux, Etchepare, Minkovski and Saltiel 3 , Reference Pajer and Kalashnikov 6 ]. These methods are mainly limited by the imperfections of the used polarizers and/or wave plates. On the high-energy side, the most common method is the use of plasma mirrors (PMs)[ Reference Kapteyn, Murnane and Szoke 7 – Reference Doumy, Quéré, Gobert, Perdrix, Martin, Audebert, Gauthier, Geindre and Wittmann 9 ]. Here, the contrast enhancement magnitude is in the range of two to three per mirror but comes at the cost of mirror replacement on a regular basis and an energy loss of 20%–30% per mirror. Unlike the previous methods, PMs address all sources of contrast degradation at once and they offer a very robust and reliable way to improve the temporal contrast, including the ps-pedestal, which is inherently coupled to the use of a stretcher and compressor in CPA systems[ Reference Roeder, Zobus, Brabetz and Bagnoud 10 – Reference Bagnoud and Salin 12 ].
Another approach is to generate a clean pulse from the beginning to seed the laser system instead of cleaning it afterwards. A widespread solution for this is the nonlinear process of ultrafast optical parametric amplification[ Reference Dorrer, Begishev, Okishev and Zuegel 13 , Reference Wagner, João, Fils, Gottschall, Hein, Körner, Limpert, Roth, Stöhlker and Bagnoud 14 ]. The intrinsic contrast-reducing characteristic of this method, parametric fluorescence, is tied to the spatial and temporal extent of the pump. By using short pump pulses with a duration in the range of 1–2 ps, the contrast-degrading influence of parametric fluorescence can be temporally constrained. Outside this time window, the magnitude of the contrast enhancement by this technique is related to the overall gain of the ultrafast optical parametric amplifier (uOPA) and therefore it is limited only by the size of the nonlinear crystal and the energy of the pump laser. In addition, when scaling the uOPA output up to the millijoule level, it represents an elegant replacement for first-stage, high-gain lasers – often regenerative amplifiers – in the front-end of high-intensity laser systems. Due to their susceptibility to the generation of pre-pulses, a replacement by a uOPA also reduces the pre-pulse contrast level of the whole laser system and preserves the overall complexity of the laser.
In this paper, we present a uOPA system, capable of delivering millijoule-level pulses as seeds for high-intensity laser systems. We developed the uOPA at the Petawatt High Energy Laser for heavy Ion eXperiments (PHELIX)[ Reference Bagnoud, Aurand, Blazevic, Borneis, Bruske, Ecker, Eisenbarth, Fils, Frank, Gaul, Goette, Haefner, Hahn, Harres, Heuck, Hochhaus, Hoffmann, Javorková, Kluge, Kuehl, Kunzer, Kreutz, Merz-Mantwill, Neumayer, Onkels, Reemts, Rosmej, Roth, Stoehlker, Tauschwitz, Zielbauer, Zimmer and Witte 15 ] laser facility at GSI-Darmstadt, Germany, but a versatile, self-seeded pump module enables a broad applicability of this uOPA at lasers that work in the spectral range of 1 μm. Aside from a millijoule-level performance, this uOPA features high energy stability, broadband amplification and high beam quality, which makes it a useful high-contrast pre-amplifier without the need for subsequent spatial cleaning amplifiers. The uOPA has already been implemented at the PHELIX facility, providing the highest ASE and pre-pulse contrast levels on the nanosecond scale.
In the following, we describe the design of the complete uOPA system and address the system requirements. We also provide insight into the amplifier’s performance in terms of output energy, beam and spectral quality and its energy stability. Finally, we present the improvement of the temporal laser contrast at the PHELIX facility through the implementation of the new system.
2 Design and setup of the high-contrast ultrafast optical parametric amplifier
For the system to be a real alternative for high-gain amplifiers, one aspect of the design is to achieve similar output energies, which are often below 1 mJ, up to a few mJ for multistage, pre-amplification systems[ Reference Albach, Loeser, Siebold and Schramm 16 – Reference Bock, Herrmann, Püschel, Helbig, Gebhardt, Lötfering, Pausch, Zeil, Ziegler, Irman, Oksenhendler, Kon, Nishuishi, Kiriyama, Kondo, Toncian and Schramm 18 ]. However, with respect to the replacement of regenerative amplifiers, parameters such as energy stability, beam quality and broadband gain are also relevant and should not be neglected. The issue of broadband amplification can be solved by applying the method of non-collinear ultrafast optical parametric amplification. However, comparable energy stability and beam quality are more difficult to achieve as they are not only heavily influenced by the process of the uOPA, but also by its pump laser.
In the following, we will therefore describe the design of the uOPA system with respect to the previously mentioned parameters and how they will define the requirements in its pump system.
2.1 uOPA design considerations
To reach an output energy of 1 mJ, a parametric gain in the range of ${10}^5$
–
${10}^5$
– ${10}^6$
is necessary for input pulses in the nanojoule range, as delivered by a typical mode-locked oscillator. Hence, every parameter that influences this gain will impact the output of the uOPA directly and will transfer fluctuations or irregularities. It is well known that the gain of the uOPA,
${10}^6$
is necessary for input pulses in the nanojoule range, as delivered by a typical mode-locked oscillator. Hence, every parameter that influences this gain will impact the output of the uOPA directly and will transfer fluctuations or irregularities. It is well known that the gain of the uOPA, ${G}_{\mathrm{OPA}}$
[
Reference Manzoni and Cerullo
19
], is as follows:
${G}_{\mathrm{OPA}}$
[
Reference Manzoni and Cerullo
19
], is as follows:
 $$\begin{align}{G}_{\mathrm{OPA}}=1+{\left(\frac{\varGamma }{g}\sinh (gL)\right)}^2,\end{align}$$
with
 $$\begin{align}\varGamma =\sqrt{\frac{2{d}_{\mathrm{eff}}^2{\omega}_{\mathrm{s}}{\omega}_{\mathrm{i}}}{c_0^3{\varepsilon}_0{n}_{\mathrm{s}}{n}_{\mathrm{i}}{n}_{\mathrm{p}}}\cdot {I}_{\mathrm{p}}},\end{align}$$
and
 $$\begin{align}g=\sqrt{\varGamma^2-\frac{\Delta {k}^2}{4}},\end{align}$$
and scales exponentially with the square root of the pump intensity ${I}_{\mathrm{p}}$
, with the assumption of a negligible pump depletion. Here,
${I}_{\mathrm{p}}$
, with the assumption of a negligible pump depletion. Here, $L$
is the length of the crystal,
$L$
is the length of the crystal, ${d}_{\mathrm{eff}}$
is the effective second-order nonlinearity,
${d}_{\mathrm{eff}}$
is the effective second-order nonlinearity, $\omega$
is the angular frequency,
$\omega$
is the angular frequency, $n$
is the refractive index,
$n$
is the refractive index, ${c}_0$
is the vacuum speed of light,
${c}_0$
is the vacuum speed of light, ${\varepsilon}_0$
is the vacuum permittivity and
${\varepsilon}_0$
is the vacuum permittivity and $\Delta k$
is the phase mismatch. The subscripts ‘i’, ‘s’ and ‘p’ denote the idler, signal and pump parameter, respectively. As shown in Equations (1) and (2), in the case of a very intense pump, compared with the signal the OPA gain strongly depends on the crystal length and the pump intensity. Small irregularities in its intensity distribution, temporally or spatially, will therefore manifest in the gain profile. Consequently, the beam and pulse shape of the pump are imprinted onto the signal. If the pump laser delivers high-quality beams without rapid temporal or spatial fluctuations, this does not create any difficulties in that the amplification does not saturate.
$\Delta k$
is the phase mismatch. The subscripts ‘i’, ‘s’ and ‘p’ denote the idler, signal and pump parameter, respectively. As shown in Equations (1) and (2), in the case of a very intense pump, compared with the signal the OPA gain strongly depends on the crystal length and the pump intensity. Small irregularities in its intensity distribution, temporally or spatially, will therefore manifest in the gain profile. Consequently, the beam and pulse shape of the pump are imprinted onto the signal. If the pump laser delivers high-quality beams without rapid temporal or spatial fluctuations, this does not create any difficulties in that the amplification does not saturate.
However, when leaving the unsaturated regime in which Equation (1) loses its validity, some limitations can be noted regarding the design of the pump laser due to the onset of the reconversion process, which shifts energy from the signal and idler back to the pump. Although one can utilize this process to increase the energy stability of the system[ Reference Zhang, Fujita, Yamanaka, Nakatsuka, Izawa and Yamanaka 20 , Reference Guardalben, Keegan, Waxer, Bagnoud, Begishev, Puth and Zuegel 21 ] by choosing a crystal length such that the signal output energy reduces due to reconversion in case of a pump-fluctuation peak and reaches its maximum in the case of a pump-fluctuation valley, this method is only adapted to spatial and temporal ‘top hat’ pump pulses and introduces spatio-temporal coupling when the pump pulse has a Gaussian profile. Consequently, the operation point for a uOPA front-end must remain below the process of saturation if a pump laser with a Gaussian profile in space and time is used.
From this, one can deduce the necessary requirements for the pump laser: short pulse duration, high beam quality and high energy stability, such that the operation point of the uOPA is independent of saturation and a high temporal and spatial quality of the signal can be achieved.
This limits the choice of available active media for the pump laser to those that have an absorption band that can be pumped by highly stable laser diodes and an emission band that provides sufficient bandwidth to generate short pulses in the 1–2 ps range. Ytterbium-doped YAG (Yb:YAG) combines these properties, is widely available and provides high-energy storage capabilities. To find a suitable pump laser design, the first step is to determine the required pump energy. For this, simulations have been conducted with a self-written 3D, three-wave-mixing code, with a design like SNLO software[
22
], but with the possibility to add parasitic beams, such as the second harmonic of the idler and the signal. This is especially important when simulating the OPA process close to degeneracy and close to a collinear setup, since the phase mismatch for these processes will be diminished. Furthermore, the output of this code was cross-checked with outputs of the well-known simulation software SNLO and Miró[
Reference Morice23] to ensure its functionality. Figures 1(a) and 1(b) show the simulation results for the simplest configuration: a single-stage uOPA with direct amplification. As input for the simulation, the pump exhibits a Gaussian profile in space and time, with a duration of 1.5 ps (full width at half maximum (FWHM)), a beam radius of ${w=2.14}$
mm and a center wavelength of 515 nm. The initial signal parameters are energy of 1 nJ, pulse duration of 66 fs and beam radius of 1.8 mm. The center wavelength is 1034 nm, which corresponds to the spectrum of the oscillator that is used to set up the uOPA. The simulation was performed up to a maximum crystal length of 1.5 mm with varying pump energies from 10 to 40 mJ in steps of 7.5 mJ. The angle between the pump and the signal was set to 0.44°, enabling broadband phase-matching. For all simulations, the crystal in use was beta barium borate (BBO). Although building a high-gain, single-stage OPA seems attractive because of the simplicity of its design, it meets several severe limitations, as detailed in the following.
${w=2.14}$
mm and a center wavelength of 515 nm. The initial signal parameters are energy of 1 nJ, pulse duration of 66 fs and beam radius of 1.8 mm. The center wavelength is 1034 nm, which corresponds to the spectrum of the oscillator that is used to set up the uOPA. The simulation was performed up to a maximum crystal length of 1.5 mm with varying pump energies from 10 to 40 mJ in steps of 7.5 mJ. The angle between the pump and the signal was set to 0.44°, enabling broadband phase-matching. For all simulations, the crystal in use was beta barium borate (BBO). Although building a high-gain, single-stage OPA seems attractive because of the simplicity of its design, it meets several severe limitations, as detailed in the following.
Simulation of a beta barium borate (BBO) based single-stage uOPA. (a) Signal energy of the uOPA as a function of the crystal length and the pump input energy. (b) Comparison of the normalized fluence lineouts after the OPA (solid line) with the input distribution (shaded area) at 1.5 mm. The colors correspond to the legend entries in (a). The input parameters of the signal are t = 66 fs (FWHM, Gaussian), $w$
= 1.8 mm (Gaussian) and E = 1 nJ. The input parameters of the pump are t = 1.5 ps (FWHM, Gaussian) and w = 2.14 mm (Gaussian).
$w$
= 1.8 mm (Gaussian) and E = 1 nJ. The input parameters of the pump are t = 1.5 ps (FWHM, Gaussian) and w = 2.14 mm (Gaussian).
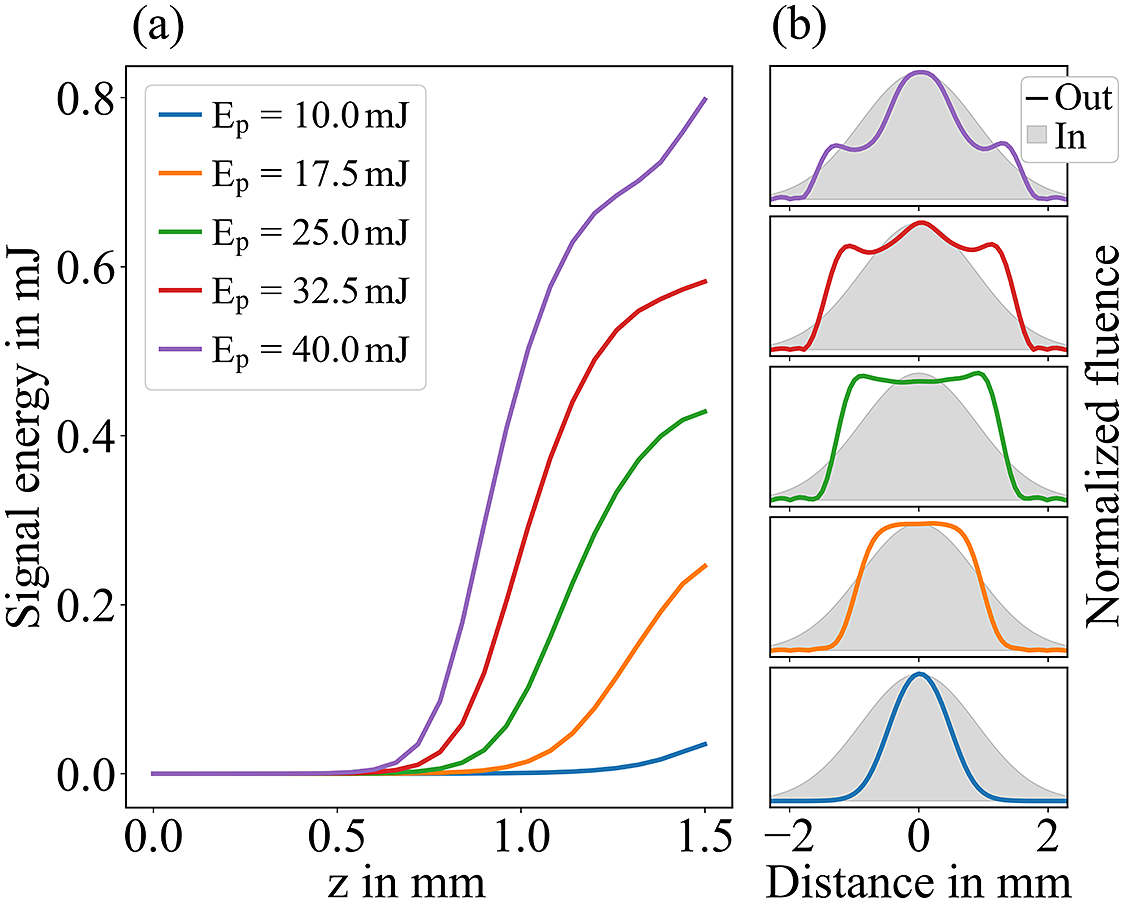
First, direct amplification of the unchirped signal, while keeping a good beam quality and spectrum, sets excessively high requirements on the output energy of the pump system. Figure 1(a) emphasizes this, as even a 40 mJ pump is not sufficient to generate 1 mJ of output. Furthermore, Figure 1(b) highlights that the amplification already saturates at pump energies of 17.5 mJ. For a pump energy of 25 mJ, the signal starts to locally reconvert, resulting in a dip at its center. A further increase in pump energy creates a highly deteriorated beam, as now the outer regions of the beam start to reconvert, while the center starts to gain energy again. However, beam deterioration due to walk-off is negligible because of the short crystal length, which causes an effective spatial walk-off of less than 4% of the pump FWHM.
Second, there is a risk in building a single-stage OPA because of pump depletion by parasitic parametric fluorescence, which the used model can only include in the propagation direction of the pulses. However, as parametric fluorescence emits omnidirectionally with one photon per mode, the parametric noise may overrun the seed by depleting the pump.
Following the description in Ref. [Reference Homann and Riedle24], we can estimate the noise input energy. If we only account for all photons whose accumulated phase mismatch is below $2\pi$
, we calculate an input noise energy of 34 pJ for the simulation parameters, corresponding to already 3.4% of the assumed input seed energy.
$2\pi$
, we calculate an input noise energy of 34 pJ for the simulation parameters, corresponding to already 3.4% of the assumed input seed energy.
Therefore, it is useful to split the uOPA into two separate stages with a more moderate gain per stage to keep the parametric fluorescence in the first stage at a reasonable level and create a stronger seed for the second stage. This requires extra temporal and spatial alignment modules but is beneficial in two ways. First, the pump energy demand can be reduced by using a thicker crystal in the first stage and still boost the signal from nano- to microjoules. This leaves most energy for the main-amplification stage and increases the total phase mismatch for the parametric fluorescence. Second, with the increase of seed energy in the second stage and the reduced parametric gain per stage, the parametric fluorescence is further limited because of parametric gain quenching[ Reference Tavella, Marcinkevičius and Krausz 25 , Reference Hama, Kondo, Maeda, Zoubir, Kodama, Tanaka and Mima 26 ].
Next, we can optimize additional parameters, such as the temporal overlap of the signal and the pump and the angle between the pump and the signal. Although using a short signal pulse has its advantages, such as an approximately constant pump intensity in time, the reduced temporal overlap of the signal and pump obviously limits the amount of usable pump energy. In the simulation of Figure 1 only 10% of the total pump energy is located inside the signal window (1%–1% of the initial temporal pulse distribution, full width at 1% of the maximum). By stretching the signal pulse slightly, the effective available pump energy increases. However, with the stretching of the signal, it must be noted that unsaturated amplification will now impact the spectral bandwidth, since the spectrum of the pulse is now distributed in time and therefore will be distorted in a comparable way to the temporal profile.
The second-mentioned optimization covers the suppression of parasitic second-order effects. Because of the dependence of these effects on the signal or idler intensity, a slight improvement is already introduced by stretching the pulse. With a change of the pump-to-signal angle in the non-collinear setup, we can further suppress these processes. By varying the non-collinear pump-to-signal angle, the ideal phase-matching angle between the signal and the optical axis of the crystal also changes, which alters the phase-matching condition for the second-harmonic generation (SHG) of the signal. Similar considerations hold for the idler. Accordingly, choosing an appropriate pump-to-signal angle can increase the phase mismatch for the SHG of the signal and the idler.
Since the simulated signal–crystal angle of 23.78° in this setup is close to the ideal angles for the SHG of the idler and signal, which are 23.39° and 23.25°, respectively; significant losses by these parasitic effects can be expected. In fact, the second harmonic of the signal already reached 200 μJ within the simulation of the single-stage uOPA shown in Figure 1. This corresponds to about 25% of the signal output energy, which highlights the need to adjust this parameter. However, by changing the angle one must find a compromise between the reduction of parasitic SHG and spatial walk-off, as well as the amplification bandwidth of the uOPA. Figure 2(a) displays the normalized gain of the OPA and Figures 2(b) and 2(c) show the normalized SHG efficiency as a function of the wavelength and pump-to-signal angle for the signal and idler, respectively.
(a) Calculated normalized parametric gain of the uOPA for a pump at 515 nm with an intensity of 80 GW/cm ${}^2$
and a 1 mm thick BBO crystal. The pump-to-signal angle defines the phase-matching angle between the signal at 1034 nm and the crystal axis. For this angle, we calculated the normalized SHG-efficiency at every wavelength for the signal (b) and the idler (c). The white dashed and dotted lines mark the spectral range of the signal and idler input wavelengths for a pump-to-signal angle of
${}^2$
and a 1 mm thick BBO crystal. The pump-to-signal angle defines the phase-matching angle between the signal at 1034 nm and the crystal axis. For this angle, we calculated the normalized SHG-efficiency at every wavelength for the signal (b) and the idler (c). The white dashed and dotted lines mark the spectral range of the signal and idler input wavelengths for a pump-to-signal angle of $-$
2.25°
$-$
2.25° $\pm$
0.1°. The calculations did not include pump depletion.
$\pm$
0.1°. The calculations did not include pump depletion.

It is noticeable that the gain bandwidth of the OPA process is independent of the sign of the pump-to-signal angle. Contrarily, the maximum SHG efficiency of the signal shifts from shorter wavelengths to longer wavelengths and the SHG efficiency of the idler from longer wavelengths to shorter wavelengths when the pump-to-signal angle is tuned from negative to positive. With the introduction of a small pump-to-signal angle of $-$
2.25°
$-$
2.25° $\pm$
0.1°, the phase mismatch of the signal SHG at its central wavelengths increases from 1.3 to (64.0
$\pm$
0.1°, the phase mismatch of the signal SHG at its central wavelengths increases from 1.3 to (64.0 $\pm$
3.6) mm
$\pm$
3.6) mm ${}^{-1}$
and that of the idler from 1.3 to (30.2
${}^{-1}$
and that of the idler from 1.3 to (30.2 $\pm$
0.6) mm
$\pm$
0.6) mm ${}^{-1}$
. Furthermore, the effective spatial walk-off is kept at 1.08°
${}^{-1}$
. Furthermore, the effective spatial walk-off is kept at 1.08° $\pm$
0.09°, because the birefringent walk-off is partially compensated. At this non-collinear angle, the bandwidth of the uOPA stays at a reasonable level of approximately 80 nm (normalized gain from 90% to 90%, full width at 90% of the maximum).
$\pm$
0.09°, because the birefringent walk-off is partially compensated. At this non-collinear angle, the bandwidth of the uOPA stays at a reasonable level of approximately 80 nm (normalized gain from 90% to 90%, full width at 90% of the maximum).
Including all of these optimizations, we conducted another set of simulations to find the required parameters for the seed duration and the pump energy. Figures 3 and 4 show the results for the second uOPA stage with an assumed seed energy of 1 μJ. A parameter set of five different pump energies and five different pulse durations of the signal has been simulated. The pump energy varies from 10 to 40 mJ in four steps with a step size of 7.5 mJ. Furthermore, the signal duration varies by adding a quadratic spectral phase, starting at 0 fs ${}^2$
and ending at 20,000 fs
${}^2$
and ending at 20,000 fs ${}^2$
in steps of 5000 fs
${}^2$
in steps of 5000 fs ${}^2$
. The corresponding values for the pump energy and the signal duration are marked in the title of the columns and rows, respectively. Figure 3 shows the input (red shaded) and output (red/blue lines) of the OPA in the spatial domain and Figure 4 in the temporal domain. The red lines indicate that the signal did not reach the desired output energy of 1 mJ within the 1.5 mm thick crystal, whereas the blue lines show the profile at 1 mJ. Compared with the simulation of the single-stage uOPA in Figure 1, the signal can reach 1 mJ output energy even for the unchirped pulse, but the output quality still visibly suffers. We find a similar behavior at low pump energies. Improved output results are achieved in the range of 25–32.5 mJ at pulse durations of 430 or 640 fs. Here, the temporal profile of the pulse barely deforms, meaning its spectral bandwidth is conserved. Moreover, the spatial profile does not show signs of reconversion. Further increasing the pulse duration and pump energy results in a loss of bandwidth and increases the susceptibility to pump energy fluctuations and temporal jitter.
${}^2$
. The corresponding values for the pump energy and the signal duration are marked in the title of the columns and rows, respectively. Figure 3 shows the input (red shaded) and output (red/blue lines) of the OPA in the spatial domain and Figure 4 in the temporal domain. The red lines indicate that the signal did not reach the desired output energy of 1 mJ within the 1.5 mm thick crystal, whereas the blue lines show the profile at 1 mJ. Compared with the simulation of the single-stage uOPA in Figure 1, the signal can reach 1 mJ output energy even for the unchirped pulse, but the output quality still visibly suffers. We find a similar behavior at low pump energies. Improved output results are achieved in the range of 25–32.5 mJ at pulse durations of 430 or 640 fs. Here, the temporal profile of the pulse barely deforms, meaning its spectral bandwidth is conserved. Moreover, the spatial profile does not show signs of reconversion. Further increasing the pulse duration and pump energy results in a loss of bandwidth and increases the susceptibility to pump energy fluctuations and temporal jitter.
Simulated, normalized fluence lineouts of the signal after the uOPA at an output energy of 1 mJ (solid lines, referred to as ‘OPA’ in the legend) and of the input distribution (red shaded area, referred to as ‘input’ in the legend). Blue lines indicate that 1 mJ of output energy was achievable in this setup. If this was not the case, red lines represent the distribution after the maximum propagation distance of 1.5 mm. The input parameters for this simulation are a pump-to-signal angle of $-$
2.25° and a seed energy of 1 μJ. The pump energy and signal duration have been varied according to the titles on the top and right, respectively. The beam sizes were not changed compared with the simulation in Figure 1.
$-$
2.25° and a seed energy of 1 μJ. The pump energy and signal duration have been varied according to the titles on the top and right, respectively. The beam sizes were not changed compared with the simulation in Figure 1.

Simulated, normalized power, integrated over the spatial profile of the signal after the uOPA at an output energy of 1 mJ (solid lines, referred to as ‘OPA’ in the legend) and of the input distribution (red shaded area, referred to as ‘input’ in the legend). Blue lines indicate that 1 mJ of output energy was achievable in this setup. If this was not the case, red lines represent the distribution after the maximum propagation distance of 1.5 mm. The same simulation parameters as in Figure 3 are used.

In summary, several requirements can be specified to reach 1 mJ of uOPA output with overall high quality. Concerning the uOPA setup, it is beneficial to slightly increase the complexity by setting up two stages instead of a single amplification stage. This reduces the necessary pump energy, as well as the parasitic fluorescence of the system. Furthermore, it should be considered to stretch the signal to a pulse duration of some hundreds of femtoseconds to increase the temporal overlap with the pump and enhance the efficiency of the uOPA. In addition, it is advisable to set a larger pump-to-signal angle to suppress parasitic harmonic generation. This is especially important for the second stage, where the signal reaches intensities that easily suffice to start the process of frequency doubling.
Concerning the pump laser, the required output parameters are pulse energies of about 30 mJ at $2\omega$
if the pulse duration is approximately 1.5 ps, as simulated. In addition, high energy stability is required, setting restrictions to the active medium, which should allow pumping by highly stable laser diodes. Lastly, the pump laser should feature an excellent beam quality to minimize the deterioration of the signal in the uOPA. Hence, the foundation for this system is laid by its pump, which has been developed by us for this specific purpose as a chirped pulse amplifier, based on Yb:YAG.
$2\omega$
if the pulse duration is approximately 1.5 ps, as simulated. In addition, high energy stability is required, setting restrictions to the active medium, which should allow pumping by highly stable laser diodes. Lastly, the pump laser should feature an excellent beam quality to minimize the deterioration of the signal in the uOPA. Hence, the foundation for this system is laid by its pump, which has been developed by us for this specific purpose as a chirped pulse amplifier, based on Yb:YAG.
The following section will briefly cover the experimental setup of the uOPA, starting with the layout of the pump system, its working parameters and key features. A detailed description of the architecture of this pump laser can be found in a recent publication of our group[ Reference Zobus, Brabetz, Loeser, Albach, Siebold and Bagnoud 27 ]. Subsequently, we describe the details of the uOPA architecture before presenting the performance of the system as a stand-alone system and as a fully implemented high-contrast module.
2.2 uOPA pump chain
Figure 5 shows a schematic of the full setup. The origin of the uOPA signal and pump pulses is a short pulse oscillator that delivers pulses with a single-pulse energy in the low nanojoule range at repetition rates of about 78 MHz (FLINT, Light Conversion). A polarizer splits the pulse train, as one part of the pulse train propagates to the uOPA stages to provide the seed pulse, and the other part enters the pump–amplifier chain.
Schematic drawing of the complete uOPA system, including the oscillator (gray box), the pump laser (blue boxes) and the uOPA stages (orange boxes).

Here, the pump pulses are spectrally broadened via self-phase modulation (SPM) to ensure spectral overlap with the gain bandwidth of the pump laser, enabling versatile applicability of this system. In a two-stage, CPA-based amplification process, the pulses are stretched in a chirped-fiber Bragg grating stretcher (CFBG) and amplified from sub-nJ to some microjoules in a fiber pre-amplifier at 100 kHz. To enable temporal synchronization, a motorized delay stage is used to actively compensate for thermally induced temporal drifts between the signal and the pump in the uOPA process. The pulses are then amplified in the regenerative main amplifier. This amplifier employs a multi-pass pump module (violet multi-pass in Figure 5) to enhance the pump absorption and reduce signal absorption in quasi-three-level medium Yb:YAG. Here, the pulses reach their operating energy of 47 mJ at a 10 Hz repetition rate.
Prior to compression, the beam is magnified to the desired radius for both uOPA stages. This mitigates strong self-focusing effects inside the transmissive optics after compression or the need to use off-axis, reflective spherical telescopes that are inherently plagued by aberrations. While off-axis, afocal parabolic telescopes would offer a theoretically workable solution to this problem, their misalignment sensitivity and general alignment complexity[ Reference Tacca, Sorrentino, Buy, Laporte, Pillant, Genin, Penna and Barsuglia 28 ] have been estimated to be too high to maintain daily.
After compression to approximately 1.3 ps the pulses are frequency doubled, which results in pulse energies of about 26.7 mJ. The pulse is split into parts of 2.7 and 24 mJ and sent to the first and second uOPA stages, respectively. Another translational stage in the pump arm of the second stage compensates for the extra delay between the first and the second amplification stages. As the intensity of the pump pulses at this point is high enough to cause nonlinear interaction within a few meters of propagation through air, the distances between the output of the compressor and the two uOPA stages are kept as short as possible.
2.3 uOPA signal chain
On the side of the signal chain, the oscillator pulses pass a stretching stage consisting of two parallel set up mirrors, of which one is a Gires–Tournois-interferometer (GTI) mirror with a group delay dispersion (GDD) of (1800 $\pm$
100) fs
$\pm$
100) fs ${}^2$
at 1035 nm resulting in an overall additional GDD of 7200 fs
${}^2$
at 1035 nm resulting in an overall additional GDD of 7200 fs ${}^2$
and a pulse duration of (617
${}^2$
and a pulse duration of (617 $\pm$
5) fs (FWHM). The beam with a radius of
$\pm$
5) fs (FWHM). The beam with a radius of $w=\left(1.54\pm 0.02\right)$
mm is then amplified within the first uOPA stage. Inside the first stage, which consists of a 2.4 mm thick BBO crystal, the angle between the pump and the signal is close to a collinear setup, such that we achieve a broad gain bandwidth, but can still split the signal, pump and idler in the following. The corresponding propagation angles inside the BBO crystal are 23.3° for the signal and 23.7° for the pump. The beam size ratio between the signal and the pump is 0.72
$w=\left(1.54\pm 0.02\right)$
mm is then amplified within the first uOPA stage. Inside the first stage, which consists of a 2.4 mm thick BBO crystal, the angle between the pump and the signal is close to a collinear setup, such that we achieve a broad gain bandwidth, but can still split the signal, pump and idler in the following. The corresponding propagation angles inside the BBO crystal are 23.3° for the signal and 23.7° for the pump. The beam size ratio between the signal and the pump is 0.72 $\pm$
0.02. Due to the Gaussian shape of the beams and the associated spatial gain narrowing, the outgoing beam radii are significantly reduced compared with the incoming ones. Hence, a magnifying telescope between the two stages is used to increase the beam radius by a factor of two, as well as to image the output from the first BBO directly onto the second one, which has a thickness of 1 mm. While the pump spot size remains unchanged in comparison with the first stage, the signal beam size increases slightly to a radius of
$\pm$
0.02. Due to the Gaussian shape of the beams and the associated spatial gain narrowing, the outgoing beam radii are significantly reduced compared with the incoming ones. Hence, a magnifying telescope between the two stages is used to increase the beam radius by a factor of two, as well as to image the output from the first BBO directly onto the second one, which has a thickness of 1 mm. While the pump spot size remains unchanged in comparison with the first stage, the signal beam size increases slightly to a radius of $w=\left(1.80\pm 0.09\right)$
mm corresponding to a signal-to-pump ratio of 0.85
$w=\left(1.80\pm 0.09\right)$
mm corresponding to a signal-to-pump ratio of 0.85 $\pm$
0.05, further increasing the spatial overlap. The internal crystal angles of the pump and signal inside the second stage are 24.24° and 26.61°, respectively.
$\pm$
0.05, further increasing the spatial overlap. The internal crystal angles of the pump and signal inside the second stage are 24.24° and 26.61°, respectively.
Lastly, a small part of the amplified pulse leaks through a 0.2% beam splitter and is used to monitor the delay between the pump and signal, by sending it into a spectrometer (Ocean Insight, HR2000+). As the pulse is chirped, a delay shift between the pump and signal directly translates to a shift of the spectral center of the signal, which a motorized linear stage, located between the fiber amplifier and the regenerative amplifier of the pump laser, can correct using a closed loop. As the main origin for slow temporal separation of the signal and pump is thermal fluctuation, only minor adjustments are required, such that the electronic timing of the pumping system remains unaffected. In addition, potential energy fluctuations due to the pointing jitter caused by the moving stage are minimized by the saturated operation of the regenerative amplifier.
3 Performance of the ultrafast optical parametric amplifier system
Within this section we want to address the performance of the system with respect to the parameters that are most important, based on our working experience: spatial beam quality, spectral bandwidth conservation and energy stability, as even small fluctuations in these parameters may, when combined or coupled, result in a significant loss of intensity[ Reference Pariente, Gallet, Borot, Gobert and Quéré 29 ].
All of these parameters impact the performance of high-intensity lasers and should be maintained or enhanced within this amplification scheme. Concerning the energy output, the goal is to work close to a millijoule, allowing the amplifier to replace other high-gain front-end amplifiers (e.g., regenerative amplifiers) that are susceptible to the creation of pre-pulses.
3.1 Energy output
To reach this energy, we use two OPA stages, where the working point of the first one is set to moderate output energies and lower levels of optical-to-optical conversion efficiency. This ensures amplification with a barely depleting pump, and hence minimized reconversion of the signal and amplification closer to the small-signal-gain regime, which results in less distorted spectra and beam profiles. The corresponding output energies and optical efficiencies as a function of the pump energy can be seen in Figure 6. The pump energy was measured with a commercial energy meter (Gentec-EO, QE25LP-S-MB-D0) and adjusted via a half-wave retardation plate in combination with a polarizer that splits the energy between the stages.
Output energy and signal gain of the uOPA over pump energy in the first stage (a) and the optical-to-optical efficiency of the first stage (b). The dashed curve in (a) represents a fit to the OPA gain in the non-depleting pump regime (see Equation (1)).

Figure 6(a) depicts the output energy (blue ) and gain in the first uOPA stage (red). A fit of the parametric gain with the theoretical scaling of an undepleted pump with perfect phase-matching (Equation (1) with $g=\varGamma$
) shows a qualitatively good agreement, indicating a non-saturated amplification. This is in agreement with the optical-to-optical efficiency, shown in Figure 6(b), which only varies between 0.1% at minimum and 2% at maximum, corresponding to about 100 μJ output energy. However, we keep the output below a few tens of microjoules, which enables the imaging of the output beam from the output face of the first stage onto the input face of the second crystal without beam break-up due to nonlinear effects inside the telescope. This further increases the beam stability and allows one to use a spatial filter between the stages to correct for potential beam distortions and remove parametric fluorescence.
$g=\varGamma$
) shows a qualitatively good agreement, indicating a non-saturated amplification. This is in agreement with the optical-to-optical efficiency, shown in Figure 6(b), which only varies between 0.1% at minimum and 2% at maximum, corresponding to about 100 μJ output energy. However, we keep the output below a few tens of microjoules, which enables the imaging of the output beam from the output face of the first stage onto the input face of the second crystal without beam break-up due to nonlinear effects inside the telescope. This further increases the beam stability and allows one to use a spatial filter between the stages to correct for potential beam distortions and remove parametric fluorescence.
The output energies and optical-to-optical efficiency of the second stage are shown in Figure 7. For this measurement, we kept the pump energy of the first stage at a constant level of (2.70 $\pm$
0.02) mJ. With this, the parametric gain of the first stage is approximately 850 and creates a seed with an energy of (5.75
$\pm$
0.02) mJ. With this, the parametric gain of the first stage is approximately 850 and creates a seed with an energy of (5.75 $\pm$
1.2) μJ, which, according to the conducted simulations, suffices to reach 1 mJ of output. In contrast to the first stage, the scaling of the output energy as a function of the pump energy differs significantly. As visible in Figure 7(a), the output energy scales linearly and the efficiency starts to saturate, reaching a plateau at around 4.38%
$\pm$
1.2) μJ, which, according to the conducted simulations, suffices to reach 1 mJ of output. In contrast to the first stage, the scaling of the output energy as a function of the pump energy differs significantly. As visible in Figure 7(a), the output energy scales linearly and the efficiency starts to saturate, reaching a plateau at around 4.38% $\pm$
0.14%. At this point the uOPA achieves an output energy of (1.05
$\pm$
0.14%. At this point the uOPA achieves an output energy of (1.05 $\pm$
0.03) mJ using a pump energy of (24.0
$\pm$
0.03) mJ using a pump energy of (24.0 $\pm$
0.7) mJ. This indicates the existence of parasitic processes, which limit the exponential growth. Although a pump-to-signal angle of
$\pm$
0.7) mJ. This indicates the existence of parasitic processes, which limit the exponential growth. Although a pump-to-signal angle of $-$
2.37° should suppress the generation of the second harmonics, we could observe a significant conversion for both the signal and idler when increasing the output energy. Since the mutual amplification of idler and signal is of immense importance for the exponential amplification in the uOPA, an energy extraction through parasitic SHG results in a tremendous reduction of the gain, restricting the exponential growth. The reason for the excessive generation of idler and signal SHG is still not clear and needs further investigation. However, as long as the target output energy is achieved and the temporal and spatial quality meets the requirements, this does not limit the applicability of the system in a high-intensity laser.
$-$
2.37° should suppress the generation of the second harmonics, we could observe a significant conversion for both the signal and idler when increasing the output energy. Since the mutual amplification of idler and signal is of immense importance for the exponential amplification in the uOPA, an energy extraction through parasitic SHG results in a tremendous reduction of the gain, restricting the exponential growth. The reason for the excessive generation of idler and signal SHG is still not clear and needs further investigation. However, as long as the target output energy is achieved and the temporal and spatial quality meets the requirements, this does not limit the applicability of the system in a high-intensity laser.
Output energy of the uOPA over pump energy in the second stage (a) and the optical-to-optical efficiency of the second stage (b). The pump energy in the first stage is kept constant at 2.7 mJ corresponding to an input energy of (5.75 $\pm$
1.2) μJ for the second stage.
$\pm$
1.2) μJ for the second stage.

In addition, even with a linear dependency of the pump energy, there is no onset of an energy plateau visible for the given crystal thickness, indicating even higher output energies when increasing the pump energy. Although this is in general possible, a further increase of the pump energy requires also enlarging the pump beam size to evade the damage of the crystal at too high intensities.
For the sake of simplicity and the preservation of the pump beam quality, which connects directly to the signal beam quality after its amplification, we did not implement any magnifying telescope. However, if a larger output energy is required for the application, an energy increase can be realized by increasing the seed energy at the second stage. In the following, however, the data concerning the beam and spectral quality have been recorded with the same seed energy as in Figure 7 for reasons of comparability.
3.2 Spatial characteristics
As a measure of the beam quality, the spatial distribution of the output beam has been monitored at different pump energy levels. To minimize the influence of any stray light from the pump beam, we conducted the measurement after approximately 3 m of propagation, such that we had to use only a minimum number of camera filters, which often create multiple reflections or introduce dust-speckles and therefore distort the beam distribution measurement. To keep the camera from saturation and remove the second harmonic of the signal, a dichroic mirror as well as a polarizer and half-wave retardation plate were used.
Figure 8 shows the diameter of the beam at the threshold of exp( $-$
2) in blue and the diameter measured by calculating the second moment of the beam distribution, referred to as the D4
$-$
2) in blue and the diameter measured by calculating the second moment of the beam distribution, referred to as the D4 $\sigma$
diameter, in orange. For this, the beam distribution has been transformed to polar coordinates and the uncertainty of the beam size data represents the standard deviation of all measurements calculated at every azimuthal angle. Similarly, but not as comprehensively as an
$\sigma$
diameter, in orange. For this, the beam distribution has been transformed to polar coordinates and the uncertainty of the beam size data represents the standard deviation of all measurements calculated at every azimuthal angle. Similarly, but not as comprehensively as an $M^2$
measurement, this gives a first impression of the deviation from a Gaussian distribution when going to higher pump energies, since the different methods should result in the same diameter if the beam distribution is Gaussian. However, above 13 mJ pump energy we can observe a clear separation. While the diameter calculated via simple threshold evaluation decreases with increasing pump energy, the D4
$M^2$
measurement, this gives a first impression of the deviation from a Gaussian distribution when going to higher pump energies, since the different methods should result in the same diameter if the beam distribution is Gaussian. However, above 13 mJ pump energy we can observe a clear separation. While the diameter calculated via simple threshold evaluation decreases with increasing pump energy, the D4 $\sigma$
diameter starts to increase again at pump energies of 17.5 mJ.
$\sigma$
diameter starts to increase again at pump energies of 17.5 mJ.
Beam diameters after amplification in the second uOPA stage, measured at a threshold of exp( $-$
2) (blue data) and via the second moment of the distribution (orange data).
$-$
2) (blue data) and via the second moment of the distribution (orange data).

This can also be seen qualitatively in Figure 9, in which three radial lineouts at pump energies of 6 mJ (blue ), 13.5 mJ (orange) and 24 mJ (green) are plotted. The dotted lines represent the mean fluence and the fillings correspond to the fluctuation of the measurement. The increased fluctuation within the 6 and 13.5 mJ lineouts at about 0.5 mm results from a dust particle on the camera. As the pump energy increases the beam shrinks, but at the same time, the wings of the distribution increase in amplitude. While this is not as pronounced at 13.5 mJ pump energy, at 24 mJ the wings are clearly visible, which indicates a spatial deformation towards higher-order super-Gaussian distributions at the crystal output.
Exemplary radial lineouts of the beam after the second uOPA stage at different pump energies of 6, 13.5, and 24 mJ: (a) linear scale; (b) log-scale.

This is also visible in the M
2 measurement, depicted in Figure 10. For the M
2 measurement, the output beam (see Figure 11) is magnified prior to the focusing lens to reduce the Rayleigh-range of the focal spot and still illuminate a sufficient number of pixels on the camera. Although this may have a small impact on the measured M
2 value, it is expected to increase the value due to the potential aberrations introduced by the telescope and therefore the measurement gives an upper bound for the actual M
2 of the output. The resulting M
2 is 1.49 $\pm$
0.06 in the x-direction and 1.50
$\pm$
0.06 in the x-direction and 1.50 $\pm$
0.02 in the y-direction, which shows a beam-quality degradation compared with the oscillator with
$\pm$
0.02 in the y-direction, which shows a beam-quality degradation compared with the oscillator with ${M}_{x,y}^2=1.02\pm 0.02$
and even to the first stage with M
${M}_{x,y}^2=1.02\pm 0.02$
and even to the first stage with M ${}_x^2$
= 1.09
${}_x^2$
= 1.09 $\pm$
0.08 and M
$\pm$
0.08 and M ${}_y^2$
= 1.09
${}_y^2$
= 1.09 $\pm$
0.09. However, the M
2 value is equally as high as that of a fourth-order super-Gaussian distribution with a perfect wavefront and the beam quality at 13.5 mJ pump energy is comparable to that of a super-Gaussian distribution of the order of 2.4–2.8 with an M
2-value of 1.20
$\pm$
0.09. However, the M
2 value is equally as high as that of a fourth-order super-Gaussian distribution with a perfect wavefront and the beam quality at 13.5 mJ pump energy is comparable to that of a super-Gaussian distribution of the order of 2.4–2.8 with an M
2-value of 1.20 $\pm$
0.02 in the x-direction and 1.28
$\pm$
0.02 in the x-direction and 1.28 $\pm$
0.03 in the y-direction.
$\pm$
0.03 in the y-direction.
M 2 measurement of the amplified pulse at an output energy of 1 mJ and pump energy of 24 mJ.

Full beam profile of the amplified pulse at an output energy of 1 mJ and pump energy of 24 mJ.

Therefore, we interpret this degradation in the second uOPA stage as both spatial deformation due to saturation and as a possible signature of spatio-temporal coupling, which cannot be completely ruled out in the presence of an even slightly saturated gain and the presence of parasitic SHG. However, even with increased M 2 value, its usability as a seed for high-intensity lasers is still valid due to the typical beam shaping elements in the subsequent laser chain. For example, regenerative amplifiers would reshape the beam to a near-perfect Gaussian or the use of serrated aperture would cut off the edge of the beam. In the latter case, a symmetric beam with a speckle-free distribution is of higher importance to avoid localized high intensities, which can clearly be delivered, as seen in Figure 11.
Furthermore, a fit to the distribution in Figure 9 (green data, 24 mJ pump) implies that the beam can be excellently approximated by a Gaussian distribution within a distance of 1 mm from its center (fit-root-mean-square (rms) error of 2.8%).
We attribute the high symmetry of the beam profile to three factors. First, the seed of the second stage passes a spatial-frequency filter, which provides a clean profile. Second, the negative non-collinear angle of $-$
2.37° mostly compensates the birefringent walk-off of the pump to less than 1% of its FWHM. Third, the not fully saturated amplification with a Gaussian-shaped pump shrinks down the size of the signal beam. By this, the signal is amplified by an effectively more homogeneous pump profile.
$-$
2.37° mostly compensates the birefringent walk-off of the pump to less than 1% of its FWHM. Third, the not fully saturated amplification with a Gaussian-shaped pump shrinks down the size of the signal beam. By this, the signal is amplified by an effectively more homogeneous pump profile.
3.3 Spectral output and energy stability
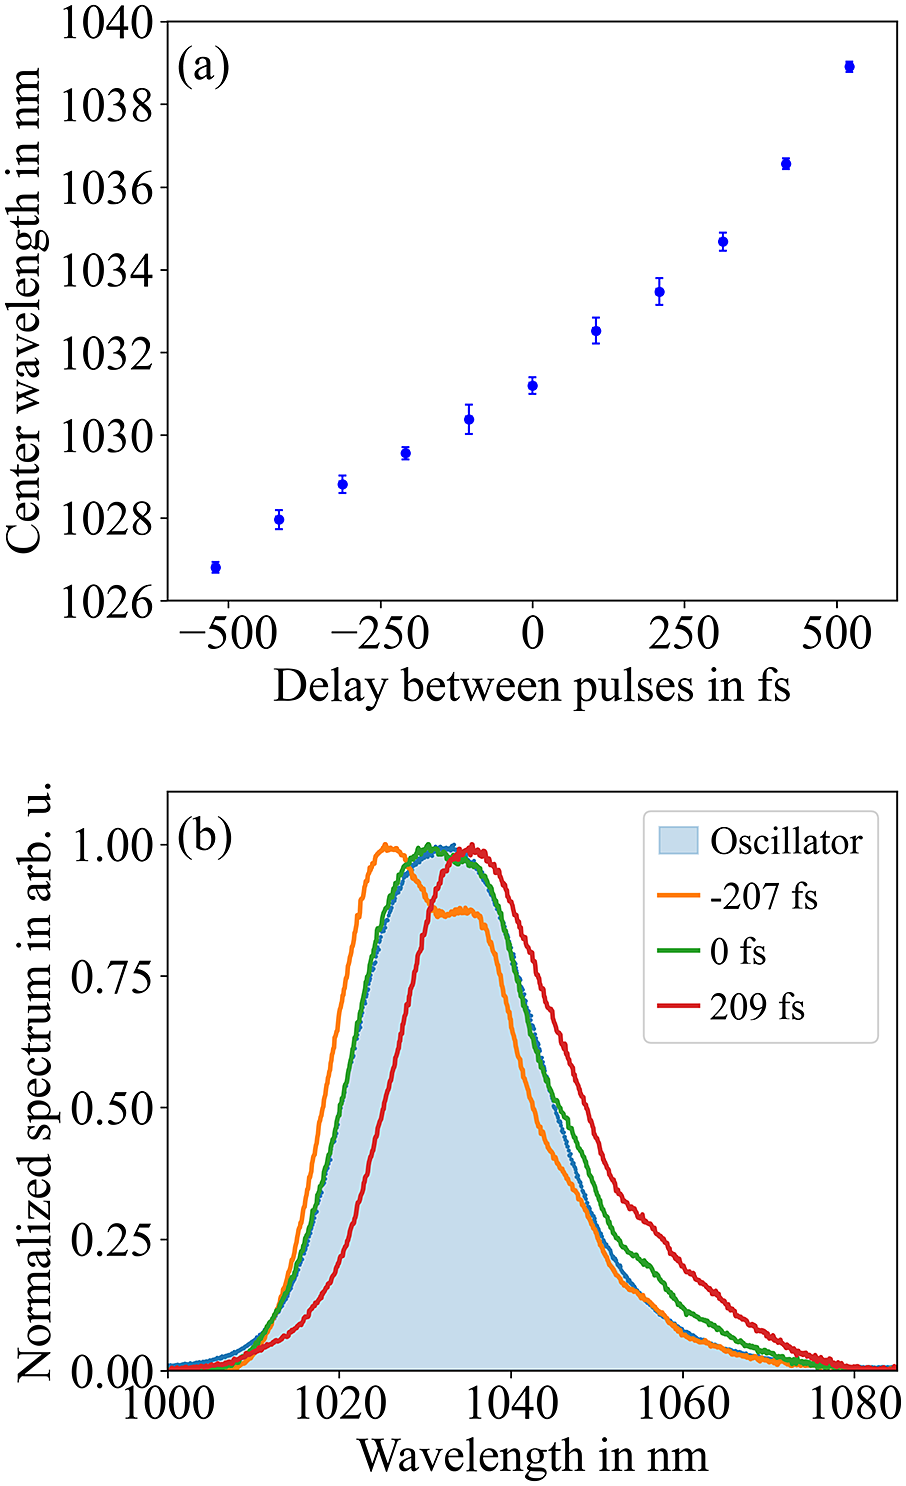
As shown in the previous section, the amplifier provides a sufficiently high beam quality and a sufficient amount of energy, yet its energy stability has still to be shown. Of course, the stability of the pump has the largest influence, but with an energy stability of 0.35%[ Reference Zobus, Brabetz, Loeser, Albach, Siebold and Bagnoud 27 ] it provides a stable basis. Independent of the pump energy, the slow time drift between the pump and signal has to be considered. Since different pulses seed the pump and signal chain and their path lengths from the oscillator to the uOPA stages differ, thermal fluctuations and air circulations must be compensated for to ensure temporal synchronization. For this, a delay-control unit consisting of a motorized linear translational stage, shown in Figure 5, is used that introduces small temporal shifts to the pump pulses. To run this in a closed-loop mode, information is required from which the exact path-length difference between the pump and signal can be determined. We obtain this information by measuring the signal spectrum after amplification in the second uOPA stage. From a measurement of the spectrum and subsequent determination of the center of gravity, a delay is calculated, which is then sent to the control unit. Figure 12(a) shows the shift of the spectral centroid over a set of delays and Figure 12(b) shows three spectra shifted by an arbitrary amount of delay in comparison with the original oscillator spectrum.
Over a delay of about 1 ps, the centroid shift scales approximately linearly. For smaller delay shifts this approximation holds even better, which allows one to use the spectral shift as a measure for additional relative delay between the pump and signal. With a minimum shift of approximately 2.1 fs per micro step of the translational stage, sufficiently fine adjustments are possible, since the pulse durations are approximately 1 ps.
Figure 12(b) shows that, apart from the energy stability, the spectral bandwidth is influenced by the delay, too. By freely choosing the desired spectral center of gravity, we can adjust the system not only in terms of energy, but also in terms of spectral center and bandwidth. This allows one to either conserve the bandwidth of the pulse or shift it to a more desirable center for subsequent amplifiers, as shown in the figure.
Average shift of the spectral center of gravity by delay (a) and spectra of the uOPA output in dependency of the delay between the pump and seed (b). The blue-shaded region marks the original seed spectrum of the oscillator.
Noticeable when comparing the spectra are modulations that were not present before amplification. These seemingly come from the use of the GTI mirrors. This is indicated by the following observations.
First, we could also observe these modulations in the temporal profile, measured by an SHG frequency-resolved optical gating (FROG), before amplification. However, these did not occur when we replaced the GTI mirrors with standard high-reflectivity mirrors. This hints at phase modulations due to the use of GTI mirrors.
Second, these types of modulations could not be observed on the spectrum after amplification without GTI mirrors, especially in the longer-wavelength range. Only small deformations near the peak were visible, but they rather indicated slightly uneven amplification within the uOPA process due to different group velocities of the pump and the signal and the onset of reconversion. This leads us to assume that the spectral modulations result from the coupling of the time-dependent gain and the time distribution of the spectral components, which in turn results from the introduced phase of the GTI mirrors, including their phase errors.
While the GTI mirrors serve their purpose to reach the necessary energy and to enable a temporal stabilization, overall, it is reasonable to exchange them with a stretcher adapted to the rest of the laser system or to manipulate the spectral phase with a dazzler, which both provide a smoother and more flexible tuning of the spectral phase. Another possibility for broadband pulses is the use of a glass block with high group-velocity dispersion, such as SF57. Although this method offers less flexibility, it stands out due to its simplicity.
In the last step, the system must be approved in terms of energy stability before being implemented in a high-intensity laser system. For this, a measurement of the uOPA output energy over a time span of close to 3 hours was conducted. Figure 13 shows the results of this measurement.
Stability measurement of the uOPA system over approximately 3 hours in a test laboratory. The colorbar represents the distribution of the energy over a 5 s timespan to visualize the short-term stability. The mean energy of this measurement was 1.3 mJ.

Contrast measurement of the PHELIX laser before (red area) and after (blue area) implementation of the new uOPA. Several measurements before and after the implementation have been averaged for a clearer picture of the low intensity levels.

Even though the measurement data were taken in a test laboratory whose air conditioning system can only cool, which causes fluctuations in the pump energy, the energy stability was found to be 1.5% rms including a slope of –7 μJ per hour over the full timespan. This makes the system a useful front-end for high-intensity laser systems, which is why this system has been implemented at the PHELIX facility.
3.4 Implementation at PHELIX
Here, the uOPA replaces an already existing, but less performant, also uOPA-based, front-end[ Reference Wagner, João, Fils, Gottschall, Hein, Körner, Limpert, Roth, Stöhlker and Bagnoud 14 , Reference João, Wagner, Körner, Hein, Gottschall, Limpert and Bagnoud 30 ]. Due to the increased performance in terms of beam quality, stability and energy, it allows one to bypass the regenerative amplifier, which was responsible for the highest pre-pulses in the system[ Reference Schanz, Brabetz, Posor, Reemts, Roth and Bagnoud 31 ], while still providing enough energy for the subsequent laser chain.
Figure 14 shows the measured contrast traces before and after implementation of the upgraded front-end. We performed the contrast measurement with a home-built third-order cross-correlator[
Reference Schanz, Brabetz, Posor, Reemts, Roth and Bagnoud
31
] with a dynamic level of $2.7\times {10}^{13}$
and the possibility to scan up to 2.5 ns prior to the main pulse. As shown in the figure, the red curve, representing the contrast before the uOPA upgrade, features 11 more pre-pulses above the new pre-pulse contrast level than the contrast trace after the implementation of the new uOPA (blue curve). Some of them featured a contrast level of
$2.7\times {10}^{13}$
and the possibility to scan up to 2.5 ns prior to the main pulse. As shown in the figure, the red curve, representing the contrast before the uOPA upgrade, features 11 more pre-pulses above the new pre-pulse contrast level than the contrast trace after the implementation of the new uOPA (blue curve). Some of them featured a contrast level of $2.8\times {10}^{-8}$
, meaning intensities above
$2.8\times {10}^{-8}$
, meaning intensities above ${10}^{13}$
W/cm
${10}^{13}$
W/cm ${}^2$
for high-intensity shots at
${}^2$
for high-intensity shots at ${10}^{21}$
W/cm
${10}^{21}$
W/cm ${}^2$
and therefore imposing problems for experiments that rely on a very clean temporal contrast.
${}^2$
and therefore imposing problems for experiments that rely on a very clean temporal contrast.
After implementation, the pre-pulse contrast level is at $6.2\times {10}^{-11}\pm 1.8\times {10}^{-11}$
, implying an improvement of about three orders of magnitude. It should be mentioned that most of the pre-pulses that are still visible are artifacts of the measurement device itself and are therefore of no major concern. To specify this statement, all pre-pulses in Figure 14 that are marked by an arrow are measurement artifacts. The ASE, however, reduced only by a factor of two to
$6.2\times {10}^{-11}\pm 1.8\times {10}^{-11}$
, implying an improvement of about three orders of magnitude. It should be mentioned that most of the pre-pulses that are still visible are artifacts of the measurement device itself and are therefore of no major concern. To specify this statement, all pre-pulses in Figure 14 that are marked by an arrow are measurement artifacts. The ASE, however, reduced only by a factor of two to $4.9\times {10}^{-13}$
, which is still sufficiently low for most experiments.
$4.9\times {10}^{-13}$
, which is still sufficiently low for most experiments.
Concerning the ps-pedestal, beginning at around –400 ps, the measurement after the implementation of the new systems reveals a similar shape, but also local improvement as well as degradation of the temporal contrast. This is, however, not attributed to the implemented uOPA system but rather to the re-alignment of the pulses into the PHELIX stretcher.
4 Conclusion
We reported on the development of a uOPA module, delivering millijoule-level pulses, to be used as a high-contrast front-end for high-intensity lasers. Thanks to a home-built, highly stable, high beam quality pump laser, an rms stability of 1.5% of the uOPA output energy could be achieved while keeping an acceptable beam quality (M 2) of 1.45 in the x-direction and 1.50 in the y-direction. Although we could observe spatial distortions, the beam distribution is free of high-frequency components, is highly symmetric and can still be well approximated by a Gaussian distribution, making it a suitable seed for high-intensity lasers. The output spectra are observed to feature amplitude modulations, which can most likely be attributed to phase errors in the chirped mirrors.
We implemented the system at the PHELIX facility, which allowed us to bypass one of the regenerative amplifiers in the front-end, which has been known to create most of the pre-pulses within the nanosecond scale at the PHELIX facility. With this, we could enhance the pre-pulse contrast by almost three orders of magnitude to a level of $6.2\times {10}^{-11}$
, while maintaining the overall complexity of the laser system and keeping the ASE contrast at
$6.2\times {10}^{-11}$
, while maintaining the overall complexity of the laser system and keeping the ASE contrast at ${4.9\times {10}^{-13}}$
. In a next step, the system will be commissioned at the Petawatt ENergy-Efficient Laser for Optical Plasma Experiments (PEnELOPE) laser facility[
Reference Siebold, Roeser, Loeser, Albach and Schramm
32
] at Helmholtz-Zentrum Dresden-Rossendorf in Dresden.
${4.9\times {10}^{-13}}$
. In a next step, the system will be commissioned at the Petawatt ENergy-Efficient Laser for Optical Plasma Experiments (PEnELOPE) laser facility[
Reference Siebold, Roeser, Loeser, Albach and Schramm
32
] at Helmholtz-Zentrum Dresden-Rossendorf in Dresden.
Acknowledgements
This work received funding through the ATHENA project of the Helmholtz Association and through the Loewe program of the state of Hesse. This work was carried out within the framework of the EUROfusion Consortium, funded by the European Union via the Euratom Research and Training Programme (grant agreement No. 101052200 – EUROfusion) and the European Union’s Horizon 2020 research and innovation program under grant agreement No. 871124 Laserlab-Europe.


 Open access