



The share of household food expenditures spent on food prepared outside the home (or food away from home (FAFH)) has been increasing since the mid-1950s( Reference Kinsey 1 ). Rising income, increased time constraints, and a greater supply and variety of restaurants have been found to help explain this trend( Reference McCracken and Brandt 2 – Reference Jekanowski, Binkley and Eales 4 ). In the USA, FAFH has been found to contain more fat and energy than food prepared at home( Reference Lin and Guthrie 5 , Reference Guthrie, Lin and Frazao 6 ). Greater expenditures on and consumption of FAFH have been found to increase total daily energy intake and lower diet quality( Reference Mancino, Todd and Lin 7 , Reference Beydoun, Powell and Wang 8 ).
Because FAFH is generally more expensive than home-prepared meals, spending on FAFH is positively related to household income and tends to decrease during periods of economic decline, which occurred during the Great Recession of 2007–09 (Fig. 1). Although the recession officially ended in June 2009, unemployment remained near its peak of 10 % through 2010 and declined slowly after that( 9 ), while spending on FAFH (in real terms and as a share of total household food spending) remained below pre-recession levels. A number of studies have found that among adults, consumption of FAFH declined, while time dedicated to preparing food at home increased slightly during and just after the recession( Reference Todd 10 – Reference Hamrick and Okrent 12 ). In addition, among working-age adults, total fat intake declined, while fibre intake increased between 2005 and 2010, but only a portion of this diet quality improvement was attributable to decreased FAFH consumption( Reference Todd 10 ).
US at-home ( ) and away-from-home(
 )food expenditures, and share of food expenditures on food away from home(
 ),2000–2014 (source: US Department of Agriculture, Economic Research Service, Food Expenditures, tables 10 and 13(
37
))
),2000–2014 (source: US Department of Agriculture, Economic Research Service, Food Expenditures, tables 10 and 13(
37
))
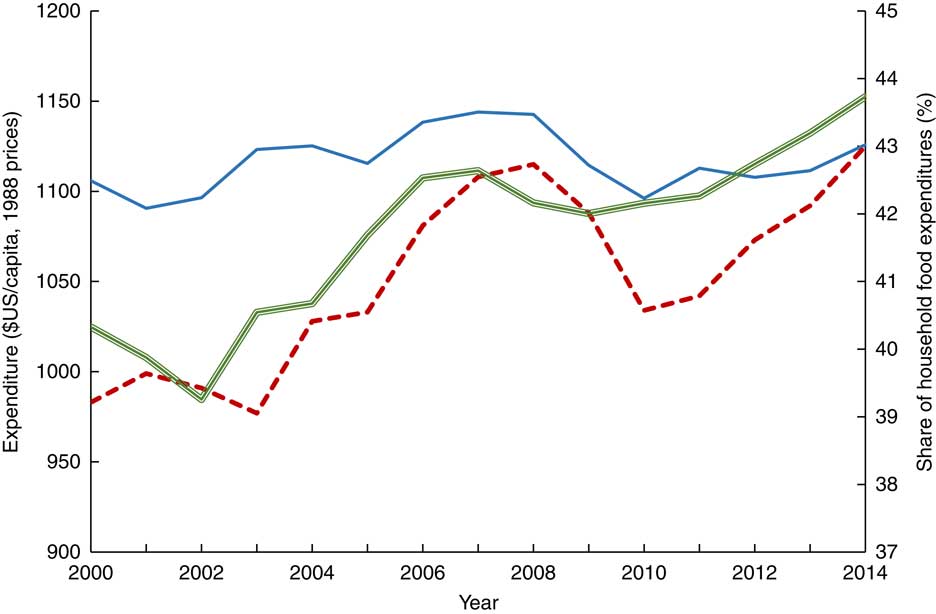
Since 2010, the unemployment rate has declined and employment has increased( 9 , 13 ). In 2014, FAFH spending surpassed its 2008 peak, while food at home (FAH) spending was below its pre-2008 peak, so that the share of household food spending on FAFH reached 43·7 %, a new high (Fig. 1). However, changes in expenditures do not relay any information about the energy or nutritional content of the foods consumed. The increase in the share of food expenditures on FAFH could be due to a switch from less expensive fast foods to more expensive full service and increases in FAFH prices relative to FAH, rather than an overall increase in the frequency of FAFH consumption and total energy intake from FAFH.
Today’s consumers have access to more information about the nutritional content of FAFH as many restaurants voluntarily provide this information (online and/or in the restaurant) and many states and localities have required that chain restaurants provide energy information at the point of purchase since 2009( Reference Long, Tobias and Cradock 14 ). In addition, some restaurants have acted to shift default options in combination meals to healthier items( Reference Lesser, Wu and Matthiessen 15 ). If consumers are using nutrition information to make more healthful food choices and taking advantage of new menu offerings when eating out, intakes of energy and other nutrients may not change if FAFH consumption increases.
The objective of the present paper is to examine the evolution of FAFH consumption, total energy intake and intakes of fat, saturated fat, cholesterol and fibre among working-age adults in the USA between 2005 and 2014. Many economic factors likely to affect food intake changed over this 10-year period, which begins before the economic downturn of 2007–09 and ends as employment and income had almost recovered to pre-recession levels. Rising income and the expected associated increase in FAFH consumption could increase energy intake and lower diet quality. In addition, greater health insurance coverage resulting from the Patient Protection and Affordable Care Act( Reference DeNavas-Walt, Proctor and Smith 16 – Reference Erlich and Becker 20 ) could lower the cost of controlling diet-related conditions, such as diabetes and high cholesterol, through medication. Better access to health insurance may lead to the adverse effect of consumers relying more on medication and less on diet to control their conditions, which then may lead to lower diet quality( Reference Erlich and Becker 20 , Reference Mancino and Kuchler 21 ). In addition, access to health insurance may increase income available for other goods, which could also lead to increased FAFH consumption. The net effects of all of these changes are unknown.
Data and methods
National Health and Nutrition Examination Survey
The National Health and Nutrition Examination Survey (NHANES) collects a large amount of information about an individual’s household and family, as well as a wide range of health-related behaviours and outcomes( 22 ). Dietary intake for one 24 h period is collected using the Automated Multiple Pass Method( Reference Dwyer, Picciano and Daniel 23 ) during an in-person interview with three-dimensional measuring tools used to aid the respondent in reporting quantities. A second day of intake is collected using the same method for a non-consecutive day through a telephone interview, but drawings of different measurement amounts are provided to respondents to assist them in reporting quantities instead of the three-dimensional tools used during the in-person interview( Reference Anand, Bodner-Montville and Ahuja 24 ). NHANES data are released in two-year cycles and in the public-use data, the exact interview date is masked to prevent disclosure of the identity of survey respondents. Data from five rounds, covering the period 2005 through 2014, are used in the present study. The analysis was restricted to the day 1 intake to maximize the sample size and limit any biases that may arise from under-reporting and differences in data collection methods on day 2. The second day of intake has a lower response rate than the first day of intake, ranging from 86 to 91 % of day 1 respondents( Reference Todd 10 ), and a lower mean reported energy intake( Reference Mancino, Todd and Lin 7 , Reference Anand, Bodner-Montville and Ahuja 24 ).
Study sample
The main sample was restricted to adults born between 1951 and 1980, who were of prime working age (at least 25 years, but less than 65 years old) for the entire period. Birth year, which is not reported, was estimated by subtracting age at the time of the survey from the first year of the respective survey round. Defining the sample using birth year, rather than age when sampled, limited the effect that broader population changes over the period can have on the outcomes being studied. Furthermore, limiting the sample to prime working-age adults reduced the possibility that major changes in labour force participation, such as entering the labour force after college during one’s early 20s and retirement after age 65 years, influenced the outcomes. Individuals were excluded if they did not report any energy intake or had missing values for household income or other demographic characteristics considered in the analysis. Household income relative to the federal poverty threshold (published each year by the US Census Bureau) was estimated by dividing the midpoint of the categorical value of income reported by the midpoint of the two annual thresholds for household size for each NHANES two-year round. The final main sample consisted of 12 129 individuals (approximately 2200 to 2500 in each of the five two-year rounds). In 2005–06, these adults were 25 to 54 years old, and in 2013–14 they were 33 to 62 years old.
Individuals born between 1981 and 1990 (aged 15–24 years in 2005–06 and aged 23–32 years in 2013–14) were added to the main sample to form a secondary sample. This added 5197 individuals (1727 in 2005–06; 892 in 2007–08; 944 in 2009–10; 826 in 2011–12; and 808 in 2013–14) for a total of 17 326 individuals in the secondary sample. These millennials are first observed as teens and young adults, and most reach prime working age by the end of the observation period. This group is likely to incorporate FAFH into its consumption patterns differently from older adults. Given that they are not adults of prime working age through the entire observation period, they are not included in the main analysis. Instead, this secondary sample is used to explore generational differences in FAFH consumption.
Identifying intake of food away from home
In the dietary recall component of NHANES, individuals report all foods and beverages consumed during the day preceding the interview (a 24 h period), including when the food or beverage was consumed, the amount consumed, where the food was obtained and the meal occasion. The data provide the total energy content as well as other nutrients (i.e. total cholesterol, fibre and fat) in each food reported consumed.
Following previous work, each food was classified as an at-home food or an away-from-home food( Reference Todd 10 ). At-home foods include those obtained from a grocery or other type of store, a mail-order purchase, or food grown or caught by the individual or someone the individual knows. Foods from all other sources (e.g. full-service and fast-food restaurants, bars and lounges, sporting venues, vending machines, soup kitchens and shelters (including food pantries), Meals on Wheels, street vendors and food trucks, residential dining facilities, pizza places, and any other source not considered to be an at-home source) were considered to be away-from-home foods. The subset of foods purchased from fast-food or pizza places was also identified separately as fast foods.
The data were summarized at the daily individual level, including the total energy consumed per day, total energy from FAFH, total energy from fast-food restaurants, and the share of daily energy from all FAFH and from fast foods. The total number of meals and snacks each day, and the number of meals and snacks from FAFH, were also summarized, with each unique eating occasion (defined by time when consumed) classified as a meal or a snack. Eating occasions described as breakfast, brunch, lunch, dinner or supper (desayuno, almuerzo, comida, merienda and cena, when the respondent described the occasion in Spanish) were classified as meals, while all other eating occasions reported were classified as snacks. When foods in a meal or snack were obtained from different sources, the meal was classified according to where the majority of energy was obtained. In the few cases where energy was equally split between FAH and FAFH sources, the meal was classified as FAFH. In NHANES, intakes of fat and saturated fat are provided in grams. Percentages of energy from fat and saturated fat were calculated assuming 37·565 kJ per gram of fat.
Statistical analyses
Means of demographic characteristics and the dietary outcomes were calculated for each NHANES round (2005–06, 2007–08, 2009–10, 2011–12 and 2013–14). The significance of differences in these unconditional means relative to the 2005–06 and 2009–10 rounds was tested by performing the regression of each measure v. indicators for each survey round with the reference round omitted.
Using the secondary sample, mean energy intake from FAFH was calculated for five cohorts of adults defined by birth year (born before 1951, born 1951–60, born 1961–70, born 1971–80, born 1981–90) in each survey round.
For the primary sample, multivariate linear regression models (a link test did not reject a linear regression model) were used to estimate the conditional changes in log daily energy, percentages of energy from FAFH and fast foods, number of FAFH meals, and total fat, saturated fat, cholesterol and fibre intakes after accounting for changes in demographic characteristics across the survey rounds. The regression was performed for each outcome v. indicators for each of the four latter NHANES rounds (2007–08, 2009–10, 2011–12, 2013–14) and variables measuring age, income relative to the poverty line, household size, gender, race and ethnicity, marital status, education and day of the week of the intake day. The percentage of energy from FAFH and the percentage from fast foods were also included in the regression models for total fat, saturated fat, cholesterol and fibre intakes. The percentage of the differences across rounds accounted for by the changes in these control variables were calculated by comparing the unconditional differences with the conditional differences.
All analyses were conducted using the survey-related commands in the statistical software package Stata version 12.1, which provide weighted means and regression coefficients that are representative of the US population and calculate standard errors that take account of the complex sampling design of NHANES.
Results
Sample characteristics
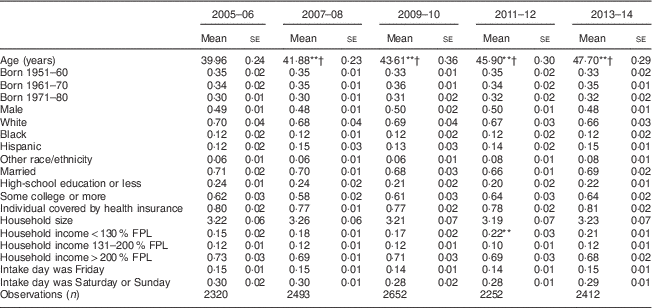
Each NHANES round’s main sample was similar to the others with a few exceptions (Table 1). The average age increased by 2 years between the rounds, which is expected since the sample is defined by estimated birth year. The only statistically significant difference in individual and household characteristics across the rounds is in the percentage that lives in households with income less than 130 % of the federal poverty threshold, which was 7 percentage points higher in 2011–12 than in 2005–06. Changes in the share that were covered by health insurance were not statistically significant.
Weighted means and proportions, with their standard errors, of individual, household and intake-day characteristics by survey round: US adults born between 1951 and 1980 participating in the 2005–2014 National Health and Nutrition Examination Survey
FPL, federal poverty line.
Mean value was significantly different from that in 2005–06: **P<0·01.
Mean value was significantly different from that in 2009–10: †P<0·05.
Unconditional changes in intake and diet quality
Total daily energy was lower during 2007 to 2010 and 2013–14 relative to 2005–06 (Table 2). Total energy from FAFH was lower between 2009 and 2014, while energy from fast foods was lower only between 2007 and 2012, and the percentage of energy from FAFH and fast foods was significantly lower than 2005–06 only in 2009–10. By all measures, 2009–10 marked the low point of FAFH consumption, as the number of meals and snacks from FAFH were also lower in that period.
Weighted means of food and nutrient intakes and eating patterns, with their standard errors, by survey round: US adults born between 1951 and 1980 participating in the 2005–2014 National Health and Nutrition Examination Survey

FAFH, food away from home.
Mean value was significantly different from that in 2005–06: *P<0·05, **P<0·01.
Mean value was significantly different from that in 2009–10: †P<0·05, ††P<0·01.
Intakes of saturated fat and cholesterol showed persistent improvements in 2009 to 2014 relative to 2005–06, while total fat and fibre intakes improved in 2009 to 2012 relative to 2005–06. The percentage of energy from saturated fat was 5–7 % lower, cholesterol was 9 % lower, and fibre intake was 6–12 % higher. In contrast, by 2013–14, the share of energy from fat had returned to the level in 2005–06.
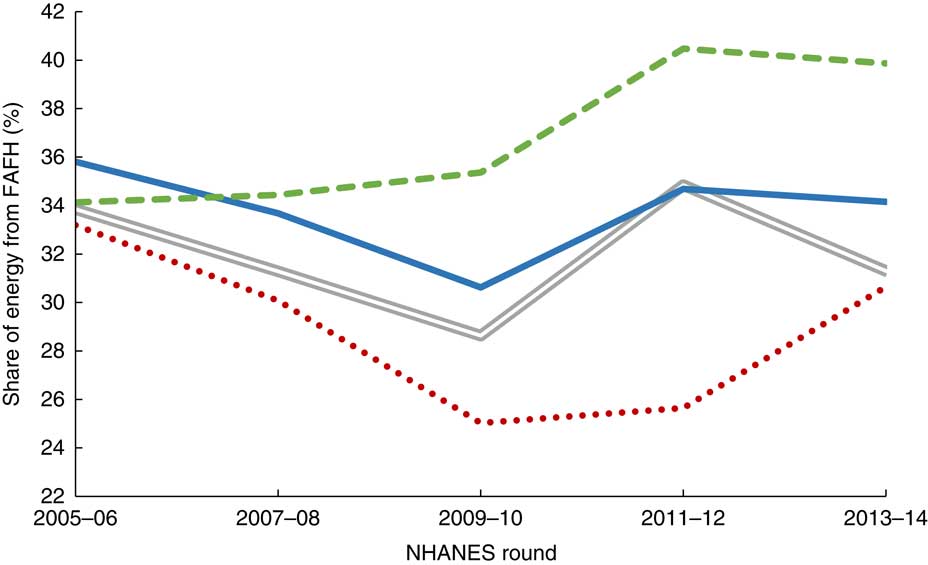
The share of energy from FAFH ranged from 33 to 36 % in 2005–06 across four 10-year birth-year cohorts: 1951–60, 1961–70, 1971–80 and 1981–90 (Fig. 2). Between 2005 and 2010, the percentage of energy from FAFH declined in the three oldest cohorts, while remaining flat or rising slightly in the youngest cohort. All four cohorts increased their percentage of energy from FAFH between 2009 and 2012. In 2013–14, the youngest cohort reported 40 % of total daily energy coming from FAFH, while the oldest reported 31 %.
Weighted mean share of energy from food away from home (FAFH), by birth year cohort ( , 1951–60;
  , 1961–70;
  , 1971–80;
  , 1981–90) and survey round: US adults participating in the 2005–2014 National Health and Nutrition Examination Survey (NHANES). Birth year was estimated by subtracting the individual’s reported age from the first year of the survey round
Conditional changes in food away from home intake and diet quality
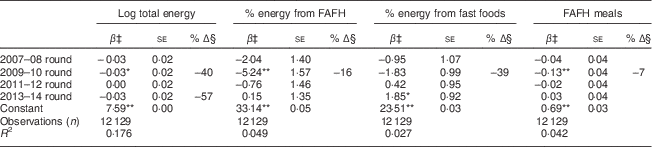
The conditional declines in mean daily energy in 2007–08 and 2013–14 relative to 2005–06 were not significant. The conditional decline in 2009–10 was estimated to be 3 %, a 40 % drop in the unconditional change (Table 3). The conditional decline in the share of energy from FAFH was 16 % lower than the unconditional decline. The conditional changes in the percentage of energy from fast foods were much different from the unconditional: the decline in 2009–10 was no longer statically significant, while the share increased in 2013–14 by 1·85 percentage points relative to 2005–06, when the unconditional estimate was not significant. The change in the number of FAFH meals was only minimally affected by conditioning on observable characteristics.
Conditional differences, with their standard errors, and percentage change in estimated difference from unconditional difference in energy intake and food away from home (FAFH) consumption: US adults born 1951 and 1980 participating in the 2005–2014 National Health and Nutrition Examination Survey
Estimate is statistically significant: *P<0·05, **P<0·01.
‡ Estimated via weighted ordinary least squares with se accounting for the complex sample design. Additional controls include age, household income relative to poverty, household size, and indicators for male, Black, Hispanic, other race/ethnicity (non-Hispanic White is omitted category), married, the dietary intake day was on Friday or on Saturday/Sunday, having completed high school (or General Educational Development) and having at least some college education (no high-school degree is omitted education category).
§ Calculated only when unconditional difference from 2005–06 is statistically significant. Estimated as [(unconditional – conditional)/unconditional]×100. (Unconditional not shown, but estimable using Table 2.)
The larger the share of energy from FAFH and fast foods, the greater the share of energy from total fat and saturated fat and the lower the total fibre intake, with fast foods having a larger effect than all other FAFH (Table 4). However, fast foods reduced cholesterol intake, while FAFH generally increased cholesterol. In most cases, less than 15 % of the changes in diet quality across the survey rounds could be explained by changes in demographics and FAFH consumption. The only difference in statistical significance was for fibre: the increase in 2009–10 became insignificant while that in 2013–14 became significant.
Conditional differences, with their standard errors, and percentage change in estimated difference from unconditional difference in diet quality measures: US adults born between 1951 and 1980 participating in the 2005–2014 National Health and Nutrition Examination Survey
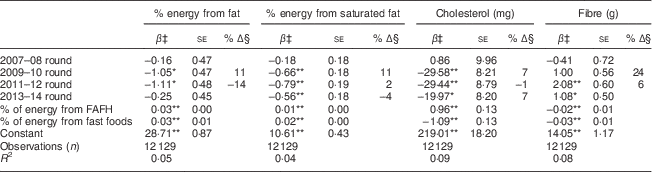
FAFH, food away from home.
Estimate is statistically significant: *P<0·05, **P<0·01.
‡ Estimated via weighted ordinary least squares with se accounting for the complex sample design. Additional controls include age, household income relative to poverty, household size, and indicators for male, Black, Hispanic, other race/ethnicity (non-Hispanic White is omitted category), married, the dietary intake day was on Friday or on Saturday/Sunday, having completed high school (or General Educational Development) and having at least some college education (no high-school degree is omitted education category).
§ Calculated only when unconditional difference from 2005–06 is statistically significant. Estimated as [(unconditional – conditional)/unconditional]×100. (Unconditional not shown, but estimable using Table 2.)
Changes in the quality of at-home and away-from-home foods
Table 5 presents the mean percentages of energy from total fat and saturated fat, and the milligrams of cholesterol and grams of fibre per 4184 kJ for FAH and FAFH foods consumed by survey round, and the changes over survey rounds relative to 2005–06. Most statistically significant changes were observed in FAH, in which there was a decrease in the percentage of energy from saturated fat, ranging from 5 to 7 %, and an increase in fibre ranging from 16 to 19 %, between 2009 and 2014 relative to 2005–06. Most changes in FAFH were not statically significant; the exceptions were a 4 % decrease in fat in 2011–12, a 10 % decrease in cholesterol in 2009–10, and an 8 % increase in fibre in 2013–14.
Mean quality of at-home and away-from-home foods at baseline (2005–06) and changes across survey rounds, with their standard errors: US adults born between 1951 and 1980 participating in the 2005–2014 National Health and Nutrition Examination Survey

FAH, food at home; FAFH, food away from home.
Estimate is statistically significant: *P<0·05, **P<0·01.
Discussion
The current study explores recent changes in total daily energy intake, energy from FAFH, and intakes of fat, saturated fat, cholesterol and fibre among working-age adults between 2005 and 2014. This period begins before the most recent recession of 2007–09, spanning the downturn and most of the recovery. Despite falling unemployment between 2010 and 2012, the percentage of adults living in households with income below 130 % of the federal poverty line was highest in 2011–12. This could be due to the fact that the level of employment did not begin to increase until 2012( 13 ), which suggests that part of the decline in the unemployment rate between 2010 and 2012 was due to an exit from the labour force. Census Bureau estimates are consistent, finding that the share of the population living below 125 % of the federal poverty line peaked in recent years at 19·8 % in 2010 and 2011, and hovered between 19·7 and 19·2 % between 2012 and 2014( 25 ).
Although the changes in the share of working-age adults who were covered by health insurance were not statistically significant, they were consistent with a loss of insurance through employment during the recession and increases in access through employment and the Patient Protection and Affordable Care Act in later years.
Despite a brief decline in the consumption of FAFH among working-age adults following the Great Recession, intake of FAFH recovered to pre-recession levels between 2011 and 2014. The fact that the conditional change in the percentage of energy from fast foods between 2005 and 2014 was positive and significant, while the unconditional means were not statistically significant, indicates that working-age adults consumed a larger share of total energy from fast foods in 2013–14 than would be expected given observable characteristics. Thus, working-age adults greatly increased their consumption of fast foods after the recession.
In contrast, working-age adults decreased their intakes of cholesterol and saturated fat and increased fibre intake by small, but statistically significant, amounts. These estimated diet quality changes were robust to controlling for the increase in the consumption of fast foods and other FAFH. This suggests that the quality of the foods people consume away from home has also been changing. The findings indicate that most of the quality improvements were in at-home foods, with significant decreases in fat and saturated and fat, and increases in fibre, between 2009 and 2014 relative to 2005–06. The few significant changes in quality aspects of FAFH were smaller in magnitude and less consistent over the survey rounds.
The improvement in the quality of FAH may be the result of consumers making different choices as well as due to increases in the supply of higher-quality foods resulting from changes in dietary recommendations and labelling rules. For example, recent changes in whole-grain consumption recommendations in the 2005 Dietary Guidelines for Americans and the 2006 trans-fat labelling requirements have been linked to an increase in the supply of whole-grain products and a decrease in trans-fat-containing foods( Reference Mancino and Kuchler 21 , Reference Rahkovsky, Martinez and Kuchler 26 , Reference Otite, Jacobson and Dahmubed 27 ).
Although not all the changes in the quality of FAFH were statistically significant, the results suggest that the quality of FAFH is improving as well. This suggests that increased access to health insurance has not led to large-scale substitutions of medications to control diet-related health conditions over dietary management. Improvements in the quality of FAFH may also reflect the influence of recent menu labelling regulations. Beginning in 2008, some states and localities required the posting of the energy content of menu items in chain restaurants, while many other restaurants provided this information voluntarily. Between 2004 and 2010, the share of the largest chain restaurants that provided energy information increased from 44 to 61 %( Reference Wu and Sturm 28 ). The menu labelling rules established in response to the requirement in the Patient Protection and Affordable Care Act of 2010 were finalized in December 2015 and were set to take effect in May 2017, but were delayed by one year and may undergo further review and revision( 29 ). The current rule requires all chain restaurants with twenty or more national locations to post the energy content of their standard menu items using a standardized format in a place that is visible at the time food selections are made. This rule applies not only to traditional restaurants, but also to grocery store chains who maintain a standard offering of prepared foods for immediate consumption. This is expected to make it easier for consumers to identify lower-energy dishes in restaurants. Similar to food manufacturers in response to changes in package labelling rules, restaurants may also reformulate their menu options in order to lower the energy content of dishes. This could reduce energy intake, even among consumers who do not use posted energy information when making their selections.
The current analysis utilized data from NHANES, which are the best available data on food intake of individuals in the USA. The present study is the first to document changes in dietary intake among US working-age adults before and after the recovery from the Great Recession. Possible biases from a changing sample composition over the observation period were limited by defining the sample by estimated birth year rather than age at observation. Even though NHANES data are not a panel survey, its continuous fielding using a consistent sampling design to be representative of the USA allows for the data to be used to study trends in birth-year cohorts. Immigration into the USA produces small changes in the US population over time( 30 ) and the continuous sampling used in NHANES allows these new residents to enter the sample. The present study used multivariate regression to control for these small fluctuations in the working-age cohort over the study period.
There are some limitations to the study. Although changes in data collection methods in NHANES that occurred prior to the observation period improved the quality of the intake data, total energy intake was still found to be under-reported in the survey( Reference Archer, Hand and Blair 31 ). In addition, the analysis relied on one day of dietary intake, which may not reflect usual intake for any one individual. The fact that each person’s intake day was selected at random and that the study focused on the average changes in the cohorts examined should minimize any bias from using a single day of intake. The way in which total Na intake was calculated in NHANES changed in 2009–10, which prevented the analysis of changes in Na intake between 2005 and 2014( 32 ). Excess Na intake is linked to hypertension and CVD and is prevalent in the US population, making it a nutrient of public policy concern( Reference Jackson, King and Zhao 33 ). In addition, the study could not examine changes in added sugar because the Food Pattern Equivalent Database( 34 ) that provides this information had not been provided to the public at the time the present study was conducted. Since 2000, the Dietary Guidelines for Americans have emphasized the need to limit intake of added sugars( 35 ), yet nutrition labels on food packages have not listed the added sugar content of foods. The revised Nutrition Facts Label will require that the grams and percentage Daily Value of added sugar in foods be listed on packages, but the compliance date for this revision has not yet been set( 36 ).
The main analysis was limited to adults of prime working age (those born between 1951 and 1980), who consumed less FAFH as a share of total energy compared with younger adults in 2013–14. A complete analysis of changes among younger cohorts was not conducted because these individuals entered prime working age only in the final survey rounds. This younger cohort may have different dietary preferences and use nutritional information differently from older adults. As such, they may not be affected in the same way as older adults are by changes to package and menu labelling and dietary guidance. Future work could study the relationship between FAFH and dietary intake among younger cohorts as more data become available.
Conclusion
The present study found that as employment increased and unemployment fell following the Great Recession of 2007–09, US working-age adults resumed consuming FAFH at a level equal to that just before the recession began. FAFH makes up nearly one-third of all energy consumed among working-age adults and results in lower diet quality. The more FAFH, and specifically fast foods, consumed, the greater the intakes of fat and saturated fat, and the lower the intake of fibre. This is consistent with previous research that found that FAFH has lower nutritional quality, on average, than FAH. Despite increases in FAFH consumption, overall dietary quality as measured by cholesterol, saturated fat and fibre intakes improved slightly. Thus, there is no evidence to indicate that increased health insurance coverage over the period caused people to substitute medications for dietary management of health conditions. Improvements in the quality of FAH following changes to packaged food labelling rules and specific dietary guidance on consumption targets for high-fibre foods such as whole grains suggest that providing consumers more information on the nutritional content of FAFH could lead to improvements in the quality of FAFH and overall diet quality. Changes to intake can occur through purposeful consumer choices, as well as through unobserved reformulations of popular food items. FAFH is a larger share of total intake among younger adults, suggesting that they can gain the most from having full nutritional information available for FAFH.
Acknowledgements
Acknowledgements: The author thanks Michele Ver Ploeg for feedback on this paper, and Michelle Saksena, Abigail Okrent and Karen Hamrick for their comments on earlier versions of this research. Financial support: This research received no specific grant from any funding agency in the public, commercial or not-for-profit sectors. The views expressed are those of the author and should not be attributed to the Economic Research Service or the US Department of Agriculture. Conflict of interest: None. Authorship: J.E.T. conducted all aspects of the study: design, analysing the data and writing the article. Ethics of human subject participation: Not applicable.



