


1. Introduction
Evaporating droplets occur in a wide variety of practical applications such as, for example, in inkjet printing (Kuang, Wang & Song Reference Kuang, Wang and Song2014), DNA chip manufacturing (Dugas, Broutin & Souteyrand Reference Dugas, Broutin and Souteyrand2005), agricultural spraying (Tredenick et al. Reference Tredenick, Forster, Pethiyagoda, van Leeuwen and McCue2021), and disease diagnostics (Trantum, Wright & Haselton Reference Trantum, Wright and Haselton2012). As a consequence, various aspects of the problem have been subjected to extensive investigation in recent years, including the evolution of, the flow within, and the deposition of particles from, an evaporating droplet (see, for example, the review articles by Larson Reference Larson2014; Sefiane Reference Sefiane2014; Thiele Reference Thiele2014; Zhong, Crivoi & Duan Reference Zhong, Crivoi and Duan2015; Brutin & Starov Reference Brutin and Starov2018; Giorgiutti-Dauphiné & Pauchard Reference Giorgiutti-Dauphiné and Pauchard2018; Mampallil & Eral Reference Mampallil and Eral2018; Parsa, Harmand & Sefiane Reference Parsa, Harmand and Sefiane2018; Zang et al. Reference Zang, Tarafdar, Tarasevich, Choudhury and Dutta2019; Yang et al. Reference Yang, Jiang, Lyu, Ding and Man2021; Gelderblom, Diddens & Marin Reference Gelderblom, Diddens and Marin2022; Thampi & Basavaraj Reference Thampi and Basavaraj2023; Wilson & D’Ambrosio Reference Wilson and D’Ambrosio2023).
The evolution, and hence the lifetime, of an evaporating droplet depend on the physical mechanism(s) controlling the evaporation (see, for example, Wilson & D’Ambrosio Reference Wilson and D’Ambrosio2023) and the manner in which the geometry changes as it evaporates, typically called its mode of evaporation. In their pioneering work on the evaporation of sessile droplets, Picknett & Bexon (Reference Picknett and Bexon1977) identified two so-called ‘extreme’ modes of evaporation of a droplet, namely the constant contact radius (CR) mode, in which the contact line is pinned (i.e. fixed) to the substrate and the contact angle varies with time, and the constant contact angle (CA) mode, in which the contact line is unpinned (i.e. free to move) and the contact angle remains constant at a receding angle, and calculated the lifetime of a droplet undergoing diffusion-limited evaporation in both modes. In practice, droplets often evaporate in mixed modes of evaporation, such as, for example, the stick–slide (SS) mode that consists of a CR (i.e. ‘stick’) phase followed by a CA (i.e. ‘slide’) phase (see, for example, Nguyen & Nguyen Reference Nguyen and Nguyen2012a , Reference Nguyen and Nguyenb ; Nguyen et al. Reference Nguyen, Nguyen, Hampton, Xu, Huang and Rudolph2012; Dash & Garimella Reference Dash and Garimella2013; Stauber et al. Reference Stauber, Wilson, Duffy and Sefiane2014, Reference Stauber, Wilson, Duffy and Sefiane2015) or the stick–jump (SJ) mode that consists of alternating CR (i.e. ‘stick’) phases and short ‘jump’ phases in which the contact line rapidly recedes and the contact angle rapidly increases (see, for example, Orejon, Sefiane & Shanahan Reference Orejon, Sefiane and Shanahan2011; Dietrich et al. Reference Dietrich, Kooij, Zhang, Zandvliet and Lohse2015; Stauber Reference Stauber2015; Schofield et al. Reference Schofield, Wilson, Pritchard and Sefiane2018).
The vast majority of previous theoretical work on the flow within and deposition from an evaporating sessile droplet has focused on the case of a droplet with a pinned contact line, i.e. on a droplet evaporating in the CR mode. In particular, the ‘coffee-stain effect’ described by Deegan et al. (Reference Deegan, Bakajin, Dupont, Huber, Nagel and Witten1997, Reference Deegan, Bakajin, Dupont, Huber, Nagel and Witten2000), in which a ring deposit (i.e. the ‘coffee stain’) is formed near the contact line of a droplet, is due to the flow induced within a small, thin droplet evaporating in the CR mode that carries particles towards its pinned contact line as it evaporates (see, for example, Gelderblom et al. Reference Gelderblom, Diddens and Marin2022; Wilson & D’Ambrosio Reference Wilson and D’Ambrosio2023). The solutions for the flow within a small, thin, pinned droplet were given by Hu & Larson (Reference Hu and Larson2005) and Boulogne, Ingremeau & Stone (Reference Boulogne, Ingremeau and Stone2017) for diffusion-limited evaporation, and Deegan et al. (Reference Deegan, Bakajin, Dupont, Huber, Nagel and Witten2000) obtained an expression for the resulting mass of particles in the ring deposit under the assumption that the suspension of particles is sufficiently dilute that the presence of the particles does not affect the flow. Whilst Deegan et al. (Reference Deegan, Bakajin, Dupont, Huber, Nagel and Witten2000) considered basic diffusion-limited evaporation in which the local evaporative flux is largest at the contact line (theoretically square-root singular for the case of a thin droplet), the coffee-stain effect is very robust and also occurs for other forms of the local evaporative flux provided that the contact line is pinned, including spatially uniform evaporation (see, for example, Deegan et al. Reference Deegan, Bakajin, Dupont, Huber, Nagel and Witten2000; Zheng Reference Zheng2009; Boulogne et al. Reference Boulogne, Ingremeau and Stone2017), and even evaporative fluxes that approach zero at the contact line (see, for example, Deegan et al. Reference Deegan, Bakajin, Dupont, Huber, Nagel and Witten2000; D’Ambrosio et al. 2023). As a consequence, spatially uniform evaporation has sometimes been used to approximate diffusion-limited evaporation (see, for example, Zheng Reference Zheng2009; Man & Doi Reference Man and Doi2016; Mills Reference Mills2023) since it is simpler to analyse and predicts qualitatively similar behaviour to that of diffusion-limited evaporation for the flow within, and deposition from, an evaporating droplet with a pinned contact line (see, for example, Boulogne et al. Reference Boulogne, Ingremeau and Stone2017; D’Ambrosio et al. Reference D’Ambrosio, Wilson, Wray and Duffy2023; Mills Reference Mills2023). We note that there are a wide variety of types of deposit in addition to ring deposits that have been reported in previous studies and so, before discussing particle deposition further, we seek to clarify the terminology regarding these different deposit types. Figure 1 shows a sketch of different deposit types reported in the literature that will be discussed in the present work and the terminology that will be used to describe them throughout.
A sketch of different deposit types reported in the literature that will be discussed in the present work: top view schematic of (a) a ring deposit, (b) a concentric-ring deposit, (c) an inner-ring deposit, (d) a scattered inner deposit and (e) a spoke-like deposit, and cross-sectional views of (f) a dot deposit, (g) a peak deposit, (h) a dome deposit, (i) a doughnut deposit and (j) a near-uniform or uniform deposit. The dashed lines in (c) and (d) indicate the initial contact line of the droplet.

Various experimental studies have shown that contact-line motion can change the nature of the deposit that forms on the substrate after the evaporation of a droplet (i.e. it can change the deposit type). In particular, transitions from ring or concentric-ring deposits for droplets evaporating in the CR and the SJ modes of evaporation (i.e. when contact-line pinning occurs) to ‘dot’ deposits, i.e. deposits with radius significantly smaller than the initial contact radius of the droplet, ‘dome’ deposits, i.e. deposits that are distributed throughout the initial footprint of the droplet and that are more concentrated at the centre of the droplet than at the contact line, ‘doughnut’ deposits, i.e. deposits that have a small hole at the centre, and near-uniform or uniform deposits for droplets evaporating in the CA mode of evaporation (i.e. when no contact-line pinning occurs) have been reported by many authors (see, for example, Fukai et al. Reference Fukai, Ishizuka, Sakai, Kaneda, Morita and Takahara2006; Kaneda et al. Reference Kaneda, Ishizuka, Sakai, Fukai, Yasutake and Takahara2007; Kajiya et al. Reference Kajiya, Monteux, Narita, Lequeux and Doi2009; Biswas et al. Reference Biswas, Gawande, Bromberg and Sun2010; Patil et al. Reference Patil, Bange, Bhardwaj and Sharma2016; Das et al. Reference Das, Dey, Reddy and Sarma2017; Lee et al. Reference Lee, Fu, Tso and Chao2017; Thokchom et al. Reference Thokchom, Zhou, Kim, Ha and Kim2017; Kim et al. Reference Kim, Rokoni, Kaneelil, Cui, Han and Sun2019; Matavž et al. Reference Matavž, Uršič, Močivnik, Richter, Humar, Čopar, Malič and Bobnar2022).
It has been shown experimentally that the wettability of the substrate plays a key role with regards to contact-line motion, and hence the characteristics of the final deposit. Thokchom et al. (Reference Thokchom, Zhou, Kim, Ha and Kim2017) and Lee & Kim (Reference Lee and Kim2021) performed experiments on droplets evaporating on glass and silicon wafer substrates for which the initial contact angle of the droplet and the contact-line motion were altered by using different treatments of the substrate prior to evaporation. When the substrate was hydrophilic, i.e. when the initial contact angle was less than
 $\pi /2$
, they observed a transition from a ring deposit near the contact line when the droplet evaporated in the CR mode to either a uniform deposit or a doughnut deposit when the droplet evaporated in the CA mode with initial contact angle
$\pi /2$
, they observed a transition from a ring deposit near the contact line when the droplet evaporated in the CR mode to either a uniform deposit or a doughnut deposit when the droplet evaporated in the CA mode with initial contact angle
 $\pi /18$
or
$\pi /18$
or
 $\pi /6$
, respectively. On the other hand, when the substrate was hydrophobic, i.e. when the initial contact angle was greater than
$\pi /6$
, respectively. On the other hand, when the substrate was hydrophobic, i.e. when the initial contact angle was greater than
 $\pi /2$
, a dot deposit occurred, in agreement with previous studies (Biswas et al. Reference Biswas, Gawande, Bromberg and Sun2010; Chhasatia & Sun Reference Chhasatia and Sun2011). Matavž et al. (Reference Matavž, Uršič, Močivnik, Richter, Humar, Čopar, Malič and Bobnar2022) performed a similar study of evaporating ink droplets on silicon wafers coated with either a polymethyl methacrylate or polystyrene layer for which the initial contact angle was small (specifically, less than
$\pi /2$
, a dot deposit occurred, in agreement with previous studies (Biswas et al. Reference Biswas, Gawande, Bromberg and Sun2010; Chhasatia & Sun Reference Chhasatia and Sun2011). Matavž et al. (Reference Matavž, Uršič, Močivnik, Richter, Humar, Čopar, Malič and Bobnar2022) performed a similar study of evaporating ink droplets on silicon wafers coated with either a polymethyl methacrylate or polystyrene layer for which the initial contact angle was small (specifically, less than
 $\pi /9$
). They observed a transition from a ring deposit near the contact line when the droplet evaporated in the CR mode to a near-uniform deposit when the droplet evaporated in the CA mode. Moreover, Orejon et al. (Reference Orejon, Sefiane and Shanahan2011) showed that the presence of nanoparticles promoted different contact-line motion depending on the wettability of the substrate. Specifically, on hydrophilic substrates the droplet evaporated in a CR mode of evaporation and hence ring deposits were formed, whereas on hydrophobic substrates the droplet evaporated in a SJ mode of evaporation and hence concentric-ring deposits were formed.
$\pi /9$
). They observed a transition from a ring deposit near the contact line when the droplet evaporated in the CR mode to a near-uniform deposit when the droplet evaporated in the CA mode. Moreover, Orejon et al. (Reference Orejon, Sefiane and Shanahan2011) showed that the presence of nanoparticles promoted different contact-line motion depending on the wettability of the substrate. Specifically, on hydrophilic substrates the droplet evaporated in a CR mode of evaporation and hence ring deposits were formed, whereas on hydrophobic substrates the droplet evaporated in a SJ mode of evaporation and hence concentric-ring deposits were formed.
Additionally, it has been shown that the properties of the particles, such as their size and concentration within the liquid, can have an effect on the motion of the contact line, and hence on the deposition from an evaporating droplet. Yang, Li & Sun (Reference Yang, Li and Sun2014) demonstrated a transition from a ring deposit to a concentric-ring deposit from a droplet evaporating on a hydrophilic substrate by increasing the initial concentration of nanoparticles within the droplet, and a transition from ring and concentric-ring deposits to ‘spoke-like’ deposits, i.e. radial spokes from the contact line towards the centre of the droplet often with a thin residual ring at the initial contact line of the droplet, by increasing the size of the particles from
 $20$
to
$20$
to
 $200$
nm, which they attributed to partial contact-line pinning when the particles are larger. On the other hand, a ‘scattered inner’ deposit, i.e. a deposit that is scattered within the initial footprint of the droplet, or an ‘inner-ring’ deposit, i.e. a ring deposit within the initial footprint of the droplet, typically occurs after the complete evaporation of droplets containing microparticles due to an absence of contact-line pinning for most of the lifetime of the droplet (see, for example, Jung, Kim & Yoo Reference Jung, Kim and Yoo2009; Biswas et al. Reference Biswas, Gawande, Bromberg and Sun2010).
$200$
nm, which they attributed to partial contact-line pinning when the particles are larger. On the other hand, a ‘scattered inner’ deposit, i.e. a deposit that is scattered within the initial footprint of the droplet, or an ‘inner-ring’ deposit, i.e. a ring deposit within the initial footprint of the droplet, typically occurs after the complete evaporation of droplets containing microparticles due to an absence of contact-line pinning for most of the lifetime of the droplet (see, for example, Jung, Kim & Yoo Reference Jung, Kim and Yoo2009; Biswas et al. Reference Biswas, Gawande, Bromberg and Sun2010).
It is clear from the literature that the deposit from a droplet evaporating in the CA mode depends on the physics controlling the motion of the contact line. For example, situations which enhance the mobility of the contact line may also alter the dynamics of the evaporation and/or the flow within the droplet, such as, by placing the droplet on oil (Li et al. Reference Li, Diddens, Segers, Wijshoff, Versluis and Lohse2020), or on a heated substrate (Patil et al. Reference Patil, Bange, Bhardwaj and Sharma2016), or by applying an electric field to induce electrowetting (Eral et al. Reference Eral, Augustine, Duits and Mugele2011). Specifically, the aforementioned studies induce recirculatory flow which, coupled with contact line de-pinning, result in dot deposits, even for droplets with a small initial contact angle.
There has been some theoretical work on the flow within and deposition from a droplet evaporating with a moving contact line, however, the majority of these studies consider various approximations to the diffusion-limited model. In particular, exact solutions for the flow within a non-thin droplet evaporating with either a pinned or an unpinned contact line according to a modified version of the diffusion-limited model in which the singularity at the contact line when the contact angle satisfies
 $0\leqslant \theta \lt \pi /2$
is removed, were obtained by Masoud & Felske (Reference Masoud and Felske2009a
,
Reference Masoud and Felskeb
). In particular, they showed that whilst the flow is always directed from the centre to the edge of the droplet when the contact line is pinned, the flow is more complicated when the contact line is unpinned and undergoes qualitative changes as the contact angle varies. Freed-Brown (Reference Freed-Brown2014, Reference Freed-Brown2015) used a similar modelling approach to that of Deegan et al. (Reference Deegan, Bakajin, Dupont, Huber, Nagel and Witten2000) to investigate the deposition from a small, thin droplet undergoing spatially uniform evaporation in the CA mode. They showed that the flow is inwards towards the centre of the droplet, but that the contact line recedes faster than the flow within the droplet. Since the particles are advected by the flow within the droplet, this results in particles being captured by the receding contact line and the formation of a ‘peak’ deposit, i.e. deposits that are distributed throughout the initial footprint of the droplet and are significantly more concentrated at the centre of the droplet than at the contact line. They were also able to obtain an explicit expression for the density profile of the mass of particles on the substrate. Man & Doi (Reference Man and Doi2016) extended the model of Freed-Brown (Reference Freed-Brown2014) by considering the effect of contact-line friction and evaporation rate on the deposition resulting from a thin droplet undergoing spatially uniform evaporation. They observed a transition from a ring deposit when contact-line friction is high to a peak deposit when it is low, and found that the location of the ring deposit depends on the rate at which the droplet evaporates. In particular, an inner-ring deposit is formed when the rate of evaporation is sufficiently slow. Siregar, Kuerten & van der Geld (Reference Siregar, Kuerten and van der Geld2013) performed numerical simulations of the deposition from a thin droplet evaporating in the CR and CA modes according to the diffusion-limited model with an imposed thin precursor film and disjoining pressure to avoid the singularity in the local evaporative flux profile at the receding contact line. They found that in the CR mode the pinned contact line induces a convective flow from the centre of the droplet to its edge, resulting in the formation of a ring deposit near the contact line, in agreement with previous theoretical predictions by, for example, Deegan et al. (Reference Deegan, Bakajin, Dupont, Huber, Nagel and Witten2000), whereas in the CA mode the presence of the disjoining pressure deforms the droplet profile near the contact line such that a convective flow is induced towards the centre of the droplet. The convective flow dominates particle transport so that particles are advected towards the centre of the droplet, but the contact line recedes faster than the flow within the droplet, resulting in the formation of a peak deposit. More recently, Matavž et al. (Reference Matavž, Uršič, Močivnik, Richter, Humar, Čopar, Malič and Bobnar2022) studied the effect of contact-line mobility on the deposition from a thin droplet undergoing diffusion-limited evaporation by considering a power-law relationship between the contact angle and radius of the droplet. They simulated the deposition from a droplet by applying a fixed maximum concentration of particles within the droplet (which they term a ‘gelation concentration’) and observed a transition from a ring deposit when the contact line receded slowly to a dome deposit when the contact line receded quickly. They found good agreement between their results and those of experiments for evaporating droplets of different inks.
$0\leqslant \theta \lt \pi /2$
is removed, were obtained by Masoud & Felske (Reference Masoud and Felske2009a
,
Reference Masoud and Felskeb
). In particular, they showed that whilst the flow is always directed from the centre to the edge of the droplet when the contact line is pinned, the flow is more complicated when the contact line is unpinned and undergoes qualitative changes as the contact angle varies. Freed-Brown (Reference Freed-Brown2014, Reference Freed-Brown2015) used a similar modelling approach to that of Deegan et al. (Reference Deegan, Bakajin, Dupont, Huber, Nagel and Witten2000) to investigate the deposition from a small, thin droplet undergoing spatially uniform evaporation in the CA mode. They showed that the flow is inwards towards the centre of the droplet, but that the contact line recedes faster than the flow within the droplet. Since the particles are advected by the flow within the droplet, this results in particles being captured by the receding contact line and the formation of a ‘peak’ deposit, i.e. deposits that are distributed throughout the initial footprint of the droplet and are significantly more concentrated at the centre of the droplet than at the contact line. They were also able to obtain an explicit expression for the density profile of the mass of particles on the substrate. Man & Doi (Reference Man and Doi2016) extended the model of Freed-Brown (Reference Freed-Brown2014) by considering the effect of contact-line friction and evaporation rate on the deposition resulting from a thin droplet undergoing spatially uniform evaporation. They observed a transition from a ring deposit when contact-line friction is high to a peak deposit when it is low, and found that the location of the ring deposit depends on the rate at which the droplet evaporates. In particular, an inner-ring deposit is formed when the rate of evaporation is sufficiently slow. Siregar, Kuerten & van der Geld (Reference Siregar, Kuerten and van der Geld2013) performed numerical simulations of the deposition from a thin droplet evaporating in the CR and CA modes according to the diffusion-limited model with an imposed thin precursor film and disjoining pressure to avoid the singularity in the local evaporative flux profile at the receding contact line. They found that in the CR mode the pinned contact line induces a convective flow from the centre of the droplet to its edge, resulting in the formation of a ring deposit near the contact line, in agreement with previous theoretical predictions by, for example, Deegan et al. (Reference Deegan, Bakajin, Dupont, Huber, Nagel and Witten2000), whereas in the CA mode the presence of the disjoining pressure deforms the droplet profile near the contact line such that a convective flow is induced towards the centre of the droplet. The convective flow dominates particle transport so that particles are advected towards the centre of the droplet, but the contact line recedes faster than the flow within the droplet, resulting in the formation of a peak deposit. More recently, Matavž et al. (Reference Matavž, Uršič, Močivnik, Richter, Humar, Čopar, Malič and Bobnar2022) studied the effect of contact-line mobility on the deposition from a thin droplet undergoing diffusion-limited evaporation by considering a power-law relationship between the contact angle and radius of the droplet. They simulated the deposition from a droplet by applying a fixed maximum concentration of particles within the droplet (which they term a ‘gelation concentration’) and observed a transition from a ring deposit when the contact line receded slowly to a dome deposit when the contact line receded quickly. They found good agreement between their results and those of experiments for evaporating droplets of different inks.
Few theoretical studies have considered the deposition from a droplet in mixed modes of evaporation. Zigelman & Manor (Reference Zigelman and Manor2016) proposed an integral boundary condition to overcome the theoretical singularity at the contact line of the evaporating droplet and a finite solubility limit for the concentration of particles within the droplet (i.e. a gelation phase) to calculate the deposition from a droplet evaporating in the CR, CA and SJ modes. In particular, they predicted a ring deposit near the contact line when the droplet evaporates in the CR mode, in agreement with previous theoretical predictions by, for example, Deegan et al. (Reference Deegan, Bakajin, Dupont, Huber, Nagel and Witten2000); a peak deposit when the droplet evaporates in the CA mode and concentric-ring deposits when the droplet evaporates in the SJ mode. In related work, Fraštia et al. (Reference Fraštia, Archer and Thiele2011, Reference Fraštia, Archer and Thiele2012) numerically investigated the deposition from an evaporating thin film with SJ contact-line motion, and showed that the number and regularity of the deposited lines depend on the evaporation rate of the film and the initial concentration of particles within the film.
Thus, whilst the deposition of particles from a moving contact line is clearly of considerable interest, the majority of previous theoretical work considers only the CA mode and/or approximations to the diffusion-limited evaporation model. In addition, the peak deposit type predicted by various previous theoretical studies is not in agreement with the experimental observations discussed above. The aim of the present work is therefore to build upon the previous work in this area by studying the effect of contact-line motion on the deposition of particles from a sessile droplet undergoing diffusion-limited evaporation, considering four different modes of evaporation. Specifically, in § 2 we formulate a mathematical model for the evolution of, the flow within, and the deposition of particles from, a thin sessile droplet undergoing diffusion-limited evaporation. In § 3 we give a brief summary of the previously known theoretical results for the deposition of particles from a droplet evaporating in the CR mode. In § 4 we give new theoretical results for the deposition of particles from a droplet evaporating in the CA mode, and validate the present theoretical approach by comparing them with the experimental results in the literature described above. Then in §§ 5 and 6 we extend the analysis to two mixed modes of evaporation, namely the SS mode and the SJ mode, respectively, and validate the predictions of the present theoretical approach by comparing them with experimental results in the literature. Finally, in § 7 we summarise our main conclusions and indicate promising directions for future work.
2. Problem formulation
Consider a thin axisymmetric sessile droplet on a planar substrate undergoing quasi-static diffusion-limited evaporation into a quiescent atmosphere. We assume that the suspension of solid particles within the droplet is sufficiently dilute and that the particles are small and passive such that they do not affect the flow within the droplet. We refer the description to cylindrical polar coordinates (
 $\hat {r},\psi ,\hat {z})$
with
$\hat {r},\psi ,\hat {z})$
with
 $O\hat {z}$
along the axis of the droplet, perpendicular to the substrate at
$O\hat {z}$
along the axis of the droplet, perpendicular to the substrate at
 $\hat {z}=0$
, as sketched in figure 2. The contact radius, contact angle, free surface and volume of the droplet are denoted by
$\hat {z}=0$
, as sketched in figure 2. The contact radius, contact angle, free surface and volume of the droplet are denoted by
 $\hat {R}=\hat {R}(\hat {t})$
,
$\hat {R}=\hat {R}(\hat {t})$
,
 $\hat {\theta }=\hat {\theta }(\hat {t})$
,
$\hat {\theta }=\hat {\theta }(\hat {t})$
,
 $\hat {h}=\hat {h}(\hat {r},\hat {t})$
and
$\hat {h}=\hat {h}(\hat {r},\hat {t})$
and
 $\hat {V}=\hat {V}(\hat {t})$
, respectively, where
$\hat {V}=\hat {V}(\hat {t})$
, respectively, where
 $\hat {t}$
denotes time. The initial values of
$\hat {t}$
denotes time. The initial values of
 $\hat {R}$
,
$\hat {R}$
,
 $\hat {\theta }$
and
$\hat {\theta }$
and
 $\hat {V}$
at
$\hat {V}$
at
 $\hat {t}=0$
are denoted by
$\hat {t}=0$
are denoted by
 $\hat {R}_0$
,
$\hat {R}_0$
,
 $\hat {\theta }_0$
and
$\hat {\theta }_0$
and
 $\hat {V}_0$
, respectively. After the droplet is deposited onto the substrate at
$\hat {V}_0$
, respectively. After the droplet is deposited onto the substrate at
 $\hat {t}=0$
, its volume decreases due to evaporation into the atmosphere. We denote the time after which the droplet has completely evaporated, i.e. the lifetime of the droplet, by
$\hat {t}=0$
, its volume decreases due to evaporation into the atmosphere. We denote the time after which the droplet has completely evaporated, i.e. the lifetime of the droplet, by
 $\hat {t}_{\textit{CR}}$
,
$\hat {t}_{\textit{CR}}$
,
 $\hat {t}_{\textit{CA}}$
,
$\hat {t}_{\textit{CA}}$
,
 $\hat {t}_{\textit{SS}}$
and
$\hat {t}_{\textit{SS}}$
and
 $\hat {t}_{\textit{SJ}}$
for a droplet evaporating in the CR, CA, SS and SJ modes, respectively.
$\hat {t}_{\textit{SJ}}$
for a droplet evaporating in the CR, CA, SS and SJ modes, respectively.
Sketch of a thin axisymmetric particle-laden sessile droplet evaporating on a planar substrate. The droplet has contact radius
 $\hat {R}(\hat {t})$
, contact angle
$\hat {R}(\hat {t})$
, contact angle
 $\hat {\theta }(\hat {t})$
, free surface
$\hat {\theta }(\hat {t})$
, free surface
 $\hat {z}=\hat {h}(\hat {r},\hat {t})$
, and concentration of particles within the droplet
$\hat {z}=\hat {h}(\hat {r},\hat {t})$
, and concentration of particles within the droplet
 $\hat {\phi }(\hat {r},\hat {z},\hat {t})$
. The arrows indicate the local evaporative mass flux
$\hat {\phi }(\hat {r},\hat {z},\hat {t})$
. The arrows indicate the local evaporative mass flux
 $\hat {J}(\hat {r},\hat {t})$
.
$\hat {J}(\hat {r},\hat {t})$
.

We consider situations in which the droplet is thin, is sufficiently small that the effect of gravity is negligible, and the surface tension is sufficiently strong that the profile of the droplet evolves quasi-statically. More specifically, we consider situations in which the initial contact angle of the droplet
 $\hat {\theta }_0$
, as well as the appropriately defined Bond number
$\hat {\theta }_0$
, as well as the appropriately defined Bond number
 $ \textit{Bo}$
and capillary number
$ \textit{Bo}$
and capillary number
 $ \textit{Ca}$
, namely
$ \textit{Ca}$
, namely
 \begin{equation} \textit{Bo} =\dfrac {\hat {\rho }\hat {g}\hat {R}_0^2}{\hat {\sigma }} \quad \textrm{and} \quad \textit{Ca}=\dfrac {\hat {\mu }\hat {U}}{\hat {\theta }_0^3\hat {\sigma }}, \end{equation}
respectively, are all small and satisfy
 $\hat {\theta }_0^2,\textit{Bo}\ll \textit{Ca}\ll 1$
, where
$\hat {\theta }_0^2,\textit{Bo}\ll \textit{Ca}\ll 1$
, where
 $\hat {\rho }$
,
$\hat {\rho }$
,
 $\hat {\sigma }$
and
$\hat {\sigma }$
and
 $\hat {\mu }$
are the constant density, surface tension and viscosity of the fluid,
$\hat {\mu }$
are the constant density, surface tension and viscosity of the fluid,
 $\hat {g}$
denotes the magnitude of acceleration due to gravity, and
$\hat {g}$
denotes the magnitude of acceleration due to gravity, and
 $\hat {U}$
is the appropriate radial velocity scale (defined in § 2.2).
$\hat {U}$
is the appropriate radial velocity scale (defined in § 2.2).
In the present work we wish to determine the effect of contact-line motion on the deposition of particles from an evaporating sessile droplet. We therefore need to formulate and solve three coupled problems, namely, the evaporative problem for the concentration of vapour in the atmosphere, the hydrodynamic problem for the flow that is induced within the droplet, and the transport problem for the motion of particles within the droplet. We will now discuss each of these problems in turn.
2.1. The evaporative problem
According to the well-known diffusion-limited model (see, for example, Picknett & Bexon Reference Picknett and Bexon1977; Deegan et al. Reference Deegan, Bakajin, Dupont, Huber, Nagel and Witten1997; Popov Reference Popov2005; Dunn et al. Reference Dunn, Wilson, Duffy, David and Sefiane2009; Wilson & Duffy Reference Wilson and Duffy2022; Wilson & D’Ambrosio Reference Wilson and D’Ambrosio2023), the concentration of vapour in the atmosphere, denoted by
 $\hat {c}=\hat {c}(\hat {r},\hat {z},\hat {t})$
, satisfies Laplace’s equation subject to conditions of complete saturation at the free surface, no flux of vapour through the substrate and an appropriate ambient value in the far field.
$\hat {c}=\hat {c}(\hat {r},\hat {z},\hat {t})$
, satisfies Laplace’s equation subject to conditions of complete saturation at the free surface, no flux of vapour through the substrate and an appropriate ambient value in the far field.
For a thin droplet (
 $\hat {\theta }_0\ll 1$
) we non-dimensionalise and scale the variables appropriately according to
$\hat {\theta }_0\ll 1$
) we non-dimensionalise and scale the variables appropriately according to
 \begin{equation} (\hat {r},\hat {z})=\hat {R}_0 (r,\hat {\theta }_0z), \quad \hat {R}=\hat {R}_0R, \quad \hat {\theta }=\hat {\theta }_0\theta , \quad \hat {h}=\hat {\theta }_0\hat {R}_0h, \quad \hat {V}=\hat {\theta }_0\hat {R}_0^3V \end{equation}
for the droplet, and by
 \begin{align} (\hat {r},\hat {z})=\hat {R}_0 (r,z_{{a}}), \quad \hat {c}=\hat {c}_{\infty }+(\hat {c}_{\textit{sat}}-\hat {c}_{\infty })c, \quad \hat {J}=\dfrac {\hat {D}(\hat {c}_{\textit{sat}}-\hat {c}_{\infty })}{\hat {R}_0}J, \quad \hat {F}=\hat {D}(\hat {c}_{\textit{sat}}-\hat {c}_\infty )\hat {R}_0 F \end{align}
for the atmosphere, where
 $\hat {c}_{\textit{sat}}$
is the constant saturation concentration,
$\hat {c}_{\textit{sat}}$
is the constant saturation concentration,
 $\hat {c}_\infty$
is the constant ambient concentration,
$\hat {c}_\infty$
is the constant ambient concentration,
 $\hat {D}$
is the constant diffusion coefficient of vapour in the atmosphere, and
$\hat {D}$
is the constant diffusion coefficient of vapour in the atmosphere, and
 $\hat {J}=\hat {J}(\hat {r},\hat {t})$
and
$\hat {J}=\hat {J}(\hat {r},\hat {t})$
and
 $\hat {F}=\hat {F}(\hat {t})$
are the local and total evaporative mass fluxes from the droplet, respectively. Hence, in particular, the initial contact angle and initial contact radius of the droplet are both scaled to unity. Due to the different characteristic vertical length scalings in the thin droplet and in the atmosphere, we distinguish the vertical coordinates in the droplet and the atmosphere by denoting them by
$\hat {F}=\hat {F}(\hat {t})$
are the local and total evaporative mass fluxes from the droplet, respectively. Hence, in particular, the initial contact angle and initial contact radius of the droplet are both scaled to unity. Due to the different characteristic vertical length scalings in the thin droplet and in the atmosphere, we distinguish the vertical coordinates in the droplet and the atmosphere by denoting them by
 $z$
and
$z$
and
 $z_{{a}}$
, respectively.
$z_{{a}}$
, respectively.
Note that for the basic diffusion-limited model described here, the evaporative problem is decoupled from the thermal problem. This basic model has been extended by a number of authors to include a variety of additional physical effects, including coupling the thermal and evaporative problems by, for example, accounting for the temperature dependence of the saturation concentration (see, for example, Dunn et al. Reference Dunn, Wilson, Duffy, David and Sefiane2009; Ait Saada, Chikh & Tadrist Reference Ait Saada, Chikh and Tadrist2013) or surface tension (see, for example, Hu & Larson Reference Hu and Larson2005; Xu, Luo & Guo Reference Xu, Luo and Guo2012), but, for simplicity and clarity, in the present work we restrict our attention to the basic model.
The exact solution of the basic diffusion-limited model for a thin droplet is well known (see, for example, Wilson & Duffy Reference Wilson and Duffy2022) and leads to the familiar expression for the local evaporative flux
 $J$
, namely
$J$
, namely
 \begin{equation} J=\dfrac {2}{\pi \sqrt {R^2-r^2}}, \end{equation}
which is singular (but integrable) at the contact line of the droplet at
 $r=R$
. Integrating
$r=R$
. Integrating
 $J$
over the free surface of the droplet gives the total evaporative flux
$J$
over the free surface of the droplet gives the total evaporative flux
 $F=F(t)$
, namely
$F=F(t)$
, namely
 \begin{equation} F=2\pi \int _0^{R}{J\,r\;\text {d}r}=4R. \end{equation}
The droplet evolves according to the global mass-conservation condition
 \begin{equation} \dfrac {\text {d}V}{\text {d}t}=-F= -4R, \end{equation}
in which time has been non-dimensionalised by
 \begin{equation} \hat {t}=\dfrac {\hat {\rho }\hat {\theta }_{0}\hat {R}_0^2}{\hat {D}(\hat {c}_{\textit{sat}}-\hat {c}_{\infty })}t. \end{equation}
We note that the local and total evaporative fluxes,
 $J$
and
$J$
and
 $F$
, both depend on
$F$
, both depend on
 $t$
via their dependence on
$t$
via their dependence on
 $R=R(t)$
.
$R=R(t)$
.
2.2. The hydrodynamic problem
The pressure and velocity within the droplet, denoted by
 $\hat {p}=\hat {p}(\hat {r},\hat {z},\hat {t})$
and
$\hat {p}=\hat {p}(\hat {r},\hat {z},\hat {t})$
and
 $\hat {\mathbf{u}}=(\hat {u}(\hat {r},\hat {z},\hat {t}),0,\hat {w}(\hat {r},\hat {z},\hat {t}))$
, satisfy the usual mass-conservation and Stokes equations subject to the usual boundary conditions.
$\hat {\mathbf{u}}=(\hat {u}(\hat {r},\hat {z},\hat {t}),0,\hat {w}(\hat {r},\hat {z},\hat {t}))$
, satisfy the usual mass-conservation and Stokes equations subject to the usual boundary conditions.
We non-dimensionalise and scale the variables appropriately for the droplet according to
 \begin{equation} (\hat {u},\hat {w})=\hat {U} \kern-1pt \big(u,\hat {\theta }_0w\big ), \quad \hat {p}-\hat {p}_{{a}}=\dfrac {\hat {\sigma }\hat {\theta }_0} {\hat {R}_0}p, \end{equation}
where
 $\hat {p}_{{a}}$
is the constant atmospheric pressure and
$\hat {p}_{{a}}$
is the constant atmospheric pressure and
 $\hat {U}$
is the appropriate radial velocity scale which, for diffusion-limited evaporation, may be given by
$\hat {U}$
is the appropriate radial velocity scale which, for diffusion-limited evaporation, may be given by
 \begin{equation} \hat {U}=\dfrac {\hat {D}\!\left (\hat {c}_{\textit{sat}}-\hat {c}_\infty \right )}{\hat {\rho }\hat {\theta }_0\hat {R}_0} \end{equation}
(see, for example, Wray et al. Reference Wray, Wray, Duffy and Wilson2021).
We seek an asymptotic solution to the hydrodynamic problem in the form
 \begin{equation} (p,u,w)=\big (p^{(0)},u^{(0)},w^{(0)}\big )+ \textit{Ca} \big (p^{(1)},u^{(1)},w^{(1)}\big )+O\big (\hat {\theta }_0^2,\textit{Bo}, \textit{Ca}^2\big ). \end{equation}
Note that, as we shall show, the pressure
 $p$
is the only quantity required beyond leading order to describe the flow within the droplet and so, for clarity, henceforth we omit the ‘(0)’ superscript on all other leading-order quantities.
$p$
is the only quantity required beyond leading order to describe the flow within the droplet and so, for clarity, henceforth we omit the ‘(0)’ superscript on all other leading-order quantities.
At leading order, the Stokes equations yield
 $\partial p^{(0)}/\partial r=\partial p^{(0)}/\partial z=0$
, and hence the leading-order pressure is independent of
$\partial p^{(0)}/\partial r=\partial p^{(0)}/\partial z=0$
, and hence the leading-order pressure is independent of
 $r$
and
$r$
and
 $z$
, i.e.
$z$
, i.e.
 $p^{(0)}=p^{(0)}(t)$
, and is given by the normal stress condition at the free surface, namely
$p^{(0)}=p^{(0)}(t)$
, and is given by the normal stress condition at the free surface, namely
 \begin{equation} p^{(0)}=-\dfrac {1}{r}\dfrac {\partial }{\partial r}\left (r\dfrac {\partial h}{\partial r}\right ). \end{equation}
Since
 $p^{(0)}$
is independent of
$p^{(0)}$
is independent of
 $r$
, the mean curvature of the free surface of the droplet is therefore spatially constant and the free-surface profile
$r$
, the mean curvature of the free surface of the droplet is therefore spatially constant and the free-surface profile
 $h$
satisfies
$h$
satisfies
 \begin{equation} \dfrac {\partial }{\partial r}\left (\dfrac {1}{r}\dfrac {\partial }{\partial r}\left ( r\dfrac {\partial h}{\partial r}\right )\right )=0 \end{equation}
subject to
 $h(R,t)=0$
and
$h(R,t)=0$
and
 $\partial h/\partial r=-\theta$
at
$\partial h/\partial r=-\theta$
at
 $r=R$
, and an appropriate regularity condition at
$r=R$
, and an appropriate regularity condition at
 $r=0$
, and is therefore given by the familiar paraboloidal form
$r=0$
, and is therefore given by the familiar paraboloidal form
 \begin{equation} h=\dfrac {\theta \big(R^2-r^2\big)}{2R}. \end{equation}
Evaluating (2.11) using (2.13) yields
 $p^{(0)}=2\theta /R$
. The volume
$p^{(0)}=2\theta /R$
. The volume
 $V=V(t)$
of the droplet is given by
$V=V(t)$
of the droplet is given by
 \begin{equation} V=2\pi \int _0^{R}{h\,r\;\text {d}r}=\dfrac {\pi \theta R^3}{4}. \end{equation}
At first order, the Stokes equations reduce to
 \begin{equation} \dfrac {\partial ^2u}{\partial z^2}=\dfrac {\partial p^{(1)}}{\partial r}, \quad \dfrac {\partial p^{(1)}}{\partial z}=0 \end{equation}
(see, for example, Wray et al. Reference Wray, Wray, Duffy and Wilson2021). In particular, (2.15b
) shows that the first-order pressure
 $p^{(1)}$
is independent of
$p^{(1)}$
is independent of
 $z$
, i.e.
$z$
, i.e.
 $p^{(1)}=p^{(1)}(r,t)$
. The leading-order velocities satisfy the usual mass-conservation equation
$p^{(1)}=p^{(1)}(r,t)$
. The leading-order velocities satisfy the usual mass-conservation equation
 \begin{equation} \dfrac {1}{r}\dfrac {\partial (ru)}{\partial r}+\dfrac {\partial w}{\partial z}=0 ,\end{equation}
subject to no-slip and no-penetration conditions on the substrate
 \begin{equation} u=w=0 \quad \text{on} \quad z=0, \end{equation}
and the leading-order tangential stress condition on the free surface of the droplet
 \begin{equation} \dfrac {\partial u}{\partial z}=0 \quad \text{at} \quad z=h. \end{equation}
Solving (2.15) and (2.16) subject to (2.17) and (2.18) leads to
 \begin{align} u=\dfrac {1}{2}\dfrac {\partial p^{(1)}}{\partial r}\big (z^2-2hz\big ), \quad w=\dfrac {z^2}{6r}\left [\dfrac {\partial p^{(1)}}{\partial r}\left (3r\dfrac {\partial h}{\partial r}+3h-z\right ) +r\dfrac {\partial ^2p^{(1)}}{\partial r^2}\left (3h-z\right )\right ] \end{align}
(see, for example, Boulogne et al. Reference Boulogne, Ingremeau and Stone2017; D’Ambrosio et al. Reference D’Ambrosio, Wilson, Wray and Duffy2023).
The kinematic condition can be expressed as
 \begin{equation} \dfrac {\partial h}{\partial t}+\dfrac {1}{r}\dfrac {\partial (rQ)}{\partial r}=-J, \end{equation}
where
 $Q=Q(r,t)$
is the local radial volume flux of fluid, defined by
$Q=Q(r,t)$
is the local radial volume flux of fluid, defined by
 \begin{equation} Q=\int _0^h{u\;\text {d}z}=h\bar {u}, \end{equation}
where
 $\bar {u}=\bar {u}(r,t)$
is the depth-averaged radial velocity, defined by
$\bar {u}=\bar {u}(r,t)$
is the depth-averaged radial velocity, defined by
 \begin{equation} \bar {u}=\dfrac {1}{h}\int _0^h{u\;\text {d}z}. \end{equation}
Substituting the expression for
 $u$
given by (2.19a
) into (2.21) yields
$u$
given by (2.19a
) into (2.21) yields
 \begin{equation} Q=-\dfrac {h^3}{3}\frac {\partial p^{(1)}}{\partial r}. \end{equation}
We note that it will be convenient to rearrange and integrate (2.20) to express
 $Q$
as
$Q$
as
 \begin{equation} Q=-\dfrac {1}{r}\int _0^r{\left (J+\dfrac {\partial h}{\partial t}\right )\,\tilde {r}\;\text {d}\tilde {r}}. \end{equation}
It is also convenient to eliminate
 $p^{(1)}$
between (2.19) and (2.23) to give
$p^{(1)}$
between (2.19) and (2.23) to give
 \begin{align} u=\dfrac {3Q}{2h^3}\big (2hz-z^2\big ), \quad w=\dfrac {z^2}{2h^4r} \left [3Qr\dfrac {\partial h}{\partial r}\left (2h-z\right )-\left (Qh+rh\dfrac {\partial Q}{\partial r}\right )\left (3h-z\right )\right ]\!. \end{align}
Specifically,
 $u$
and
$u$
and
 $w$
can be determined by substituting known expressions for
$w$
can be determined by substituting known expressions for
 $h$
and
$h$
and
 $Q$
given by (2.13) and (2.24) into (2.25).
$Q$
given by (2.13) and (2.24) into (2.25).
2.3. The particle-transport problem
2.3.1. The concentration of particles
The motion of particles within the droplet is due to a combination of advection by the fluid flow and diffusion, and so the concentration of particles within the droplet, denoted by
 $\phi =\phi (r,z,t)$
(non-dimensionalised by the volume-averaged initial concentration of particles within the droplet,
$\phi =\phi (r,z,t)$
(non-dimensionalised by the volume-averaged initial concentration of particles within the droplet,
 $\bar {\phi }_0$
), satisfies the advection–diffusion equation subject to conditions of no flux of particles through either the substrate or the free surface of the droplet.
$\bar {\phi }_0$
), satisfies the advection–diffusion equation subject to conditions of no flux of particles through either the substrate or the free surface of the droplet.
We consider situations in which the diffusion of particles is weak relative to advection on the scale of the droplet. More specifically, for a thin droplet we assume that the reduced particle Péclet number,
 $\hat {\theta }_0^2{\textit{Pe}}$
, satisfies
$\hat {\theta }_0^2{\textit{Pe}}$
, satisfies
 \begin{equation} \hat {\theta }_0^2\ll \hat {\theta }_0^2{\textit{Pe}}\ll 1, \end{equation}
where
 $ \textit{Pe}$
is the appropriately defined particle Péclet number, namely
$ \textit{Pe}$
is the appropriately defined particle Péclet number, namely
 \begin{equation} \textit{Pe}=\dfrac {\hat {R}_0\hat {U}}{\hat {D}_{{p}}}=\dfrac {\hat {D}\big(\hat {c}_{\textit{sat}}-\hat {c}_\infty \big)}{\hat {\rho }\hat {\theta }_0\hat {D}_{{p}}}, \end{equation}
in which
 $\hat {D}_{{p}}$
is the constant diffusivity of particles in the fluid. In particular, (2.26) means that we are in a regime in which advection dominates radial particle transport. Previous studies have shown that the Péclet number is typically larger than unity in a wide range of situations involving different fluids, particle materials and particle sizes (see, for example, Moore, Vella & Oliver Reference Moore, Vella and Oliver2021), and so the condition (2.26) is physically realisable provided that the Péclet number is not too large (specifically, provided that
$\hat {D}_{{p}}$
is the constant diffusivity of particles in the fluid. In particular, (2.26) means that we are in a regime in which advection dominates radial particle transport. Previous studies have shown that the Péclet number is typically larger than unity in a wide range of situations involving different fluids, particle materials and particle sizes (see, for example, Moore, Vella & Oliver Reference Moore, Vella and Oliver2021), and so the condition (2.26) is physically realisable provided that the Péclet number is not too large (specifically, provided that
 $ \textit{Pe} \ll \hat {\theta }_0^{-2}$
) and that the droplet is sufficiently thin.
$ \textit{Pe} \ll \hat {\theta }_0^{-2}$
) and that the droplet is sufficiently thin.
As is well known (see, for example, Jensen & Grotberg Reference Jensen and Grotberg1993; Wray et al. Reference Wray, Papageorgiou, Craster, Sefiane and Matar2014; D’Ambrosio et al. Reference D’Ambrosio, Wilson, Wray and Duffy2023), when the particle Péclet number satisfies (2.26), the leading-order concentration of particles,
 $\phi =\phi (r,t)$
, is independent of
$\phi =\phi (r,t)$
, is independent of
 $z$
and satisfies
$z$
and satisfies
 \begin{equation} \dfrac {\partial \phi }{\partial t} +\bar {u}\dfrac {\partial \phi }{\partial r}=\dfrac {\phi J}{h}, \end{equation}
where the depth-averaged velocity
 $\bar {u}$
is given by (2.22).
$\bar {u}$
is given by (2.22).
Equation (2.28) may be solved via the method of characteristics, i.e.
 \begin{equation} \dfrac {\text {d}\phi }{\text {d}t}=\dfrac {J\phi }{h} \quad \text{on the characteristics determined by} \quad \dfrac {\text {d}r}{\text {d}t}=\bar {u}, \end{equation}
subject to a prescribed initial condition
 $\phi (r,0)=\phi _0(r)$
. For simplicity, in the remainder of the present work we assume that the initial concentration of particles within the droplet is spatially uniform, and so, as a consequence of our choice of scalings,
$\phi (r,0)=\phi _0(r)$
. For simplicity, in the remainder of the present work we assume that the initial concentration of particles within the droplet is spatially uniform, and so, as a consequence of our choice of scalings,
 $\phi _0(r)\equiv 1$
.
$\phi _0(r)\equiv 1$
.
2.3.2. The mass of particles
As the droplet evaporates, particles are advected towards the contact line by the flow within the droplet, resulting in a mass flux of particles into the contact line (see, for example, Deegan et al. Reference Deegan, Bakajin, Dupont, Huber, Nagel and Witten2000; Boulogne et al. Reference Boulogne, Ingremeau and Stone2017; D’Ambrosio et al. Reference D’Ambrosio, Wilson, Wray and Duffy2023). Hence, if a particle is advected by the flow into the contact line before the end of the evaporation then it is deposited onto the substrate and so, in general, the mass of particles within the bulk of the droplet will be a decreasing function of time. In the absence of particle–substrate adsorption (or any other similar physical mechanism) deposition onto the substrate via the contact line is the only way by which particles can leave the bulk of the droplet, and so the nature of the resulting deposit depends on the motion of the contact line. Specifically, during a CR phase particles that are advected into the contact line form a ring deposit at the fixed position of the pinned contact line, while during a CA phase they form a distributed deposit on the substrate in the region swept by the moving contact line. Figure 1(a)–(c) shows examples of ring deposits, while figure 1(d)–(j) shows examples of distributed deposits. As we shall show in the present analysis, depending upon the mode in which the droplet is evaporating, for diffusion–limited evaporation the final deposit may consist of a single ring deposit (see, for example, figure 1 a), multiple concentric-ring deposits (see, for example, figure 1 b), distributed deposits of near-uniform shape (see, for example, figure 1 j), or a combination thereof.
The mass of particles per unit area within the footprint of the droplet is
 $\phi h$
, and so the mass of particles in the bulk of the droplet at time
$\phi h$
, and so the mass of particles in the bulk of the droplet at time
 $t$
, denoted by
$t$
, denoted by
 $M_{\textit{drop}}=M_{\textit{drop}}(t)$
(non-dimensionalised by
$M_{\textit{drop}}=M_{\textit{drop}}(t)$
(non-dimensionalised by
 $\hat {\theta }_0\hat {R}_0^3\bar {\phi }_0$
), is given by
$\hat {\theta }_0\hat {R}_0^3\bar {\phi }_0$
), is given by
 \begin{equation} M_{\textit{drop}}=2\pi \int _0^{R(t)}{\phi (r,t)\,h(r,t)\,r\;\text {d}r}. \end{equation}
In particular, the initial mass of particles in the bulk of the droplet, denoted by
 $M_0=M_{\textit{drop}}(0)$
, is given by
$M_0=M_{\textit{drop}}(0)$
, is given by
 \begin{equation} M_0=2\pi \int _0^{1}{\phi _0(r)\,h(r,0)\,r\;\text {d}r}=\dfrac {\pi }{4}. \end{equation}
During a CR phase starting at
 $t=t_{{p}}$
in which the droplet has a pinned contact line located at
$t=t_{{p}}$
in which the droplet has a pinned contact line located at
 $r=R(t_{{p}}) \, (\leqslant 1)$
, the mass flux of particles from the bulk of the droplet into the fixed contact line is
$r=R(t_{{p}}) \, (\leqslant 1)$
, the mass flux of particles from the bulk of the droplet into the fixed contact line is
 \begin{equation} \lim _{r\to {R(t_{{p}})^{-}}}{2\pi \phi Qr}, \end{equation}
and therefore the mass of particles in the ring deposit located at
 $r=R(t_{{p}})$
at time
$r=R(t_{{p}})$
at time
 $t \, (\geqslant t_{{p}})$
, denoted by
$t \, (\geqslant t_{{p}})$
, denoted by
 $M_{\textit{ring}}=M_{\textit{ring}}(t)$
(also non-dimensionalised by
$M_{\textit{ring}}=M_{\textit{ring}}(t)$
(also non-dimensionalised by
 $\hat {\theta }_0\hat {R}_0^3\bar {\phi }_0$
), is given by
$\hat {\theta }_0\hat {R}_0^3\bar {\phi }_0$
), is given by
 \begin{equation} M_{\textit{ring}}=2\pi \int _{t_{{p}}}^{t}{\lim _{r\to {{R(t_{{p}})}^{-}}}{\phi (r,\tilde {t})\,Q(r,\tilde {t})\,r}\;\text {d}\tilde {t}}. \end{equation}
Note that
 $M_{\textit{drop}}$
given by (2.30) can be rewritten as
$M_{\textit{drop}}$
given by (2.30) can be rewritten as
 \begin{equation} M_{\textit{drop}}=2\pi \int _0^{r_0(R(t_{{p}}),t)}{\phi (r,t_{{p}})\,h(r,t_{{p}})\,r\;\text {d}r} \end{equation}
and
 $M_{\textit{ring}}$
given by (2.33) can be rewritten as
$M_{\textit{ring}}$
given by (2.33) can be rewritten as
 \begin{equation} M_{\textit{ring}}=2\pi \int _{r_0(R(t_{{p}}),t)}^{R(t_{{p}})}{\phi (r,t_{{p}})\,h(r,t_{{p}})\,r\;\text {d}r}, \end{equation}
where
 $r_0=r_0(R(t_{{p}}),t)$
denotes the initial radial position of particles at the beginning of the CR phase, i.e. at time
$r_0=r_0(R(t_{{p}}),t)$
denotes the initial radial position of particles at the beginning of the CR phase, i.e. at time
 $t=t_{{p}}$
, that reach the contact line at time
$t=t_{{p}}$
, that reach the contact line at time
 $t$
(i.e. whose positions satisfy
$t$
(i.e. whose positions satisfy
 $r(t)=R(t_{{p}})$
), and is determined by solving (2.29b
). Note that in the special case
$r(t)=R(t_{{p}})$
), and is determined by solving (2.29b
). Note that in the special case
 $t_{{p}}=0$
and
$t_{{p}}=0$
and
 $R(t_{{p}})=1$
the expression for
$R(t_{{p}})=1$
the expression for
 $M_{\textit{ring}}$
given by (2.35) is equivalent to the corresponding expression obtained by Deegan et al. (Reference Deegan, Bakajin, Dupont, Huber, Nagel and Witten2000) for a droplet evaporating in the CR mode.
$M_{\textit{ring}}$
given by (2.35) is equivalent to the corresponding expression obtained by Deegan et al. (Reference Deegan, Bakajin, Dupont, Huber, Nagel and Witten2000) for a droplet evaporating in the CR mode.
During a CA phase starting at
 $t=t_{\textit{d}}$
in which the droplet has a moving contact line located at
$t=t_{\textit{d}}$
in which the droplet has a moving contact line located at
 $r=R(t) \, (\leqslant R(t_{\textit{d}}) \leqslant 1)$
, the mass flux of particles from the bulk of the droplet into the moving contact line is
$r=R(t) \, (\leqslant R(t_{\textit{d}}) \leqslant 1)$
, the mass flux of particles from the bulk of the droplet into the moving contact line is
 \begin{equation} \lim _{r\to {R(t)^{-}}} 2\pi \phi hr\left (\bar {u}-\frac {\text {d} R}{\text {d} t}\right )\!, \end{equation}
and therefore the mass of particles in the distributed deposit at time
 $t \, (\geqslant t_{\textit{d}})$
, denoted by
$t \, (\geqslant t_{\textit{d}})$
, denoted by
 $M_{\textit{dist}}=M_{\textit{dist}}(t)$
(also non-dimensionalised by
$M_{\textit{dist}}=M_{\textit{dist}}(t)$
(also non-dimensionalised by
 $\hat {\theta }_0\hat {R}_0^3\bar {\phi }_0$
), is given by
$\hat {\theta }_0\hat {R}_0^3\bar {\phi }_0$
), is given by
 \begin{equation} M_{\textit{dist}}=2\pi \int _{t_{\textit{d}}}^{t}{\lim _{r\to {R(\tilde {t})}^{-}} \phi (r,\tilde {t})\,h(r,\tilde {t})\,r\left (\bar {u}(r,\tilde {t})-\dfrac {\text {d}R(\tilde {t})}{\text {d}\tilde {t}}\right ) \;\text {d}\tilde {t}}. \end{equation}
Note that
 $M_{\textit{drop}}$
given by (2.30) can be rewritten as
$M_{\textit{drop}}$
given by (2.30) can be rewritten as
 \begin{equation} M_{\textit{drop}}=2\pi \int _0^{r_0(R(t),t)}{\phi (r,t_{\textit{d}})\,h(r,t_{\textit{d}})\,r\;\text {d}r} \end{equation}
and
 $M_{\textit{dist}}$
given by (2.37) can be rewritten as
$M_{\textit{dist}}$
given by (2.37) can be rewritten as
 \begin{equation} M_{\textit{dist}}=2\pi \int _{r_0(R(t),t)}^{R(t_{\textit{d}})}{\phi (r,t_{\textit{d}})\,h(r,t_{\textit{d}})\,r\;\text {d}r}, \end{equation}
where
 $r_0=r_0(R(t),t)$
denotes the initial radial position of particles at the beginning of the CA phase, i.e. at time
$r_0=r_0(R(t),t)$
denotes the initial radial position of particles at the beginning of the CA phase, i.e. at time
 $t=t_{\textit{d}}$
, that reach the contact line at time
$t=t_{\textit{d}}$
, that reach the contact line at time
 $t$
(i.e. whose positions satisfy
$t$
(i.e. whose positions satisfy
 $r(t)=R(t)$
), and is determined by solving (2.29b
).
$r(t)=R(t)$
), and is determined by solving (2.29b
).
The expression for
 $M_{\textit{dist}}$
given by (2.39) can also be written as
$M_{\textit{dist}}$
given by (2.39) can also be written as
 \begin{equation} M_{\textit{dist}}=2\pi \int _{R(t)}^{R(t_{\textit{d}})}{\phi _{\textit{dist}}(r)\,r\;\text {d}r}, \end{equation}
where
 $\phi _{\textit{dist}}=\phi _{\textit{dist}}(r)$
(non-dimensionalised by
$\phi _{\textit{dist}}=\phi _{\textit{dist}}(r)$
(non-dimensionalised by
 $\hat {\theta }_0\hat {R}_0\bar {\phi }_0$
) is the density of the distributed deposit on the substrate in the annular region
$\hat {\theta }_0\hat {R}_0\bar {\phi }_0$
) is the density of the distributed deposit on the substrate in the annular region
 $R(t) \leqslant r \leqslant R(t_{\textit{d}})$
. An expression for
$R(t) \leqslant r \leqslant R(t_{\textit{d}})$
. An expression for
 $\phi _{\textit{dist}}$
can be obtained by differentiating (2.39) and (2.40) with respect to
$\phi _{\textit{dist}}$
can be obtained by differentiating (2.39) and (2.40) with respect to
 $R$
and equating the two expressions to give
$R$
and equating the two expressions to give
 \begin{equation} \phi _{\textit{dist}}(R)=\phi (r_0(R,t),t_{\textit{d}})\,h(r_0(R,t),t_{\textit{d}})\dfrac {r_0(R,t)}{R}\dfrac {\partial \left (r_0(R,t)\right )}{\partial R}. \end{equation}
Note that in the special case
 $t_{\textit{d}}=0$
and
$t_{\textit{d}}=0$
and
 $R(t_{\textit{d}})=1$
the expressions
$R(t_{\textit{d}})=1$
the expressions
 $M_{\textit{dist}}$
and
$M_{\textit{dist}}$
and
 $\phi _{\textit{dist}}$
given by (2.39) and (2.41), respectively, are equivalent to the corresponding expressions obtained by Freed-Brown (Reference Freed-Brown2014) for a droplet evaporating in the CA mode.
$\phi _{\textit{dist}}$
given by (2.39) and (2.41), respectively, are equivalent to the corresponding expressions obtained by Freed-Brown (Reference Freed-Brown2014) for a droplet evaporating in the CA mode.
In the following four sections we analyse the evolution of, the flow within, and the deposition from, a droplet evaporating in four different modes, namely the CR, CA, SS and SJ modes, respectively.
3. The CR mode
In this section, the well-known results for the evolution of, the flow within, and the deposition from, a droplet evaporating in the CR mode are summarised for completeness and to give context to the new results for the other three modes that follow.
3.1. The evolution of the droplet
For a droplet evaporating in the CR mode, i.e. with
 $R\equiv 1$
,
$R\equiv 1$
,
 $\theta =\theta (t)$
, (2.6) becomes
$\theta =\theta (t)$
, (2.6) becomes
 \begin{equation} \dfrac {\text {d}V}{\text {d}t}=\dfrac {\pi }{4}\dfrac {\text {d}\theta }{\text {d}t}=-4. \end{equation}
Solving (3.1) yields the well-known simple explicit evolution of the droplet, namely
 \begin{equation} \theta =1-\dfrac {16}{\pi }t, \end{equation}
with
 $h$
and
$h$
and
 $V$
given by (2.13) and (2.14), respectively, and hence the lifetime of the droplet
$V$
given by (2.13) and (2.14), respectively, and hence the lifetime of the droplet
 $t_{\textit{CR}}$
obtained by setting
$t_{\textit{CR}}$
obtained by setting
 $\theta (t_{\textit{CR}})=0$
is
$\theta (t_{\textit{CR}})=0$
is
 \begin{equation} t_{\textit{CR}}=\dfrac {\pi }{16} \end{equation}
(see, for example, Wilson & Duffy Reference Wilson and Duffy2022).
3.2. The flow within the droplet
Substituting the expressions for
 $J$
and
$J$
and
 $h$
given by (2.4) and (2.13), respectively, into (2.24) and evaluating the integral gives the following solution for
$h$
given by (2.4) and (2.13), respectively, into (2.24) and evaluating the integral gives the following solution for
 $Q$
and hence the depth-averaged velocity
$Q$
and hence the depth-averaged velocity
 $\bar {u}$
in the CR mode:
$\bar {u}$
in the CR mode:
 \begin{equation} Q=\dfrac {2}{\pi r}\Big [\sqrt {1-r^2}-\big (1-r^2\big )^2\Big ], \quad \bar {u}=\dfrac {4}{\pi \theta r}\Big [\big (1-r^2\big )^{-1/2} -\big (1-r^2\big )\Big ] \end{equation}
(see, for example, equations 11 and 12 in Gelderblom et al. Reference Gelderblom, Diddens and Marin2022). Note that
 $\bar {u}$
depends on time only through its dependence on
$\bar {u}$
depends on time only through its dependence on
 $\theta$
and so we will sometimes find it convenient to parametrise by
$\theta$
and so we will sometimes find it convenient to parametrise by
 $\theta$
rather than
$\theta$
rather than
 $t$
during a CR phase. This will be particularly useful when describing the deposition of particles from the droplet.
$t$
during a CR phase. This will be particularly useful when describing the deposition of particles from the droplet.
Figure 3 shows plots of
 $Q$
and
$Q$
and
 $\bar {u}$
given by (3.4) at different times for a droplet evaporating in the CR mode. In particular, figure 3 illustrates that
$\bar {u}$
given by (3.4) at different times for a droplet evaporating in the CR mode. In particular, figure 3 illustrates that
 $Q$
is independent of
$Q$
is independent of
 $t$
in the CR mode and that the depth-averaged radial velocity is outwards towards the contact line throughout the evaporation, i.e.
$t$
in the CR mode and that the depth-averaged radial velocity is outwards towards the contact line throughout the evaporation, i.e.
 $Q\geqslant 0$
and
$Q\geqslant 0$
and
 $\bar {u}\geqslant 0$
for all
$\bar {u}\geqslant 0$
for all
 $0\leqslant t\leqslant t_{\textit{CR}}$
. The solutions for the velocities
$0\leqslant t\leqslant t_{\textit{CR}}$
. The solutions for the velocities
 $u$
and
$u$
and
 $w$
can be obtained by substituting the expression for
$w$
can be obtained by substituting the expression for
 $Q$
given by (3.4) into (2.25). The resulting expressions are given by, for example, Boulogne et al. (Reference Boulogne, Ingremeau and Stone2017), but are omitted here for brevity.
$Q$
given by (3.4) into (2.25). The resulting expressions are given by, for example, Boulogne et al. (Reference Boulogne, Ingremeau and Stone2017), but are omitted here for brevity.
Plot of (a) the radial volume flux
 $Q$
and (b) the depth-averaged radial velocity
$Q$
and (b) the depth-averaged radial velocity
 $\bar {u}$
given by (3.4) at times
$\bar {u}$
given by (3.4) at times
 $t=(0$
,
$t=(0$
,
 $1/10$
, …,
$1/10$
, …,
 $9/10)\times t_{\textit{CR}}$
for a droplet evaporating in the CR mode. The arrow in (b) indicates the direction of increasing
$9/10)\times t_{\textit{CR}}$
for a droplet evaporating in the CR mode. The arrow in (b) indicates the direction of increasing
 $t$
.
$t$
.

3.3. The deposition of particles
For a droplet evaporating in the CR mode, the characteristic equations (2.29) may be used to write
 \begin{equation} \dfrac {\text {d}r}{\text {d}\theta }=\dfrac {\text {d}r/\text {d}t}{\text {d}\theta /\text {d}t}= \dfrac {\bar {u}}{\text {d}\theta /\text {d}t}, \quad \dfrac {\text {d}\phi }{\text {d}\theta }=\dfrac {\text {d}\phi /\text {d}t}{\text {d}\theta /\text {d}t} =\dfrac { J\phi }{h\, \text {d}\theta /\text {d}t}, \end{equation}
subject to the initial condition
 $\phi _0(r)=1$
. Substituting the expressions for
$\phi _0(r)=1$
. Substituting the expressions for
 $J$
,
$J$
,
 $h$
,
$h$
,
 $\text {d}\theta /\text {d}t$
and
$\text {d}\theta /\text {d}t$
and
 $\bar {u}$
from (2.4), (2.13), (3.1) and (3.4b
) into (3.5) gives
$\bar {u}$
from (2.4), (2.13), (3.1) and (3.4b
) into (3.5) gives
 \begin{equation} \dfrac {\text {d}r}{\text {d}\theta }=-\dfrac {1}{4\theta r}\Big [\big (1-r^2\big )^{-1/2}-\big (1-r^2\big )\Big ], \quad \dfrac {\text {d}\phi }{\text {d}\theta }=-\dfrac {\phi }{4\theta }\big (1-r^2\big )^{-3/2}. \end{equation}
Note that (3.6a ) is separable and using separation of variables gives
 \begin{equation} r_0(r,t)=\sqrt {1-\theta ^{1/2}\left (\theta ^{-3/4}-1+\big (1-r^2\big )^{3/2}\right )^{2/3}}, \end{equation}
where
 $r_0=r_0(r,t)$
denotes the initial radial position of particles at the beginning of evaporation, i.e. at time
$r_0=r_0(r,t)$
denotes the initial radial position of particles at the beginning of evaporation, i.e. at time
 $t=0$
, that are at radial position
$t=0$
, that are at radial position
 $r$
at time
$r$
at time
 $t$
. In particular, the time it takes for particles at initial position
$t$
. In particular, the time it takes for particles at initial position
 $r_0$
to travel to the pinned contact line, i.e. to
$r_0$
to travel to the pinned contact line, i.e. to
 $r=1$
, where they are then deposited into the ring deposit, defined by
$r=1$
, where they are then deposited into the ring deposit, defined by
 $t=t_{\textit{ring}}$
, is given implicitly by
$t=t_{\textit{ring}}$
, is given implicitly by
 $r_0(1,t_{\textit{ring}})$
, which is determined by setting
$r_0(1,t_{\textit{ring}})$
, which is determined by setting
 $r=1$
in (3.7) to yield
$r=1$
in (3.7) to yield
 \begin{equation} r_0(1,t_{\textit{ring}})=\sqrt {1-\left (1-\theta ^{3/4}\right )^{2/3}}, \end{equation}
where
 $\theta$
is given by (3.2) in the CR mode. Substituting the expression for
$\theta$
is given by (3.2) in the CR mode. Substituting the expression for
 $r$
given implicitly by (3.7) into (3.6b
), it may be shown that
$r$
given implicitly by (3.7) into (3.6b
), it may be shown that
 $\phi$
is given parametrically by
$\phi$
is given parametrically by
 \begin{equation} \phi =\left [\dfrac {\left (1-r_0^2\right )^{3/2}}{\theta ^{3/4}-1+\left (1-r_0^2\right )^{3/2}}\right ]^{1/3}. \end{equation}
Finally, eliminating
 $r_0$
between (3.7) and (3.9) yields an explicit expression for the concentration of particles within the droplet evaporating in the CR mode
$r_0$
between (3.7) and (3.9) yields an explicit expression for the concentration of particles within the droplet evaporating in the CR mode
 \begin{equation} \phi =\left [1+\big (1-r^2\big )^{-3/2}\big (\theta ^{-3/4}-1\big )\right ]^{1/3} \end{equation}
(see, for example, Zheng Reference Zheng2009; D’Ambrosio et al. Reference D’Ambrosio, Wilson, Wray and Duffy2023). The concentration of particles
 $\phi$
is a monotonically increasing function of
$\phi$
is a monotonically increasing function of
 $r$
that takes its minimum value at
$r$
that takes its minimum value at
 $r=0$
and is singular at the pinned contact line throughout the evaporation, i.e.
$r=0$
and is singular at the pinned contact line throughout the evaporation, i.e.
 $\phi =O ((1-r)^{-1/2} )\to \infty$
as
$\phi =O ((1-r)^{-1/2} )\to \infty$
as
 $r\to 1^{-}$
for all
$r\to 1^{-}$
for all
 $0\lt t\lt t_{\textit{CR}}$
. Further discussion regarding the behaviour of
$0\lt t\lt t_{\textit{CR}}$
. Further discussion regarding the behaviour of
 $\phi$
and
$\phi$
and
 $\phi h$
in the CR mode is given by D’Ambrosio et al. (Reference D’Ambrosio, Wilson, Wray and Duffy2023).
$\phi h$
in the CR mode is given by D’Ambrosio et al. (Reference D’Ambrosio, Wilson, Wray and Duffy2023).
Substituting
 $t_{{p}}\equiv 0$
,
$t_{{p}}\equiv 0$
,
 $R(t_{{p}})\equiv 1$
, and the expression for
$R(t_{{p}})\equiv 1$
, and the expression for
 $r_0(1,t_{\textit{ring}})$
given by (3.8) into (2.34) and evaluating the integral yields an explicit expression for the mass of particles in the bulk of the droplet, namely
$r_0(1,t_{\textit{ring}})$
given by (3.8) into (2.34) and evaluating the integral yields an explicit expression for the mass of particles in the bulk of the droplet, namely
 \begin{equation} M_{\textit{drop}}= 2\pi \int _0^{r_0(1,t_{\textit{ring}})}{h(r,0)\,r\;\text {d}r}=M_0\left [1-\big (1-\theta ^{3/4}\big )^{4/3}\right ]\!, \end{equation}
where the initial mass of particles in the droplet is given by (2.31) to be
 $M_0=\pi /4$
. The mass of particles in the ring deposit from (2.35) is given by
$M_0=\pi /4$
. The mass of particles in the ring deposit from (2.35) is given by
 \begin{equation} M_{\textit{ring}}=2\pi \int _{r_0(1,t_{\textit{ring}})}^1{h(r,0)\,r\;\text {d}r}= M_0\big (1-\theta ^{3/4}\big )^{4/3} \end{equation}
(see, for example, Deegan et al. Reference Deegan, Bakajin, Dupont, Huber, Nagel and Witten2000; Boulogne et al. Reference Boulogne, Ingremeau and Stone2017). For a droplet evaporating in the CR mode, the contact line never de-pins and therefore
 $M_{\textit{dist}}\equiv 0$
. Adding together the expressions for
$M_{\textit{dist}}\equiv 0$
. Adding together the expressions for
 $M_{\textit{drop}}$
and
$M_{\textit{drop}}$
and
 $M_{\textit{ring}}$
given by (3.11) and (3.12), respectively, and recalling that
$M_{\textit{ring}}$
given by (3.11) and (3.12), respectively, and recalling that
 $M_{\textit{dist}}\equiv 0$
confirms that the total mass of particles is conserved as the droplet evaporates, i.e. that
$M_{\textit{dist}}\equiv 0$
confirms that the total mass of particles is conserved as the droplet evaporates, i.e. that
 $M_{\textit{drop}}+M_{\textit{ring}}+M_{\textit{dist}}=M_0$
.
$M_{\textit{drop}}+M_{\textit{ring}}+M_{\textit{dist}}=M_0$
.
Figure 4 shows a plot of the evolutions of
 $M_{\textit{drop}}/M_0$
and
$M_{\textit{drop}}/M_0$
and
 $M_{\textit{ring}}/M_0$
given by (3.11) and (3.12), respectively, as functions of
$M_{\textit{ring}}/M_0$
given by (3.11) and (3.12), respectively, as functions of
 $t/t_{\textit{CR}}$
for a droplet evaporating in the CR mode. In particular, as figure 4 shows, all of the particles are eventually deposited into a single ring deposit at
$t/t_{\textit{CR}}$
for a droplet evaporating in the CR mode. In particular, as figure 4 shows, all of the particles are eventually deposited into a single ring deposit at
 $r=1$
in the CR mode, i.e.
$r=1$
in the CR mode, i.e.
 $M_{\textit{drop}}(t_{\textit{CR}})=0$
and
$M_{\textit{drop}}(t_{\textit{CR}})=0$
and
 $M_{\textit{ring}}(t_{\textit{CR}})=M_0=\pi /4$
.
$M_{\textit{ring}}(t_{\textit{CR}})=M_0=\pi /4$
.


4. The CA mode
4.1. The evolution of the droplet
For a droplet evaporating in the CA mode, i.e. with
 $R=R(t)$
,
$R=R(t)$
,
 $\theta \equiv 1$
, (2.6) becomes
$\theta \equiv 1$
, (2.6) becomes
 \begin{equation} \dfrac {\text {d}V}{\text {d}t}=\dfrac {3\pi R^2}{4}\dfrac {\text {d}R}{\text {d}t}=-4R. \end{equation}
In particular, from (4.1), the rate at which the contact line is receding is then given by
 \begin{equation} \dfrac {\text {d}R}{\text {d}t}=-\dfrac {16}{3\pi R}. \end{equation}
Solving (4.2) yields the well-known explicit evolution of the droplet, namely
 \begin{equation} R=\sqrt {1-\dfrac {32}{3\pi }t}, \end{equation}
with
 $h$
and
$h$
and
 $V$
given by (2.13) and (2.14), respectively, and hence the lifetime of the droplet
$V$
given by (2.13) and (2.14), respectively, and hence the lifetime of the droplet
 $t_{\textit{CA}}$
obtained by setting
$t_{\textit{CA}}$
obtained by setting
 $R(t_{\textit{CA}})=0$
is
$R(t_{\textit{CA}})=0$
is
 \begin{equation} t_{\textit{CA}}=\dfrac {3\pi }{32} \end{equation}
(see, for example, Wilson & Duffy Reference Wilson and Duffy2022).
4.2. The flow within the droplet
Substituting the expressions for
 $J$
and
$J$
and
 $h$
given by (2.4) and (2.13), respectively, into (2.24) and evaluating the integral gives the following solution for
$h$
given by (2.4) and (2.13), respectively, into (2.24) and evaluating the integral gives the following solution for
 $Q$
in the CA mode:
$Q$
in the CA mode:
 \begin{equation} Q=\dfrac {2R}{\pi r}\left [\sqrt {1-\dfrac {r^2}{R^2}}-\left (1+\dfrac {r^2}{3R^2}\right ) \left (1-\dfrac {r^2}{R^2}\right )\right ]\!, \end{equation}
and hence the corresponding depth-averaged velocity
 $\bar {u}$
is
$\bar {u}$
is
 \begin{equation} \bar {u}=\dfrac {4}{\pi r}\left [\left (1-\dfrac {r^2}{R^2}\right )^{-1/2} -\left (1+\dfrac {r^2}{3R^2}\right )\right ] \end{equation}
(see, for example, equations 18 and 19 in Gelderblom et al. Reference Gelderblom, Diddens and Marin2022). Note that
 $\bar {u}$
depends on time only through its dependence on
$\bar {u}$
depends on time only through its dependence on
 $R$
and so we will sometimes find it convenient to parametrise by
$R$
and so we will sometimes find it convenient to parametrise by
 $R$
rather than
$R$
rather than
 $t$
during a CA phase. As in the CR mode, this will be particularly useful when describing the deposition of particles from the droplet.
$t$
during a CA phase. As in the CR mode, this will be particularly useful when describing the deposition of particles from the droplet.


Figure 5 shows plots of
 $Q$
given by (4.5) and
$Q$
given by (4.5) and
 $\bar {u}$
given by (4.6) at different times for a droplet evaporating in the CA mode. In particular, figure 5 shows that the depth-averaged radial velocity is outwards towards the contact line throughout the evaporation, i.e.
$\bar {u}$
given by (4.6) at different times for a droplet evaporating in the CA mode. In particular, figure 5 shows that the depth-averaged radial velocity is outwards towards the contact line throughout the evaporation, i.e.
 $Q\geqslant 0$
and
$Q\geqslant 0$
and
 $\bar {u}\geqslant 0$
for all
$\bar {u}\geqslant 0$
for all
 $0\leqslant t\leqslant t_{\textit{CA}}$
. In addition, while
$0\leqslant t\leqslant t_{\textit{CA}}$
. In addition, while
 $Q$
approaches zero at
$Q$
approaches zero at
 $r=0$
and
$r=0$
and
 $r=R$
,
$r=R$
,
 $\bar {u}$
approaches zero at
$\bar {u}$
approaches zero at
 $r=0$
but is square-root singular at the receding contact line throughout the evaporation. As discussed by Gelderblom et al. (Reference Gelderblom, Diddens and Marin2022), this behaviour for the depth-averaged radial flow is qualitatively similar to that for a droplet evaporating in the CR mode given in § 3.2. Moreover, the prediction of depth-averaged outward radial flow differs from the corresponding prediction of the spatially uniform evaporation model, for which the flow is inwards, as discussed in § 1. A comparison between the resulting transport of particles will be discussed in § 4.4.
$r=0$
but is square-root singular at the receding contact line throughout the evaporation. As discussed by Gelderblom et al. (Reference Gelderblom, Diddens and Marin2022), this behaviour for the depth-averaged radial flow is qualitatively similar to that for a droplet evaporating in the CR mode given in § 3.2. Moreover, the prediction of depth-averaged outward radial flow differs from the corresponding prediction of the spatially uniform evaporation model, for which the flow is inwards, as discussed in § 1. A comparison between the resulting transport of particles will be discussed in § 4.4.
Substituting the expressions for
 $h$
and
$h$
and
 $Q$
from (2.13) and (4.5) into (2.25) yields the solutions for the velocities
$Q$
from (2.13) and (4.5) into (2.25) yields the solutions for the velocities
 $u$
and
$u$
and
 $w$
, namely
$w$
, namely
 \begin{equation} u=\dfrac {24z}{\pi r R}\left (1-\dfrac {r^2}{R^2}\right )^{-2}\left [\left (1-\dfrac {r^2}{R^2}\right )^{-1/2} -\left (1+\dfrac {r^2}{3R^2}\right )\right ]\left (1-\dfrac {r^2}{R^2}-\dfrac {z}{R}\right ) \end{equation}
and
 \begin{align} w&=\dfrac {8z^2}{\pi R^3}\left (1-\dfrac {r^2}{R^2}\right )^{-3}\left [4\left (1-\dfrac {r^2}{R^2}\right )-\dfrac {9}{2}\sqrt {1-\dfrac {r^2}{R^2}}-\dfrac {2z}{3R}\left (7+\dfrac {r^2}{R^2}\right )\right . \nonumber\\&\qquad \qquad \qquad \qquad \qquad \quad \left . - \dfrac {5z}{R}\left (1-\dfrac {r^2}{R^2}\right )^{-1/2}\right ]\!. \end{align}
Figure 6(a) shows instantaneous streamlines of the flow within a droplet evaporating in the CA mode for diffusion-limited evaporation calculated from (4.7) and (4.8) at
 $t=t_{\textit{CA}}/2=3\pi /64$
. As figure 6(a) illustrates, the flow is outwards and downwards towards the receding contact line everywhere within the droplet.
$t=t_{\textit{CA}}/2=3\pi /64$
. As figure 6(a) illustrates, the flow is outwards and downwards towards the receding contact line everywhere within the droplet.


4.3. The deposition of particles
For a droplet evaporating in the CA mode, the characteristic equations (2.29) may be used to write
 \begin{equation} \dfrac {\text {d}r}{\text {d}R}=\dfrac {\text {d}r/\text {d}t}{\text {d}R/\text {d}t}= \dfrac {\bar {u}}{\text {d}R/\text {d}t}, \quad \dfrac {\text {d}\phi }{\text {d}R}=\dfrac {\text {d}\phi /\text {d}t}{\text {d}R/\text {d}t} =\dfrac { J\phi }{h\, \text {d}R/\text {d}t}, \end{equation}
subject to the initial condition
 $\phi _0(r)=1$
. Substituting the expressions for
$\phi _0(r)=1$
. Substituting the expressions for
 $J$
,
$J$
,
 $h$
,
$h$
,
 $\text {d}R/\text {d}t$
and
$\text {d}R/\text {d}t$
and
 $\bar {u}$
from (2.4), (2.13), (4.2) and (4.6) into (4.9) gives
$\bar {u}$
from (2.4), (2.13), (4.2) and (4.6) into (4.9) gives
 \begin{equation} \dfrac {\text {d}r}{\text {d}R}=\dfrac {3R}{4r}\left [\left (1+\dfrac {r^2}{3R^2}\right )- \left (1-\dfrac {r^2}{R^2}\right )^{-1/2} \right ]\!, \quad \dfrac {\text {d}\phi }{\text {d}R}=-\dfrac {3\phi }{4R}\left (1-\dfrac {r^2}{R^2}\right )^{-3/2}. \end{equation}
Using the substitution
 $\zeta =r/R$
, (4.10a
) becomes separable in
$\zeta =r/R$
, (4.10a
) becomes separable in
 $R$
and
$R$
and
 $\zeta$
and may be rewritten as
$\zeta$
and may be rewritten as
 \begin{equation} \int _{1}^{R}{\dfrac {1}{\hat {R}}\,\text {d}\hat {R}}=\int _{\zeta _0}^{\zeta }{\dfrac {4\hat {\zeta }\sqrt {1-\hat {\zeta }^2}} {3\left [\big (1-\hat {\zeta }^2\big )^{3/2}-1\right ]} \,\text {d}\hat {\zeta }}, \end{equation}
where
 $\zeta _0\equiv r_0(r,t)$
denotes the initial radial position of particles at the beginning of evaporation, i.e. at time
$\zeta _0\equiv r_0(r,t)$
denotes the initial radial position of particles at the beginning of evaporation, i.e. at time
 $t=0$
, that are at radial position
$t=0$
, that are at radial position
 $r$
at time
$r$
at time
 $t$
. Performing the integral in (4.11) and eliminating
$t$
. Performing the integral in (4.11) and eliminating
 $\zeta$
gives
$\zeta$
gives
 \begin{equation} r_0(r,t)=\sqrt {1-R^{3/2}\left (R^{-9/4}-1+\left (1-\dfrac {r^2}{R^2}\right )^{3/2}\right )^{2/3}}. \end{equation}
The time it takes for particles at initial position
 $r_0$
to travel to the receding contact line, i.e. to
$r_0$
to travel to the receding contact line, i.e. to
 $r=R$
, where they are then deposited in the distributed deposit, defined by
$r=R$
, where they are then deposited in the distributed deposit, defined by
 $t=t_{\textit{dist}}$
, is given implicitly by
$t=t_{\textit{dist}}$
, is given implicitly by
 $r_0(R,t_{\textit{dist}})$
, namely
$r_0(R,t_{\textit{dist}})$
, namely
 \begin{equation} r_0(R,t_{\textit{dist}})=\sqrt {1-\left (1-R^{9/4}\right )^{2/3}}. \end{equation}
Substituting the expression for
 $r$
given implicitly by (4.12) into (4.10b
) the equation becomes separable and may be rewritten as
$r$
given implicitly by (4.12) into (4.10b
) the equation becomes separable and may be rewritten as
 \begin{equation} \int _{1}^{\phi }{\dfrac {1}{\hat {\phi }}\,\text {d}\hat {\phi }}=-\int _{1}^{R}{\dfrac {3\hat {R}^{5/4}} {4\left [\hat {R}^{9/4}-1+\left (1-r_0^2\right )^{3/2}\right ]}\text {d}\hat {R}}, \end{equation}
and performing the integral shows that
 $\phi$
is given parametrically by
$\phi$
is given parametrically by
 \begin{equation} \phi =\left [\dfrac {\left (1-r_0^2\right )^{3/2}}{R^{9/4}-1+\left (1-r_0^2\right )^{3/2}}\right ]^{1/3}. \end{equation}
Plot of (a) the concentration of particles
 $\phi$
and (b) the mass per unit area
$\phi$
and (b) the mass per unit area
 $\phi h$
within the droplet as functions of
$\phi h$
within the droplet as functions of
 $r$
at
$r$
at
 $t=(0$
,
$t=(0$
,
 $1/10$
, …,
$1/10$
, …,
 $9/10)\times t_{\textit{CA}}$
for a droplet evaporating in the CA mode. The dashed lines correspond to the initial values of (a) the concentration of particles given by
$9/10)\times t_{\textit{CA}}$
for a droplet evaporating in the CA mode. The dashed lines correspond to the initial values of (a) the concentration of particles given by
 $\phi _0(r)=1$
and (b) the mass of particles given by
$\phi _0(r)=1$
and (b) the mass of particles given by
 $\phi _0(r)h(r,0)=(1-r^2)/2$
, and the arrows indicate the direction of increasing
$\phi _0(r)h(r,0)=(1-r^2)/2$
, and the arrows indicate the direction of increasing
 $t$
.
$t$
.

Finally, eliminating
 $r_0$
between (4.12) and (4.15) yields an explicit expression for the concentration of particles within the droplet, namely
$r_0$
between (4.12) and (4.15) yields an explicit expression for the concentration of particles within the droplet, namely
 \begin{equation} \phi = \left [1+\left (1-\dfrac {r^2}{R^2}\right )^{-3/2}\big (R^{-9/4}-1\big )\right ]^{1/3}. \end{equation}
Figure 7 shows
 $\phi$
given by (4.16) and
$\phi$
given by (4.16) and
 $\phi h$
plotted as functions of
$\phi h$
plotted as functions of
 $r$
at different times for a droplet evaporating in the CA mode. In particular, as figure 7(a) shows,
$r$
at different times for a droplet evaporating in the CA mode. In particular, as figure 7(a) shows,
 $\phi$
is a monotonically increasing function of
$\phi$
is a monotonically increasing function of
 $r$
which takes its minimum value at
$r$
which takes its minimum value at
 $r=0$
and is singular at the receding contact line throughout the evaporation, i.e.
$r=0$
and is singular at the receding contact line throughout the evaporation, i.e.
 $\phi =O ( (R-r )^{-1/2} )\to \infty$
as
$\phi =O ( (R-r )^{-1/2} )\to \infty$
as
 $r\to R^{-}$
for all
$r\to R^{-}$
for all
 $0\lt t\lt t_{\textit{CA}}$
. This singular behaviour of
$0\lt t\lt t_{\textit{CA}}$
. This singular behaviour of
 $\phi$
at the contact line is qualitatively similar to that for a droplet evaporating in the CR mode, as described in § 3.3. As figure 7(b) shows,
$\phi$
at the contact line is qualitatively similar to that for a droplet evaporating in the CR mode, as described in § 3.3. As figure 7(b) shows,
 $\phi h$
decreases everywhere within the droplet as it evaporates and is zero at the receding contact line throughout the evaporation. This behaviour is due to the fact that the advection of particles towards the contact line is balanced by the flux of particles into the receding contact line, as is the case for the CR mode (D’Ambrosio et al. Reference D’Ambrosio, Wilson, Wray and Duffy2023).
$\phi h$
decreases everywhere within the droplet as it evaporates and is zero at the receding contact line throughout the evaporation. This behaviour is due to the fact that the advection of particles towards the contact line is balanced by the flux of particles into the receding contact line, as is the case for the CR mode (D’Ambrosio et al. Reference D’Ambrosio, Wilson, Wray and Duffy2023).
Substituting
 $t_{\textit{d}}\equiv 0$
,
$t_{\textit{d}}\equiv 0$
,
 $R(t_{\textit{d}})\equiv 1$
, and the expression for
$R(t_{\textit{d}})\equiv 1$
, and the expression for
 $r_0(R,t_{\textit{dist}})$
given by (4.13) into (2.38) and evaluating the integral yields the explicit expression for the mass of particles in the bulk of the droplet, namely
$r_0(R,t_{\textit{dist}})$
given by (4.13) into (2.38) and evaluating the integral yields the explicit expression for the mass of particles in the bulk of the droplet, namely
 \begin{equation} M_{\textit{drop}}= 2\pi \int _0^{r_0\left (R,t_{\textit{dist}}\right )}{h(r,0)\,r\;\text {d}r}=M_0\left [ 1-\big (1-R^{9/4}\big )^{4/3}\right ]\!, \end{equation}
where, again, the initial mass of particles in the droplet is given by (2.31) to be
 $M_0=\pi /4$
. The mass of particles in the distributed deposit from (2.39) is given by
$M_0=\pi /4$
. The mass of particles in the distributed deposit from (2.39) is given by
 \begin{equation} M_{\textit{dist}}=2\pi \int _{r_0\left (R,t_{\textit{dist}}\right )}^1{h(r,0)\,r\;\text {d}r}= M_0\big (1-R^{9/4}\big )^{4/3}. \end{equation}
For a droplet evaporating in the CA mode, the contact line never pins and therefore
 $M_{\textit{ring}}\equiv 0$
. Adding the expressions for
$M_{\textit{ring}}\equiv 0$
. Adding the expressions for
 $M_{\textit{drop}}$
and
$M_{\textit{drop}}$
and
 $M_{\textit{dist}}$
given by (4.17) and (4.18), respectively, and recalling that
$M_{\textit{dist}}$
given by (4.17) and (4.18), respectively, and recalling that
 $M_{\textit{ring}}\equiv 0$
confirms that the total mass of particles is conserved as the droplet evaporates, i.e. that
$M_{\textit{ring}}\equiv 0$
confirms that the total mass of particles is conserved as the droplet evaporates, i.e. that
 $M_{\textit{drop}}+M_{\textit{ring}}+M_{\textit{dist}}=M_0$
.
$M_{\textit{drop}}+M_{\textit{ring}}+M_{\textit{dist}}=M_0$
.
Substituting the expression for
 $r_0(R,t_{\textit{dist}})$
given by (4.13) into (2.41) and recalling that
$r_0(R,t_{\textit{dist}})$
given by (4.13) into (2.41) and recalling that
 $t_{\textit{d}}=0$
yields the explicit expression for the density of the distributed deposit on the substrate, namely
$t_{\textit{d}}=0$
yields the explicit expression for the density of the distributed deposit on the substrate, namely
 \begin{equation} \phi _{\textit{dist}}=\dfrac {3r^{1/4}}{8}\big (1-r^{9/4}\big )^{1/3} \end{equation}
for
 $0\leqslant r\leqslant 1$
. Specifically,
$0\leqslant r\leqslant 1$
. Specifically,
 $\phi _{\textit{dist}}$
approaches zero at both the centre of the droplet and at the contact line, i.e.
$\phi _{\textit{dist}}$
approaches zero at both the centre of the droplet and at the contact line, i.e.
 $\phi _{\textit{dist}}=O (r^{1/4} )\to 0^{+}$
as
$\phi _{\textit{dist}}=O (r^{1/4} )\to 0^{+}$
as
 $r\to 0^+$
and
$r\to 0^+$
and
 $\phi _{\textit{dist}}=O ((1-r)^{1/3} )\to 0^{+}$
as
$\phi _{\textit{dist}}=O ((1-r)^{1/3} )\to 0^{+}$
as
 $r\to 1^{-}$
. The former is a consequence of the outward radial flow that transports particles away from the centre of the droplet throughout the evaporation. As we shall discuss in § 4.4, this behaviour is qualitatively different from the results obtained for spatially uniform evaporation.
$r\to 1^{-}$
. The former is a consequence of the outward radial flow that transports particles away from the centre of the droplet throughout the evaporation. As we shall discuss in § 4.4, this behaviour is qualitatively different from the results obtained for spatially uniform evaporation.
Plot of (a) the evolutions of
 $M_{\textit{drop}}/M_0$
(solid line) and
$M_{\textit{drop}}/M_0$
(solid line) and
 $M_{\textit{dist}}/M_0$
(dashed line) given by (4.17) and (4.18), respectively, as functions of
$M_{\textit{dist}}/M_0$
(dashed line) given by (4.17) and (4.18), respectively, as functions of
 $t/t_{\textit{CA}}$
and (b) the density of the distributed deposit
$t/t_{\textit{CA}}$
and (b) the density of the distributed deposit
 $\phi _{\textit{dist}}$
given by (4.19) as a function of
$\phi _{\textit{dist}}$
given by (4.19) as a function of
 $r$
for a droplet undergoing diffusion-limited evaporation in the CA mode.
$r$
for a droplet undergoing diffusion-limited evaporation in the CA mode.

Figure 8 shows a plot of the evolutions of
 $M_{\textit{drop}}/M_0$
and
$M_{\textit{drop}}/M_0$
and
 $M_{\textit{dist}}/M_0$
given by (4.17) and (4.18), respectively, as functions of
$M_{\textit{dist}}/M_0$
given by (4.17) and (4.18), respectively, as functions of
 $t/t_{\textit{CA}}$
and a plot of
$t/t_{\textit{CA}}$
and a plot of
 $\phi _{\textit{dist}}$
given by (4.19) as a function of
$\phi _{\textit{dist}}$
given by (4.19) as a function of
 $r$
for a droplet evaporating in the CA mode. In particular, as figure 8(a) shows,
$r$
for a droplet evaporating in the CA mode. In particular, as figure 8(a) shows,
 $M_{\textit{drop}}/M_0$
decreases monotonically from
$M_{\textit{drop}}/M_0$
decreases monotonically from
 $M_{\textit{drop}}/M_0=1$
at
$M_{\textit{drop}}/M_0=1$
at
 $t=0$
to
$t=0$
to
 $M_{\textit{drop}}/M_0=0$
at
$M_{\textit{drop}}/M_0=0$
at
 $t=t_{\textit{CA}}$
and
$t=t_{\textit{CA}}$
and
 $M_{\textit{dist}}/M_0$
increases monotonically in
$M_{\textit{dist}}/M_0$
increases monotonically in
 $t/t_{\textit{CA}}$
, confirming that all of the particles are eventually deposited in a distributed deposit on the substrate in the region
$t/t_{\textit{CA}}$
, confirming that all of the particles are eventually deposited in a distributed deposit on the substrate in the region
 $0\leqslant r\leqslant 1$
in the CA mode. Specifically, particles are advected towards the receding contact line by the outward radial flow and are therefore continually deposited on the substrate in the region swept by the moving contact line throughout the evaporation. This results in a near-uniform deposit, as illustrated by the density profile of the mass of particles on the substrate in figure 8(b).
$0\leqslant r\leqslant 1$
in the CA mode. Specifically, particles are advected towards the receding contact line by the outward radial flow and are therefore continually deposited on the substrate in the region swept by the moving contact line throughout the evaporation. This results in a near-uniform deposit, as illustrated by the density profile of the mass of particles on the substrate in figure 8(b).
As discussed previously, the behaviour of the flow and the concentration of particles within the droplet in the CA mode is qualitatively similar to that predicted for a droplet evaporating in the CR mode. However, the presence of the receding contact line results in a qualitatively different deposit type, i.e. a switch from a single ring deposit in the CR mode to a near-uniform deposit in the CA mode.
4.4. Comparison with previous theoretical and experimental studies
As discussed in § 1, the spatially uniform evaporation model is sometimes used to approximate the diffusion-limited model. This is because it is simpler to use and has also been shown to predict qualitatively similar behaviour to that for diffusion-limited evaporation for the flow within and deposition from a droplet evaporating in the case where the contact line is pinned (see, for example, Boulogne et al. Reference Boulogne, Ingremeau and Stone2017; D’Ambrosio et al. Reference D’Ambrosio, Wilson, Wray and Duffy2023; Mills Reference Mills2023). Here we give a brief summary of the flow within, and the deposition from, a droplet undergoing spatially uniform evaporation in the CA mode and compare these predictions with the present results given in § 4.3 for diffusion-limited evaporation. In addition, we will validate the present theoretical approach by comparing both predictions with experimental results available in the literature.
4.4.1. Spatially uniform evaporation
For a spatially uniform evaporative flux of the form
 $J=4/(\pi R)$
, the total evaporative flux
$J=4/(\pi R)$
, the total evaporative flux
 $F$
from (2.5) is the same as that for diffusion-limited evaporation, namely
$F$
from (2.5) is the same as that for diffusion-limited evaporation, namely
 $F=4R$
. Therefore, the evolution of the droplet undergoing spatially uniform evaporation in the CA mode is given by the results for the diffusion-limited model summarised in § 4.1. However, as we shall see, the flow within and the deposition of particles from the droplet are not the same.
$F=4R$
. Therefore, the evolution of the droplet undergoing spatially uniform evaporation in the CA mode is given by the results for the diffusion-limited model summarised in § 4.1. However, as we shall see, the flow within and the deposition of particles from the droplet are not the same.
In particular, it may be shown that the fluid flux
 $Q$
from (2.24) and the depth-averaged radial velocity
$Q$
from (2.24) and the depth-averaged radial velocity
 $\bar {u}$
from (2.22) are
$\bar {u}$
from (2.22) are
 \begin{equation} Q=-\dfrac {2r}{3\pi R}\left (1-\dfrac {r^2}{R^2}\right )\!, \quad \bar {u}=-\dfrac {4r}{3\pi R^2} \end{equation}
(see, for example, Freed-Brown Reference Freed-Brown2014). The expressions for the velocities
 $u$
and
$u$
and
 $w$
may be determined in the same manner as described in § 4.2, but are omitted here for brevity. Figure 6(b) shows instantaneous streamlines of the flow within a droplet evaporating in the CA mode for spatially uniform evaporation calculated at
$w$
may be determined in the same manner as described in § 4.2, but are omitted here for brevity. Figure 6(b) shows instantaneous streamlines of the flow within a droplet evaporating in the CA mode for spatially uniform evaporation calculated at
 $t=t_{\textit{CA}}/2=3\pi /64$
. In particular, as figure 6(b) shows, the flow is inwards and upwards away from the contact line. Therefore, in contrast to the case of diffusion-limited evaporation, for spatially uniform evaporation the depth-averaged radial velocity is inwards towards the centre of the droplet throughout the evaporation, i.e.
$t=t_{\textit{CA}}/2=3\pi /64$
. In particular, as figure 6(b) shows, the flow is inwards and upwards away from the contact line. Therefore, in contrast to the case of diffusion-limited evaporation, for spatially uniform evaporation the depth-averaged radial velocity is inwards towards the centre of the droplet throughout the evaporation, i.e.
 $\bar {u}\leqslant 0$
for all
$\bar {u}\leqslant 0$
for all
 $0\leqslant t\leqslant t_{\textit{CA}}$
, and hence particles are advected towards the centre of the droplet. However, the contact line recedes at a faster rate than the maximum inward fluid velocity, which occurs at the contact line, i.e.
$0\leqslant t\leqslant t_{\textit{CA}}$
, and hence particles are advected towards the centre of the droplet. However, the contact line recedes at a faster rate than the maximum inward fluid velocity, which occurs at the contact line, i.e.
 \begin{equation} \left \lvert \dfrac {\text {d}R}{\text {d}t}\right \rvert =4\left \lvert \bar {u}(R,t)\right \rvert \gt \left \lvert \bar {u}(R,t)\right \rvert \geqslant \left \lvert \max _r\bar {u}(r,t)\right \rvert \end{equation}
for
 $0\lt R\lt 1$
. Therefore, particles are captured by the receding contact line as the droplet evaporates and are continually deposited on the substrate in the region swept by the moving contact line throughout the evaporation. In particular, for spatially uniform evaporation it may be shown from (2.29) that
$0\lt R\lt 1$
. Therefore, particles are captured by the receding contact line as the droplet evaporates and are continually deposited on the substrate in the region swept by the moving contact line throughout the evaporation. In particular, for spatially uniform evaporation it may be shown from (2.29) that
 $r_0(r,t)=r R^{-1/4}$
, and therefore that the evolution of the mass of particles in the bulk of the droplet and in the distributed deposit, given by (2.38) and (2.39), are
$r_0(r,t)=r R^{-1/4}$
, and therefore that the evolution of the mass of particles in the bulk of the droplet and in the distributed deposit, given by (2.38) and (2.39), are
 \begin{equation} M_{\textit{drop}}=M_0\big (2R^{3/2}-R^3\big ), \quad M_{\textit{dist}}=M_0\big (1-R^{3/2}\big )^2=M_0-M_{\textit{drop}}, \end{equation}
respectively. The density profile of the distributed deposit from (2.41) is then
 \begin{equation} \phi _{\textit{dist}}=\dfrac {3}{8\sqrt {r}}\big (1-r^{3/2}\big ) \end{equation}
(see Freed-Brown Reference Freed-Brown2014).
Plot of (a) the evolutions of
 $M_{\textit{drop}}/M_0$
(solid line) and
$M_{\textit{drop}}/M_0$
(solid line) and
 $M_{\textit{dist}}/M_0$
(dashed line) given by (4.22) as functions of
$M_{\textit{dist}}/M_0$
(dashed line) given by (4.22) as functions of
 $t/t_{\textit{CA}}$
and (b) the density of the distributed deposit
$t/t_{\textit{CA}}$
and (b) the density of the distributed deposit
 $\phi _{\textit{dist}}$
given by (4.23) as a function of
$\phi _{\textit{dist}}$
given by (4.23) as a function of
 $r$
for a droplet undergoing spatially uniform evaporation in the CA mode.
$r$
for a droplet undergoing spatially uniform evaporation in the CA mode.

Figure 9 shows a plot of the evolutions of
 $M_{\textit{drop}}/M_0$
and
$M_{\textit{drop}}/M_0$
and
 $M_{\textit{dist}}/M_0$
given by (4.22) as functions of
$M_{\textit{dist}}/M_0$
given by (4.22) as functions of
 $t/t_{\textit{CA}}$
and a plot of
$t/t_{\textit{CA}}$
and a plot of
 $\phi _{\textit{dist}}$
given by (4.23) as a function of
$\phi _{\textit{dist}}$
given by (4.23) as a function of
 $r$
for a droplet undergoing spatially uniform evaporation in the CA mode. In particular, as figure 9(a) shows, despite the qualitatively different behaviour of the flow within the droplet, the evolutions of
$r$
for a droplet undergoing spatially uniform evaporation in the CA mode. In particular, as figure 9(a) shows, despite the qualitatively different behaviour of the flow within the droplet, the evolutions of
 $M_{\textit{drop}}$
and
$M_{\textit{drop}}$
and
 $M_{\textit{dist}}$
are qualitatively the same as those for a droplet undergoing diffusion-limited evaporation in the CA mode shown in figure 8(a), i.e. all of the particles are eventually deposited in the distributed deposit. However, the density of the distributed deposit is qualitatively different. Specifically,
$M_{\textit{dist}}$
are qualitatively the same as those for a droplet undergoing diffusion-limited evaporation in the CA mode shown in figure 8(a), i.e. all of the particles are eventually deposited in the distributed deposit. However, the density of the distributed deposit is qualitatively different. Specifically,
 $\phi _{\textit{dist}}$
given by (4.23) is a monotonically decreasing function of
$\phi _{\textit{dist}}$
given by (4.23) is a monotonically decreasing function of
 $r$
which takes its minimum value of zero at
$r$
which takes its minimum value of zero at
 $r=1$
and is square-root singular at
$r=1$
and is square-root singular at
 $r=0$
, as shown in figure 9(b). The qualitative change in behaviour of the depth-averaged radial flow from outwards for diffusion-limited evaporation to inwards for spatially uniform evaporation results in a qualitatively different deposit type, i.e. a switch from a near-uniform deposit for diffusion-limited evaporation to a peak deposit for spatially uniform evaporation. We note that Freed-Brown (Reference Freed-Brown2015) observed this difference in the resulting deposit types when comparing their theoretical predictions for the deposit density profile for a droplet undergoing spatially uniform evaporation with numerical calculations for diffusion-limited evaporation. In summary, whereas the spatially uniform evaporation model provides a good approximation to the diffusion-limited model for the flow within and the deposition from a droplet evaporating with a pinned contact line (see, for example, Boulogne et al. Reference Boulogne, Ingremeau and Stone2017; D’Ambrosio et al. Reference D’Ambrosio, Wilson, Wray and Duffy2023; Mills Reference Mills2023), it is not appropriate to use it when the contact line is receding.
$r=0$
, as shown in figure 9(b). The qualitative change in behaviour of the depth-averaged radial flow from outwards for diffusion-limited evaporation to inwards for spatially uniform evaporation results in a qualitatively different deposit type, i.e. a switch from a near-uniform deposit for diffusion-limited evaporation to a peak deposit for spatially uniform evaporation. We note that Freed-Brown (Reference Freed-Brown2015) observed this difference in the resulting deposit types when comparing their theoretical predictions for the deposit density profile for a droplet undergoing spatially uniform evaporation with numerical calculations for diffusion-limited evaporation. In summary, whereas the spatially uniform evaporation model provides a good approximation to the diffusion-limited model for the flow within and the deposition from a droplet evaporating with a pinned contact line (see, for example, Boulogne et al. Reference Boulogne, Ingremeau and Stone2017; D’Ambrosio et al. Reference D’Ambrosio, Wilson, Wray and Duffy2023; Mills Reference Mills2023), it is not appropriate to use it when the contact line is receding.
4.4.2. Validation against previous experimental studies
The contrasting predictions for the deposit of the diffusion-limited and spatially uniform evaporation models raises the question as to which model most accurately predicts experimental observations. As discussed in § 1, previous experimental studies have observed uniform, near-uniform and doughnut deposits from a thin droplet evaporating in the CA mode (see, for example, Kajiya et al. Reference Kajiya, Monteux, Narita, Lequeux and Doi2009; Thokchom et al. Reference Thokchom, Zhou, Kim, Ha and Kim2017; Kim et al. Reference Kim, Rokoni, Kaneelil, Cui, Han and Sun2019; Lee & Kim Reference Lee and Kim2021; Matavž et al. Reference Matavž, Uršič, Močivnik, Richter, Humar, Čopar, Malič and Bobnar2022), indicating that the diffusion-limited model provides a qualitatively better prediction than spatially uniform evaporation for these experiments. In order to confirm this we will carry out a quantitative comparison with the experimental studies by Kajiya et al. (Reference Kajiya, Monteux, Narita, Lequeux and Doi2009), Kim et al. (Reference Kim, Rokoni, Kaneelil, Cui, Han and Sun2019) and Matavž et al. (Reference Matavž, Uršič, Močivnik, Richter, Humar, Čopar, Malič and Bobnar2022). Specifically, these experiments concern the deposition of polymers from water droplets on glass substrates (Kajiya et al. Reference Kajiya, Monteux, Narita, Lequeux and Doi2009; Kim et al. Reference Kim, Rokoni, Kaneelil, Cui, Han and Sun2019) and from ethylene glycol droplets on coated silicon wafers (Matavž et al. Reference Matavž, Uršič, Močivnik, Richter, Humar, Čopar, Malič and Bobnar2022), and report profiles of the final deposit (figure 6a in Kajiya et al. Reference Kajiya, Monteux, Narita, Lequeux and Doi2009; figure 9a in Kim et al. Reference Kim, Rokoni, Kaneelil, Cui, Han and Sun2019; figure 4d in Matavž et al. Reference Matavž, Uršič, Močivnik, Richter, Humar, Čopar, Malič and Bobnar2022), which enables comparisons with the theory.
Plot of the density profile of the mass of particles on the substrate
 $\phi _{\textit{dist}}$
as a function of
$\phi _{\textit{dist}}$
as a function of
 $r$
for a droplet undergoing diffusion-limited (solid black line) and spatially uniform (solid grey line) evaporation in the CA mode given by (4.19) and (4.23), respectively, as well as experimental results of Kajiya et al. (Reference Kajiya, Monteux, Narita, Lequeux and Doi2009) (dotted line), Kim et al. (Reference Kim, Rokoni, Kaneelil, Cui, Han and Sun2019) (dashed line) and Matavž et al. (Reference Matavž, Uršič, Močivnik, Richter, Humar, Čopar, Malič and Bobnar2022) (dot-dashed line).
$r$
for a droplet undergoing diffusion-limited (solid black line) and spatially uniform (solid grey line) evaporation in the CA mode given by (4.19) and (4.23), respectively, as well as experimental results of Kajiya et al. (Reference Kajiya, Monteux, Narita, Lequeux and Doi2009) (dotted line), Kim et al. (Reference Kim, Rokoni, Kaneelil, Cui, Han and Sun2019) (dashed line) and Matavž et al. (Reference Matavž, Uršič, Močivnik, Richter, Humar, Čopar, Malič and Bobnar2022) (dot-dashed line).

Figure 10 shows a plot of
 $\phi _{\textit{dist}}$
as a function of
$\phi _{\textit{dist}}$
as a function of
 $r$
for a droplet undergoing diffusion-limited and spatially uniform evaporation in the CA mode given by (4.19) and (4.23), respectively, as well as the experimental results of Kajiya et al. (Reference Kajiya, Monteux, Narita, Lequeux and Doi2009), Kim et al. (Reference Kim, Rokoni, Kaneelil, Cui, Han and Sun2019) and Matavž et al. (Reference Matavž, Uršič, Močivnik, Richter, Humar, Čopar, Malič and Bobnar2022). Figure 10 shows that, despite the simplicity of the present model described in § 2, the prediction for
$r$
for a droplet undergoing diffusion-limited and spatially uniform evaporation in the CA mode given by (4.19) and (4.23), respectively, as well as the experimental results of Kajiya et al. (Reference Kajiya, Monteux, Narita, Lequeux and Doi2009), Kim et al. (Reference Kim, Rokoni, Kaneelil, Cui, Han and Sun2019) and Matavž et al. (Reference Matavž, Uršič, Močivnik, Richter, Humar, Čopar, Malič and Bobnar2022). Figure 10 shows that, despite the simplicity of the present model described in § 2, the prediction for
 $\phi _{\textit{dist}}$
for diffusion-limited evaporation given by (4.19) compares well with the results obtained from physical experiments, with particularly good agreement with the studies by Kim et al. (Reference Kim, Rokoni, Kaneelil, Cui, Han and Sun2019) and Matavž et al. (Reference Matavž, Uršič, Močivnik, Richter, Humar, Čopar, Malič and Bobnar2022). By contrast, the theoretical prediction for spatially uniform evaporation is qualitatively different from the experimental results shown, as previously discussed.
$\phi _{\textit{dist}}$
for diffusion-limited evaporation given by (4.19) compares well with the results obtained from physical experiments, with particularly good agreement with the studies by Kim et al. (Reference Kim, Rokoni, Kaneelil, Cui, Han and Sun2019) and Matavž et al. (Reference Matavž, Uršič, Močivnik, Richter, Humar, Čopar, Malič and Bobnar2022). By contrast, the theoretical prediction for spatially uniform evaporation is qualitatively different from the experimental results shown, as previously discussed.
5. The SS mode
5.1. The evolution of the droplet
In the SS mode the evolution of a droplet consists of a CR phase, i.e. with
 $R\equiv 1$
and
$R\equiv 1$
and
 $\theta =\theta (t)$
, until a time
$\theta =\theta (t)$
, until a time
 $t=t^*$
at which the critical receding contact angle
$t=t^*$
at which the critical receding contact angle
 $\theta =\theta ^*$
 $(0\leqslant \theta ^*\leqslant 1)$
is reached, followed by a CA phase, i.e. with
$(0\leqslant \theta ^*\leqslant 1)$
is reached, followed by a CA phase, i.e. with
 $R=R(t)$
and
$R=R(t)$
and
 $\theta \equiv \theta ^*$
.
$\theta \equiv \theta ^*$
.
For a droplet evaporating in the SS mode (2.6) becomes
 \begin{equation} \dfrac {\text {d}V}{\text {d}t}=\dfrac {\pi }{4}\dfrac {\text {d}\theta }{\text {d}t}=-4 \end{equation}
for
 $0\leqslant t\leqslant t^*$
, and
$0\leqslant t\leqslant t^*$
, and
 \begin{equation} \dfrac {\text {d}V}{\text {d}t}=\dfrac {3\pi \theta ^*R^2}{4}\dfrac {\text {d}R}{\text {d}t}=-4R \end{equation}
for
 $t^*\leqslant t\leqslant t_{\textit{SS}}$
. Solving (5.1) and (5.2) yields the well-known explicit evolution of the droplet, namely
$t^*\leqslant t\leqslant t_{\textit{SS}}$
. Solving (5.1) and (5.2) yields the well-known explicit evolution of the droplet, namely
 \begin{align}&\qquad\,\,\, R\equiv 1, \quad \theta =1-\dfrac {16}{\pi }t \quad \text{for} \quad 0\leqslant t\leqslant t^*, \end{align}
 \begin{align}& \theta \equiv 1, \quad R=\sqrt {1-\dfrac {32}{3\pi \theta ^*}\left (t-t^*\right )} \quad \text{for} \quad t^*\leqslant t\leqslant t_{\textit{SS}} , \end{align}
with
 $h$
and
$h$
and
 $V$
given by (2.13) and (2.14), respectively, the critical time
$V$
given by (2.13) and (2.14), respectively, the critical time
 $t^*$
obtained by setting
$t^*$
obtained by setting
 $\theta (t^*)=\theta ^*$
is
$\theta (t^*)=\theta ^*$
is
 \begin{equation} t^*=\dfrac {\pi \left (1-\theta ^*\right )}{16}, \end{equation}
and the lifetime of the droplet
 $t_{\textit{SS}}$
obtained by setting
$t_{\textit{SS}}$
obtained by setting
 $R(t_{\textit{SS}})=0$
is
$R(t_{\textit{SS}})=0$
is
 \begin{equation} t_{\textit{SS}}=\dfrac {\pi \left (2+\theta ^*\right )}{32} \end{equation}
(see, for example, Wilson & Duffy Reference Wilson and Duffy2022).
5.2. The flow within the droplet
Substituting the expressions for
 $J$
and
$J$
and
 $h$
given by (2.4) and (2.13), respectively, into (2.24) and evaluating the integral gives the following solution for
$h$
given by (2.4) and (2.13), respectively, into (2.24) and evaluating the integral gives the following solution for
 $Q$
in the SS mode:
$Q$
in the SS mode:
 \begin{equation} Q=\dfrac {2}{\pi r} {\begin{cases} \sqrt {1-r^2}-\left (1-r^2\right )^2 \quad &\text{for} \quad 0\leqslant t\leqslant t^*,\\[8pt] R\left [\sqrt {1-\dfrac {r^2}{R^2}}-\left (1+\dfrac {r^2}{3R^2}\right )\left (1-\dfrac {r^2}{R^2}\right )\right ] \quad &\text{for} \quad t^*\leqslant t\leqslant t_{\textit{SS}}, \end{cases}} \end{equation}
and hence the depth-averaged velocity
 $\bar {u}$
is
$\bar {u}$
is
 \begin{equation} \bar {u}=\dfrac {4}{\pi r} {\begin{cases} \dfrac {1}{\theta }\Big [\!\left(1-r^2\right)^{-1/2}-\left(1-r^2\right)\!\Big ] \quad &\text{for} \quad 0\leqslant t\leqslant t^*,\\[8pt] \dfrac {1}{\theta ^* }\left [\left (1-\dfrac {r^2}{R^2}\right )^{-1/2}-\left (1+\dfrac {r^2}{3R^2}\right )\right ] \quad &\text{for} \quad t^*\leqslant t\leqslant t_{\textit{SS}}. \end{cases}} \end{equation}
The behaviour of
 $Q$
and
$Q$
and
 $\bar {u}$
given by (5.7) and (5.8), respectively, in the CR and CA phases corresponds to the behaviour for a droplet evaporating in the CR and CA modes, respectively, and so are not plotted here for brevity. In particular, the depth-averaged radial velocity is outwards towards the contact line in both phases, i.e.
$\bar {u}$
given by (5.7) and (5.8), respectively, in the CR and CA phases corresponds to the behaviour for a droplet evaporating in the CR and CA modes, respectively, and so are not plotted here for brevity. In particular, the depth-averaged radial velocity is outwards towards the contact line in both phases, i.e.
 $Q\geqslant 0$
and
$Q\geqslant 0$
and
 $\bar {u}\geqslant 0$
for all
$\bar {u}\geqslant 0$
for all
 $0\leqslant t\leqslant t_{\textit{SS}}$
,
$0\leqslant t\leqslant t_{\textit{SS}}$
,
 $Q$
is independent of
$Q$
is independent of
 $t$
during the CR phase, and
$t$
during the CR phase, and
 $\bar {u}$
is singular at the contact line in both phases. Note that (5.7) and (5.8) recover the solutions for a droplet evaporating in the CR and CA modes described in § 3.2 and § 4.2 when
$\bar {u}$
is singular at the contact line in both phases. Note that (5.7) and (5.8) recover the solutions for a droplet evaporating in the CR and CA modes described in § 3.2 and § 4.2 when
 $\theta ^*=0$
and
$\theta ^*=0$
and
 $\theta ^*=1$
, respectively.
$\theta ^*=1$
, respectively.
5.3. The deposition of particles
For a droplet evaporating in the SS mode, the characteristic equations (2.29) may be expressed as
 \begin{equation} \dfrac {\text {d}r}{\text {d}\theta }=\dfrac {\text {d}r/\text {d}t}{\text {d}\theta /\text {d}t}= \dfrac {\bar {u}}{\text {d}\theta /\text {d}t}, \quad \dfrac {\text {d}\phi }{\text {d}\theta }=\dfrac {\text {d}\phi /\text {d}t}{\text {d}\theta / \text {d}t} =\dfrac { J\phi }{h\,\text {d}\theta /\text {d}t}, \end{equation}
subject to the initial condition
 $\phi _0(r)=1$
, for
$\phi _0(r)=1$
, for
 $0\leqslant t\leqslant t^*$
, and as
$0\leqslant t\leqslant t^*$
, and as
 \begin{equation} \dfrac {\text {d}r}{\text {d}R}=\dfrac {\text {d}r/\text {d}t}{\text {d}R/\text {d}t}= \dfrac {\bar {u}}{\text {d}R/\text {d}t}, \quad \dfrac {\text {d}\phi }{\text {d}R}=\dfrac {\text {d}\phi /\text {d}t}{\text {d}R/\text {d}t} =\dfrac { J\phi }{h\,\text {d}R/\text {d}t}, \end{equation}
subject to the initial condition
 $\phi (r,t^*)=\phi ^*(r)$
, for
$\phi (r,t^*)=\phi ^*(r)$
, for
 $t^*\leqslant t\leqslant t_{\textit{SS}}$
.
$t^*\leqslant t\leqslant t_{\textit{SS}}$
.
For
 $0\leqslant t\leqslant t^*$
, substituting the expressions for
$0\leqslant t\leqslant t^*$
, substituting the expressions for
 $J$
,
$J$
,
 $h$
,
$h$
,
 $\text {d}\theta /\text {d}t$
and
$\text {d}\theta /\text {d}t$
and
 $\bar {u}$
from (2.4), (2.13), (5.1) and (5.8) into (5.9) gives
$\bar {u}$
from (2.4), (2.13), (5.1) and (5.8) into (5.9) gives
 \begin{equation} \dfrac {\text {d}r}{\text {d}\theta }=-\dfrac {1}{4\theta r}\left [\big (1-r^2\big )^{-1/2}-\big (1-r^2\big )\right ]\!, \quad \dfrac {\text {d}\phi }{\text {d}\theta }=-\dfrac {\phi }{4\theta }\big (1-r^2\big )^{-3/2}. \end{equation}
The characteristic equations given by (5.11) are exactly those given by (3.6) for a droplet evaporating in the CR mode with the same prescribed initial condition and so may be solved in the same manner as described in § 3.3. In particular, the explicit expressions for
 $r_0(r,t)$
,
$r_0(r,t)$
,
 $r_0(1,t_{\textit{ring}})$
and
$r_0(1,t_{\textit{ring}})$
and
 $\phi$
are given by (3.7), (3.8) and (3.10), respectively, during the CR phase.
$\phi$
are given by (3.7), (3.8) and (3.10), respectively, during the CR phase.
For
 $t^*\leqslant t\leqslant t_{\textit{SS}}$
, substituting the expressions for
$t^*\leqslant t\leqslant t_{\textit{SS}}$
, substituting the expressions for
 $J$
,
$J$
,
 $h$
,
$h$
,
 $\text {d}R/\text {d}t$
and
$\text {d}R/\text {d}t$
and
 $\bar {u}$
from (2.4), (2.13), (5.2) and (5.8) into (5.10) gives
$\bar {u}$
from (2.4), (2.13), (5.2) and (5.8) into (5.10) gives
 \begin{equation} \dfrac {\text {d}r}{\text {d}R}=\dfrac {3R}{4r}\left [\left (1+\dfrac {r^2}{3R^2}\right )- \left (1-\dfrac {r^2}{R^2}\right )^{-1/2} \right ]\!, \quad \dfrac {\text {d}\phi }{\text {d}R}=-\dfrac {3\phi }{4R}\left (1-\dfrac {r^2}{R^2}\right )^{-3/2}. \end{equation}
The characteristic equations given by (5.12) are exactly those given by (4.10) for a droplet evaporating in the CA mode with the only difference being the initial condition. Therefore, (5.12a
) may be solved in the same manner as described in § 4 to yield
 $r_0(r,t)$
and
$r_0(r,t)$
and
 $r_0(R,t_{\textit{dist}})$
given by (4.12) and (4.13), respectively. Substituting the expression for
$r_0(R,t_{\textit{dist}})$
given by (4.12) and (4.13), respectively. Substituting the expression for
 $r$
given implicitly by (4.12) into (5.12b
) the equation becomes separable and may be rewritten as
$r$
given implicitly by (4.12) into (5.12b
) the equation becomes separable and may be rewritten as
 \begin{equation} \int _{\phi ^*(r_0)}^{\phi }{\dfrac {1}{\hat {\phi }}\,\text {d}\hat {\phi }}=- \int _{1}^{R}{\dfrac {3\hat {R}^{5/4}} {4\left [\hat {R}^{9/4}-1+\left (1-r_0^2\right )^{3/2}\right ]}\text {d}\hat {R}}, \end{equation}
where
 $\phi ^*(r)=\phi (r,t^*)$
denotes the concentration of particles within the droplet at
$\phi ^*(r)=\phi (r,t^*)$
denotes the concentration of particles within the droplet at
 $t=t^*$
and may be determined from (3.10). Performing the integral in (5.13) shows that
$t=t^*$
and may be determined from (3.10). Performing the integral in (5.13) shows that
 $\phi$
is given parametrically by
$\phi$
is given parametrically by
 \begin{equation} \phi =\left [\dfrac {{\theta ^*}^{-3/4}-1+\left (1-r_0^2\right )^{3/2}} {R^{9/4}-1+\left (1-r_0^2\right )^{3/2}}\right ]^{1/3}. \end{equation}
Finally, eliminating
 $r_0$
between (4.12) and (5.14) yields an explicit expression for the concentration of particles within the droplet during the CA phase, namely
$r_0$
between (4.12) and (5.14) yields an explicit expression for the concentration of particles within the droplet during the CA phase, namely
 \begin{equation} \phi =\left [1+\left (1-\dfrac {r^2}{R^2}\right )^{-3/2}\big ({\theta ^*}^{-3/4}R^{-9/4}-1\big )\right ]^{1/3}. \end{equation}
Note that (3.10) holds for the entire lifetime of the droplet when
 $\theta ^*=0$
and (5.15) recovers the solution for a droplet evaporating in the CA mode given by (4.16) when
$\theta ^*=0$
and (5.15) recovers the solution for a droplet evaporating in the CA mode given by (4.16) when
 $\theta ^*=1$
. Figure 11 shows
$\theta ^*=1$
. Figure 11 shows
 $\phi$
given by (3.10) and (5.15) and
$\phi$
given by (3.10) and (5.15) and
 $\phi h$
plotted as functions of
$\phi h$
plotted as functions of
 $r$
at different times for a droplet evaporating in the SS mode when
$r$
at different times for a droplet evaporating in the SS mode when
 $\theta ^*=1/2$
. The behaviour of
$\theta ^*=1/2$
. The behaviour of
 $\phi$
in the CR and CA phases corresponds to the behaviour for a droplet evaporating in the CR and CA modes, respectively. In particular, as figure 11(a) shows,
$\phi$
in the CR and CA phases corresponds to the behaviour for a droplet evaporating in the CR and CA modes, respectively. In particular, as figure 11(a) shows,
 $\phi$
is a monotonically increasing function of
$\phi$
is a monotonically increasing function of
 $r$
and is singular at the contact line throughout the evaporation in both phases.
$r$
and is singular at the contact line throughout the evaporation in both phases.
Plot of (a) the concentration of particles
 $\phi$
and (b) the mass per unit area
$\phi$
and (b) the mass per unit area
 $\phi h$
within the droplet as functions of
$\phi h$
within the droplet as functions of
 $r$
at
$r$
at
 $t=0$
,
$t=0$
,
 $t^*/3$
,
$t^*/3$
,
 $2t^*/3$
,
$2t^*/3$
,
 $t^*$
,
$t^*$
,
 $t^*+(t_{\textit{SS}}-t^*)/6$
,
$t^*+(t_{\textit{SS}}-t^*)/6$
,
 $t^*+(t_{\textit{SS}}-t^*)/3$
, …,
$t^*+(t_{\textit{SS}}-t^*)/3$
, …,
 $t^*+5(t_{\textit{SS}}-t^*)/6$
for a droplet evaporating in the SS mode when
$t^*+5(t_{\textit{SS}}-t^*)/6$
for a droplet evaporating in the SS mode when
 $\theta ^*=1/2$
. The dashed lines correspond to the initial values of (a) the concentration of particles given by
$\theta ^*=1/2$
. The dashed lines correspond to the initial values of (a) the concentration of particles given by
 $\phi _0(r)=1$
and (b) the mass of particles given by
$\phi _0(r)=1$
and (b) the mass of particles given by
 $\phi _0(r)h(r,0)=(1-r^2)/2$
, the dot-dashed lines correspond to the values at
$\phi _0(r)h(r,0)=(1-r^2)/2$
, the dot-dashed lines correspond to the values at
 $t=t^*$
, and the arrows indicate the direction of increasing
$t=t^*$
, and the arrows indicate the direction of increasing
 $t$
.
$t$
.

Substituting
 $t_{{p}}=0$
,
$t_{{p}}=0$
,
 $t_{\textit{d}}=t^*$
,
$t_{\textit{d}}=t^*$
,
 $R_{{p}}=R_{\textit{d}}=1$
and the expressions for
$R_{{p}}=R_{\textit{d}}=1$
and the expressions for
 $r_0(1,t_{\textit{ring}})$
and
$r_0(1,t_{\textit{ring}})$
and
 $r_0(R,t_{\textit{dist}})$
given by (3.8) and (4.13), respectively, into (2.34) and (2.38) and evaluating the integrals yields the explicit expressions for the mass of particles in the bulk of the droplet, namely
$r_0(R,t_{\textit{dist}})$
given by (3.8) and (4.13), respectively, into (2.34) and (2.38) and evaluating the integrals yields the explicit expressions for the mass of particles in the bulk of the droplet, namely
 \begin{align} M_{\textit{drop}}&=2\pi {\begin{cases} {\displaystyle\int}_{\!\! \kern-2pt 0}^{r_0(1,t_{\textit{ring}})}{h(r,0)\,r\;\text {d}r} \quad &\text{for} \quad 0\leqslant t\leqslant t^*,\\[6pt] {\displaystyle\int}_{\!\! \kern-2pt 0}^{r_0\left (R,t_{\textit{dist}}\right )}{\phi ^*(r)\, h(r,t^*)\,r\;\text {d}r} \quad &\text{for} \quad t^*\leqslant t\leqslant t_{\textit{SS}}, \end{cases}} \nonumber \\ &=M_0 {\begin{cases} 1-\left (1-\theta ^{3/4}\right )^{4/3} \quad &\text{for} \quad 0\leqslant t\leqslant t^*,\\[6pt] 1-\big (1-{\theta ^*}^{3/4}R^{9/4}\big )^{4/3} \quad &\text{for} \quad t^*\leqslant t\leqslant t_{\textit{SS}}, \end{cases}} \end{align}
where, again, the initial mass of particles in the droplet is given by (2.31) to be
 $M_0=\pi /4$
. For
$M_0=\pi /4$
. For
 $0\leqslant t\leqslant t^*$
, the mass of particles in the ring deposit from (2.35) is given by
$0\leqslant t\leqslant t^*$
, the mass of particles in the ring deposit from (2.35) is given by
 \begin{equation} M_{\textit{ring}}= 2\pi \int _{r_0(1,t_{\textit{ring}})}^1{h(r,0)\,r\;\text {d}r}= M_0\big (1-\theta ^{3/4}\big )^{4/3}. \end{equation}
For
 $t^*\leqslant t\leqslant t_{\textit{SS}}$
, the mass of particles in the distributed deposit from (2.39) can be calculated explicitly as
$t^*\leqslant t\leqslant t_{\textit{SS}}$
, the mass of particles in the distributed deposit from (2.39) can be calculated explicitly as
 \begin{align} M_{\textit{dist}}= 2\pi \int _{r_0\left (R,t_{\textit{dist}}\right )}^1{\phi ^*(r)\, h(r,t^*)\,r\;\text {d}r} =M_0\left [\big (1-{\theta ^*}^{3/4}R^{9/4}\big )^{4/3}-\big (1-{\theta ^*}^{3/4}\big )^{4/3}\right ]\!. \end{align}
Plot of the evolutions of (a)
 $M_{\textit{drop}}/M_0$
given by (5.16), (b)
$M_{\textit{drop}}/M_0$
given by (5.16), (b)
 $M_{\textit{ring}}/M_0$
given by (5.17), and (c)
$M_{\textit{ring}}/M_0$
given by (5.17), and (c)
 $M_{\textit{dist}}/M_0$
given by (5.18) as functions of
$M_{\textit{dist}}/M_0$
given by (5.18) as functions of
 $t/t_{\textit{SS}}$
for
$t/t_{\textit{SS}}$
for
 $\theta ^*=1/6$
,
$\theta ^*=1/6$
,
 $2/6$
, …,
$2/6$
, …,
 $5/6$
, and (d)
$5/6$
, and (d)
 $M_{\textit{ring}}(t_{\textit{SS}})/M_0$
(solid line) and
$M_{\textit{ring}}(t_{\textit{SS}})/M_0$
(solid line) and
 $M_{\textit{dist}}(t_{\textit{SS}})/M_0$
(dot-dashed line) given by (5.19) as functions of
$M_{\textit{dist}}(t_{\textit{SS}})/M_0$
(dot-dashed line) given by (5.19) as functions of
 $\theta ^*$
for a droplet evaporating in the SS mode. The squares in (a) correspond to
$\theta ^*$
for a droplet evaporating in the SS mode. The squares in (a) correspond to
 $t=t^*$
, the dots in (b) and (c) correspond to the values of
$t=t^*$
, the dots in (b) and (c) correspond to the values of
 $M_{\textit{ring}}/M_0$
and
$M_{\textit{ring}}/M_0$
and
 $M_{\textit{dist}}/M_0$
at
$M_{\textit{dist}}/M_0$
at
 $t=t_{\textit{SS}}$
, respectively, and the dotted and dashed lines correspond to the solutions when
$t=t_{\textit{SS}}$
, respectively, and the dotted and dashed lines correspond to the solutions when
 $\theta ^*=0$
(CR mode) and
$\theta ^*=0$
(CR mode) and
 $\theta ^*=1$
(CA mode), respectively. The arrows indicate the direction of increasing
$\theta ^*=1$
(CA mode), respectively. The arrows indicate the direction of increasing
 $\theta ^*$
.
$\theta ^*$
.

The mass of particles on the substrate at the end of the evaporation is therefore split between the ring deposit and the distributed deposit with the final mass in each given by evaluating
 $M_{\textit{ring}}$
given by (5.17) and
$M_{\textit{ring}}$
given by (5.17) and
 $M_{\textit{dist}}$
given by (5.18) at
$M_{\textit{dist}}$
given by (5.18) at
 $t=t^*$
and
$t=t^*$
and
 $t=t_{\textit{SS}}$
, respectively, to yield
$t=t_{\textit{SS}}$
, respectively, to yield
 \begin{align} M_{\textit{ring}}(t^*)=M_{\textit{ring}}(t_{\textit{SS}})= M_0\big (1-{\theta ^*}^{3/4}\big )^{4/3}, \,\, M_{\textit{dist}}(t_{\textit{SS}})= M_0\left [1-\big (1-{\theta ^*}^{3/4}\big )^{4/3}\right ]\!. \end{align}
Note that (5.16), (5.17) and (5.18) recover the solutions for a droplet evaporating in the CR mode, given by (3.11) and (3.12), and the CA mode, given by (4.17) and (4.18), when
 $\theta ^*=0$
and
$\theta ^*=0$
and
 $\theta ^*=1$
, respectively.
$\theta ^*=1$
, respectively.
Figure 12 shows plots of the evolutions of
 $M_{\textit{drop}}/M_0$
given by (5.16),
$M_{\textit{drop}}/M_0$
given by (5.16),
 $M_{\textit{ring}}/M_0$
given by (5.17), and
$M_{\textit{ring}}/M_0$
given by (5.17), and
 $M_{\textit{dist}}/M_0$
given by (5.18) as functions of
$M_{\textit{dist}}/M_0$
given by (5.18) as functions of
 $t/t_{\textit{SS}}$
for a range of values of
$t/t_{\textit{SS}}$
for a range of values of
 $\theta ^*$
, and of
$\theta ^*$
, and of
 $M_{\textit{ring}}(t_{\textit{SS}})/M_0$
and
$M_{\textit{ring}}(t_{\textit{SS}})/M_0$
and
 $M_{\textit{dist}}(t_{\textit{SS}})/M_0$
given by (5.19) as functions of
$M_{\textit{dist}}(t_{\textit{SS}})/M_0$
given by (5.19) as functions of
 $\theta ^*$
for a droplet evaporating in the SS mode. In particular, the deposit is a combination of a single ring deposit at
$\theta ^*$
for a droplet evaporating in the SS mode. In particular, the deposit is a combination of a single ring deposit at
 $r=1$
and a near-uniform deposit in the region
$r=1$
and a near-uniform deposit in the region
 $0\leqslant r\leqslant 1$
in the SS mode. The final masses in the ring and the distributed deposits depend upon the value of the receding contact angle, and are monotonically decreasing and increasing functions of
$0\leqslant r\leqslant 1$
in the SS mode. The final masses in the ring and the distributed deposits depend upon the value of the receding contact angle, and are monotonically decreasing and increasing functions of
 $\theta ^*$
, respectively, as illustrated in figure 12(d). Moreover, there is a critical receding contact angle,
$\theta ^*$
, respectively, as illustrated in figure 12(d). Moreover, there is a critical receding contact angle,
 $\theta ^*\simeq 0.300$
, at which the final masses in the ring deposit and in the distributed deposit are the same, and above which more mass is deposited onto the substrate in the distributed deposit than in the ring deposit.
$\theta ^*\simeq 0.300$
, at which the final masses in the ring deposit and in the distributed deposit are the same, and above which more mass is deposited onto the substrate in the distributed deposit than in the ring deposit.
Substituting the expression for
 $r_0(R,t_{\textit{dist}})$
given by (4.13) into (2.41) and recalling that
$r_0(R,t_{\textit{dist}})$
given by (4.13) into (2.41) and recalling that
 $t_{\textit{d}}=t^*$
yields the explicit expression for the density of the distributed deposit on the substrate, namely
$t_{\textit{d}}=t^*$
yields the explicit expression for the density of the distributed deposit on the substrate, namely
 \begin{equation} \phi _{\textit{dist}}=\dfrac {3{\theta ^*}^{3/4}r^{1/4}}{8}\big (1-{\theta ^*}^{3/4}r^{9/4}\big )^{1/3}. \end{equation}
Specifically,
 $\phi _{\textit{dist}}$
approaches zero at the centre of the droplet, i.e.
$\phi _{\textit{dist}}$
approaches zero at the centre of the droplet, i.e.
 $\phi _{\textit{dist}}=O (r^{1/4} )\to 0^{+}$
as
$\phi _{\textit{dist}}=O (r^{1/4} )\to 0^{+}$
as
 $r\to 0^+$
, and is finite and non-zero for all
$r\to 0^+$
, and is finite and non-zero for all
 $0\lt \theta ^*\lt 1$
at the contact line, i.e.
$0\lt \theta ^*\lt 1$
at the contact line, i.e.
 $\phi _{\textit{dist}}(1)=3{\theta ^*}^{3/4} (1-{\theta ^*}^{3/4})^{1/3}$
. Note that (5.20) recovers the solution for a droplet evaporating in the CA mode given by (4.19) when
$\phi _{\textit{dist}}(1)=3{\theta ^*}^{3/4} (1-{\theta ^*}^{3/4})^{1/3}$
. Note that (5.20) recovers the solution for a droplet evaporating in the CA mode given by (4.19) when
 $\theta ^*=1$
. Since
$\theta ^*=1$
. Since
 $\phi _{\textit{dist}}$
describes the density of the distributed deposit, i.e. the mass of particles on the substrate deposited via the receding contact line, it does not include the mass in the ring deposit that forms during the CR phase of the SS mode.
$\phi _{\textit{dist}}$
describes the density of the distributed deposit, i.e. the mass of particles on the substrate deposited via the receding contact line, it does not include the mass in the ring deposit that forms during the CR phase of the SS mode.
Figure 13 shows a plot of
 $\phi _{\textit{dist}}$
given by (5.20) as a function of
$\phi _{\textit{dist}}$
given by (5.20) as a function of
 $r$
for a range of values of
$r$
for a range of values of
 $\theta ^*$
for a droplet evaporating in the SS mode. In particular, as figure 13 shows,
$\theta ^*$
for a droplet evaporating in the SS mode. In particular, as figure 13 shows,
 $\phi _{\textit{dist}}$
is nearly uniform and non-zero at the contact line for all
$\phi _{\textit{dist}}$
is nearly uniform and non-zero at the contact line for all
 $0\lt \theta ^*\lt 1$
. In contrast to the CA mode when
$0\lt \theta ^*\lt 1$
. In contrast to the CA mode when
 $\theta ^*=1$
, the non-zero density of the distributed deposit at the contact line is due to the presence of particles at the contact line when the droplet initially de-pins at
$\theta ^*=1$
, the non-zero density of the distributed deposit at the contact line is due to the presence of particles at the contact line when the droplet initially de-pins at
 $t_{\textit{d}}=t^*$
.
$t_{\textit{d}}=t^*$
.
Plot of the density profile of the mass of particles on the substrate
 $\phi _{\textit{dist}}$
given by (5.20) as a function of
$\phi _{\textit{dist}}$
given by (5.20) as a function of
 $r$
when
$r$
when
 $\theta ^*=1/6$
,
$\theta ^*=1/6$
,
 $2/6$
, …,
$2/6$
, …,
 $5/6$
for a droplet evaporating in the SS mode. The dashed line corresponds to the solution when
$5/6$
for a droplet evaporating in the SS mode. The dashed line corresponds to the solution when
 $\theta ^*=1$
(CA mode), and the arrow indicates the direction of increasing
$\theta ^*=1$
(CA mode), and the arrow indicates the direction of increasing
 $\theta ^*$
.
$\theta ^*$
.

5.4. Validation against previous experimental studies
The behaviour that the mass left behind on the substrate is split between a ring deposit and some distributed deposit within the original footprint of the droplet when the droplet evaporates in the SS mode has been reported in the literature on several occasions (see, for example, Kim et al. Reference Kim, Ahn, Kim and Zin2007; Chhasatia & Sun Reference Chhasatia and Sun2011; Yunker et al. Reference Yunker, Still, Lohr and Yodh2011; Li et al. Reference Li, Lv, Li, Quéré and Zheng2015; Iqbal et al. Reference Iqbal, Majhy, Shen and Sen2018; Kim et al. Reference Kim, Pack, Rokoni, Kaneelil and Sun2018; Patil, Bhardwaj & Sharma Reference Patil, Bhardwaj and Sharma2018; Yu et al. Reference Yu, Wang, Zhu, Zhou and Zhou2019), which is consistent with the predictions of the present model. In order to make a quantitative comparison with these experimental observations, we compare the final mass in the ring deposit and the distributed deposit with the experimental measurements by Yunker et al. (Reference Yunker, Still, Lohr and Yodh2011), Li et al. (Reference Li, Lv, Li, Quéré and Zheng2015) and Kim et al. (Reference Kim, Pack, Rokoni, Kaneelil and Sun2018). Specifically, these experiments concern the deposition of spherical polystyrene particles from water droplets evaporating on glass substrates and either report values for the mass within the ring deposit (figure 1b in Li et al. Reference Li, Lv, Li, Quéré and Zheng2015) or provide deposit profiles for which this value may be extracted (figure 1d in Yunker et al. Reference Yunker, Still, Lohr and Yodh2011; figure 6a in Kim et al. Reference Kim, Pack, Rokoni, Kaneelil and Sun2018), as well as values for the time at which the contact line de-pins, which enables comparisons with the theory.
Figure 14 shows a plot of
 $M_{\textit{ring}}(t_{\textit{SS}})/M_0$
and
$M_{\textit{ring}}(t_{\textit{SS}})/M_0$
and
 $M_{\textit{dist}}(t_{\textit{SS}})/M_0$
for a droplet undergoing diffusion-limited evaporation in the SS mode given by (5.19), as well as the experimental results of Yunker et al. (Reference Yunker, Still, Lohr and Yodh2011), Li et al. (Reference Li, Lv, Li, Quéré and Zheng2015) and Kim et al. (Reference Kim, Pack, Rokoni, Kaneelil and Sun2018). In particular, as figure 14 shows, despite the simplicity of the present model, the theoretical predictions agree very well with the experimental results for a range of de-pinning angles showing that the present model provides an accurate prediction for the mass of particles in the ring deposit after evaporation.
$M_{\textit{dist}}(t_{\textit{SS}})/M_0$
for a droplet undergoing diffusion-limited evaporation in the SS mode given by (5.19), as well as the experimental results of Yunker et al. (Reference Yunker, Still, Lohr and Yodh2011), Li et al. (Reference Li, Lv, Li, Quéré and Zheng2015) and Kim et al. (Reference Kim, Pack, Rokoni, Kaneelil and Sun2018). In particular, as figure 14 shows, despite the simplicity of the present model, the theoretical predictions agree very well with the experimental results for a range of de-pinning angles showing that the present model provides an accurate prediction for the mass of particles in the ring deposit after evaporation.
Comparison between the theoretical predictions for the final mass deposited on the substrate in the ring deposit
 $M_{\textit{ring}}(t_{\textit{SS}})/M_0$
(solid line) and the distributed deposit
$M_{\textit{ring}}(t_{\textit{SS}})/M_0$
(solid line) and the distributed deposit
 $M_{\textit{dist}}(t_{\textit{SS}})/M_0$
(dot-dashed line) given by (5.19) for a droplet evaporating in the SS mode with experimental data from Li et al. (Reference Li, Lv, Li, Quéré and Zheng2015) (squares
$M_{\textit{dist}}(t_{\textit{SS}})/M_0$
(dot-dashed line) given by (5.19) for a droplet evaporating in the SS mode with experimental data from Li et al. (Reference Li, Lv, Li, Quéré and Zheng2015) (squares
 $\blacksquare$
), Yunker et al. (Reference Yunker, Still, Lohr and Yodh2011) (diamonds
$\blacksquare$
), Yunker et al. (Reference Yunker, Still, Lohr and Yodh2011) (diamonds ![]() ) and Kim et al. (Reference Kim, Pack, Rokoni, Kaneelil and Sun2018) (triangles
) and Kim et al. (Reference Kim, Pack, Rokoni, Kaneelil and Sun2018) (triangles
 $\blacktriangle$
).
$\blacktriangle$
).

6. The SJ mode
6.1. The evolution of the droplet
In the SJ mode the evolution of a droplet consists of an infinite series of CR phases separated by an infinite series of jump phases in which the contact angle jumps instantaneously from
 $\theta _{\textit{min}}$
to
$\theta _{\textit{min}}$
to
 $\theta _{\textit{max}}$
, where
$\theta _{\textit{max}}$
, where
 $0\leqslant \theta _{\textit{min}}\leqslant \theta _{\textit{max}}\leqslant 1$
, with a corresponding jump decrease in the contact radius. We denote the constant value of the pinned contact radius during the
$0\leqslant \theta _{\textit{min}}\leqslant \theta _{\textit{max}}\leqslant 1$
, with a corresponding jump decrease in the contact radius. We denote the constant value of the pinned contact radius during the
 $n{\text{th}}$
CR phase by
$n{\text{th}}$
CR phase by
 $R_n$
, which lasts from
$R_n$
, which lasts from
 $t=t_{n-1}$
to
$t=t_{n-1}$
to
 $t=t_n$
.
$t=t_n$
.
We assume that mass is conserved during the
 $n^{\text{}}$
th jump, i.e.
$n^{\text{}}$
th jump, i.e.
 $V(R_n,\theta _{\textit{min}})=V(R_{n+1},\theta _{\textit{max}})$
at
$V(R_n,\theta _{\textit{min}})=V(R_{n+1},\theta _{\textit{max}})$
at
 $t=t_n$
. Therefore, from (2.14), the contact radius
$t=t_n$
. Therefore, from (2.14), the contact radius
 $R=R_n$
satisfies
$R=R_n$
satisfies
 \begin{equation} R_{n}=\left (\dfrac {\theta _{\textit{min}}}{\theta _{\textit{max}}}\right )^{1/3}R_{n-1}=\left (\dfrac {\theta _{\textit{min}}}{\theta _{\textit{max}}}\right )^{(n-1)/3}. \end{equation}
During the
 $n{\text{th}}$
CR phase, lasting from
$n{\text{th}}$
CR phase, lasting from
 $t=t_{n-1}$
to
$t=t_{n-1}$
to
 $t=t_n$
, (2.6) becomes
$t=t_n$
, (2.6) becomes
 \begin{equation} \dfrac {\text {d}V}{\text {d}t}=\dfrac {\pi R_n^3}{4}\dfrac {\text {d}\theta }{\text {d}t}=-4R_n. \end{equation}
Solving (6.2) yields the well-known explicit evolution of the droplet, namely
 \begin{align}&\qquad\qquad\qquad\qquad\quad R_1\equiv 1, \quad \theta =1-\dfrac {16}{\pi }t \quad \text{for} \quad 0\leqslant t\leqslant t_1, \end{align}
 \begin{align}& R_n\equiv \left (\dfrac {\theta _{\textit{min}}}{\theta _{\textit{max}}}\right )^{(n-1)/3}\!, \!\!\quad \theta =\theta _{\textit{max}}-\dfrac {16}{\pi R_n^2}\left (t-t_{n-1}\right ) \quad\!\! \text{for} \quad t_{n-1}\leqslant t\leqslant t_n,\, n=2,3,4,\ldots , \end{align}
with
 $h$
and
$h$
and
 $V$
given by (2.13) and (2.14), respectively, and the critical times
$V$
given by (2.13) and (2.14), respectively, and the critical times
 $t_1$
and
$t_1$
and
 $t_n$
at which the droplet jumps satisfy
$t_n$
at which the droplet jumps satisfy
 $\theta (t_i)=\theta _{\textit{min}}$
are therefore given by
$\theta (t_i)=\theta _{\textit{min}}$
are therefore given by
 \begin{equation} t_1=\dfrac {\pi }{16}\left (1-\theta _{\textit{min}}\right ) \end{equation}
and
 \begin{equation} t_n= \dfrac {\pi }{16}\left [1-\theta _{\textit{max}}+\left (\theta _{\textit{max}}-\theta _{\textit{min}}\right ) \left (\dfrac {1-\left (\dfrac {\theta _{\textit{min}}}{\theta _{\textit{max}}}\right )^{2n/3}}{1-\left (\dfrac {\theta _{\textit{min}}}{\theta _{\textit{max}}}\right )^{2/3}} \right )\right ] \end{equation}
(see, for example, Wilson & Duffy Reference Wilson and Duffy2022). The lifetime of the droplet
 $t_{\textit{SJ}}$
is found by taking the limit of (6.6) as
$t_{\textit{SJ}}$
is found by taking the limit of (6.6) as
 $n\to \infty$
, which gives
$n\to \infty$
, which gives
 \begin{equation} t_{\textit{SJ}}= \dfrac {\pi }{16}\left [1-\theta _{\textit{max}}+\left (\theta _{\textit{max}}-\theta _{\textit{min}}\right ) \dfrac {\theta _{\textit{max}}^{2/3}}{\theta _{\textit{max}}^{2/3}-\theta _{\textit{min}}^{2/3}}\right ]\!. \end{equation}
6.2. The flow within the droplet
Substituting the expressions for
 $J$
and
$J$
and
 $h$
given by (2.4) and (2.13), respectively, into (2.24) and evaluating the integral gives the following solution for
$h$
given by (2.4) and (2.13), respectively, into (2.24) and evaluating the integral gives the following solution for
 $Q$
in the SJ mode:
$Q$
in the SJ mode:
 \begin{equation} Q=\dfrac {2R_n}{\pi r}\left [\sqrt {1-\dfrac {r^2}{R_n^2}}-\left (1-\dfrac {r^2}{R_n^2}\right )^2\right ]\!, \end{equation}
and hence the depth-averaged velocity
 $\bar {u}$
is
$\bar {u}$
is
 \begin{equation} \bar {u}=\dfrac {4}{\pi \theta r}\left [\left (1-\dfrac {r^2}{R_n^2}\right )^{-1/2} -\left (1-\dfrac {r^2}{R_n^2}\right )\right ]\!. \end{equation}
The behaviour of
 $Q$
and
$Q$
and
 $\bar {u}$
given by (6.8) and (6.9), respectively, corresponds to the behaviour for a droplet evaporating in the CR mode, and so are not plotted here for brevity. In particular, in each CR phase, the depth-averaged radial velocity is outwards towards the pinned contact line
$\bar {u}$
given by (6.8) and (6.9), respectively, corresponds to the behaviour for a droplet evaporating in the CR mode, and so are not plotted here for brevity. In particular, in each CR phase, the depth-averaged radial velocity is outwards towards the pinned contact line
 $R_n$
, i.e.
$R_n$
, i.e.
 $Q\geqslant 0$
and
$Q\geqslant 0$
and
 $\bar {u}\geqslant 0$
for all
$\bar {u}\geqslant 0$
for all
 $0\leqslant t\leqslant t_{\textit{SJ}}$
,
$0\leqslant t\leqslant t_{\textit{SJ}}$
,
 $Q$
is independent of
$Q$
is independent of
 $t$
, and
$t$
, and
 $\bar {u}$
is singular at the pinned contact line
$\bar {u}$
is singular at the pinned contact line
 $R_n$
.
$R_n$
.
6.3. The deposition of particles
For a droplet evaporating in the SJ mode, the characteristic equations (2.29) may be expressed as
 \begin{equation} \dfrac {\text {d}r}{\text {d}\theta }=\dfrac {\text {d}r/\text {d}t}{\text {d}\theta /\text {d}t}= \dfrac {\bar {u}}{\text {d}\theta /\text {d}t}, \quad \dfrac {\text {d}\phi }{\text {d}\theta }=\dfrac {\text {d}\phi /\text {d}t}{\text {d}\theta /\text {d}t}= \dfrac {J\,\phi }{h\,\text {d}\theta /\text {d}t}, \end{equation}
subject to the initial condition
 $\phi _0(r)=1$
for
$\phi _0(r)=1$
for
 $0\leqslant t\leqslant t_1$
, and
$0\leqslant t\leqslant t_1$
, and
 $\phi (r,t_{n-1})=\phi _{n,0}(r)$
for
$\phi (r,t_{n-1})=\phi _{n,0}(r)$
for
 $t_{n-1}\leqslant t\leqslant t_n$
and
$t_{n-1}\leqslant t\leqslant t_n$
and
 $n=2,3,4,\ldots$
.
$n=2,3,4,\ldots$
.
For
 $0\leqslant t\leqslant t_1$
, substituting the expressions for
$0\leqslant t\leqslant t_1$
, substituting the expressions for
 $J$
,
$J$
,
 $h$
,
$h$
,
 $\text {d}\theta /\text {d}t$
and
$\text {d}\theta /\text {d}t$
and
 $\bar {u}$
from (2.4), (2.13), (6.2) and (6.9) into (6.10) gives
$\bar {u}$
from (2.4), (2.13), (6.2) and (6.9) into (6.10) gives
 \begin{equation} \dfrac {\text {d}r}{\text {d}\theta }=-\dfrac {1}{4\theta r}\Big [\big (1-r^2\big )^{-1/2}-\big (1-r^2\big )\Big ], \quad \dfrac {\text {d}\phi }{\text {d}\theta }=-\dfrac {\phi }{4\theta }\big (1-r^2\big )^{-3/2}. \end{equation}
The characteristic equations given by (6.11) are exactly those given by (3.5) for a droplet evaporating in the CR mode with the same prescribed initial condition and so may solved in the same manner as detailed in § 3.3. In particular, the explicit expressions for
 $r_0(r,t)$
,
$r_0(r,t)$
,
 $r_0(1,t_{\textit{ring}})$
and
$r_0(1,t_{\textit{ring}})$
and
 $\phi$
are given by (3.7), (3.8) and (3.10), respectively, during the first CR phase.
$\phi$
are given by (3.7), (3.8) and (3.10), respectively, during the first CR phase.
For
 $t_{n-1}\leqslant t\leqslant t_n$
and
$t_{n-1}\leqslant t\leqslant t_n$
and
 $n=2,3,4,\ldots$
, substituting the expressions for
$n=2,3,4,\ldots$
, substituting the expressions for
 $J$
,
$J$
,
 $h$
,
$h$
,
 $\text {d}\theta /\text {d}t$
and
$\text {d}\theta /\text {d}t$
and
 $\bar {u}$
from (2.4), (2.13), (6.2) and (6.9) into (6.10) gives
$\bar {u}$
from (2.4), (2.13), (6.2) and (6.9) into (6.10) gives
 \begin{equation} \dfrac {\text {d}r}{\text {d}\theta }=-\dfrac {R_n^2}{4\theta r}\left [\left (1-\dfrac {r^2} {R_n^2}\right )^{-1/2} -\left (1-\dfrac {r^2}{R_n^2}\right )\right ]\!, \quad \dfrac {\text {d}\phi }{\text {d}\theta }=-\dfrac {\phi }{4\theta }\left (1-\dfrac {r^2}{R_n^2}\right )^{-3/2}. \end{equation}
Note that (6.12a ) is separable and using separation of variables gives
 \begin{equation} r_{0}(r,t)=R_n\sqrt {1-\left (\dfrac {\theta }{\theta _{\textit{max}}}\right )^{1/2} \left [\left (\dfrac {\theta }{\theta _{\textit{max}}}\right )^{-3/4}-1+\left (1- \dfrac {r^2}{R_n^2}\right )^{3/2}\right ]^{2/3}}, \end{equation}
where
 $r_{0}= r_{0}(r,t)$
denotes the initial radial position of particles at the beginning of the
$r_{0}= r_{0}(r,t)$
denotes the initial radial position of particles at the beginning of the
 $n{\text{th}}$
CR phase, i.e. at
$n{\text{th}}$
CR phase, i.e. at
 $t=t_{n-1}$
, that are at radial position
$t=t_{n-1}$
, that are at radial position
 $r$
at time
$r$
at time
 $t$
. In particular, the time it takes for particles to travel to the pinned contact line, i.e. to
$t$
. In particular, the time it takes for particles to travel to the pinned contact line, i.e. to
 $r=R_n$
, where they are then deposited into the
$r=R_n$
, where they are then deposited into the
 $n^{\text{}}$
th ring deposit, defined by
$n^{\text{}}$
th ring deposit, defined by
 $t=t_{\textit{ring}_n}$
, is given implicitly by
$t=t_{\textit{ring}_n}$
, is given implicitly by
 $r_{0} (R_n,t_{\textit{ring}_n} )$
, namely
$r_{0} (R_n,t_{\textit{ring}_n} )$
, namely
 \begin{equation} \quad r_{0}(R_n,t_{\textit{ring}_n})=R_n\sqrt {1-\left [1-\left (\dfrac {\theta }{\theta _{\textit{max}}}\right )^{3/4}\right ]^{2/3}}. \end{equation}
Substituting the expression for
 $r$
given implicitly by (6.13) into (6.12b
), the equation becomes separable and may be rewritten as
$r$
given implicitly by (6.13) into (6.12b
), the equation becomes separable and may be rewritten as
 \begin{equation} \int _{\phi _{n,0}(r_0)}^{\phi }{\dfrac {1}{\hat {\phi }}\,\text {d}\hat {\phi }}= -\int _{\theta _{\textit{max}}}^{\theta }{\dfrac {1}{4\hat {\theta }^{1/4}\theta _{\textit{max}}^{3/4}\left [ \left (\dfrac {\hat {\theta }}{\theta _{\textit{max}}}\right )^{3/4}-1+\left (1-\dfrac {r_{0}^2}{R_n^2}\right )^{3/2} \right ]}\,\text {d}\hat {\theta }}, \end{equation}
where
 $\phi _{n,0}(r)=\phi (r,t_{n-1})$
denotes the concentration of particles within the droplet at the beginning of the
$\phi _{n,0}(r)=\phi (r,t_{n-1})$
denotes the concentration of particles within the droplet at the beginning of the
 $n{\text{th}}$
CR phase, i.e. immediately after the
$n{\text{th}}$
CR phase, i.e. immediately after the
 ${(n-1)}{\text{th}}$
jump, which is yet to be determined. Performing the integral in (6.15) shows that
${(n-1)}{\text{th}}$
jump, which is yet to be determined. Performing the integral in (6.15) shows that
 $\phi$
is given parametrically by
$\phi$
is given parametrically by
 \begin{equation} \phi =\phi _{n,0}(r_0)\left [\dfrac {\left (1-\dfrac {r_0^2}{R_n^2}\right )^{3/2}} {\left (\dfrac {\theta }{\theta _{\textit{max}}}\right )^{3/4}-1+\left (1-\dfrac {r_0^2}{R_n^2}\right )^{3/2}}\right ]^{1/3}. \end{equation}
In order to determine an explicit solution for
 $\phi$
, we have to make an assumption regarding what happens to the particles within the droplet during the
$\phi$
, we have to make an assumption regarding what happens to the particles within the droplet during the
 ${(n-1)}{\text{th}}$
jump so that we can determine
${(n-1)}{\text{th}}$
jump so that we can determine
 $\phi _{n,0}(r)$
. Since the jump is theoretically instantaneous we assume conservation of the mass of particles within the droplet across the jump phase. It follows that
$\phi _{n,0}(r)$
. Since the jump is theoretically instantaneous we assume conservation of the mass of particles within the droplet across the jump phase. It follows that
 $\phi _{n,0}(r)$
must satisfy
$\phi _{n,0}(r)$
must satisfy
 \begin{equation} \int _0^{r}{\phi _{n,0}(\tilde {r})\,h_{n,0}(\tilde {r})\,\tilde {r}\;\text {d}\tilde {r}}= \int _0^{r^*}{\phi _{n-1,\textit{end}}(\tilde {r})\,h_{n-1,\textit{end}}(\tilde {r})\,\tilde {r}\;\text {d}\tilde {r}}, \end{equation}
where
 \begin{equation} r^*=\dfrac {R_{n-1}}{R_n}r, \end{equation}
 $0\leqslant r\leqslant R_n$
and
$0\leqslant r\leqslant R_n$
and
 $0\leqslant r^*\leqslant R_{n-1}$
,
$0\leqslant r^*\leqslant R_{n-1}$
,
 $h_{n,0}(r)=h(r,t_{n-1})$
denotes the profile of the droplet at the beginning of the
$h_{n,0}(r)=h(r,t_{n-1})$
denotes the profile of the droplet at the beginning of the
 $n{\text{th}}$
CR phase, i.e. immediately after the
$n{\text{th}}$
CR phase, i.e. immediately after the
 ${(n-1)}{\text{th}}$
jump, and
${(n-1)}{\text{th}}$
jump, and
 $\phi _{n-1,\textit{end}}(r)=\phi (r,t_{n-1})$
and
$\phi _{n-1,\textit{end}}(r)=\phi (r,t_{n-1})$
and
 $h_{n-1,\textit{end}}(r)=h(r,t_{n-1})$
denote the concentration of particles within the droplet and the profile of the droplet, respectively, at the end of the
$h_{n-1,\textit{end}}(r)=h(r,t_{n-1})$
denote the concentration of particles within the droplet and the profile of the droplet, respectively, at the end of the
 ${(n-1)}{\text{th}}$
CR phase, i.e. immediately before the
${(n-1)}{\text{th}}$
CR phase, i.e. immediately before the
 ${(n-1)}{\text{th}}$
jump. Differentiating (6.17) with respect to
${(n-1)}{\text{th}}$
jump. Differentiating (6.17) with respect to
 $r$
and rearranging yields
$r$
and rearranging yields
 \begin{equation} \phi _{n,0}(r) =\phi _{n-1,\textit{end}}\left (r^*\right )\dfrac {h_{n-1,\textit{end}}(r^*)}{h_{n,0}(r)}\dfrac {r^*}{r}\dfrac {\text {d}r^*}{\text {d}r}, \end{equation}
which, using (6.18), simplifies to
 \begin{equation} \phi _{n,0}(r) =\phi _{n-1,\textit{end}}\left (\dfrac {R_{n-1}}{R_n}r\right )\!, \end{equation}
since, from (2.13),
 \begin{equation} \dfrac {h_{n-1,\textit{end}}\left ( \dfrac {R_{n-1}}{R_n}r\right )}{h_{n,0}(r)}\left (\dfrac {R_{n-1}}{R_n}\right )^2=1. \end{equation}
Substituting the expression for
 $\phi _{n,0}(r)$
given by (6.20) into (6.16) gives
$\phi _{n,0}(r)$
given by (6.20) into (6.16) gives
 \begin{equation} \phi =\phi _{n-1,\textit{end}}\left (\dfrac {R_{n-1}}{R_n}r_0\right ) \left [\dfrac {\left (1-\dfrac {r_0^2}{R_n^2}\right )^{3/2}} {\left (\dfrac {\theta }{\theta _{\textit{max}}}\right )^{3/4}-1+\left (1-\dfrac {r_0^2}{R_n^2}\right )^{3/2}}\right ]^{1/3}. \end{equation}
Finally, eliminating
 $r_0$
between (6.13) and (6.22) and recalling that the solution for
$r_0$
between (6.13) and (6.22) and recalling that the solution for
 $\phi$
during the first CR phase is given explicitly by (3.10), it may be shown by induction that the concentration of particles within the droplet during the
$\phi$
during the first CR phase is given explicitly by (3.10), it may be shown by induction that the concentration of particles within the droplet during the
 $n^{\text{}}$
th CR phase is given explicitly by
$n^{\text{}}$
th CR phase is given explicitly by
 \begin{equation} \phi = \left [1+\left (1-\dfrac {r^2}{R_n^2}\right )^{-3/2}\big (\theta ^{-3/4}R_n^{-9/4}-1\big )\right ]^{1/3}\!. \end{equation}
Details of the proof by induction of (6.23) may be found in Appendix A. Note that (3.10) holds for the entire lifetime of the droplet when
 $\theta _{\textit{min}}=0$
, and that (6.23) recovers the solution for a droplet evaporating in the CA mode given by (4.16) and in the SS mode given by (5.15) when
$\theta _{\textit{min}}=0$
, and that (6.23) recovers the solution for a droplet evaporating in the CA mode given by (4.16) and in the SS mode given by (5.15) when
 $R_n=R$
,
$R_n=R$
,
 $\theta _{\textit{min}}=\theta _{\textit{max}}=1$
, and when
$\theta _{\textit{min}}=\theta _{\textit{max}}=1$
, and when
 $R_n=R$
,
$R_n=R$
,
 $\theta _{\textit{max}}\to \theta _{\textit{min}}=\theta ^*$
, respectively. Figure 15 shows
$\theta _{\textit{max}}\to \theta _{\textit{min}}=\theta ^*$
, respectively. Figure 15 shows
 $\phi$
given by (6.23) and
$\phi$
given by (6.23) and
 $\phi h$
plotted as functions of
$\phi h$
plotted as functions of
 $r$
at different times for a droplet evaporating in the SJ mode for
$r$
at different times for a droplet evaporating in the SJ mode for
 $\theta _{\textit{min}}=1/2$
,
$\theta _{\textit{min}}=1/2$
,
 $\theta _{\textit{max}}=1$
, and the first
$\theta _{\textit{max}}=1$
, and the first
 $6$
jump phases. The behaviour of
$6$
jump phases. The behaviour of
 $\phi$
in each CR phase corresponds to the behaviour for a droplet evaporating in the CR mode. Specifically,
$\phi$
in each CR phase corresponds to the behaviour for a droplet evaporating in the CR mode. Specifically,
 $\phi$
is a monotonically increasing function of
$\phi$
is a monotonically increasing function of
 $r$
and is singular at the pinned contact line
$r$
and is singular at the pinned contact line
 $R_n$
in each CR phase, as illustrated in figure 15(a).
$R_n$
in each CR phase, as illustrated in figure 15(a).
Plot of (a) the concentration of particles
 $\phi$
and (b) the mass per unit area
$\phi$
and (b) the mass per unit area
 $\phi h$
within the droplet as functions of
$\phi h$
within the droplet as functions of
 $r$
at
$r$
at
 $t=t_{n-1},t_{n-1}+(t_n-t_{n-1})/3, t_{n-1}+2(t_n-t_{n-1})/3,t_n$
for a droplet evaporating in the SJ mode for
$t=t_{n-1},t_{n-1}+(t_n-t_{n-1})/3, t_{n-1}+2(t_n-t_{n-1})/3,t_n$
for a droplet evaporating in the SJ mode for
 $\theta _{\textit{min}}=1/2$
,
$\theta _{\textit{min}}=1/2$
,
 $\theta _{\textit{max}}=1$
, and the first
$\theta _{\textit{max}}=1$
, and the first
 $6$
jump phases. The dashed and dotted lines correspond to (a)
$6$
jump phases. The dashed and dotted lines correspond to (a)
 $\phi _{n,0}(r)$
and
$\phi _{n,0}(r)$
and
 $\phi _{n-1,\textit{end}}(r)$
and (b)
$\phi _{n-1,\textit{end}}(r)$
and (b)
 $\phi _{n,0}(r)h_{n,0}(r)$
and
$\phi _{n,0}(r)h_{n,0}(r)$
and
 $\phi _{n-1,\textit{end}}(r)h_{n-1,\textit{end}}(r)$
, respectively, and the arrow in (a) indicates the direction of increasing
$\phi _{n-1,\textit{end}}(r)h_{n-1,\textit{end}}(r)$
, respectively, and the arrow in (a) indicates the direction of increasing
 $t$
.
$t$
.

Substituting
 $t_{{p}}=0$
,
$t_{{p}}=0$
,
 $R_{{p}}=1$
, and the expression for
$R_{{p}}=1$
, and the expression for
 $r_0(1,t_{\textit{ring}})$
given by (3.8) for
$r_0(1,t_{\textit{ring}})$
given by (3.8) for
 $n=1$
and
$n=1$
and
 $t_{{p}}=t_{n-1}$
,
$t_{{p}}=t_{n-1}$
,
 $R_{{p}}=R_n$
, and the expression for
$R_{{p}}=R_n$
, and the expression for
 $r_0(R_n,t_{\textit{ring}_n})$
given by (6.13) for
$r_0(R_n,t_{\textit{ring}_n})$
given by (6.13) for
 $n=2,3,4\ldots$
into (2.34) and evaluating the integrals yields the explicit expressions for the mass of particles in the bulk of the droplet, namely
$n=2,3,4\ldots$
into (2.34) and evaluating the integrals yields the explicit expressions for the mass of particles in the bulk of the droplet, namely
 \begin{align} M_{\textit{drop}}&=2\pi {\begin{cases} {\displaystyle\int}_{\!\! \kern-2pt 0}^{r_0(1,t_{\textit{ring}})}{ h(r,0)\,r\;\text {d}r} \quad &\text{for} \quad 0\leqslant t\leqslant t_1,\\[5pt] {\displaystyle\int}_{\!\! \kern-2pt 0}^{r_0(R_n,t_{\textit{ring}_n})}{ \phi _{n,0}(r)\,h_{n,0}(r)\,r\;\text {d}r} \quad &\text{for} \quad t_{n-1}\leqslant t\leqslant t_n,\,n=2,3,4,\ldots , \end{cases}} \nonumber \\ &= M_0 {\begin{cases} 1-\left (1-\theta ^{3/4}\right )^{4/3} \quad &\text{for} \quad 0\leqslant t\leqslant t_1,\\ 1-\big (1-\theta ^{3/4}R_n^{9/4}\big )^{4/3} \quad &\text{for} \quad t_{n-1}\leqslant t\leqslant t_n,\,n=2,3,4,\ldots , \end{cases}} \end{align}
where, again, the initial mass of particles in the droplet is given by (2.31) to be
 $M_0=\pi /4$
. The mass of particles in the
$M_0=\pi /4$
. The mass of particles in the
 $n^{\text{}}$
th ring deposit at time
$n^{\text{}}$
th ring deposit at time
 $t$
, defined by
$t$
, defined by
 ${M_{\textit{ring}}}_n={M_{\textit{ring}}}_n(t)$
and located at
${M_{\textit{ring}}}_n={M_{\textit{ring}}}_n(t)$
and located at
 $r=R_n$
, from (2.35) is given by
$r=R_n$
, from (2.35) is given by
 \begin{align} {M_{\textit{ring}}}_n&= 2\pi {\begin{cases} {\displaystyle\int}_{\!\! \kern-2pt r_0(1,t_{\textit{ring}})}^1{ h(r,0)\,r\;\text {d}r} \quad &\text{for} \quad n=1,\\[5pt] {\displaystyle\int}_{\!\! \kern-2pt r_0(R_n,t_{\textit{ring}_n})}^{R_n}{ \phi _{n,{max}}(r)\,h_{n,{max}}(r)\,r\;\text {d}r} \quad &\text{for} \quad n=2,3,4,\ldots , \end{cases}}\nonumber \\ &=M_0 {\begin{cases} \left (1-\theta ^{3/4}\right )^{4/3} \quad &\text{for} \quad n=1,\\ \big (1-\theta ^{3/4}R_n^{9/4}\big )^{4/3}- \big (1-\theta _{\textit{max}}^{3/4}R_n^{9/4}\big )^{4/3} \quad &\text{for} \quad n=2,3,4,\ldots . \end{cases}} \end{align}
The final mass in the
 $n^{\text{}}$
th ring deposit at the end of the evaporation is determined by evaluating
$n^{\text{}}$
th ring deposit at the end of the evaporation is determined by evaluating
 $M_{\textit{ring}_n}$
given by (6.25) at
$M_{\textit{ring}_n}$
given by (6.25) at
 $t=t_n$
to yield
$t=t_n$
to yield
 \begin{align} {M_{\textit{ring}}}_n(t_n)= M_0 {\begin{cases} \left (1-\theta _{\textit{min}}^{3/4}\right )^{4/3}\quad &\text{for} \quad n=1,\\[5pt] \left (1-\theta _{\textit{min}}^{3/4}R_n^{9/4}\right )^{4/3}- \left (1-\theta _{\textit{max}}^{3/4}R_n^{9/4}\right )^{4/3} \quad &\text{for} \quad n=2,3,4,\ldots . \end{cases}} \end{align}
Plot of the evolutions of (a)
 $M_{\textit{drop}}/M_0$
given by (6.24) and (b)
$M_{\textit{drop}}/M_0$
given by (6.24) and (b)
 $M_{\textit{rings}}/M_0$
given by (6.27) as functions of
$M_{\textit{rings}}/M_0$
given by (6.27) as functions of
 $t/t_{\textit{SJ}}$
for a droplet evaporating in the SJ mode for
$t/t_{\textit{SJ}}$
for a droplet evaporating in the SJ mode for
 $\theta _{\textit{min}}=1/2$
and
$\theta _{\textit{min}}=1/2$
and
 $\theta _{\textit{max}}=1$
. The dots correspond to (a)
$\theta _{\textit{max}}=1$
. The dots correspond to (a)
 $M_{\textit{drop}}(t_n)$
and (b)
$M_{\textit{drop}}(t_n)$
and (b)
 $M_{\textit{ring}_n}(t_n)$
, the dotted lines correspond to the solutions for
$M_{\textit{ring}_n}(t_n)$
, the dotted lines correspond to the solutions for
 $M_{\textit{drop}}$
and
$M_{\textit{drop}}$
and
 $M_{\textit{ring}}$
when
$M_{\textit{ring}}$
when
 $\theta _{\textit{min}}=0$
(CR mode), and the (barely distinguishable) dashed lines correspond to the solutions for
$\theta _{\textit{min}}=0$
(CR mode), and the (barely distinguishable) dashed lines correspond to the solutions for
 $M_{\textit{drop}}$
and
$M_{\textit{drop}}$
and
 $M_{\textit{dist}}$
when
$M_{\textit{dist}}$
when
 $\theta _{\textit{min}}=\theta _{\textit{max}}=1$
(CA mode).
$\theta _{\textit{min}}=\theta _{\textit{max}}=1$
(CA mode).

The total mass of particles that have left the droplet to be deposited into the multiple ring deposits during the
 $n{\text{th}}$
CR phase, denoted by
$n{\text{th}}$
CR phase, denoted by
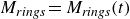 $M_{\textit{rings}}=M_{\textit{rings}}(t)$
, is then
$M_{\textit{rings}}=M_{\textit{rings}}(t)$
, is then
 \begin{equation} M_{\textit{rings}}=M_{\textit{ring}_n}+\sum _{k=1}^{n-1}M_{\textit{ring}_k}(t_k). \end{equation}
The density of the
 $n{\text{th}}$
ring deposit at the end of the evaporation, defined by
$n{\text{th}}$
ring deposit at the end of the evaporation, defined by
 $\phi _{\textit{ring}_n}=M_{\textit{ring}_n}(t_n)/(2\pi R_n)$
, is then
$\phi _{\textit{ring}_n}=M_{\textit{ring}_n}(t_n)/(2\pi R_n)$
, is then
 \begin{align} \phi _{\textit{ring}_n} =\dfrac {1}{8} {\begin{cases} \left (1-\theta _{\textit{min}}^{3/4}\right )^{4/3} \quad &\text{for} \quad n=1,\\[5pt] \left (R_n^{-3/4}-\theta _{\textit{min}}^{3/4}R_n^{3/2}\right )^{4/3}- \left (R_n^{-3/4}-\theta _{\textit{max}}^{3/4}R_n^{3/2}\right )^{4/3} \quad &\text{for} \quad n=2,3,4,\ldots . \end{cases}} \end{align}
Figure 16 shows plots of the evolutions of
 $M_{\textit{drop}}/M_0$
given by (6.24) and
$M_{\textit{drop}}/M_0$
given by (6.24) and
 $M_{\textit{rings}}/M_0$
given by (6.27) as functions of
$M_{\textit{rings}}/M_0$
given by (6.27) as functions of
 $t/t_{\textit{SJ}}$
for a droplet evaporating in the SJ mode for
$t/t_{\textit{SJ}}$
for a droplet evaporating in the SJ mode for
 $\theta _{\textit{min}}=1/2$
and
$\theta _{\textit{min}}=1/2$
and
 $\theta _{\textit{max}}=1$
. In particular, as figure 16 shows, the deposit is a combination of multiple (theoretically infinitely many) ring deposits at radial positions
$\theta _{\textit{max}}=1$
. In particular, as figure 16 shows, the deposit is a combination of multiple (theoretically infinitely many) ring deposits at radial positions
 $r=R_n$
in the SJ mode. Moreover, the behaviour reduces to that for a droplet evaporating in the CR mode, i.e. all of the particles eventually being transferred to a single ring deposit at
$r=R_n$
in the SJ mode. Moreover, the behaviour reduces to that for a droplet evaporating in the CR mode, i.e. all of the particles eventually being transferred to a single ring deposit at
 $r=1$
, and in the CA mode, i.e. all of the particles being transferred to a distributed deposit in the region
$r=1$
, and in the CA mode, i.e. all of the particles being transferred to a distributed deposit in the region
 $0\leqslant r\leqslant 1$
, when
$0\leqslant r\leqslant 1$
, when
 $\theta _{\textit{min}}=0$
and
$\theta _{\textit{min}}=0$
and
 $\theta _{\textit{max}}\to \theta _{\textit{min}}=\theta ^*$
, respectively. Figure 17 shows a plot of
$\theta _{\textit{max}}\to \theta _{\textit{min}}=\theta ^*$
, respectively. Figure 17 shows a plot of
 $M_{\textit{ring}_n}(t_n)/M_0$
given by (6.26) and
$M_{\textit{ring}_n}(t_n)/M_0$
given by (6.26) and
 $\phi _{\textit{ring}_n}$
given by (6.28) as functions of
$\phi _{\textit{ring}_n}$
given by (6.28) as functions of
 $\theta _{\textit{min}}$
for
$\theta _{\textit{min}}$
for
 $\theta _{\textit{max}}=1$
and the first
$\theta _{\textit{max}}=1$
and the first
 $20$
jump phases for a droplet evaporating in the SJ mode. In particular, the final mass within, and density of, the ring deposits decrease monotonically with
$20$
jump phases for a droplet evaporating in the SJ mode. In particular, the final mass within, and density of, the ring deposits decrease monotonically with
 $n$
for sufficiently small
$n$
for sufficiently small
 $\theta _{\textit{min}}$
, but are non-monotonic in
$\theta _{\textit{min}}$
, but are non-monotonic in
 $n$
above a critical value as illustrated in figure 17. Therefore, there is a region of values of
$n$
above a critical value as illustrated in figure 17. Therefore, there is a region of values of
 $\theta _{\textit{min}}$
and
$\theta _{\textit{min}}$
and
 $\theta _{\textit{max}}$
for which
$\theta _{\textit{max}}$
for which
 $M_{\textit{ring}_n}(t_n)$
and
$M_{\textit{ring}_n}(t_n)$
and
 $\phi _{\textit{ring}_n}$
are non-monotonic in
$\phi _{\textit{ring}_n}$
are non-monotonic in
 $n$
, i.e. the outermost ring does not contain the most particles and is therefore not the most dense ring, which we will now discuss.
$n$
, i.e. the outermost ring does not contain the most particles and is therefore not the most dense ring, which we will now discuss.
Plot of (a)
 $M_{\textit{ring}_n}/M_0$
given by (6.26) and (b)
$M_{\textit{ring}_n}/M_0$
given by (6.26) and (b)
 $\phi _{\textit{ring}_n}$
given by (6.28) as functions of
$\phi _{\textit{ring}_n}$
given by (6.28) as functions of
 $\theta _{\textit{min}}$
for
$\theta _{\textit{min}}$
for
 $\theta _{\textit{max}}=1$
and the first
$\theta _{\textit{max}}=1$
and the first
 $20$
jump phases for a droplet evaporating in the SJ mode. The dotted lines correspond to the solutions for the first CR phase, i.e. for
$20$
jump phases for a droplet evaporating in the SJ mode. The dotted lines correspond to the solutions for the first CR phase, i.e. for
 $n=1$
, and the dashed lines correspond to the critical values of (a)
$n=1$
, and the dashed lines correspond to the critical values of (a)
 $\theta _{\textit{min}}\simeq 0.600$
and (b)
$\theta _{\textit{min}}\simeq 0.600$
and (b)
 $\theta _{\textit{min}}\simeq 0.418$
that satisfy
$\theta _{\textit{min}}\simeq 0.418$
that satisfy
 $M_{\textit{ring}_1}(t_1)=M_{\textit{ring}_2}(t_2)$
and
$M_{\textit{ring}_1}(t_1)=M_{\textit{ring}_2}(t_2)$
and
 $\phi _{\textit{ring}_1}=\phi _{\textit{ring}_2}$
, respectively. The arrows indicate the direction of increasing
$\phi _{\textit{ring}_1}=\phi _{\textit{ring}_2}$
, respectively. The arrows indicate the direction of increasing
 $n$
.
$n$
.

The critical values of the minimum and maximum contact angles at which the final masses within the first and second ring deposits are equal, denoted by
 $\theta _{\textit{min}}^{\textit{crit},\textit{mass}}$
and
$\theta _{\textit{min}}^{\textit{crit},\textit{mass}}$
and
 $\theta _{\textit{max}}^{\textit{crit},\textit{mass}}$
, are determined by solving
$\theta _{\textit{max}}^{\textit{crit},\textit{mass}}$
, are determined by solving
 $M_{\textit{ring}_1}(t_1)=M_{\textit{ring}_2}(t_2)$
from (6.26), and are therefore given implicitly by
$M_{\textit{ring}_1}(t_1)=M_{\textit{ring}_2}(t_2)$
from (6.26), and are therefore given implicitly by
 \begin{equation} \theta _{\textit{max}}^{\textit{crit,mass}}=\dfrac {{\theta _{\textit{min}}^{\textit{crit,mass}}}^{2}}{\left [1-2^{3/4}\left (1-{\theta _{\textit{min}}^{\textit{crit,mass}}}^{3/4}\right ) \right ]^{4/3}}. \end{equation}
Similarly, the critical angles at which the densities of the first and second ring deposits are equal, denoted by
 $\theta _{\textit{min}}^{\textit{crit,dens}}$
and
$\theta _{\textit{min}}^{\textit{crit,dens}}$
and
 $\theta _{\textit{max}}^{\textit{crit,dens}}$
, are determined by solving
$\theta _{\textit{max}}^{\textit{crit,dens}}$
, are determined by solving
 $\phi _{\textit{ring}_1}(t_1)=\phi _{\textit{ring}_2}(t_2)$
from (6.28), and are therefore given implicitly by
$\phi _{\textit{ring}_1}(t_1)=\phi _{\textit{ring}_2}(t_2)$
from (6.28), and are therefore given implicitly by
 \begin{equation} \theta _{\textit{max}}^{\textit{crit,dens}}=\dfrac {{\theta _{\textit{min}}^{\textit{crit,dens}}}^{2}}{\left [1-\left \{1+\left (\dfrac {\theta _{\textit{min}}^{\textit{crit,dens}}}{\theta _{\textit{max}}^{\textit{crit,dens}}}\right )^{1/3}\right \}^{3/4}\left (1-{\theta _{\textit{min}}^{\textit{crit,dens}}}^{3/4}\right ) \right ]^{4/3}}. \end{equation}
Hence the region of values for which
 $M_{\textit{ring}_n}(t_n)$
and
$M_{\textit{ring}_n}(t_n)$
and
 $\phi _{\textit{ring}_n}$
are non-monotonic in
$\phi _{\textit{ring}_n}$
are non-monotonic in
 $n$
are
$n$
are
 \begin{equation} 0.600\simeq \left (2^{3/4}-1\right )^{4/3}\leqslant \theta _{\textit{min}}\leqslant 1, \quad \theta _{\textit{max}}^{\textit{crit,mass}}\left (\theta _{\textit{min}}^{\textit{crit,mass}}\right )\leqslant \theta _{\textit{max}}\leqslant 1 \end{equation}
and
 \begin{equation} 0.418\lesssim \theta _{\textit{min}}\leqslant 1, \quad \theta _{\textit{max}}^{\textit{crit,dens}}\left (\theta _{\textit{min}}^{\textit{crit,dens}}\right )\leqslant \theta _{\textit{max}}\leqslant 1, \end{equation}
with
 $\theta _{\textit{max}}^{\textit{crit},\textit{mass}} (\theta _{\textit{min}}^{\textit{crit},\textit{mass}} )$
and
$\theta _{\textit{max}}^{\textit{crit},\textit{mass}} (\theta _{\textit{min}}^{\textit{crit},\textit{mass}} )$
and
 $\theta _{\textit{max}}^{\textit{crit,dens}} (\theta _{\textit{min}}^{\textit{crit,dens}} )$
given implicitly by (6.29) and (6.30), respectively. Figure 18 shows a plot of
$\theta _{\textit{max}}^{\textit{crit,dens}} (\theta _{\textit{min}}^{\textit{crit,dens}} )$
given implicitly by (6.29) and (6.30), respectively. Figure 18 shows a plot of
 $\theta _{\textit{max}}^{\textit{crit},\textit{mass}}$
given by (6.29) and
$\theta _{\textit{max}}^{\textit{crit},\textit{mass}}$
given by (6.29) and
 $\theta _{\textit{max}}^{\textit{crit,dens}}$
given by (6.30) as functions of
$\theta _{\textit{max}}^{\textit{crit,dens}}$
given by (6.30) as functions of
 $\theta _{\textit{min}}^{\textit{crit},\textit{mass}}$
and
$\theta _{\textit{min}}^{\textit{crit},\textit{mass}}$
and
 $\theta _{\textit{min}}^{\textit{crit,dens}}$
. In particular, the two shaded regions indicate the region of values of
$\theta _{\textit{min}}^{\textit{crit,dens}}$
. In particular, the two shaded regions indicate the region of values of
 $\theta _{\textit{min}}$
and
$\theta _{\textit{min}}$
and
 $\theta _{\textit{max}}$
for which the final mass within (the darker shaded region) and the density of (the lighter and darker shaded regions) the ring deposits are non-monotonic in
$\theta _{\textit{max}}$
for which the final mass within (the darker shaded region) and the density of (the lighter and darker shaded regions) the ring deposits are non-monotonic in
 $n$
, given by (6.31) and (6.32). In particular, as figure 18 shows, the region of parameter values for which
$n$
, given by (6.31) and (6.32). In particular, as figure 18 shows, the region of parameter values for which
 $M_{\textit{ring}_n}(t_n)$
is non-monotonic in
$M_{\textit{ring}_n}(t_n)$
is non-monotonic in
 $n$
is much smaller than, and contained within, the region for which
$n$
is much smaller than, and contained within, the region for which
 $\phi _{\textit{ring}_n}$
is non-monotonic in
$\phi _{\textit{ring}_n}$
is non-monotonic in
 $n$
.
$n$
.
Plot of
 $\theta _{\textit{max}}^{\textit{crit},\textit{mass}}$
(solid black line) given by (6.29) and
$\theta _{\textit{max}}^{\textit{crit},\textit{mass}}$
(solid black line) given by (6.29) and
 $\theta _{\textit{max}}^{\textit{crit,dens}}$
(dashed black line) given by (6.30) as functions of
$\theta _{\textit{max}}^{\textit{crit,dens}}$
(dashed black line) given by (6.30) as functions of
 $\theta _{\textit{min}}^{\textit{crit},\textit{mass}}$
and
$\theta _{\textit{min}}^{\textit{crit},\textit{mass}}$
and
 $\theta _{\textit{min}}^{\textit{crit,dens}}$
. The dotted line corresponds to
$\theta _{\textit{min}}^{\textit{crit,dens}}$
. The dotted line corresponds to
 $\theta _{\textit{max}}=1$
. The shaded regions indicate the regions of values in which
$\theta _{\textit{max}}=1$
. The shaded regions indicate the regions of values in which
 $M_{\textit{ring}_n}(t_n)$
and
$M_{\textit{ring}_n}(t_n)$
and
 $\phi _{\textit{ring}_n}$
are non-monotonic in
$\phi _{\textit{ring}_n}$
are non-monotonic in
 $n$
.
$n$
.

6.4. Validation against previous experimental results
The general behaviour that multiple ring deposits are left behind on the substrate after a droplet evaporates in the SJ mode is a common observation in experiments (see, for example, Orejon et al. Reference Orejon, Sefiane and Shanahan2011; Askounis et al. Reference Askounis, Sefiane, Koutsos and Shanahan2014; Yang et al. Reference Yang, Li and Sun2014; Kim et al. Reference Kim, Pack, Rokoni, Kaneelil and Sun2018). However, in practice, due to surface roughness in physical experiments the contact line may not necessarily jump inwards symmetrically and the critical minimum and maximum contact angles may vary throughout the evaporation. These behaviours cannot be captured by the present model and so, in general, comparing theoretical predictions with physical experiments that evaporate in the SJ mode is a difficult task. We will compare the predictions of the present model for the final mass in the ring deposits with the experimental observations by Kim et al. (Reference Kim, Pack, Rokoni, Kaneelil and Sun2018). Specifically, as discussed in § 5.4, this study concerns the deposition of spherical polystyrene particles from water droplets evaporating on glass. When the particles are less hydrophilic the droplet evolves in six distinct SJ phases followed by a CA phase for the remainder of evaporation. The experiments report a deposit profile (their figure 6b) for which the mass within the six rings may be determined, a value for
 $\theta _{\textit{min}}$
, and a plot of the evolution of
$\theta _{\textit{min}}$
, and a plot of the evolution of
 $R$
(their figure 5a) for which we may obtain a best fit for the value of
$R$
(their figure 5a) for which we may obtain a best fit for the value of
 $\theta _{\textit{max}}$
. Note that the droplet in this study therefore actually evaporates in what we may term a ‘stick–jump–slide’ (SJS) mode of evaporation, for which we will denote the lifetime of the droplet as
$\theta _{\textit{max}}$
. Note that the droplet in this study therefore actually evaporates in what we may term a ‘stick–jump–slide’ (SJS) mode of evaporation, for which we will denote the lifetime of the droplet as
 $t_{\textit{SJS}}$
, however, here we consider only the mass within the ring deposits due to the SJ phases.
$t_{\textit{SJS}}$
, however, here we consider only the mass within the ring deposits due to the SJ phases.
Comparison between the theoretical predictions (circles, solid lines) for the evolutions of (a)
 $R$
and (b)
$R$
and (b)
 $M_{\textit{rings}}/M_0$
given by (6.27) for
$M_{\textit{rings}}/M_0$
given by (6.27) for
 $0\leqslant t\leqslant t^*$
as functions of
$0\leqslant t\leqslant t^*$
as functions of
 $t/t_{\textit{SJS}}$
, as well as (c) the locations of, and the final masses of particles within, the
$t/t_{\textit{SJS}}$
, as well as (c) the locations of, and the final masses of particles within, the
 $n{\text{th}}$
ring deposits
$n{\text{th}}$
ring deposits
 $M_{\textit{ring}_n}(t_n)/M_0$
given by (6.26) when
$M_{\textit{ring}_n}(t_n)/M_0$
given by (6.26) when
 $\theta _{\textit{min}}\simeq 0.667$
,
$\theta _{\textit{min}}\simeq 0.667$
,
 $\theta _{\textit{max}}\simeq 0.853$
, and
$\theta _{\textit{max}}\simeq 0.853$
, and
 $n=1$
,
$n=1$
,
 $2$
,
$2$
,
 $\ldots$
,
$\ldots$
,
 $6$
for a droplet evaporating in the SJS mode with the experimental data from Kim et al. (Reference Kim, Pack, Rokoni, Kaneelil and Sun2018) (squares, dashed line).
$6$
for a droplet evaporating in the SJS mode with the experimental data from Kim et al. (Reference Kim, Pack, Rokoni, Kaneelil and Sun2018) (squares, dashed line).

Figure 19 shows a quantitative comparison between the theoretical predictions for the evolutions of
 $R$
and
$R$
and
 $M_{\textit{rings}}/M_0$
given by (6.27) for
$M_{\textit{rings}}/M_0$
given by (6.27) for
 $0\leqslant t\leqslant t^*$
as functions of
$0\leqslant t\leqslant t^*$
as functions of
 $t/t_{\textit{SJS}}$
, as well as the locations of, and the final masses of particles within, the
$t/t_{\textit{SJS}}$
, as well as the locations of, and the final masses of particles within, the
 $n{\text{th}}$
ring deposits
$n{\text{th}}$
ring deposits
 $M_{\textit{ring}_n}/M_0$
given by (6.26) when
$M_{\textit{ring}_n}/M_0$
given by (6.26) when
 $\theta _{\textit{min}}\simeq 0.667$
,
$\theta _{\textit{min}}\simeq 0.667$
,
 $\theta _{\textit{max}}\simeq 0.853$
and
$\theta _{\textit{max}}\simeq 0.853$
and
 $n=1$
,
$n=1$
,
 $2$
,
$2$
,
 $\ldots$
,
$\ldots$
,
 $6$
for a droplet evaporating in the SJS mode with the experimental data from Kim et al. (Reference Kim, Pack, Rokoni, Kaneelil and Sun2018). In particular, as figures 19(b) and 19(c) show, the theoretical predictions of the present model compare well with the results of the experiments for the total mass of particles in the multiple ring deposits, although the present model does not predict that the second most outer ring contains more mass than the first (i.e. the outer) ring, as is observed in experiments. Given that the present model captures parameter regions in which the mass within the ring deposits is non-monotonic in
$6$
for a droplet evaporating in the SJS mode with the experimental data from Kim et al. (Reference Kim, Pack, Rokoni, Kaneelil and Sun2018). In particular, as figures 19(b) and 19(c) show, the theoretical predictions of the present model compare well with the results of the experiments for the total mass of particles in the multiple ring deposits, although the present model does not predict that the second most outer ring contains more mass than the first (i.e. the outer) ring, as is observed in experiments. Given that the present model captures parameter regions in which the mass within the ring deposits is non-monotonic in
 $n$
, as discussed in detail in § 6.3, this disagreement could be due to variation in the critical contact angles throughout the evaporation in the experiments.
$n$
, as discussed in detail in § 6.3, this disagreement could be due to variation in the critical contact angles throughout the evaporation in the experiments.
7. Conclusions
In the present work we have studied the effect of contact-line motion on the deposition of particles from an evaporating sessile droplet. Specifically, in § 2 we formulated a mathematical model for the evolution of, the flow within, and the deposition of particles from, a thin sessile droplet undergoing diffusion-limited evaporation. In § 3 we gave a brief summary of the known theoretical results for a droplet evaporating in the CR mode. In § 4 we gave new theoretical results for the deposition of particles from a droplet evaporating in the CA mode, and validated the present theoretical approach by comparing them with experimental results in the literature. Then in §§ 5 and 6 we extended the analysis to two mixed modes of evaporation, namely the SS and the SJ mode, respectively, and validated our predictions with experimental data available in the literature. Specifically, we obtained expressions for the flow and the concentration of particles within the droplet, as well as the evolutions of the mass of particles in the bulk of the droplet, and on the substrate in a distributed deposit and/or in one or more ring deposit(s) for a droplet evaporating in the four different modes of evaporation.
For a droplet evaporating in the CR mode, the flow is outwards towards the pinned contact line throughout the evaporation and the predicted deposit is therefore a single ring deposit at
 $r=1$
. For a droplet evaporating in the CA mode, the flow is also outwards towards the receding contact line throughout the evaporation, however, the presence of the receding contact line results in a qualitatively different deposit type from that in the CR mode. In particular, for the CA mode, particles are continually deposited on the substrate in the region swept by the moving contact line throughout the evaporation, resulting in the formation of a near-uniform deposit in the region
$r=1$
. For a droplet evaporating in the CA mode, the flow is also outwards towards the receding contact line throughout the evaporation, however, the presence of the receding contact line results in a qualitatively different deposit type from that in the CR mode. In particular, for the CA mode, particles are continually deposited on the substrate in the region swept by the moving contact line throughout the evaporation, resulting in the formation of a near-uniform deposit in the region
 $0\leqslant r\leqslant 1$
. This prediction for the deposit is qualitatively different from previous results obtained for a droplet undergoing spatially uniform evaporation in the CA mode, in which the flow is inwards towards the centre of the droplet resulting in the formation of a peak deposit, as described in § 4.4.1. This illustrates that the deposition of particles from an evaporating droplet depends strongly on both the local evaporative flux and the contact-line motion. Therefore, whilst spatially uniform evaporation has been shown to be a good approximation for the flow within and deposition from an evaporating droplet when the contact line is pinned (see, for example, Boulogne et al. Reference Boulogne, Ingremeau and Stone2017; D’Ambrosio et al. Reference D’Ambrosio, Wilson, Wray and Duffy2023; Mills Reference Mills2023), we have illustrated in the present work that this model is not appropriate when the contact line is receding. Moreover, the predictions of the present model for the density of the distributed deposit,
$0\leqslant r\leqslant 1$
. This prediction for the deposit is qualitatively different from previous results obtained for a droplet undergoing spatially uniform evaporation in the CA mode, in which the flow is inwards towards the centre of the droplet resulting in the formation of a peak deposit, as described in § 4.4.1. This illustrates that the deposition of particles from an evaporating droplet depends strongly on both the local evaporative flux and the contact-line motion. Therefore, whilst spatially uniform evaporation has been shown to be a good approximation for the flow within and deposition from an evaporating droplet when the contact line is pinned (see, for example, Boulogne et al. Reference Boulogne, Ingremeau and Stone2017; D’Ambrosio et al. Reference D’Ambrosio, Wilson, Wray and Duffy2023; Mills Reference Mills2023), we have illustrated in the present work that this model is not appropriate when the contact line is receding. Moreover, the predictions of the present model for the density of the distributed deposit,
 $\phi _{\textit{dist}}$
, given by (4.19) in the CA mode, were found to agree well with previous experimental results by Kajiya et al. (Reference Kajiya, Monteux, Narita, Lequeux and Doi2009), Kim et al. (Reference Kim, Rokoni, Kaneelil, Cui, Han and Sun2019) and Matavž et al. (Reference Matavž, Uršič, Močivnik, Richter, Humar, Čopar, Malič and Bobnar2022), as detailed in § 4.4.2, validating the present theoretical approach.
$\phi _{\textit{dist}}$
, given by (4.19) in the CA mode, were found to agree well with previous experimental results by Kajiya et al. (Reference Kajiya, Monteux, Narita, Lequeux and Doi2009), Kim et al. (Reference Kim, Rokoni, Kaneelil, Cui, Han and Sun2019) and Matavž et al. (Reference Matavž, Uršič, Močivnik, Richter, Humar, Čopar, Malič and Bobnar2022), as detailed in § 4.4.2, validating the present theoretical approach.
For a droplet evaporating in the SS mode the predicted deposit is a combination of a single ring deposit at
 $r=1$
and a near-uniform deposit in the region
$r=1$
and a near-uniform deposit in the region
 $0\leqslant r\leqslant 1$
, and the final masses in each are monotonically decreasing and increasing functions of the critical receding contact angle
$0\leqslant r\leqslant 1$
, and the final masses in each are monotonically decreasing and increasing functions of the critical receding contact angle
 $\theta ^*$
, respectively. We compared the theoretical predictions for the final mass split between the ring deposit,
$\theta ^*$
, respectively. We compared the theoretical predictions for the final mass split between the ring deposit,
 $M_{\textit{ring}}(t_{\textit{SS}}$
), and the distributed deposit,
$M_{\textit{ring}}(t_{\textit{SS}}$
), and the distributed deposit,
 $M_{\textit{dist}}(t_{\textit{SS}})$
, given in (5.19), for a droplet evaporating in the SS mode with previous experimental results by Yunker et al. (Reference Yunker, Still, Lohr and Yodh2011), Li et al. (Reference Li, Lv, Li, Quéré and Zheng2015) and Kim et al. (Reference Kim, Pack, Rokoni, Kaneelil and Sun2018), finding very good agreement for a range of de-pinning angles, as detailed in § 5.4.
$M_{\textit{dist}}(t_{\textit{SS}})$
, given in (5.19), for a droplet evaporating in the SS mode with previous experimental results by Yunker et al. (Reference Yunker, Still, Lohr and Yodh2011), Li et al. (Reference Li, Lv, Li, Quéré and Zheng2015) and Kim et al. (Reference Kim, Pack, Rokoni, Kaneelil and Sun2018), finding very good agreement for a range of de-pinning angles, as detailed in § 5.4.
For a droplet evaporating in the SJ mode the predicted deposit is a combination of multiple (theoretically infinitely many) concentric-ring deposits at radial positions
 $r=R_n$
. The final mass within the ring deposits,
$r=R_n$
. The final mass within the ring deposits,
 $M_{\textit{ring}_n}(t_n)$
, and the density of the rings,
$M_{\textit{ring}_n}(t_n)$
, and the density of the rings,
 $\phi _{\textit{ring}_n}$
, given by (6.26) and (6.28), respectively, decrease monotonically with each jump phase
$\phi _{\textit{ring}_n}$
, given by (6.26) and (6.28), respectively, decrease monotonically with each jump phase
 $n$
for sufficiently small values of
$n$
for sufficiently small values of
 $\theta _{\textit{min}}$
, however, there exists a region of minimum and maximum contact angles for which
$\theta _{\textit{min}}$
, however, there exists a region of minimum and maximum contact angles for which
 $M_{\textit{ring}_n}(t_n)$
and
$M_{\textit{ring}_n}(t_n)$
and
 $\phi _{\textit{ring}_n}(t_n)$
are non-monotonic in
$\phi _{\textit{ring}_n}(t_n)$
are non-monotonic in
 $n$
, given by (6.31) and (6.32), respectively. We compared the theoretical predictions for the evolution of the total mass of particles in the multiple ring deposits
$n$
, given by (6.31) and (6.32), respectively. We compared the theoretical predictions for the evolution of the total mass of particles in the multiple ring deposits
 $M_{\textit{rings}}(t)$
, given by (6.27), and the location of, and the final mass of particles within, the
$M_{\textit{rings}}(t)$
, given by (6.27), and the location of, and the final mass of particles within, the
 $n^{\text{}}$
th ring deposit,
$n^{\text{}}$
th ring deposit,
 $M_{\textit{ring}_n}(t_n)$
, given by (6.26), for a droplet evaporating in the SJ mode with data from the experimental study by Kim et al. (Reference Kim, Pack, Rokoni, Kaneelil and Sun2018), finding good agreement, as detailed in § 6.4.
$M_{\textit{ring}_n}(t_n)$
, given by (6.26), for a droplet evaporating in the SJ mode with data from the experimental study by Kim et al. (Reference Kim, Pack, Rokoni, Kaneelil and Sun2018), finding good agreement, as detailed in § 6.4.
It should be emphasised that the mathematical model for the deposition of particles in the present work is based on various assumptions which make it particularly amenable to theoretical analysis and that, whilst this model has been shown to agree well with experimental results in the present work, as well as in previous studies (see, for example, Deegan et al. Reference Deegan, Bakajin, Dupont, Huber, Nagel and Witten2000; Boulogne et al. Reference Boulogne, Ingremeau and Stone2017; Wray et al. Reference Wray, Wray, Duffy and Wilson2021), future work should focus on relaxing some of these assumptions. In particular, the present model assumes idealised contact-line motion in which the contact-line dynamics is decoupled from the particle-transport problem. However, it has been shown that the presence of particles near the contact line can promote pinning (see, for example, Orejon et al. Reference Orejon, Sefiane and Shanahan2011; Yang et al. Reference Yang, Li and Sun2014), and so future work could focus on coupling these problems. In addition, overcoming the unphysical mass loss at the contact line is of key interest and has been tackled for droplets evaporating in the CR mode by, for example, accounting for finite particle size effects (Popov Reference Popov2005; Kaplan & Mahadevan Reference Kaplan and Mahadevan2015; Coombs, Sprittles & Chubynsky Reference Coombs, Sprittles and Chubynsky2024) or through the consideration of a diffusive boundary layer close to the contact line (Moore et al. Reference Moore, Vella and Oliver2021), however, this remains an open problem for a droplet evaporating with a moving contact line. Whilst the assumption that the droplet is thin, and hence our assumption regarding the reduced particle Péclet number,
 $\hat {\theta }_0^2{\textit{Pe}}$
, given in (2.26), becomes more reasonable as a droplet evaporates in a CR phase, i.e. as the droplet becomes thinner, this is not typically true for a droplet evaporating in a CA phase. Therefore, releasing this assumption on
$\hat {\theta }_0^2{\textit{Pe}}$
, given in (2.26), becomes more reasonable as a droplet evaporates in a CR phase, i.e. as the droplet becomes thinner, this is not typically true for a droplet evaporating in a CA phase. Therefore, releasing this assumption on
 $ \textit{Pe}$
and/or considering the deposition of particles from a non-thin droplet would be relevant extensions to the present mathematical model. Moreover, whilst the assumption that the mass of particles is conserved during the theoretically instantaneous jump phase is a natural first step in modelling deposition in the SJ mode of evaporation, it is possible that particles are being deposited during the jump. It is also plausible that the particles will mix while the jump takes place, and so a detailed study of the flow within the droplet during the jump phase would be of interest for improving our understanding of the deposition in this mode of evaporation. Furthermore, in practice droplets rarely occur in isolation, and so extending the present work and the studies by Wray et al. (Reference Wray, Duffy and Wilson2020, Reference Wray, Wray, Duffy and Wilson2021) to investigate the effect of contact-line motion on the deposition of particles from multiple evaporating droplets is of particular interest.
$ \textit{Pe}$
and/or considering the deposition of particles from a non-thin droplet would be relevant extensions to the present mathematical model. Moreover, whilst the assumption that the mass of particles is conserved during the theoretically instantaneous jump phase is a natural first step in modelling deposition in the SJ mode of evaporation, it is possible that particles are being deposited during the jump. It is also plausible that the particles will mix while the jump takes place, and so a detailed study of the flow within the droplet during the jump phase would be of interest for improving our understanding of the deposition in this mode of evaporation. Furthermore, in practice droplets rarely occur in isolation, and so extending the present work and the studies by Wray et al. (Reference Wray, Duffy and Wilson2020, Reference Wray, Wray, Duffy and Wilson2021) to investigate the effect of contact-line motion on the deposition of particles from multiple evaporating droplets is of particular interest.
Funding
H.-M.D’A. gratefully acknowledges financial support from the United Kingdom Engineering and Physical Sciences Research Council (EPSRC) via EPSRC Additional Funding for Mathematical Sciences Grant EP/W522521/1 via the University of Strathclyde that supported the initial phase of this work.
Declaration of interests
The authors report no conflict of interest.
Appendix A. Derivation of the concentration of particles in the SJ mode
The purpose of this appendix is to use proof by induction to show that the concentration of particles within the droplet during the SJ mode satisfies (6.23). Note that for this appendix it is useful to rewrite (6.14) in the two following ways:
 \begin{equation} \left (1-\dfrac {r_0^2}{R_n^2}\right )^{3/2}=\left (\dfrac {\theta }{\theta _{\textit{max}}}\right )^{3/4} \left [\left (\dfrac {\theta }{\theta _{\textit{max}}}\right )^{-3/4}-1+\left (1-\dfrac {r^2}{R_n^2}\right )^{3/2}\right ] \end{equation}
and
 \begin{equation} \left (\dfrac {\theta }{\theta _{\textit{max}}}\right )^{3/4}-1+\left (1-\dfrac {r_0^2}{R_n^2}\right )^{3/2}= \left (\dfrac {\theta }{\theta _{\textit{max}}}\right )^{3/4}\left (1-\dfrac {r^2}{R_n^2}\right )^{3/2}. \end{equation}
From (6.22) the concentration of particles within the droplet during the SJ mode is given parametrically by
 \begin{equation} \phi =\phi _{n-1,\textit{end}}\left (\dfrac {R_{n-1}}{R_n}r_0\right ) \left [\dfrac {\left (1-\dfrac {r_0^2}{R_n^2}\right )^{3/2}} {\left (\dfrac {\theta }{\theta _{\textit{max}}}\right )^{3/4}-1+\left (1-\dfrac {r_0^2}{R_n^2}\right )^{3/2}}\right ]^{1/3}, \end{equation}
where, as in § 6.3,
 $\phi _{n-1,\textit{end}}(r)=\phi (r,t_{n-1})$
denotes the concentration of particles within the droplet at the end of the
$\phi _{n-1,\textit{end}}(r)=\phi (r,t_{n-1})$
denotes the concentration of particles within the droplet at the end of the
 ${(n-1)}{\text{th}}$
CR phase, i.e. immediately before the
${(n-1)}{\text{th}}$
CR phase, i.e. immediately before the
 ${(n-1)}{\text{th}}$
jump. To prove that (6.23) is true for all
${(n-1)}{\text{th}}$
jump. To prove that (6.23) is true for all
 $n$
we must first check the case when
$n$
we must first check the case when
 $n=2$
. The solution for
$n=2$
. The solution for
 $\phi$
during the first CR phase, i.e. for
$\phi$
during the first CR phase, i.e. for
 $n=1$
and
$n=1$
and
 $0\leqslant t\leqslant t_1$
, is given explicitly by (3.10) and so for
$0\leqslant t\leqslant t_1$
, is given explicitly by (3.10) and so for
 $n=2$
(A3) yields
$n=2$
(A3) yields
 \begin{align} \phi &=\phi _{1,\textit{end}}\left (\dfrac {r_0}{R_2}\right ) \left [\dfrac {\left (1-\dfrac {r_0^2}{R_2^2}\right )^{3/2}} {\left (\dfrac {\theta }{\theta _{\textit{max}}}\right )^{3/4}-1+\left (1-\dfrac {r_0^2}{R_2^2}\right )^{3/2}}\right ]^{1/3}\nonumber\\&\quad\times \left [\dfrac {\theta _{\textit{min}}^{-3/4}-1+\left (1-\dfrac {r_0^2}{R_2^2}\right )^{3/2}} {\left (\dfrac {\theta }{\theta _{\textit{max}}}\right )^{3/4}-1+\left (1-\dfrac {r_0^2}{R_2^2}\right )^{3/2}}\right ]^{1/3}. \end{align}
Then, eliminating
 $r_0$
using the expressions given in (A1) and (A2), the solution for
$r_0$
using the expressions given in (A1) and (A2), the solution for
 $\phi$
during the second CR phase, i.e. for
$\phi$
during the second CR phase, i.e. for
 $n=2$
and
$n=2$
and
 $t_1\leqslant t\leqslant t_2$
, is given explicitly by
$t_1\leqslant t\leqslant t_2$
, is given explicitly by
 \begin{align} \phi &=\left [1+\left (1-\dfrac {r^2}{R_2^2}\right )^{-3/2}\left \{\theta ^{-3/4}\left (\dfrac {\theta _{\textit{min}}}{\theta _{\textit{max}}}\right )^{-3/4}-1\right \} \right ]^{1/3}\nonumber\\&=\left [1+\left (1-\dfrac {r^2}{R_2^2}\right )^{-3/2}\left (\theta ^{-3/4}R_2^{-9/4}-1\right )\right ]^{1/3}, \end{align}
and therefore (6.23) is true for
 $n=2$
. If we assume (6.23) is true for
$n=2$
. If we assume (6.23) is true for
 $n=k$
then, from (A3),
$n=k$
then, from (A3),
 $\phi$
is given parametrically as follows for
$\phi$
is given parametrically as follows for
 $n=k+1$
:
$n=k+1$
:
 \begin{align} \phi &=\phi _{k,\textit{end}}\left (\dfrac {R_{k}}{R_{k+1}}r_0\right ) \left [\dfrac {\left (1-\dfrac {r_0^2}{R_{k+1}^2}\right )^{3/2}} {\left (\dfrac {\theta }{\theta _{\textit{max}}}\right )^{3/4}-1+\left (1-\dfrac {r_0^2}{R_{k+1}^2}\right )^{3/2}}\right ]^{1/3}\nonumber \\ &=\left [\dfrac {\theta _{\textit{min}}^{-3/4}R_k^{-9/4}-1+\left (1-\dfrac {r_0^2}{R_{k+1}^2}\right )^{3/2}} {\left (\dfrac {\theta }{\theta _{\textit{max}}}\right )^{3/4}-1+\left (1-\dfrac {r_0^2}{R_{k+1}^2}\right )^{3/2}}\right ]^{1/3}. \end{align}
Eliminating
 $r_0$
using the expressions given in (A1) and (A2), the solution for
$r_0$
using the expressions given in (A1) and (A2), the solution for
 $\phi$
during the
$\phi$
during the
 $ (k+1 )^{\text{th}}$
CR phase, i.e. for
$ (k+1 )^{\text{th}}$
CR phase, i.e. for
 $n=k+1$
and
$n=k+1$
and
 $t_k\leqslant t\leqslant t_{k+1}$
, is given explicitly by
$t_k\leqslant t\leqslant t_{k+1}$
, is given explicitly by
 \begin{align} \phi &=\left [1+\left (1-\dfrac {r^2}{R_{k+1}^2}\right )^{-3/2}\left \{\theta ^{-3/4}\left (\dfrac {\theta _{\textit{min}}}{\theta _{\textit{max}}}\right )^{-3/4}R_k^{-9/4} -1\right \}\right ]^{1/3}\nonumber \\ &=\left [1+\left (1-\dfrac {r^2}{R_{k+1}^2}\right )^{-3/2}\left (\theta ^{-3/4}R_{k+1}^{-9/4}-1\right )\right ]^{1/3}. \end{align}
Therefore, if (6.23) is true for
 $n=k$
, then it is true for
$n=k$
, then it is true for
 $n=k+1$
. Hence, by the principle of mathematical induction, (6.23) is true for all
$n=k+1$
. Hence, by the principle of mathematical induction, (6.23) is true for all
 $n=2,3,4,\ldots$
.
$n=2,3,4,\ldots$
.
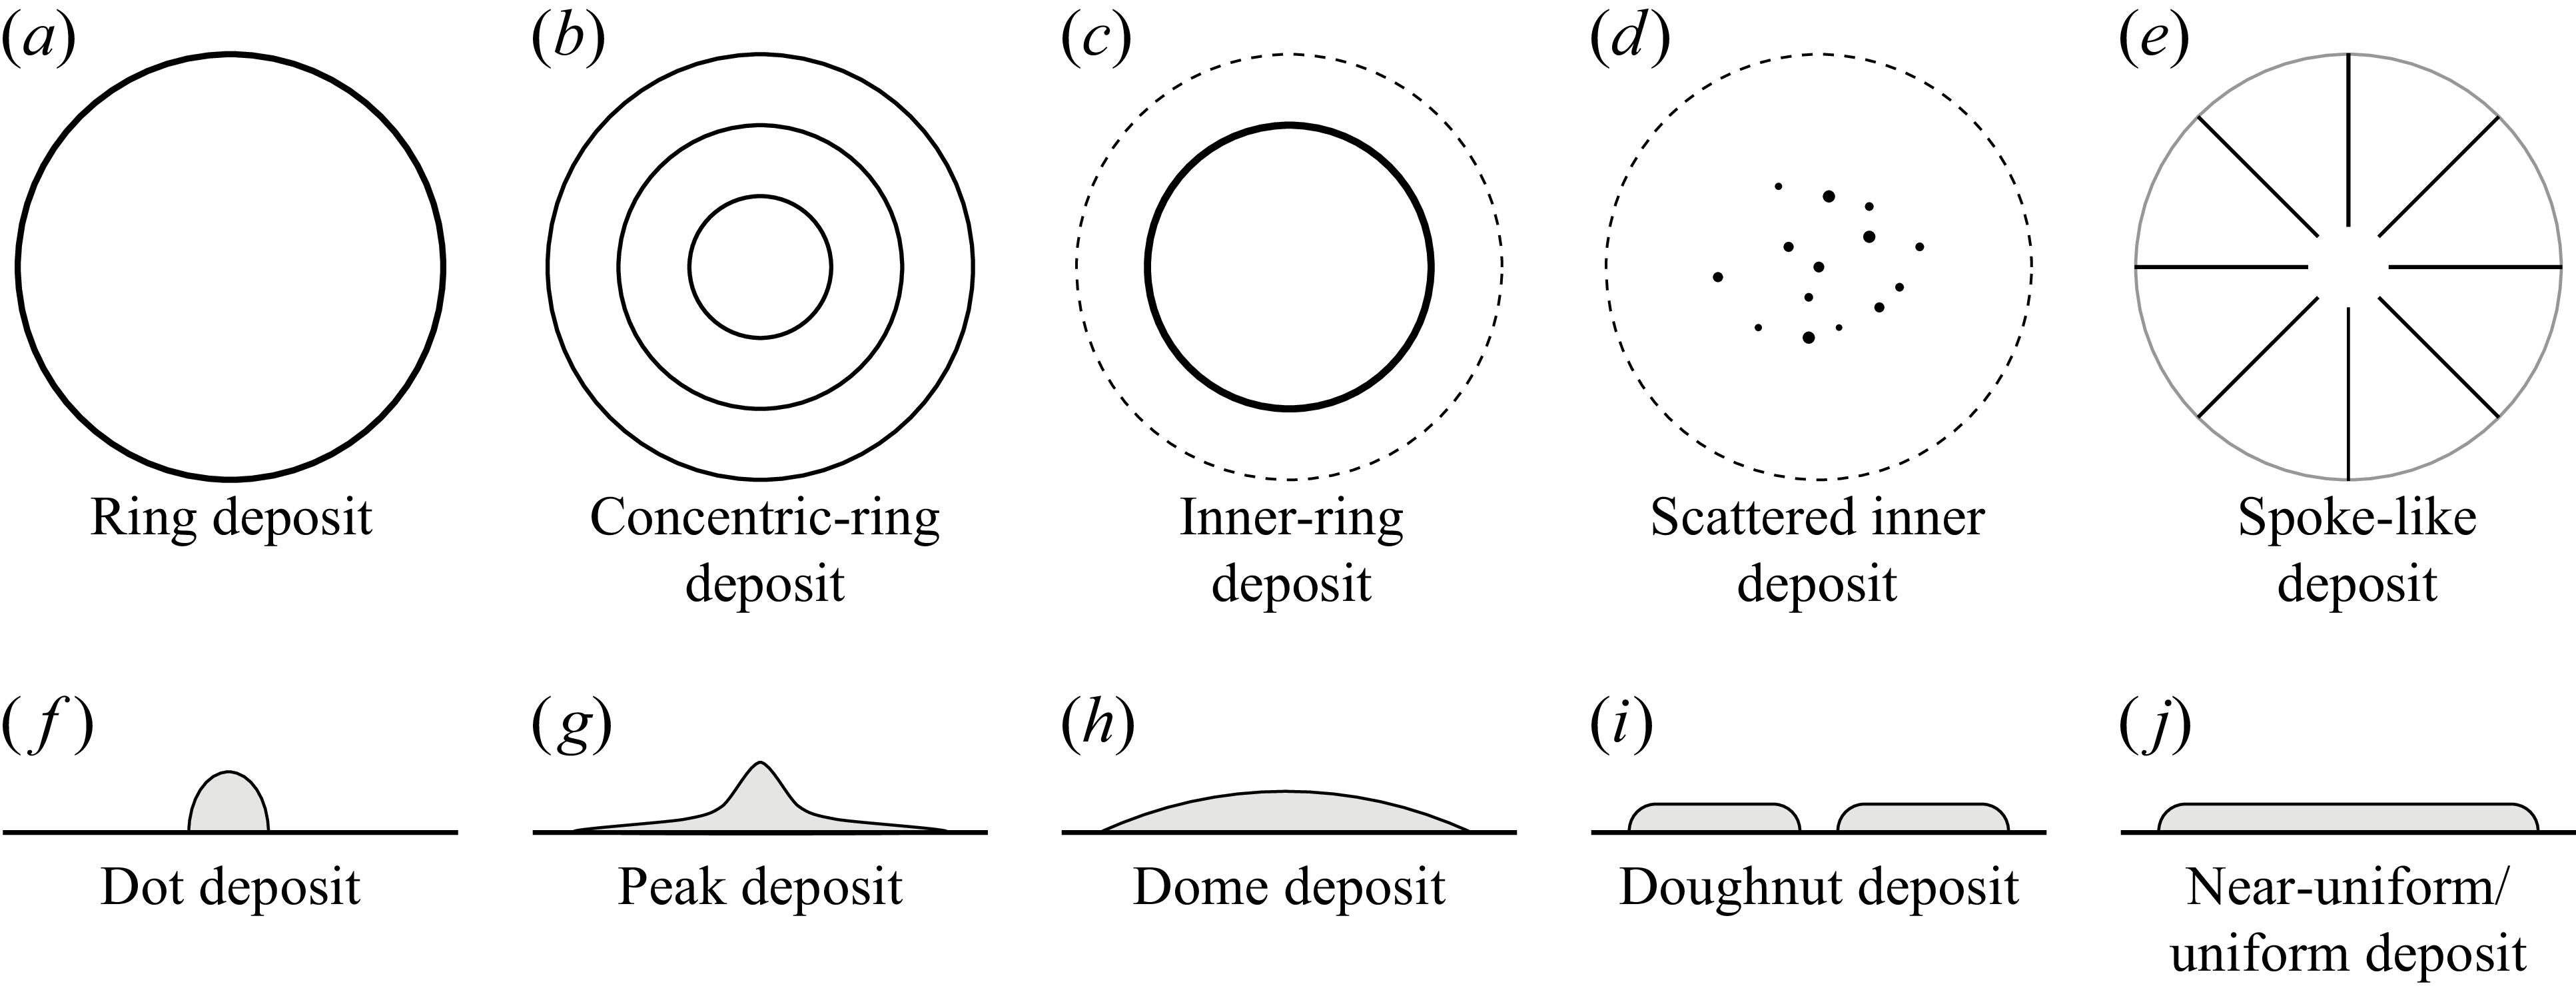


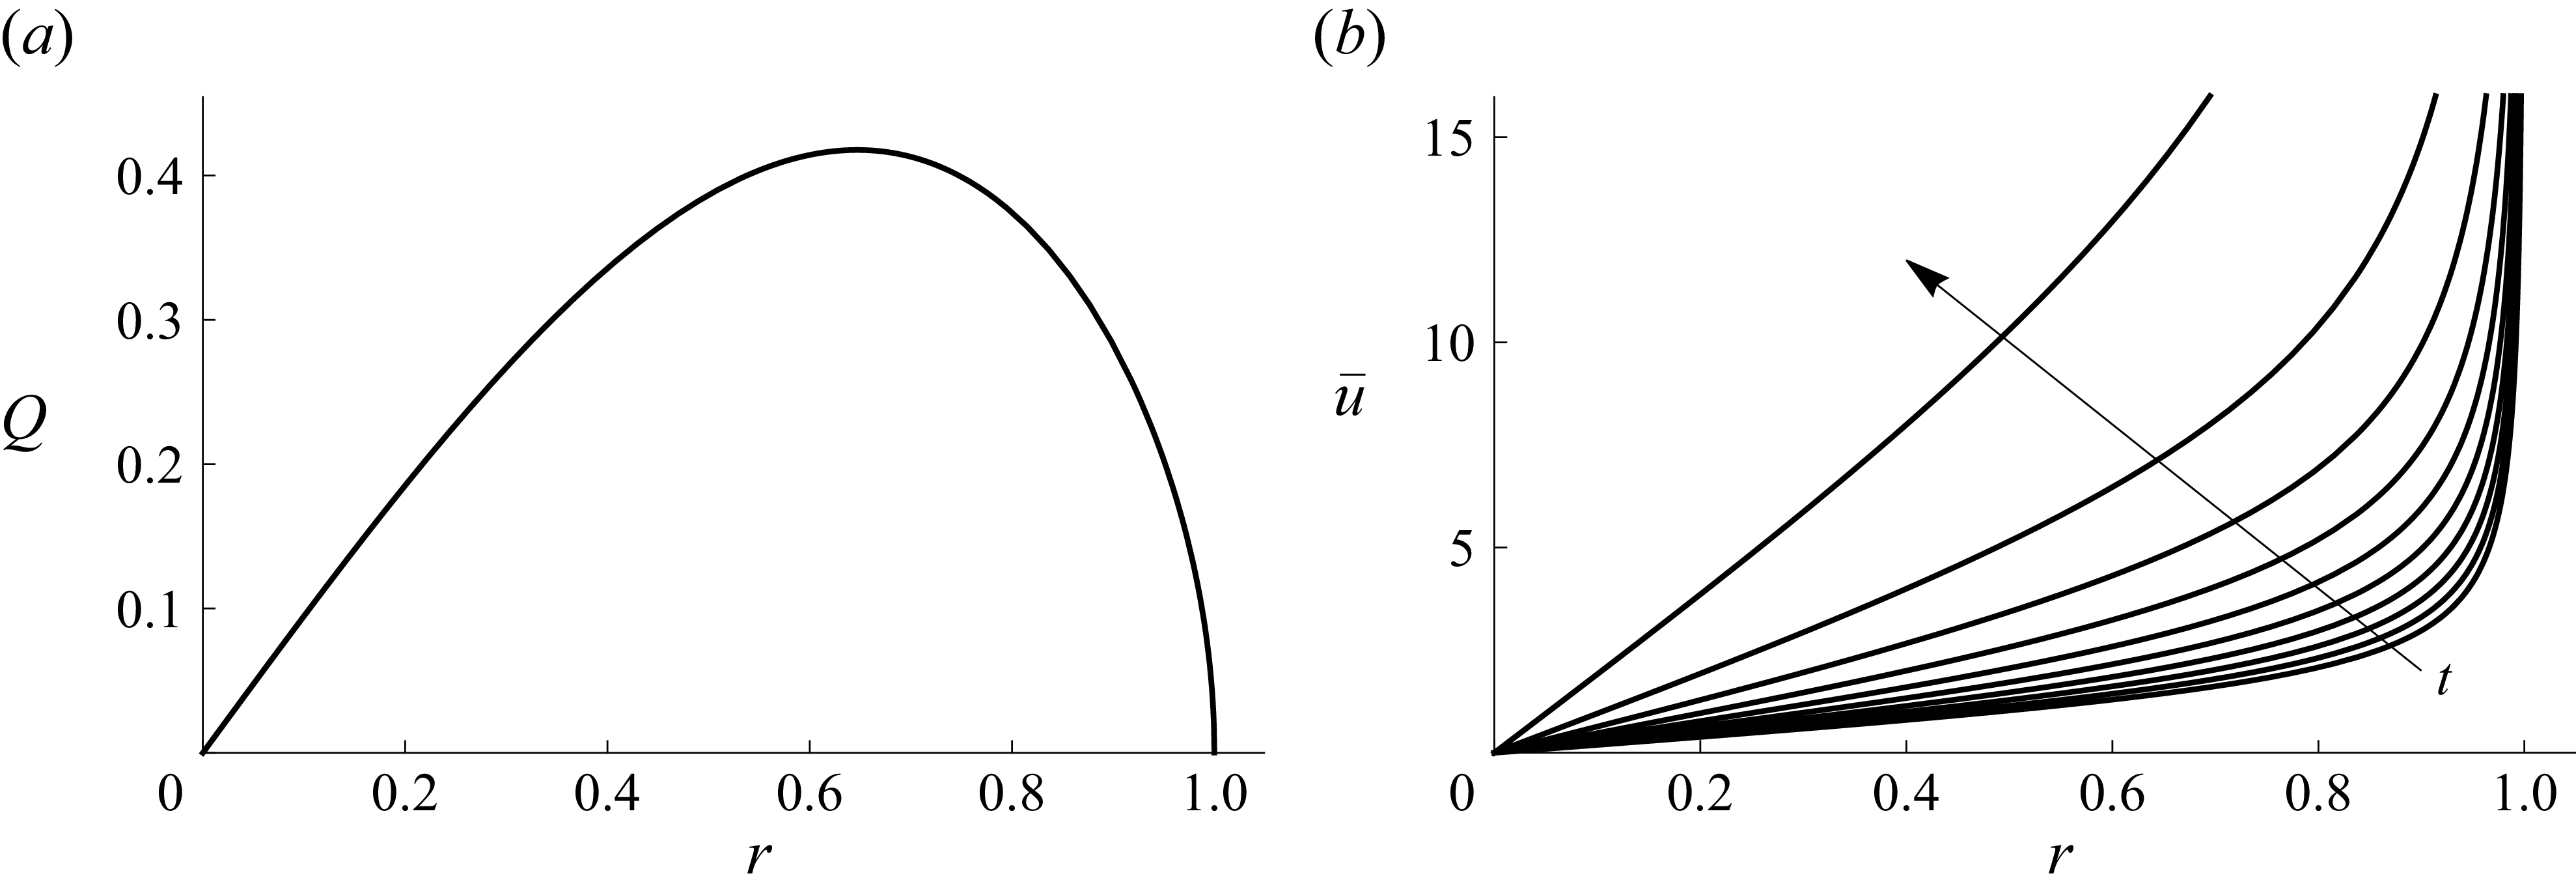


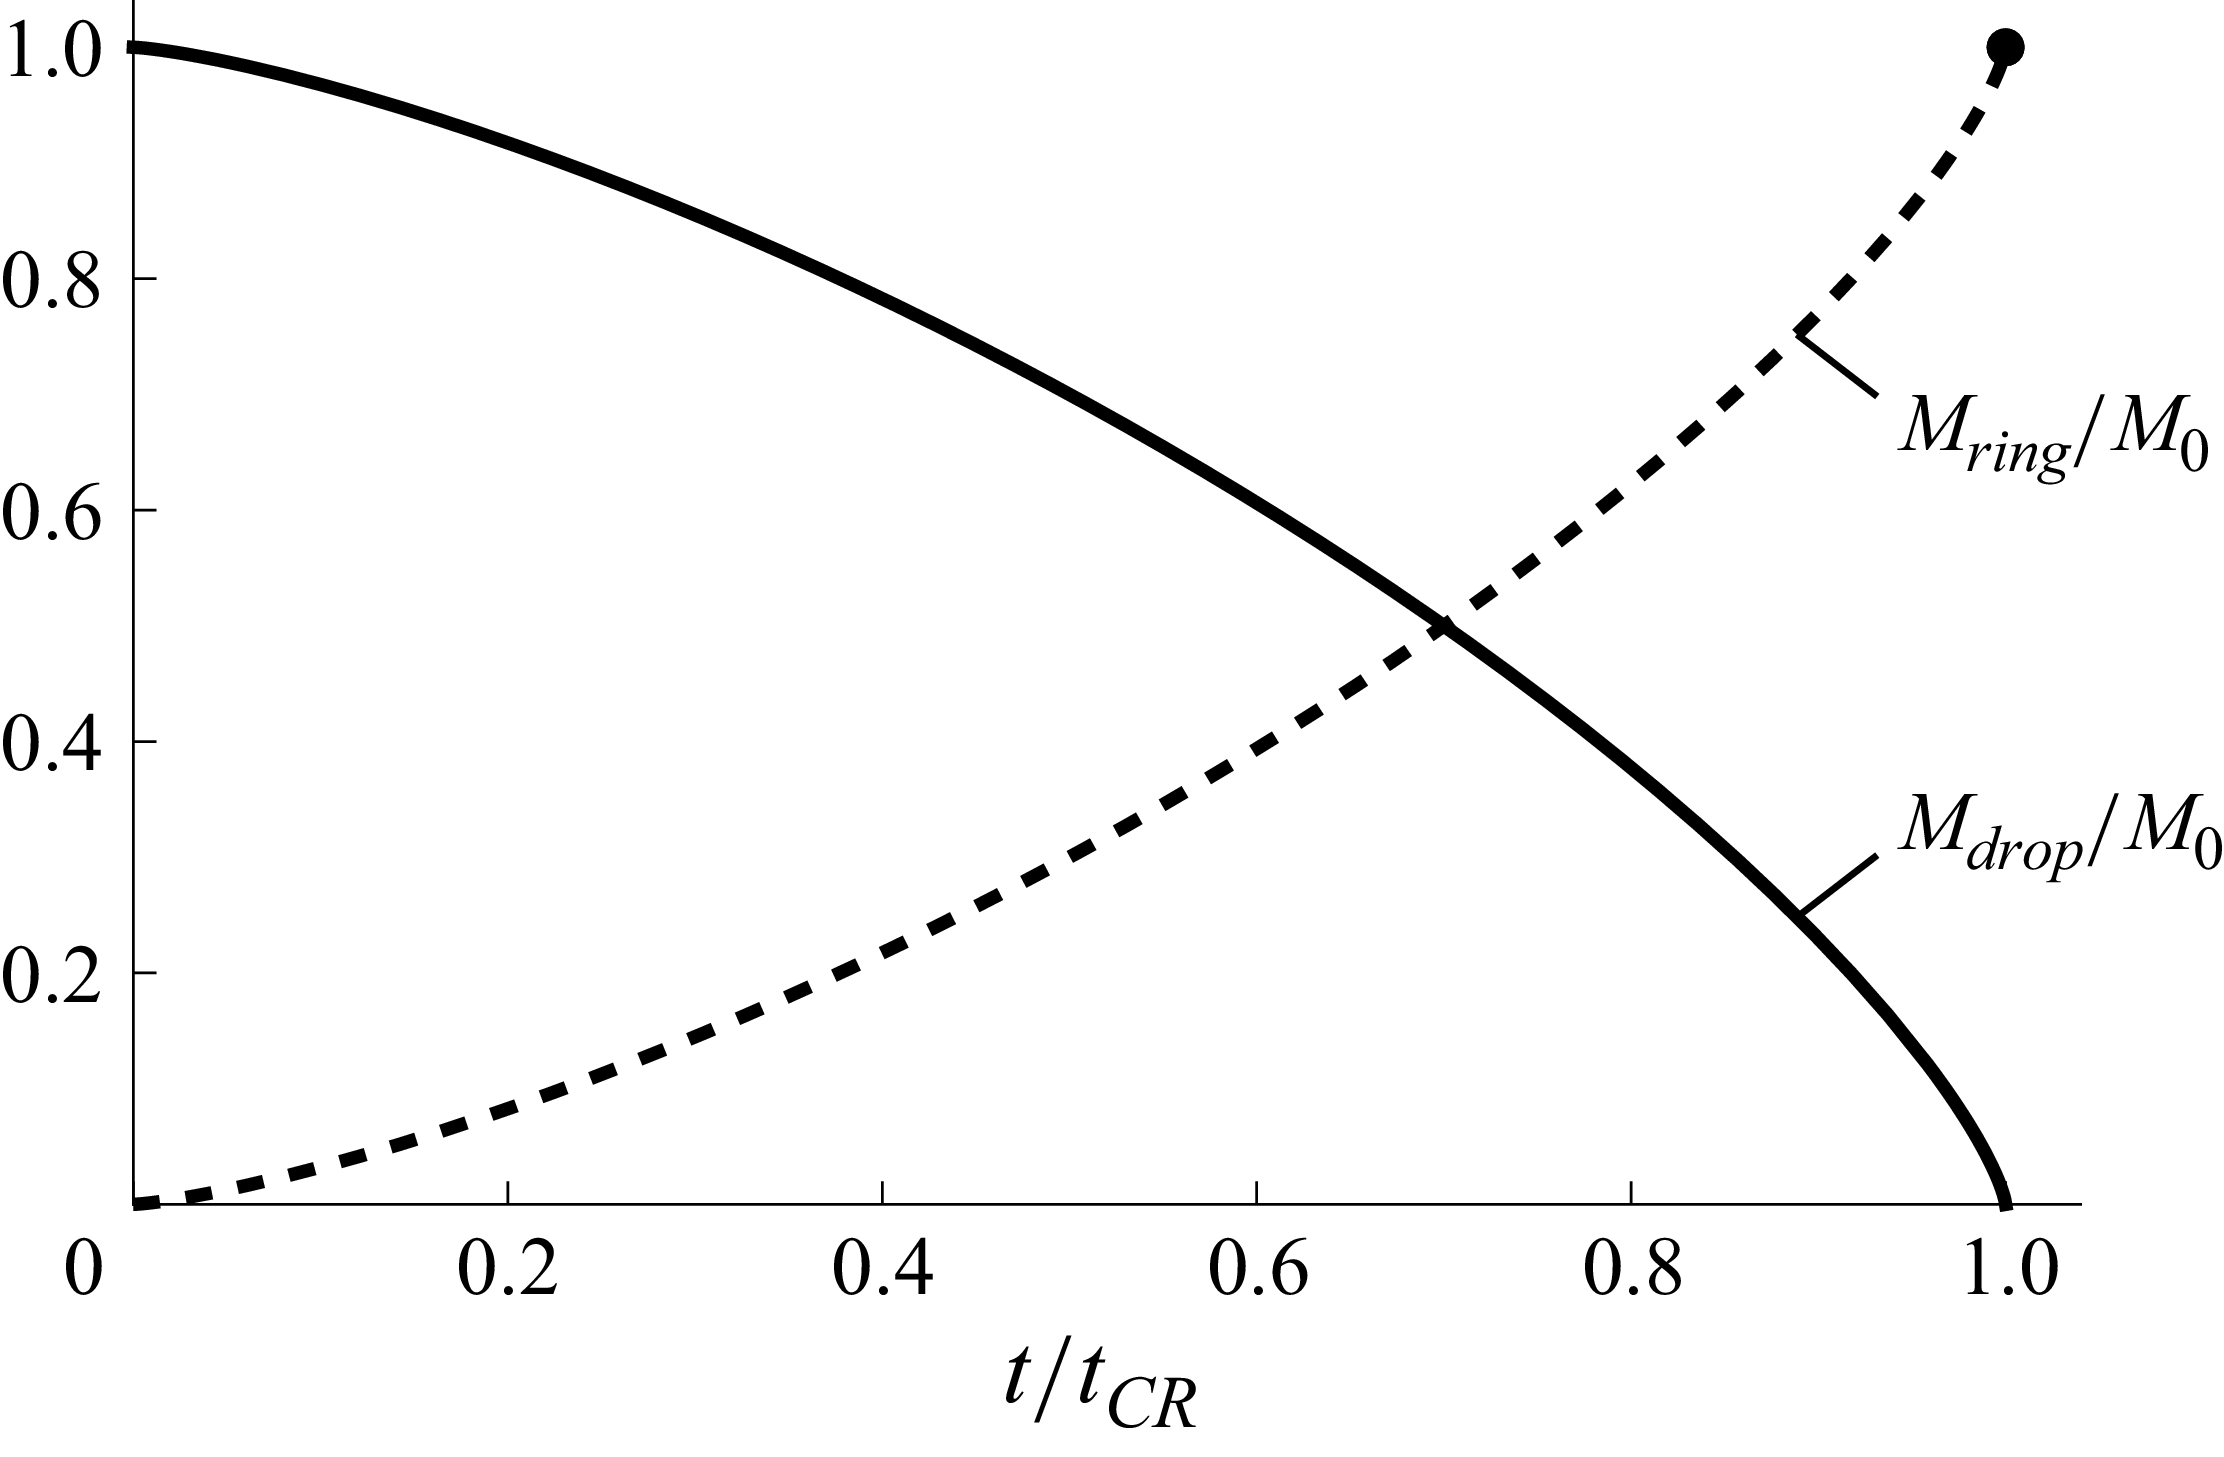


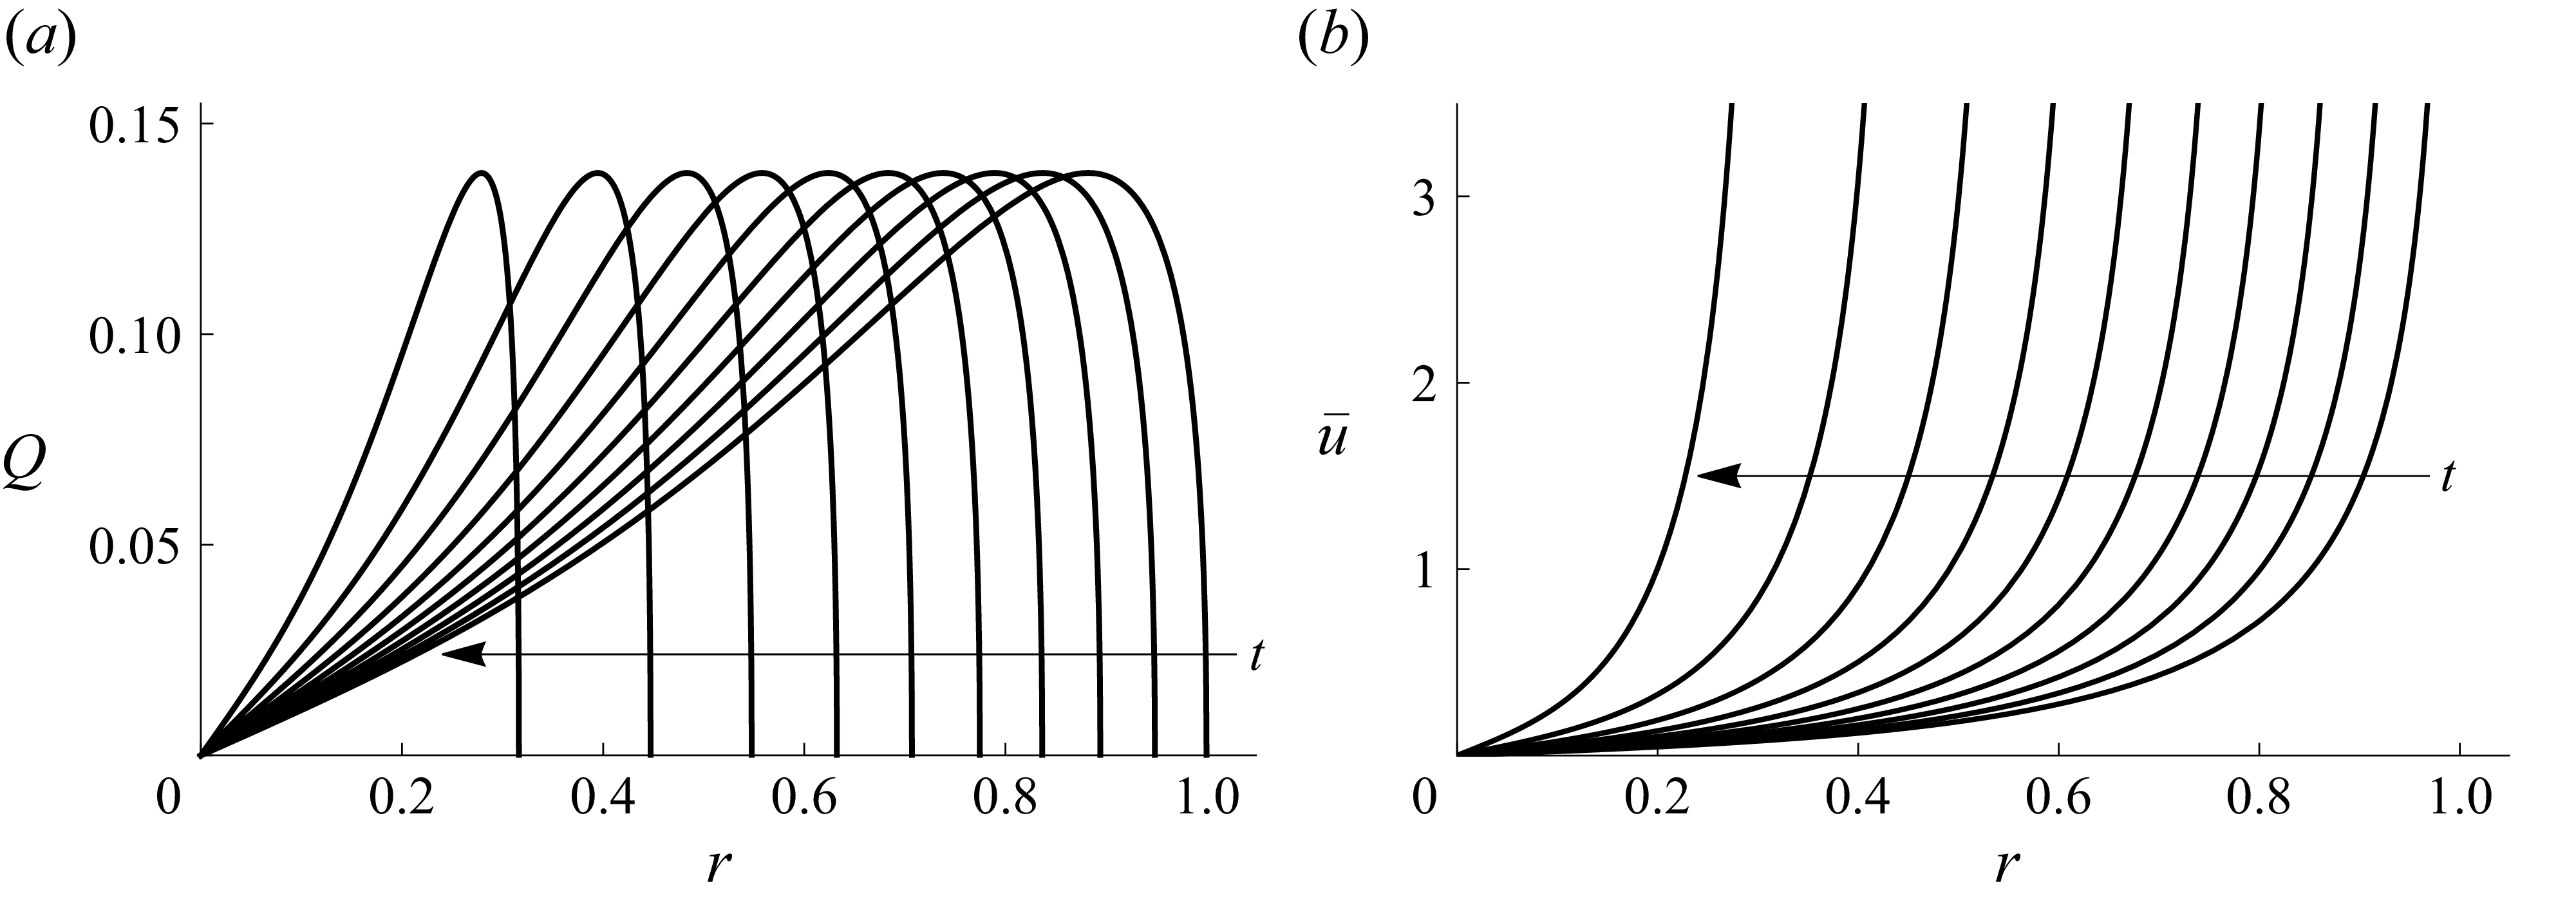


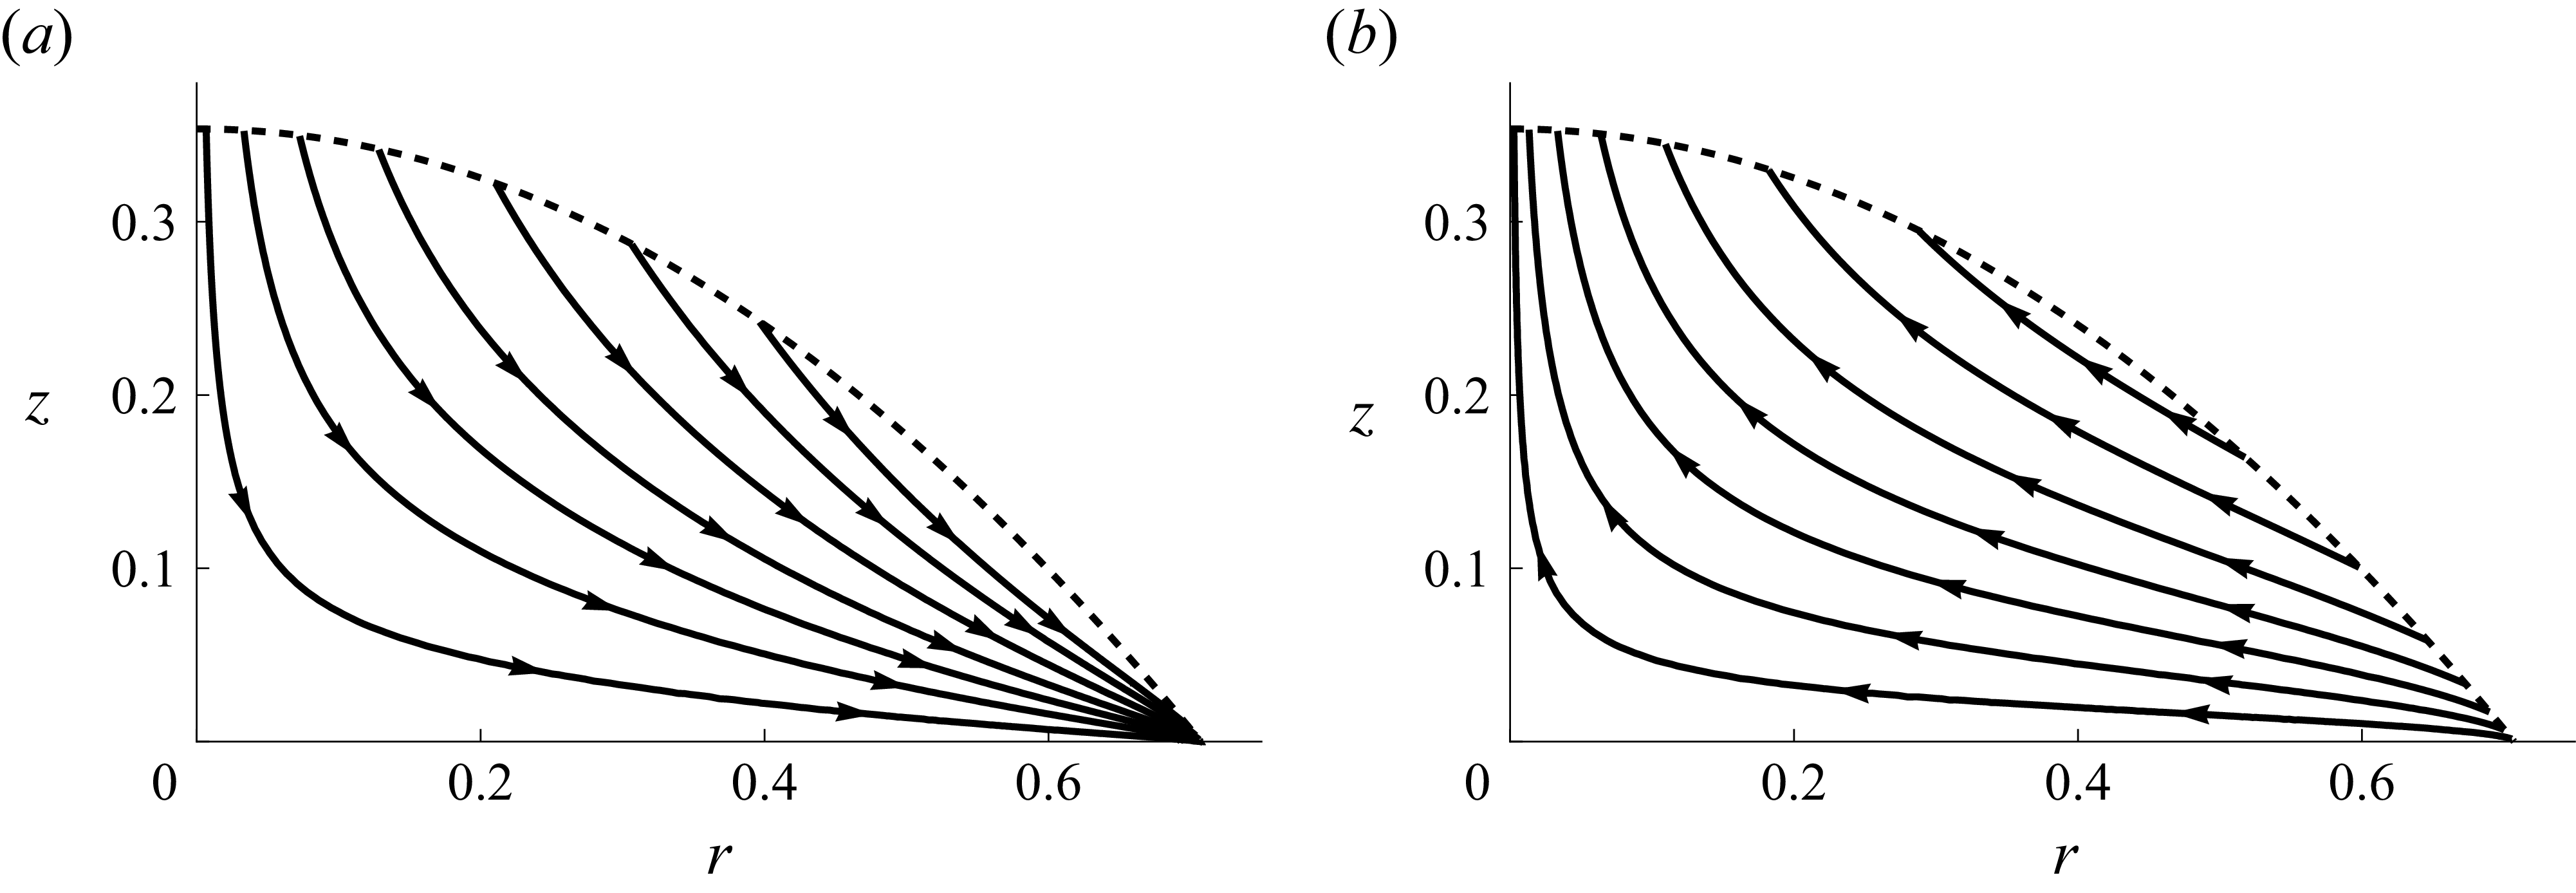

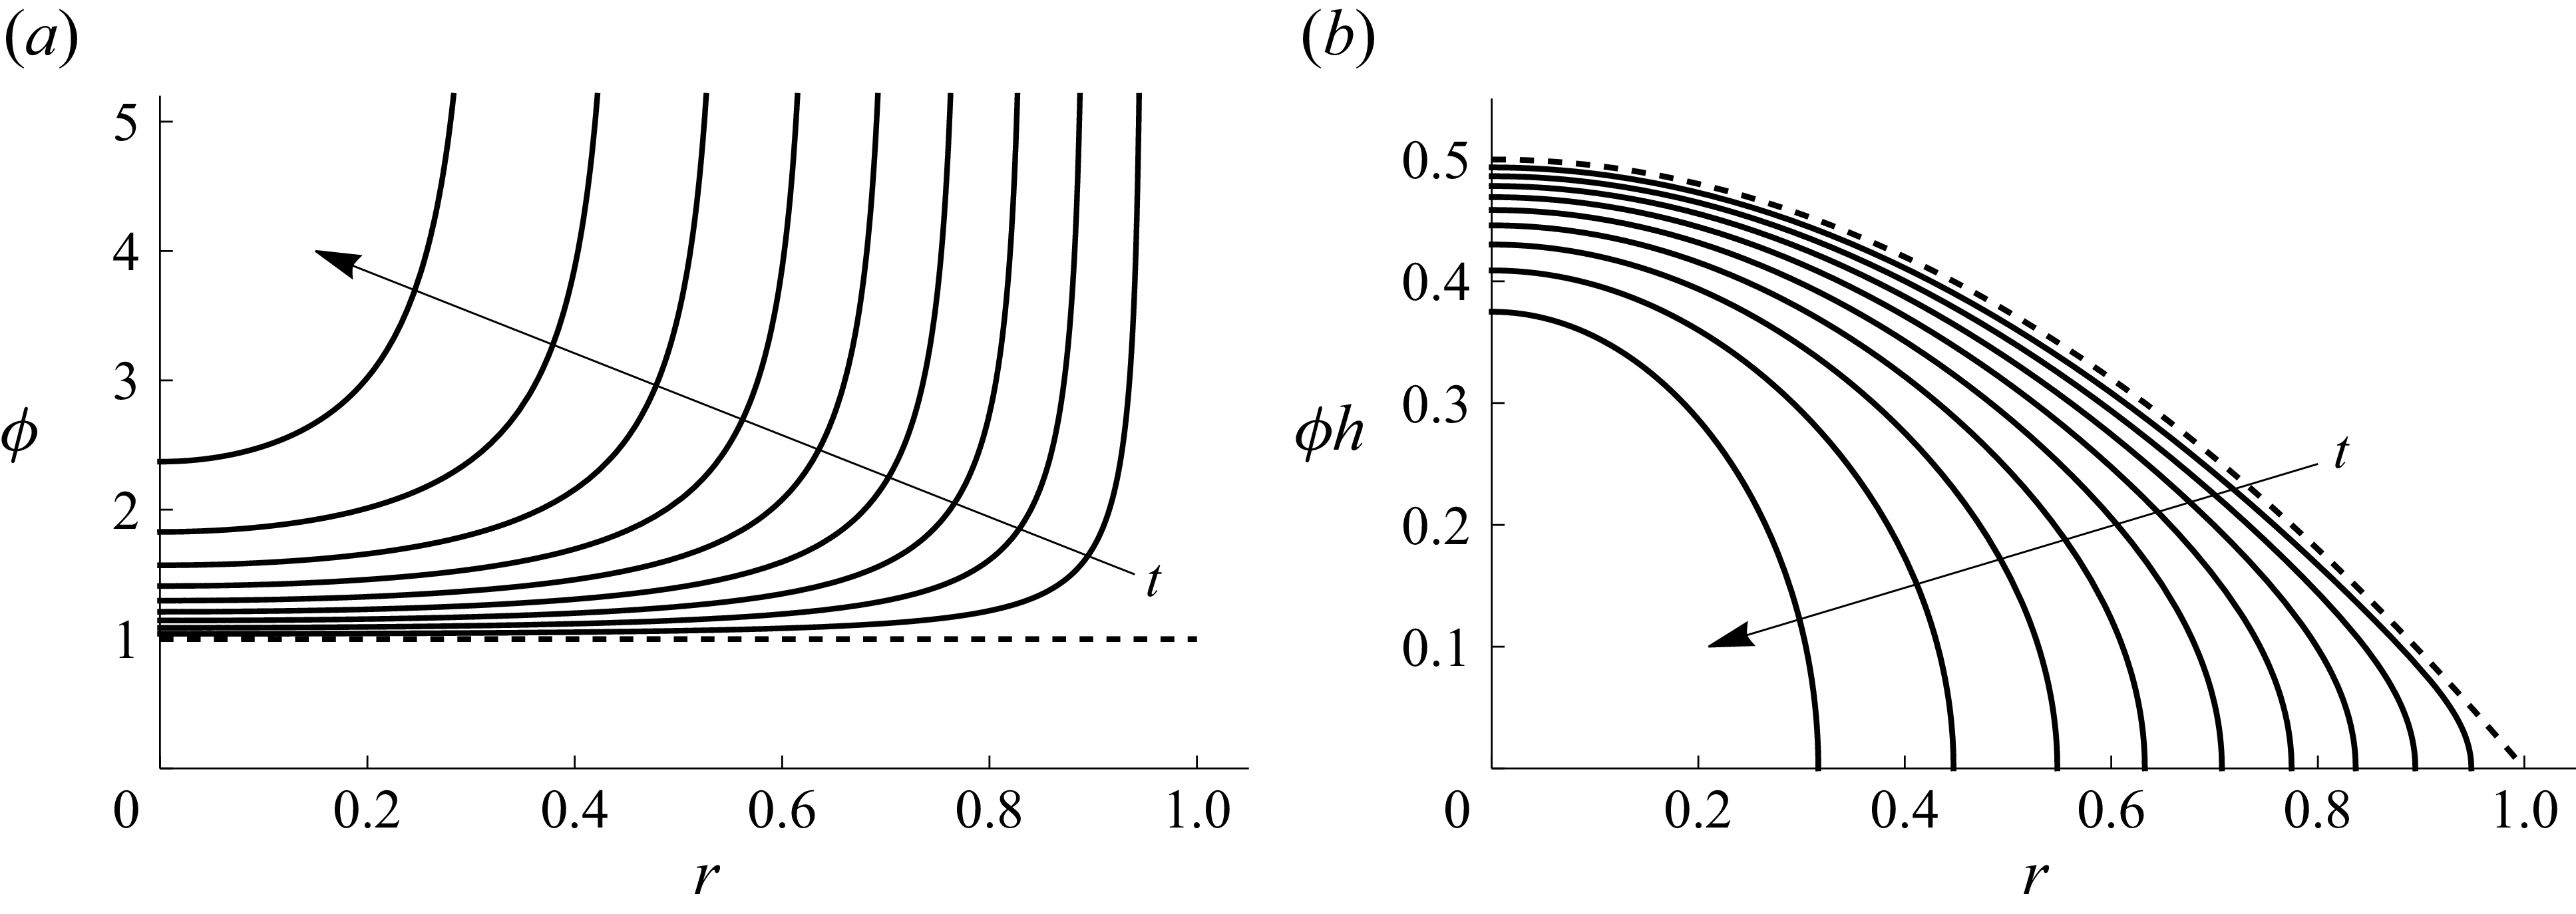


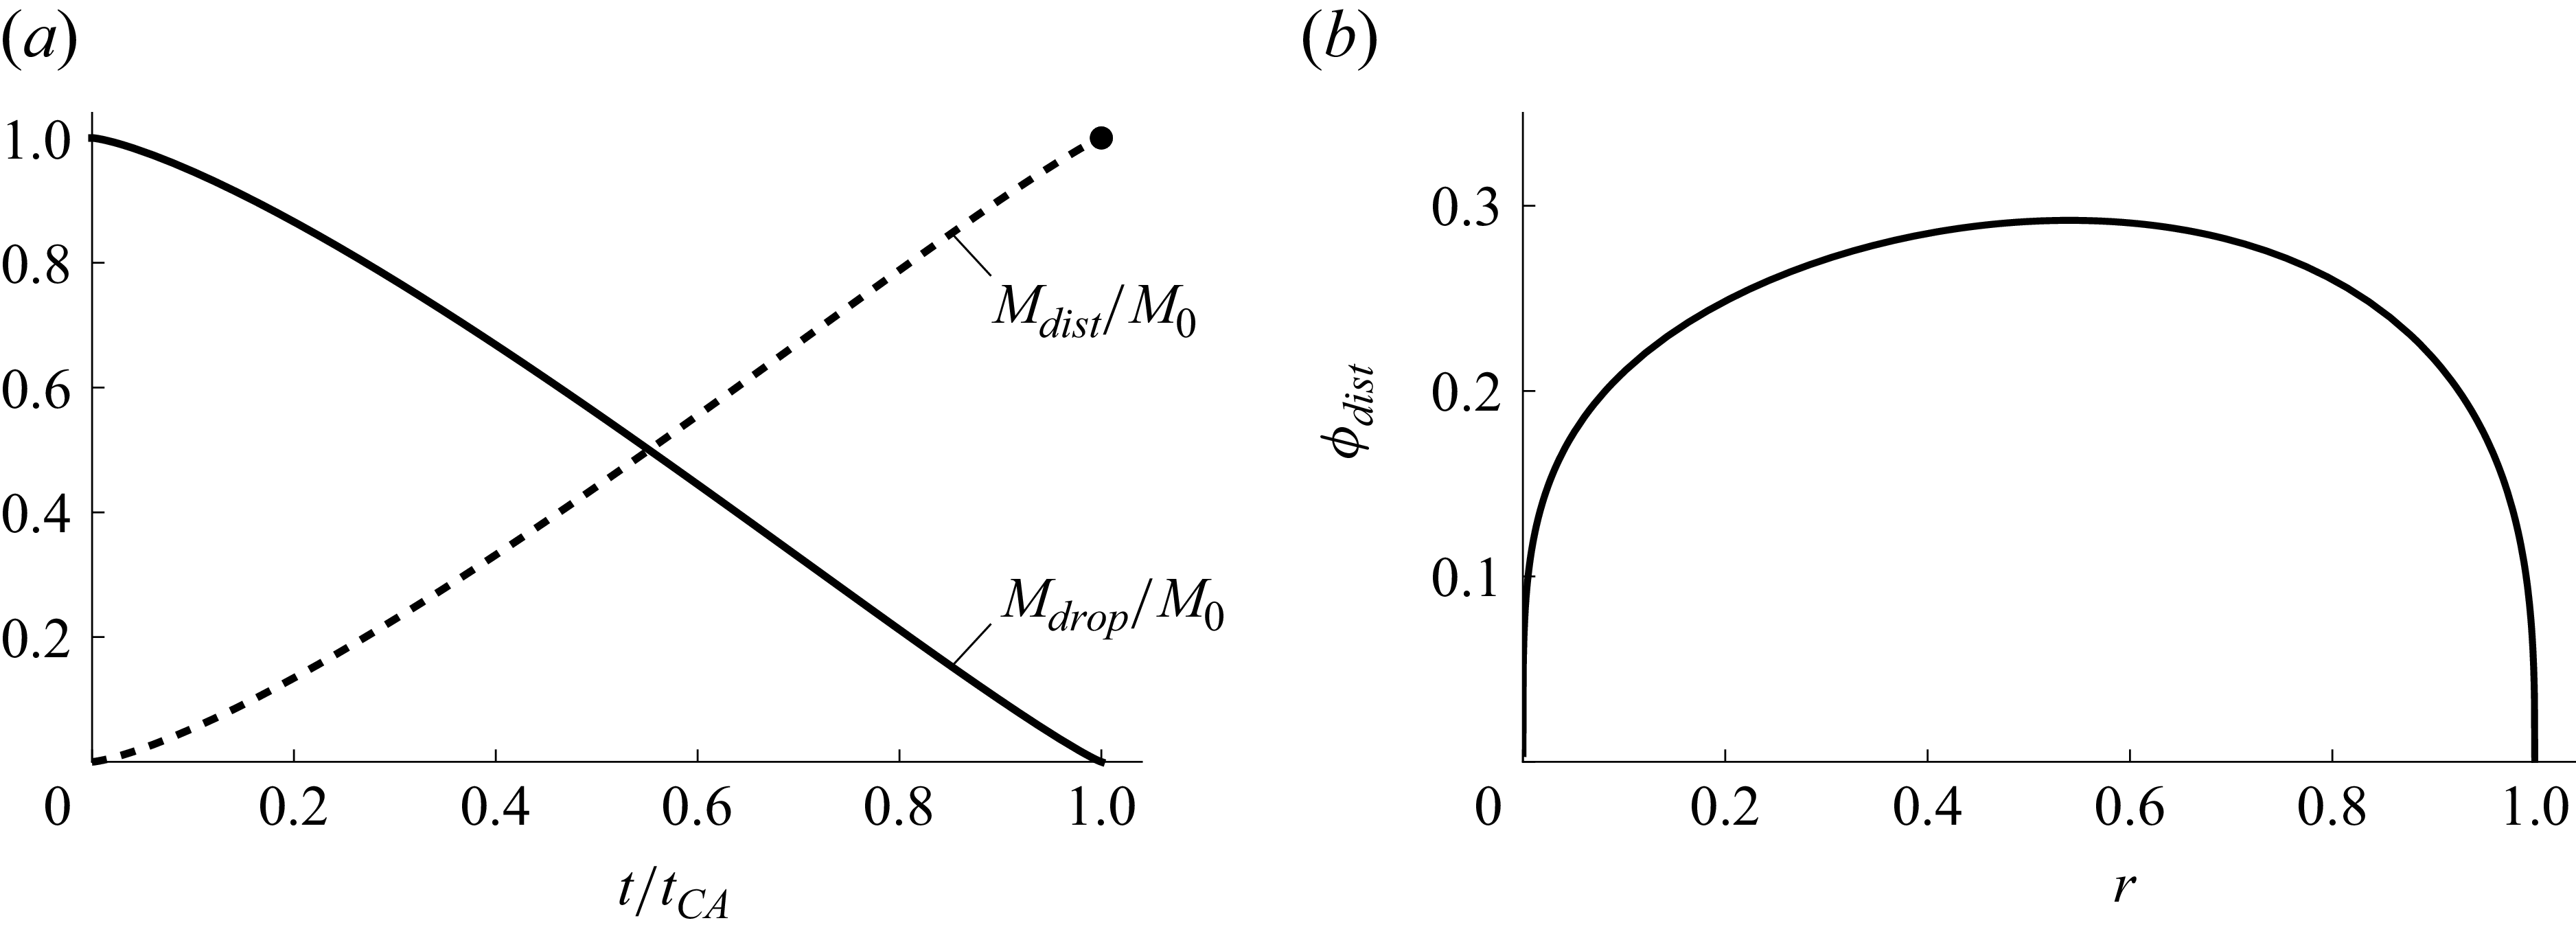


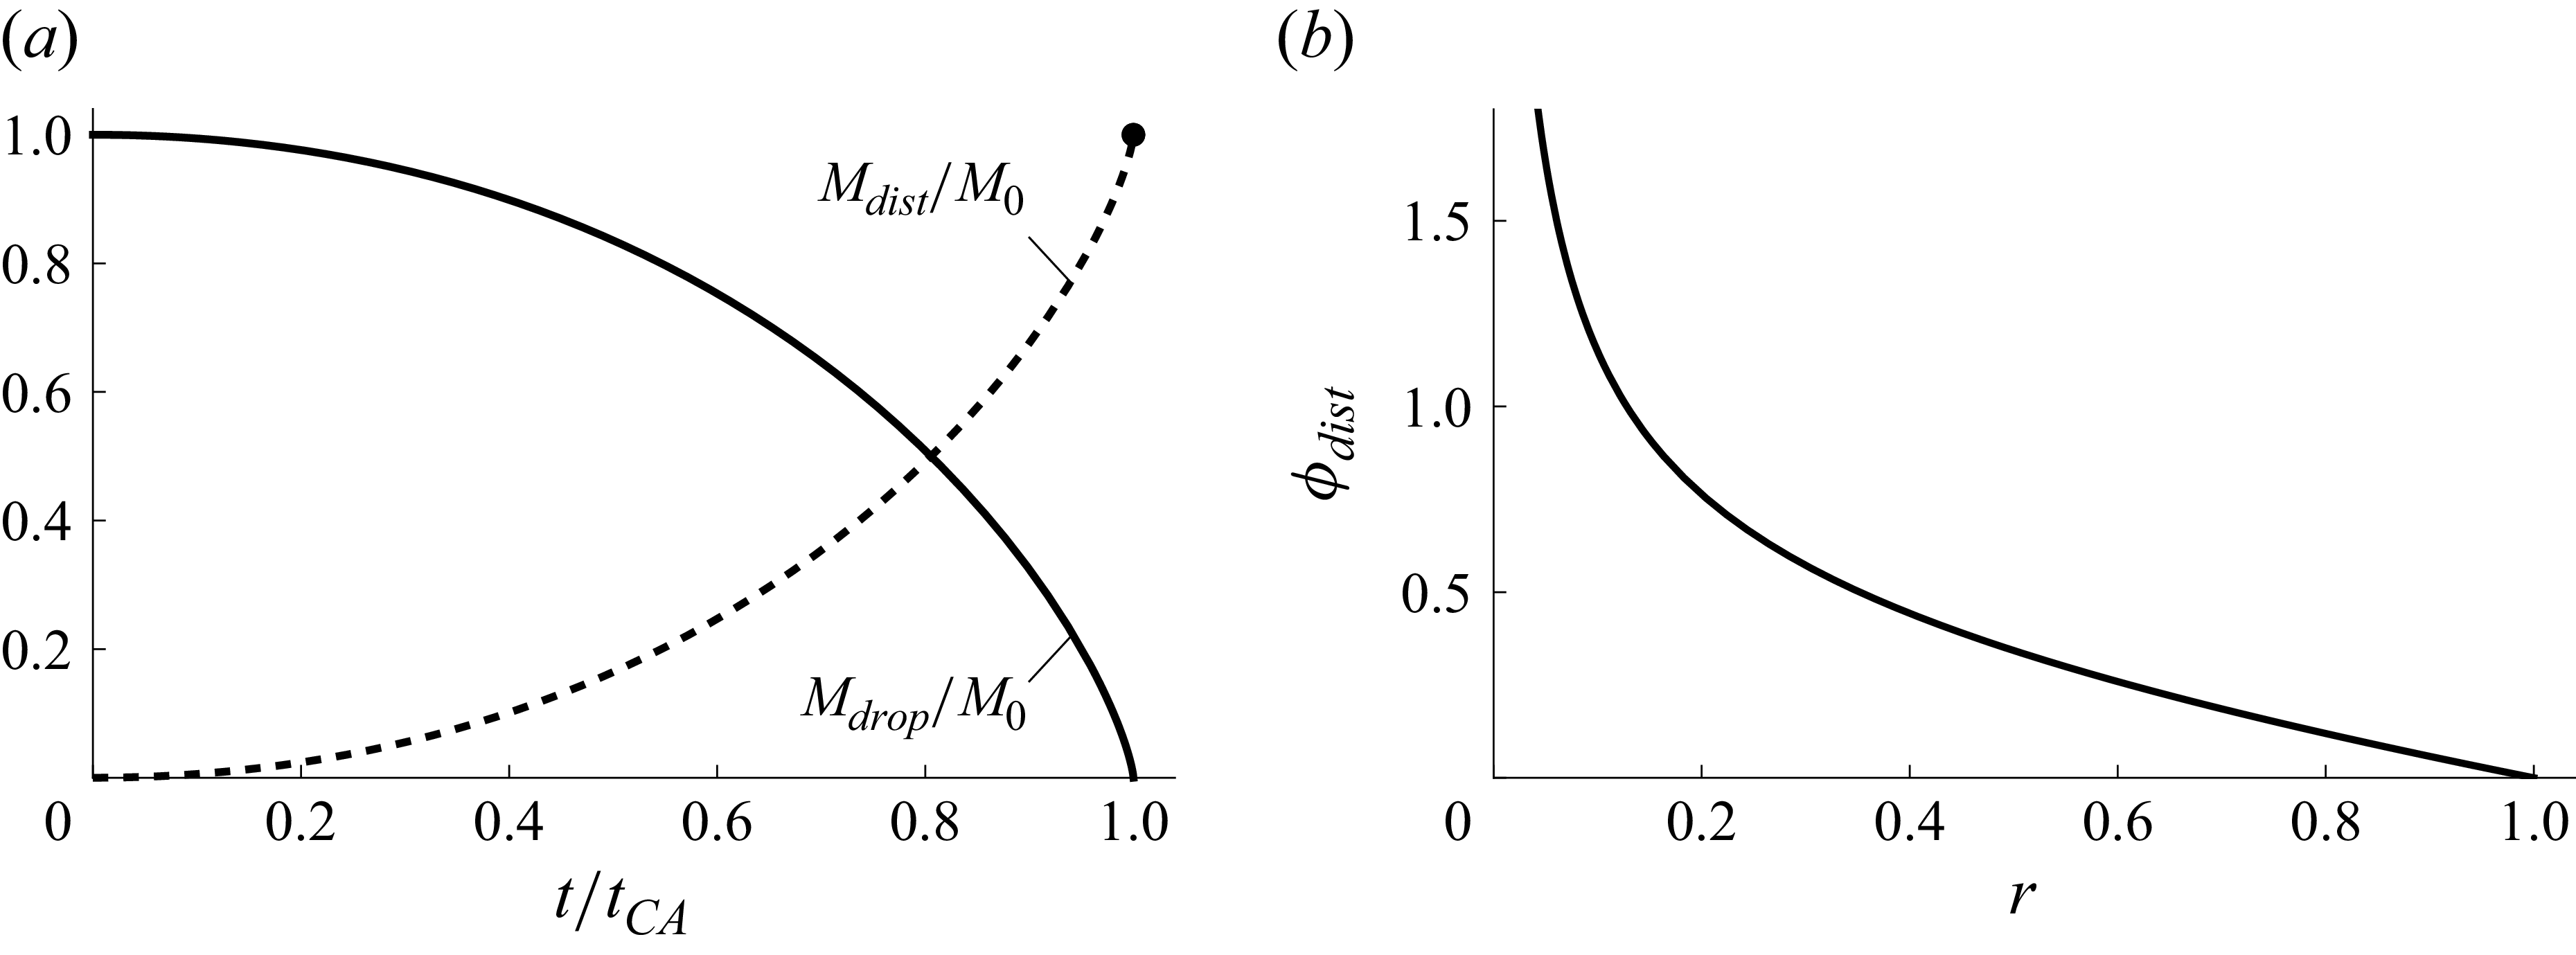


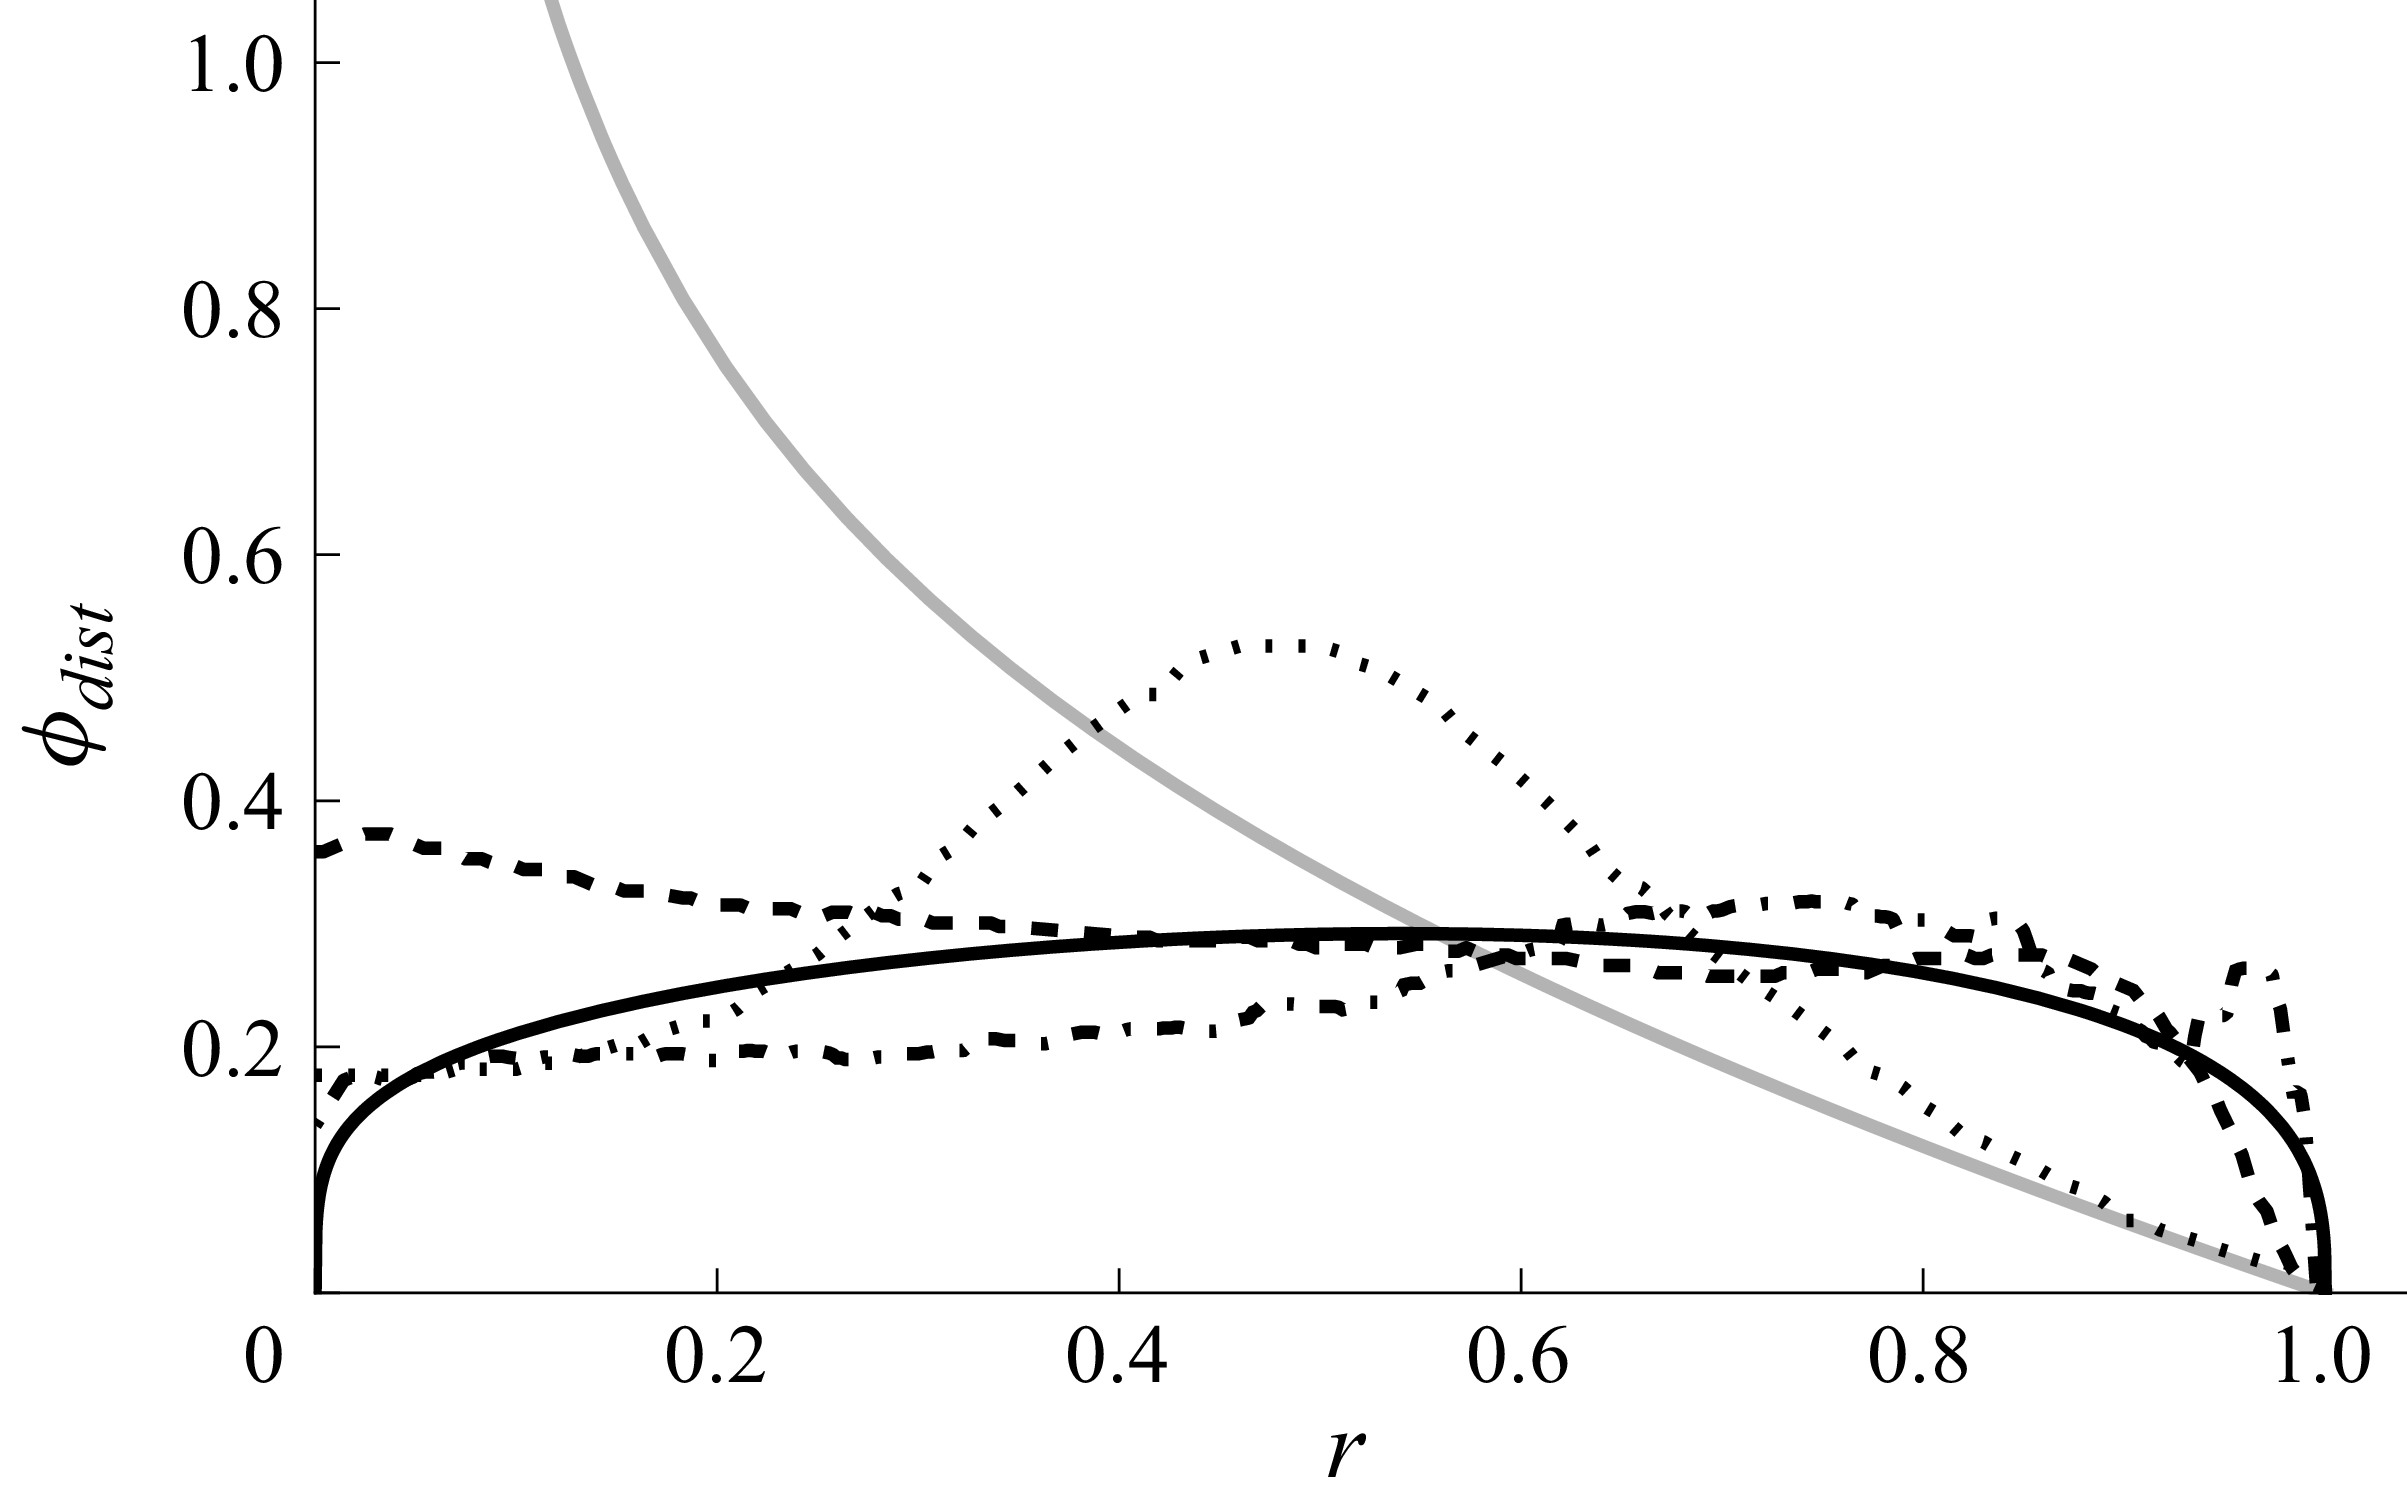


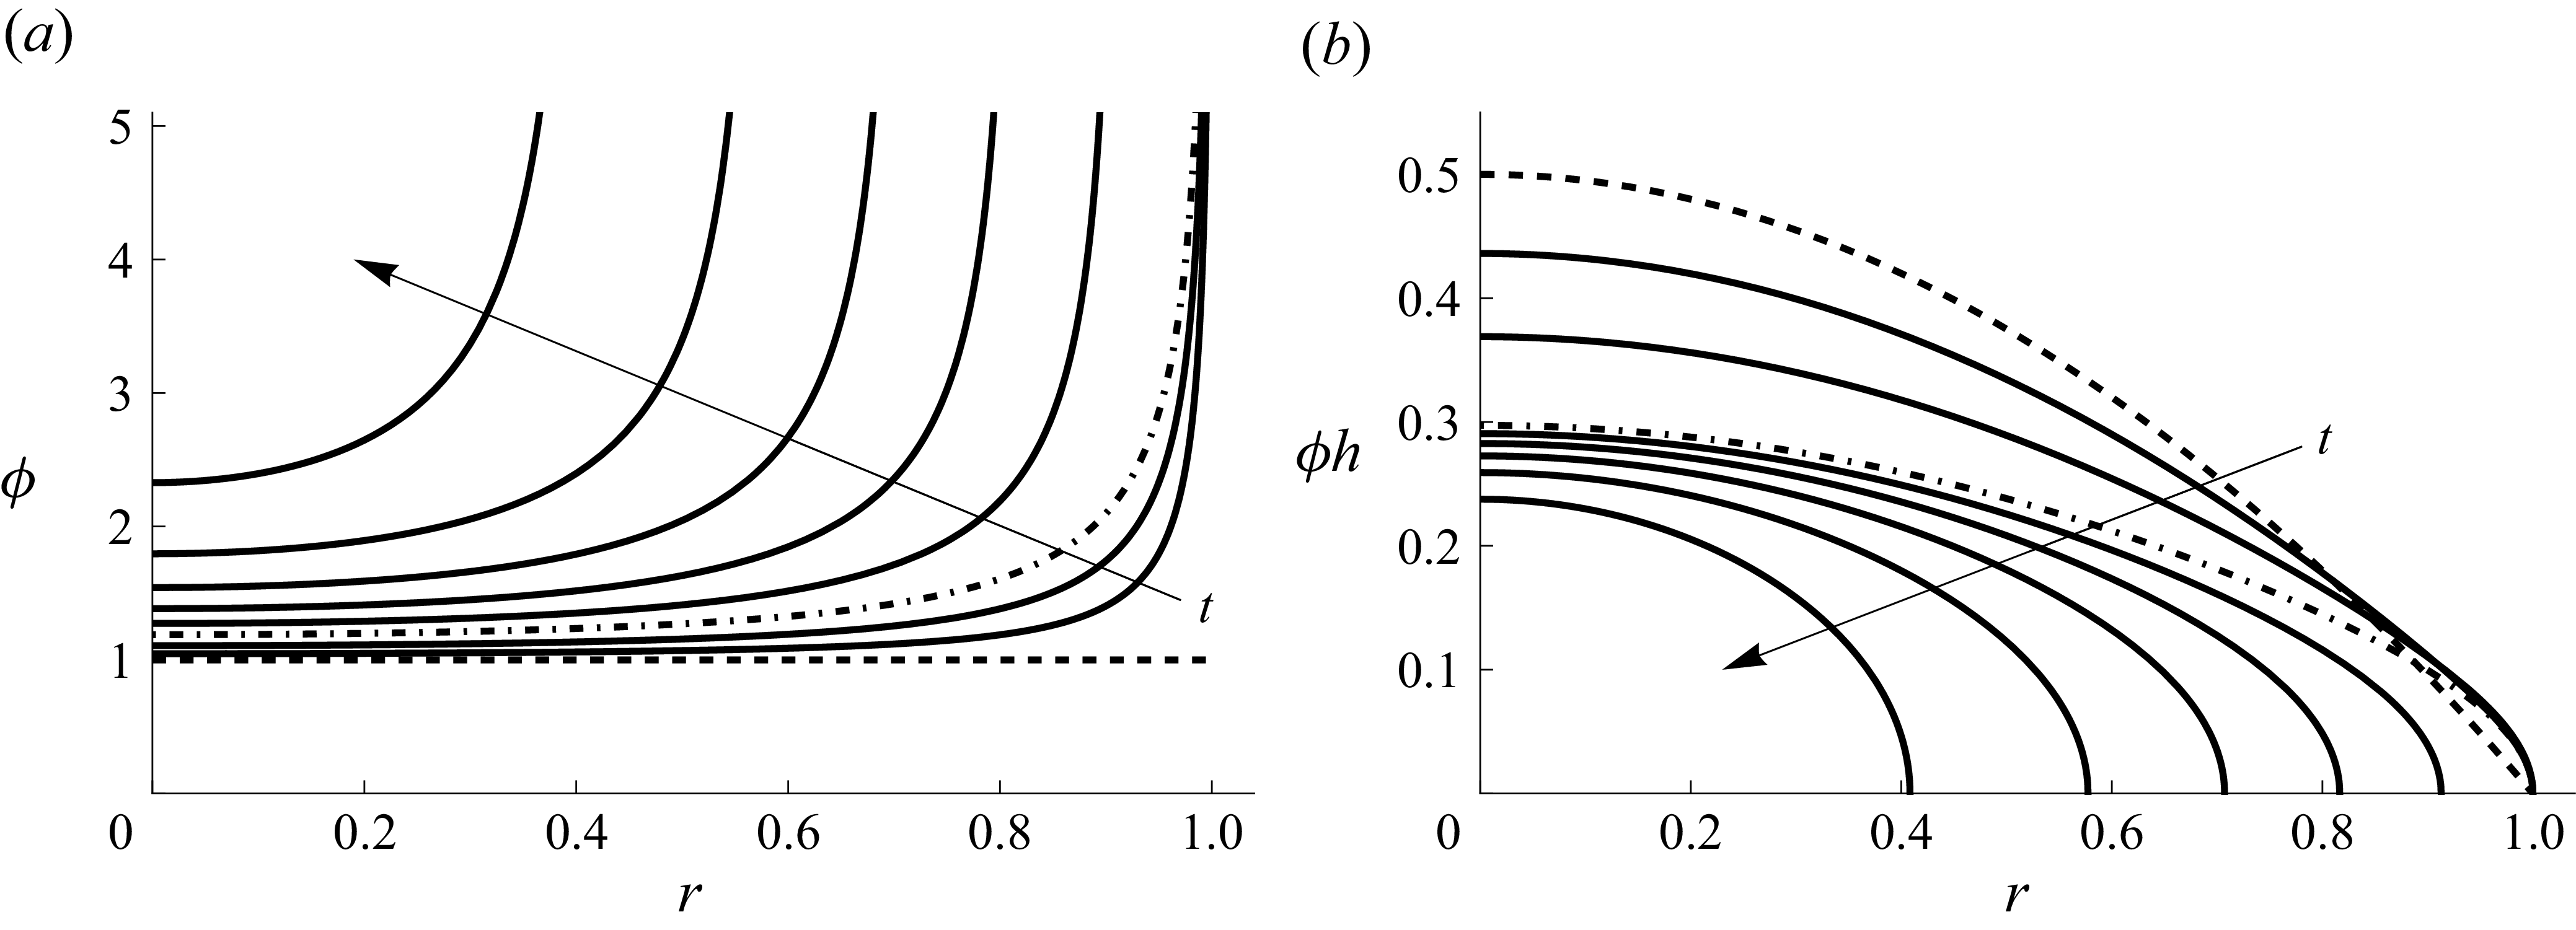


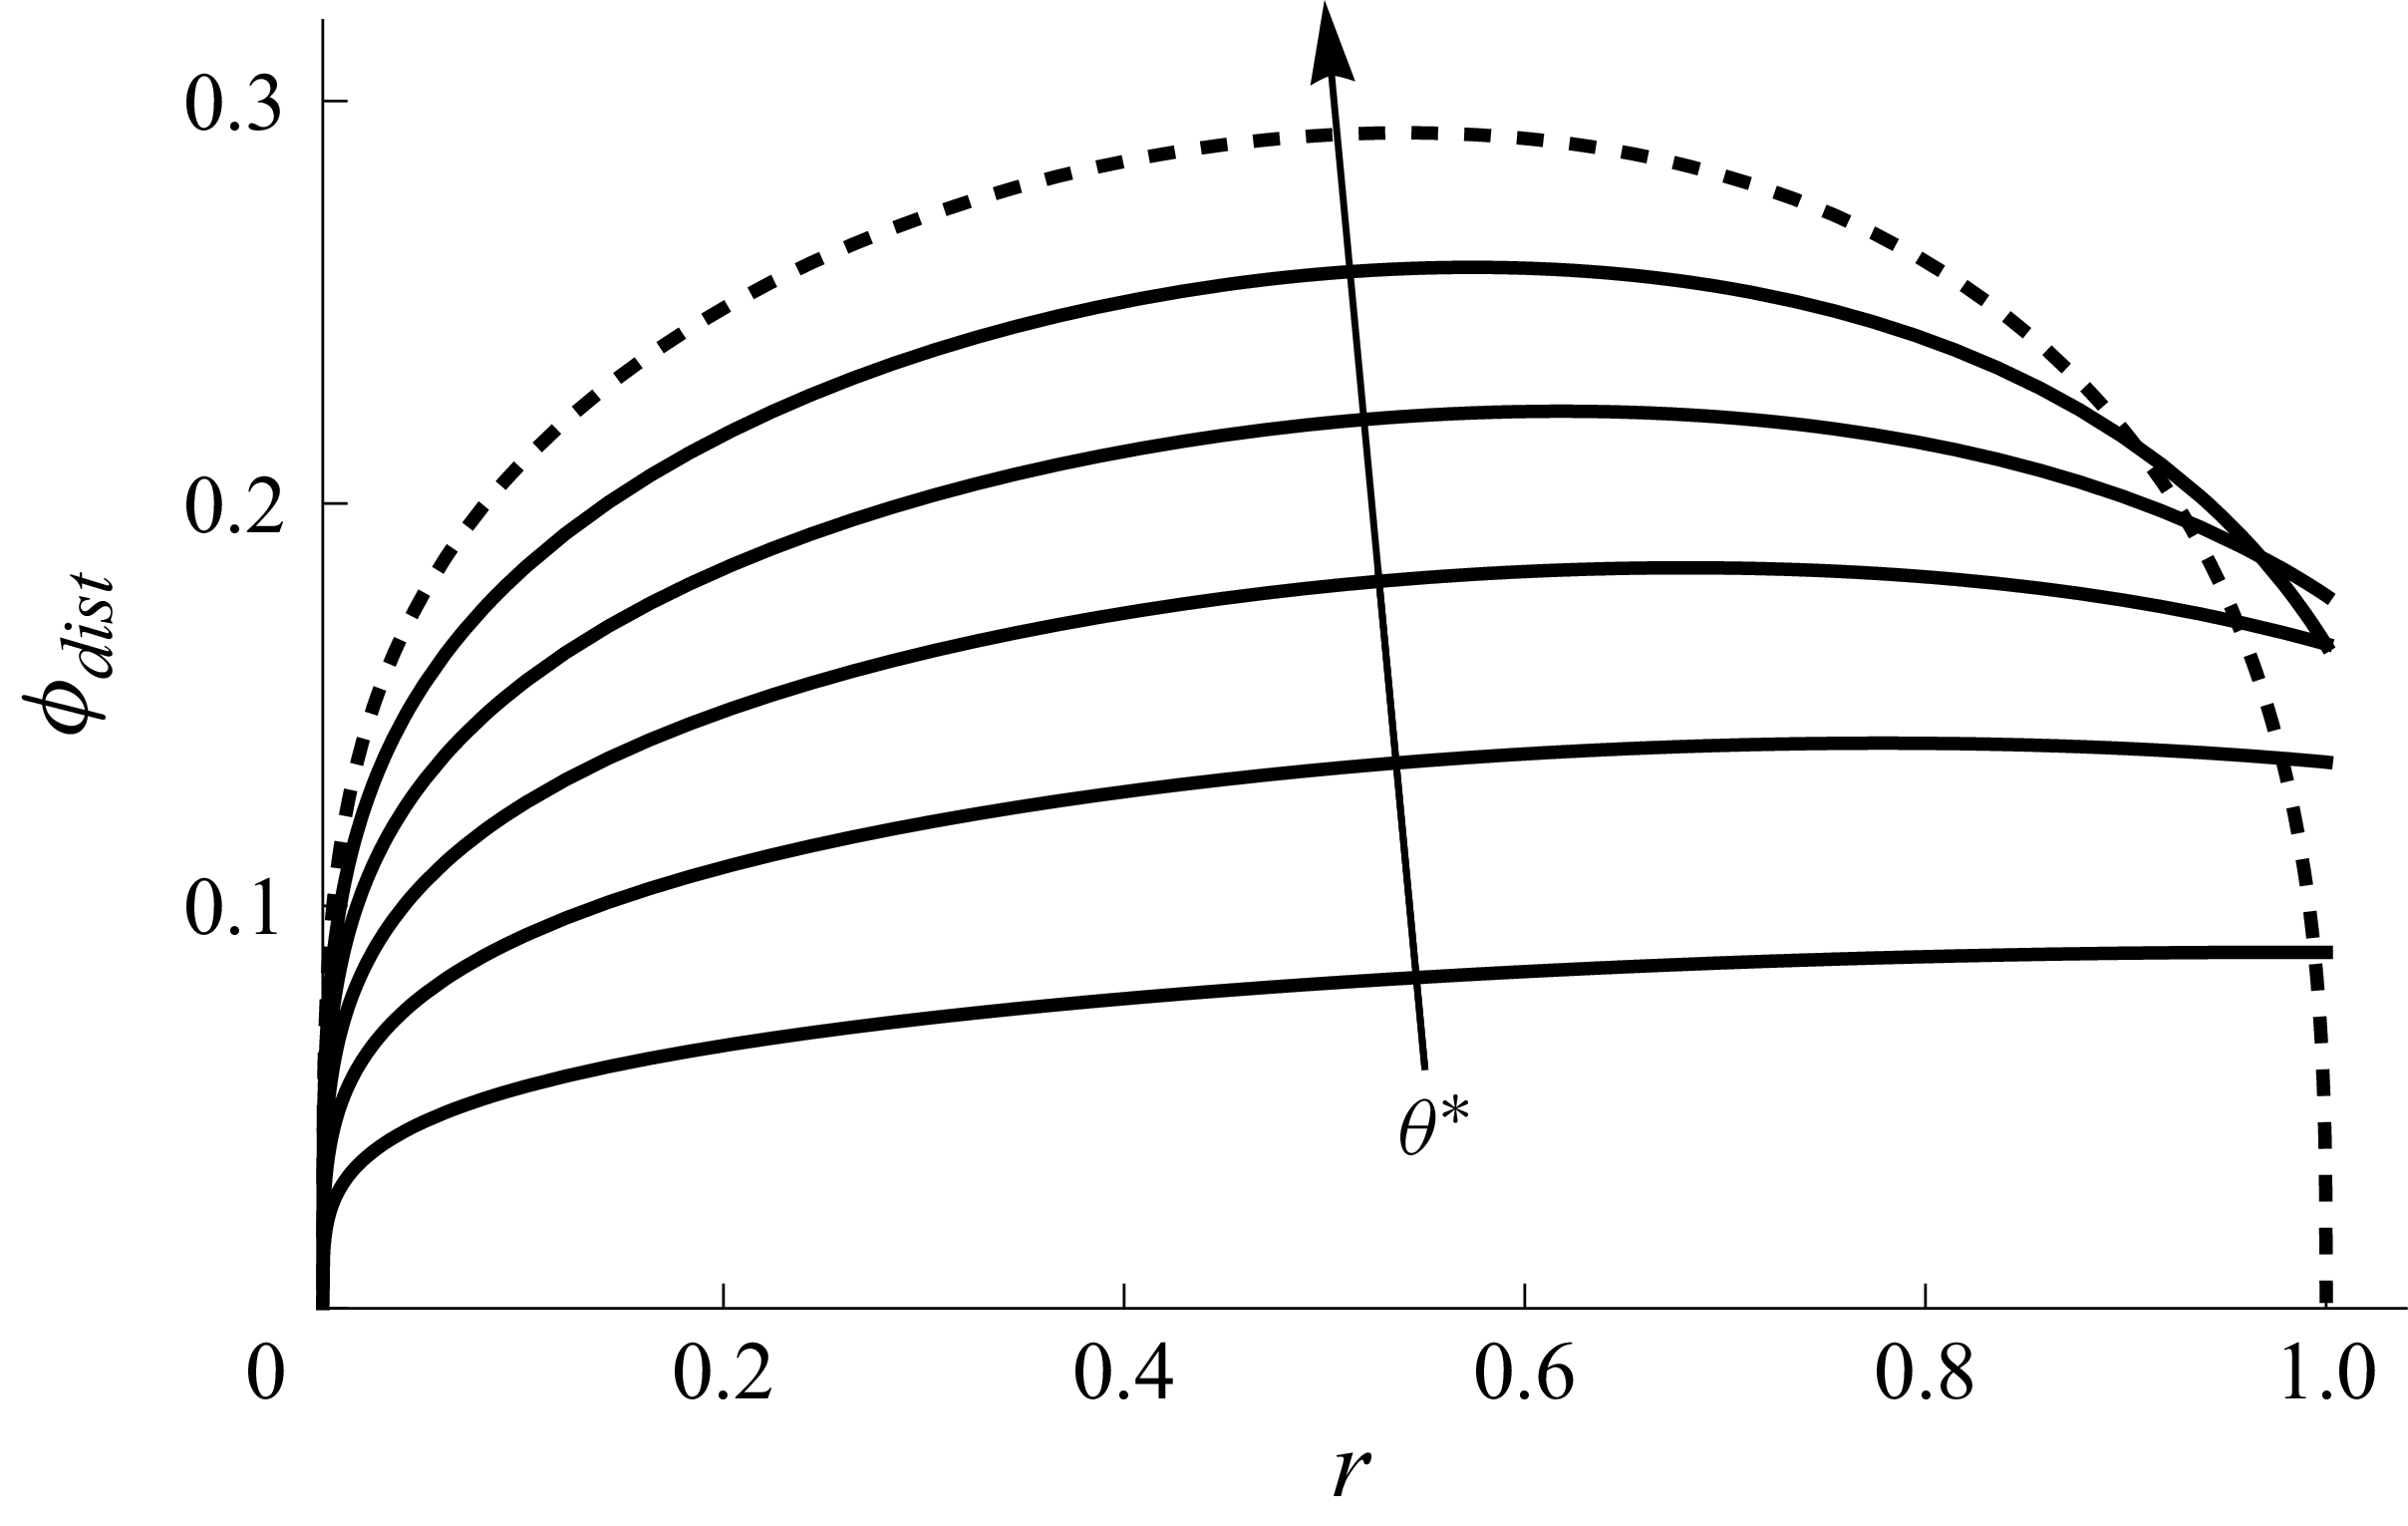


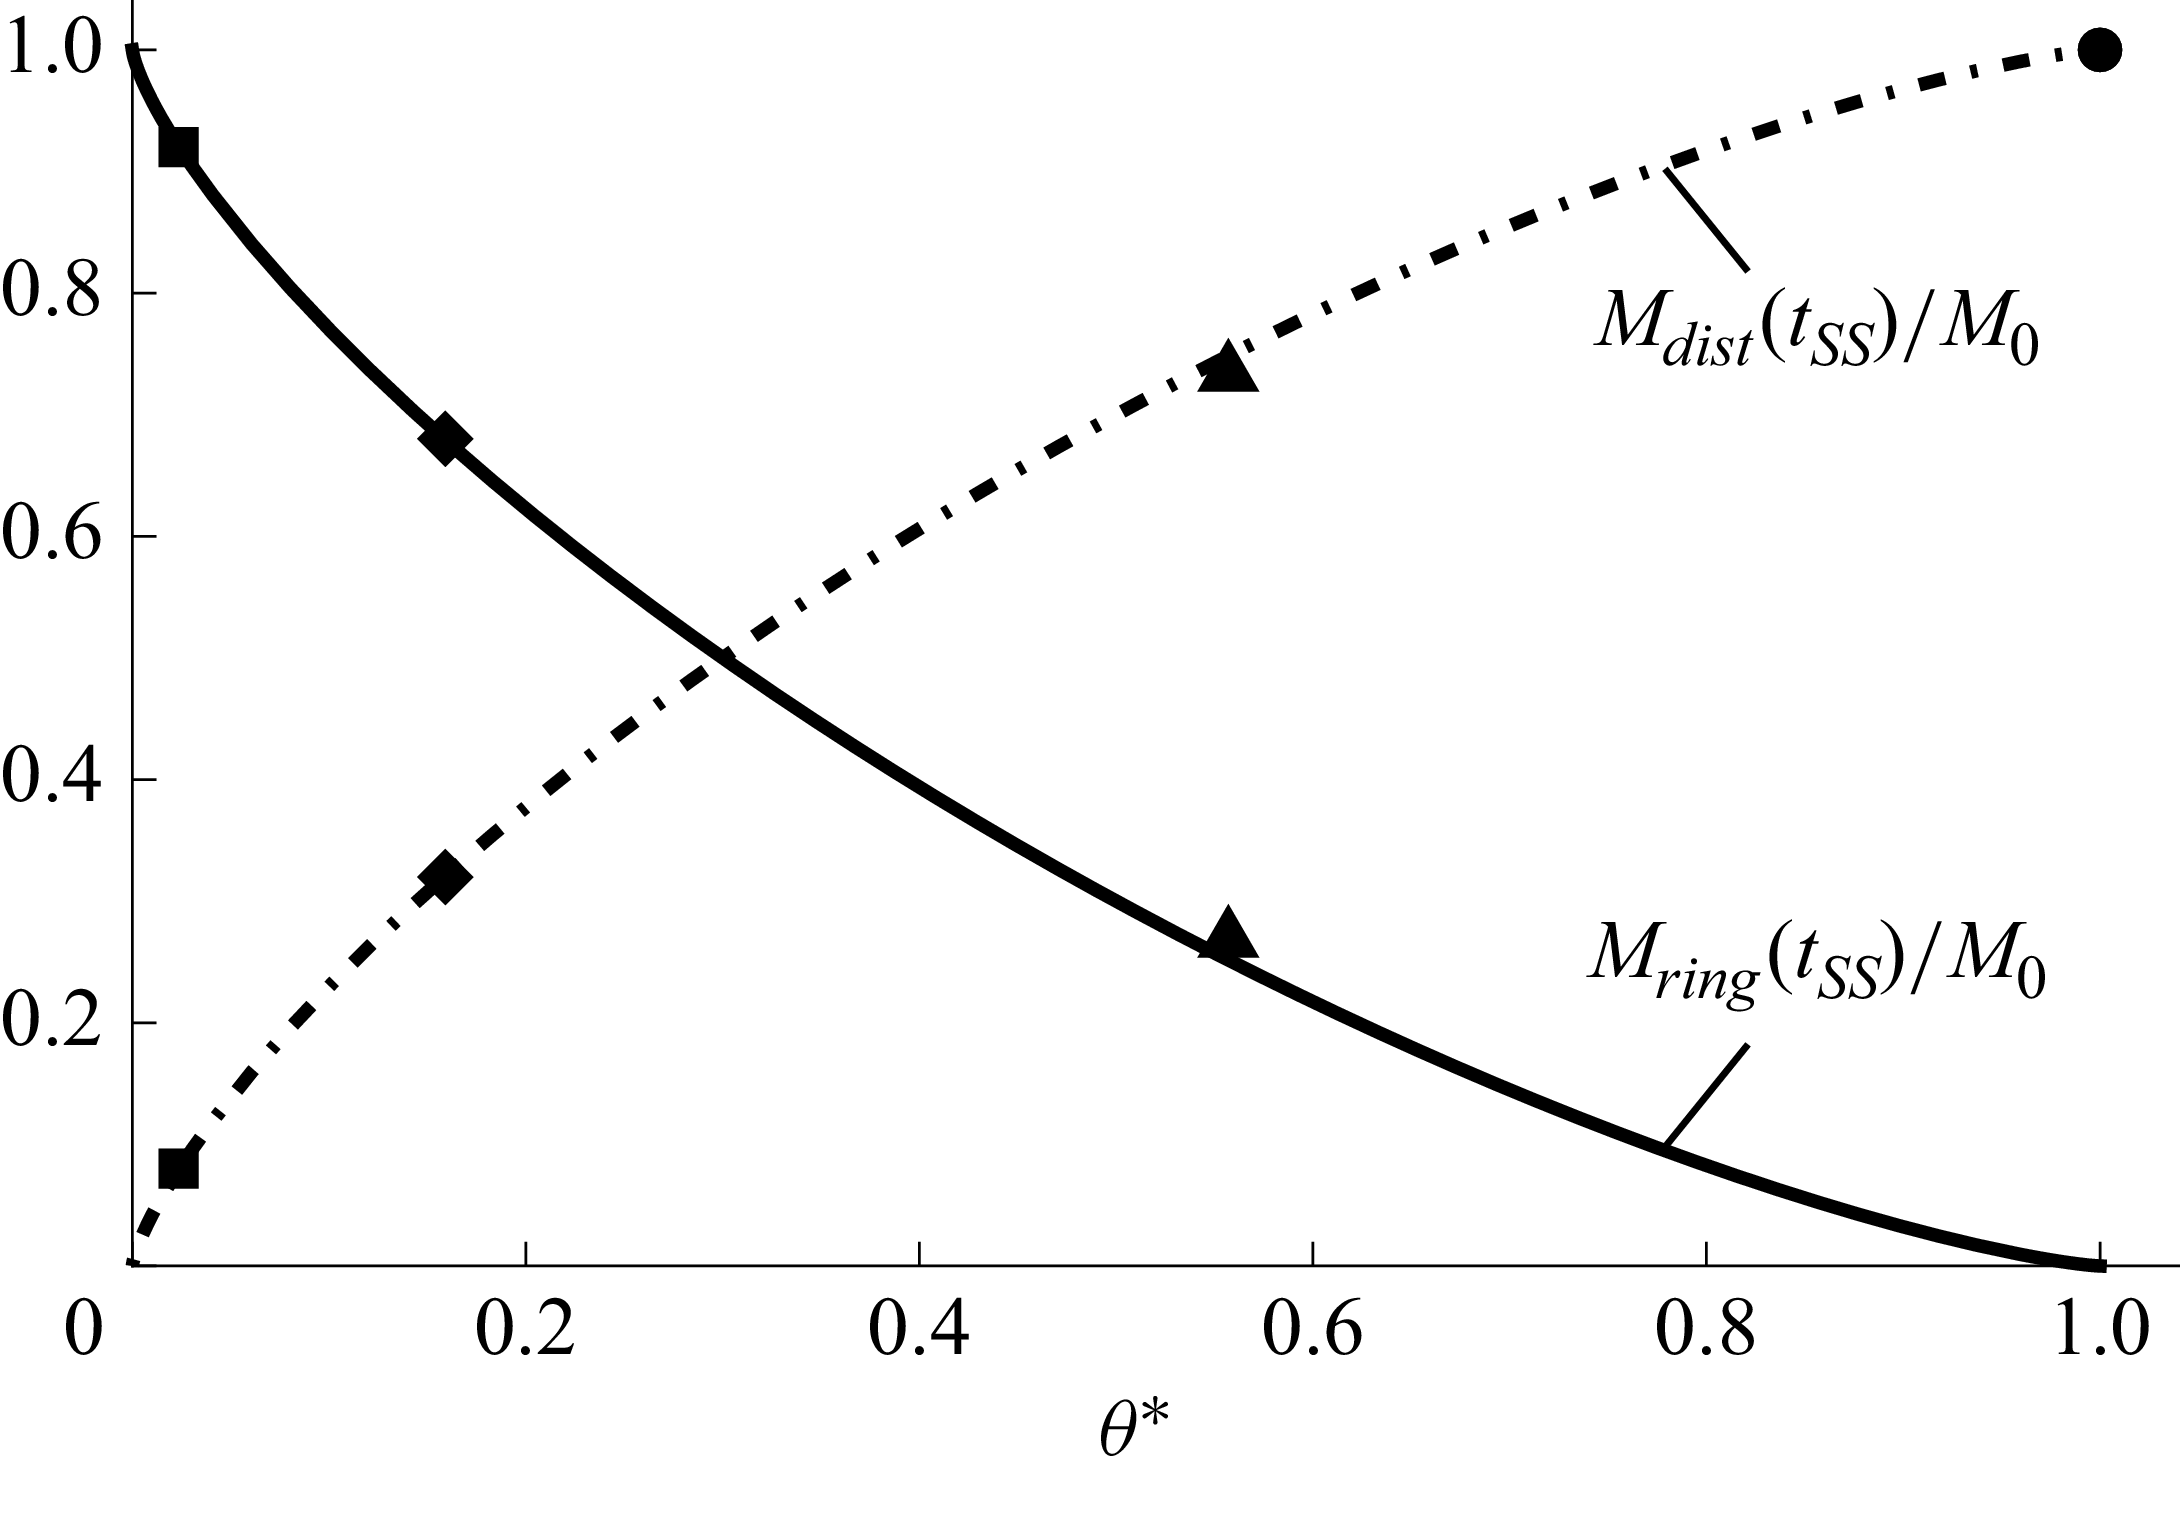


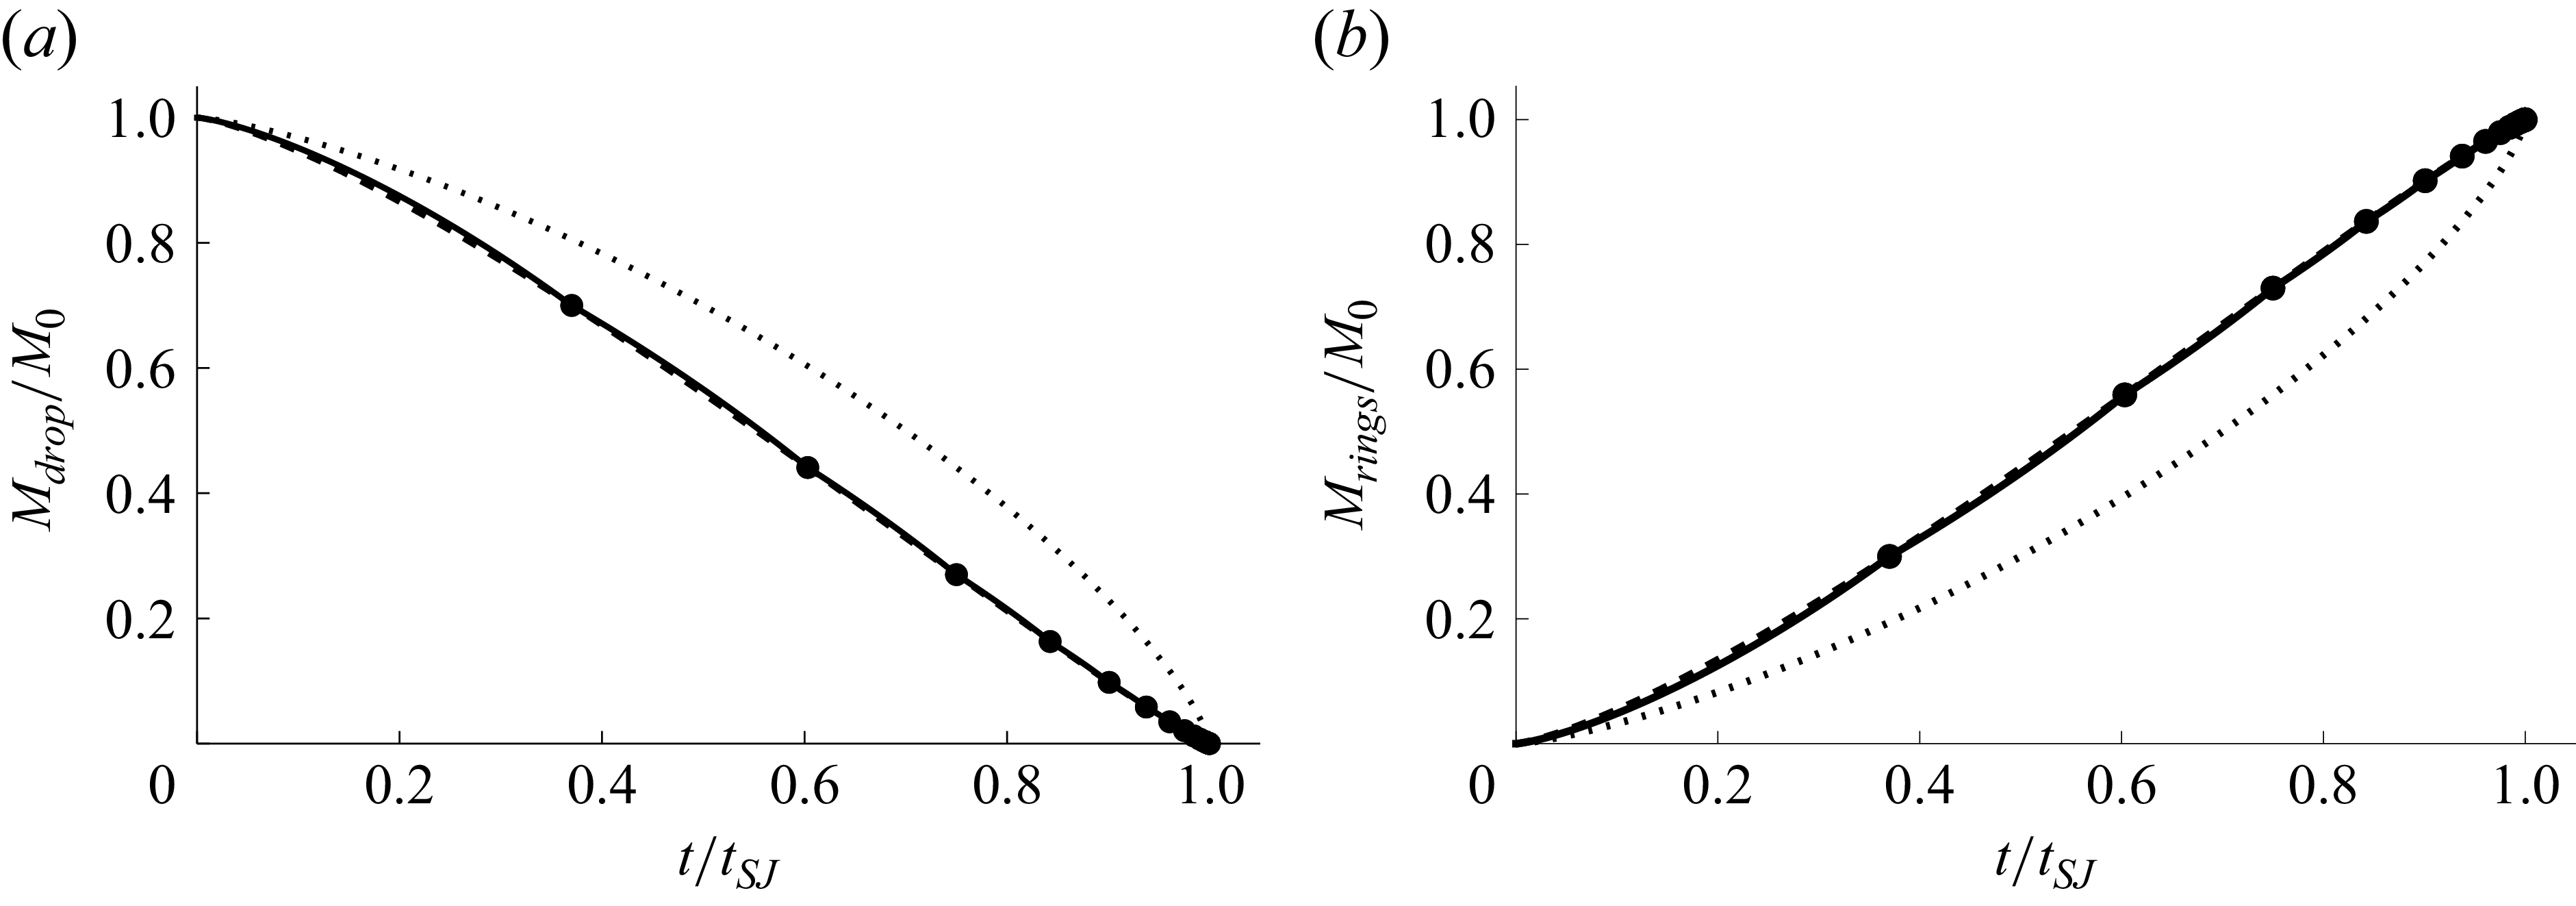


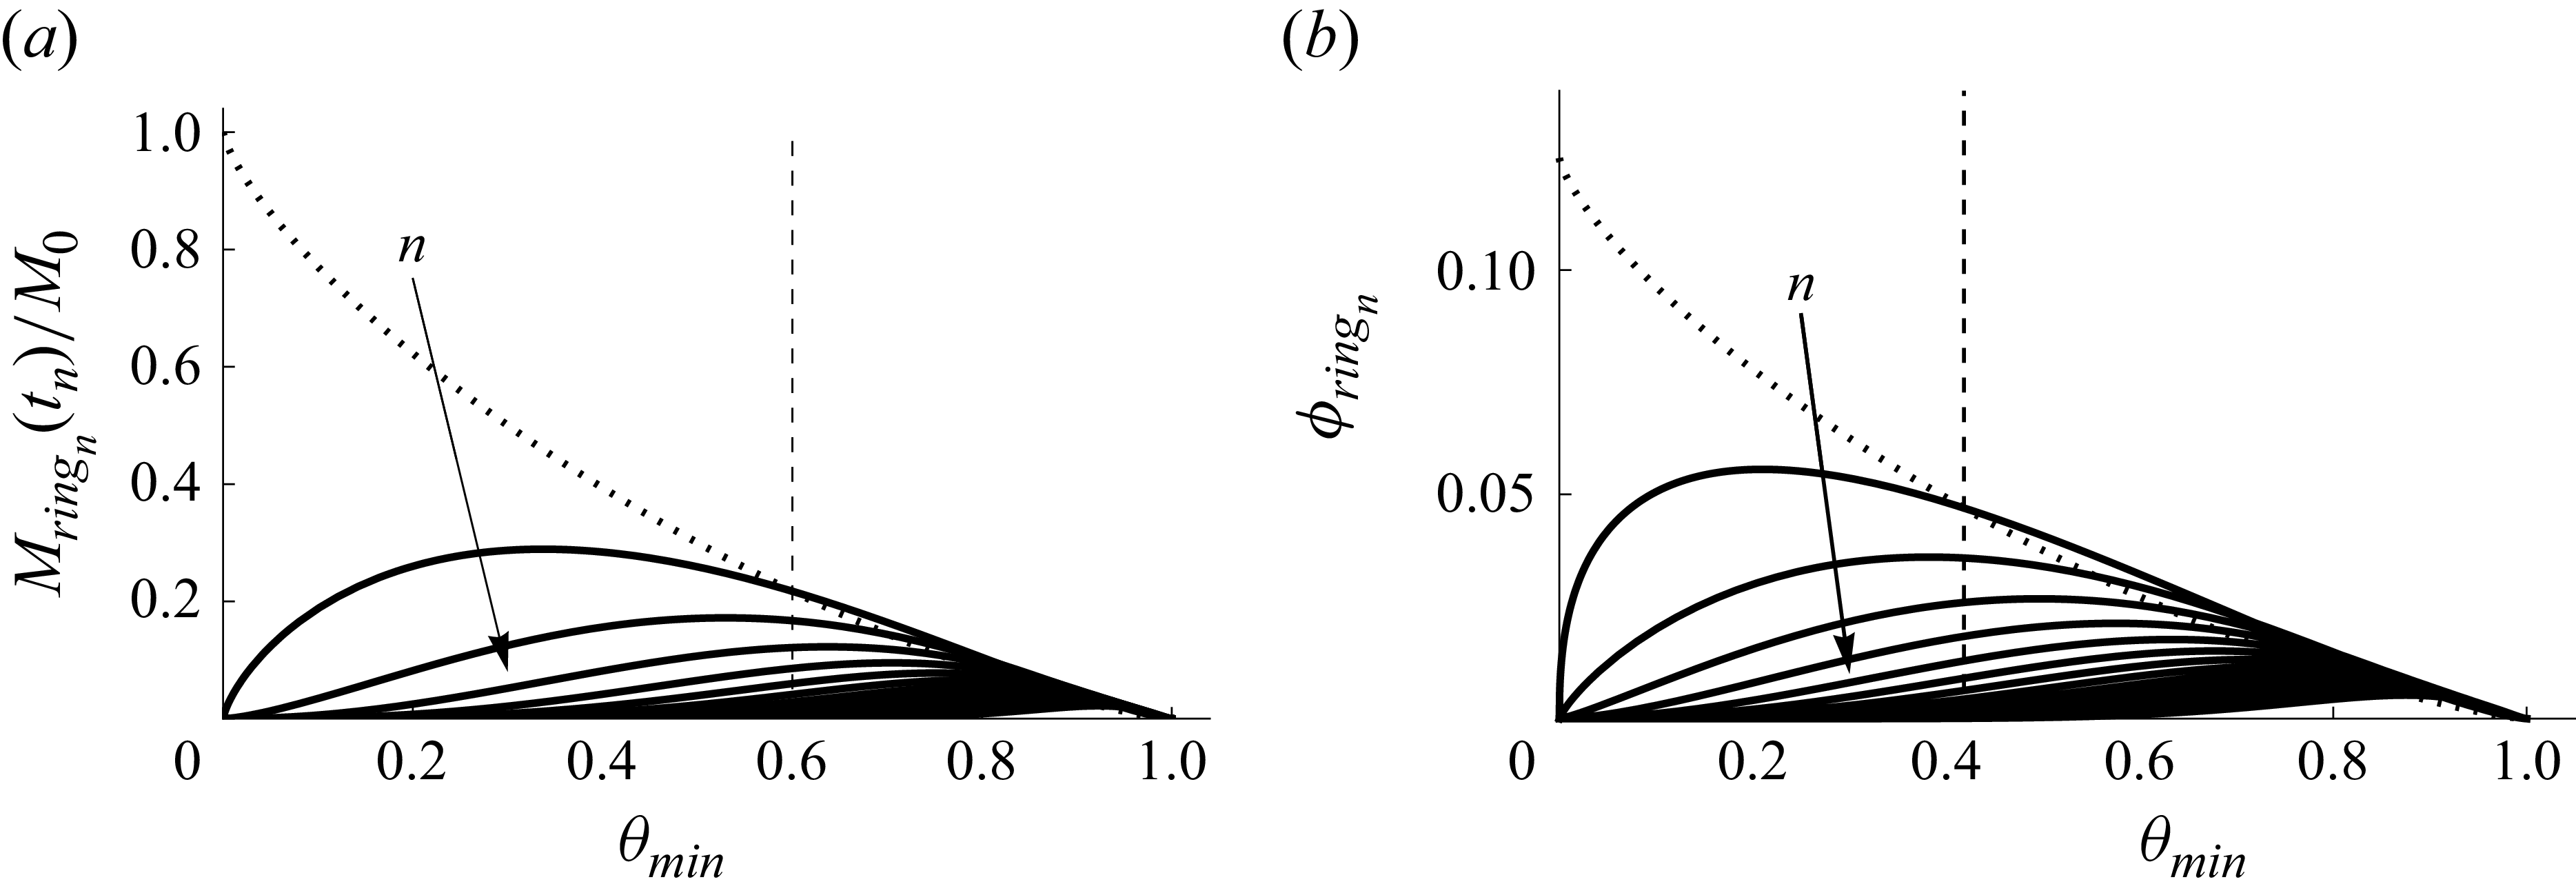


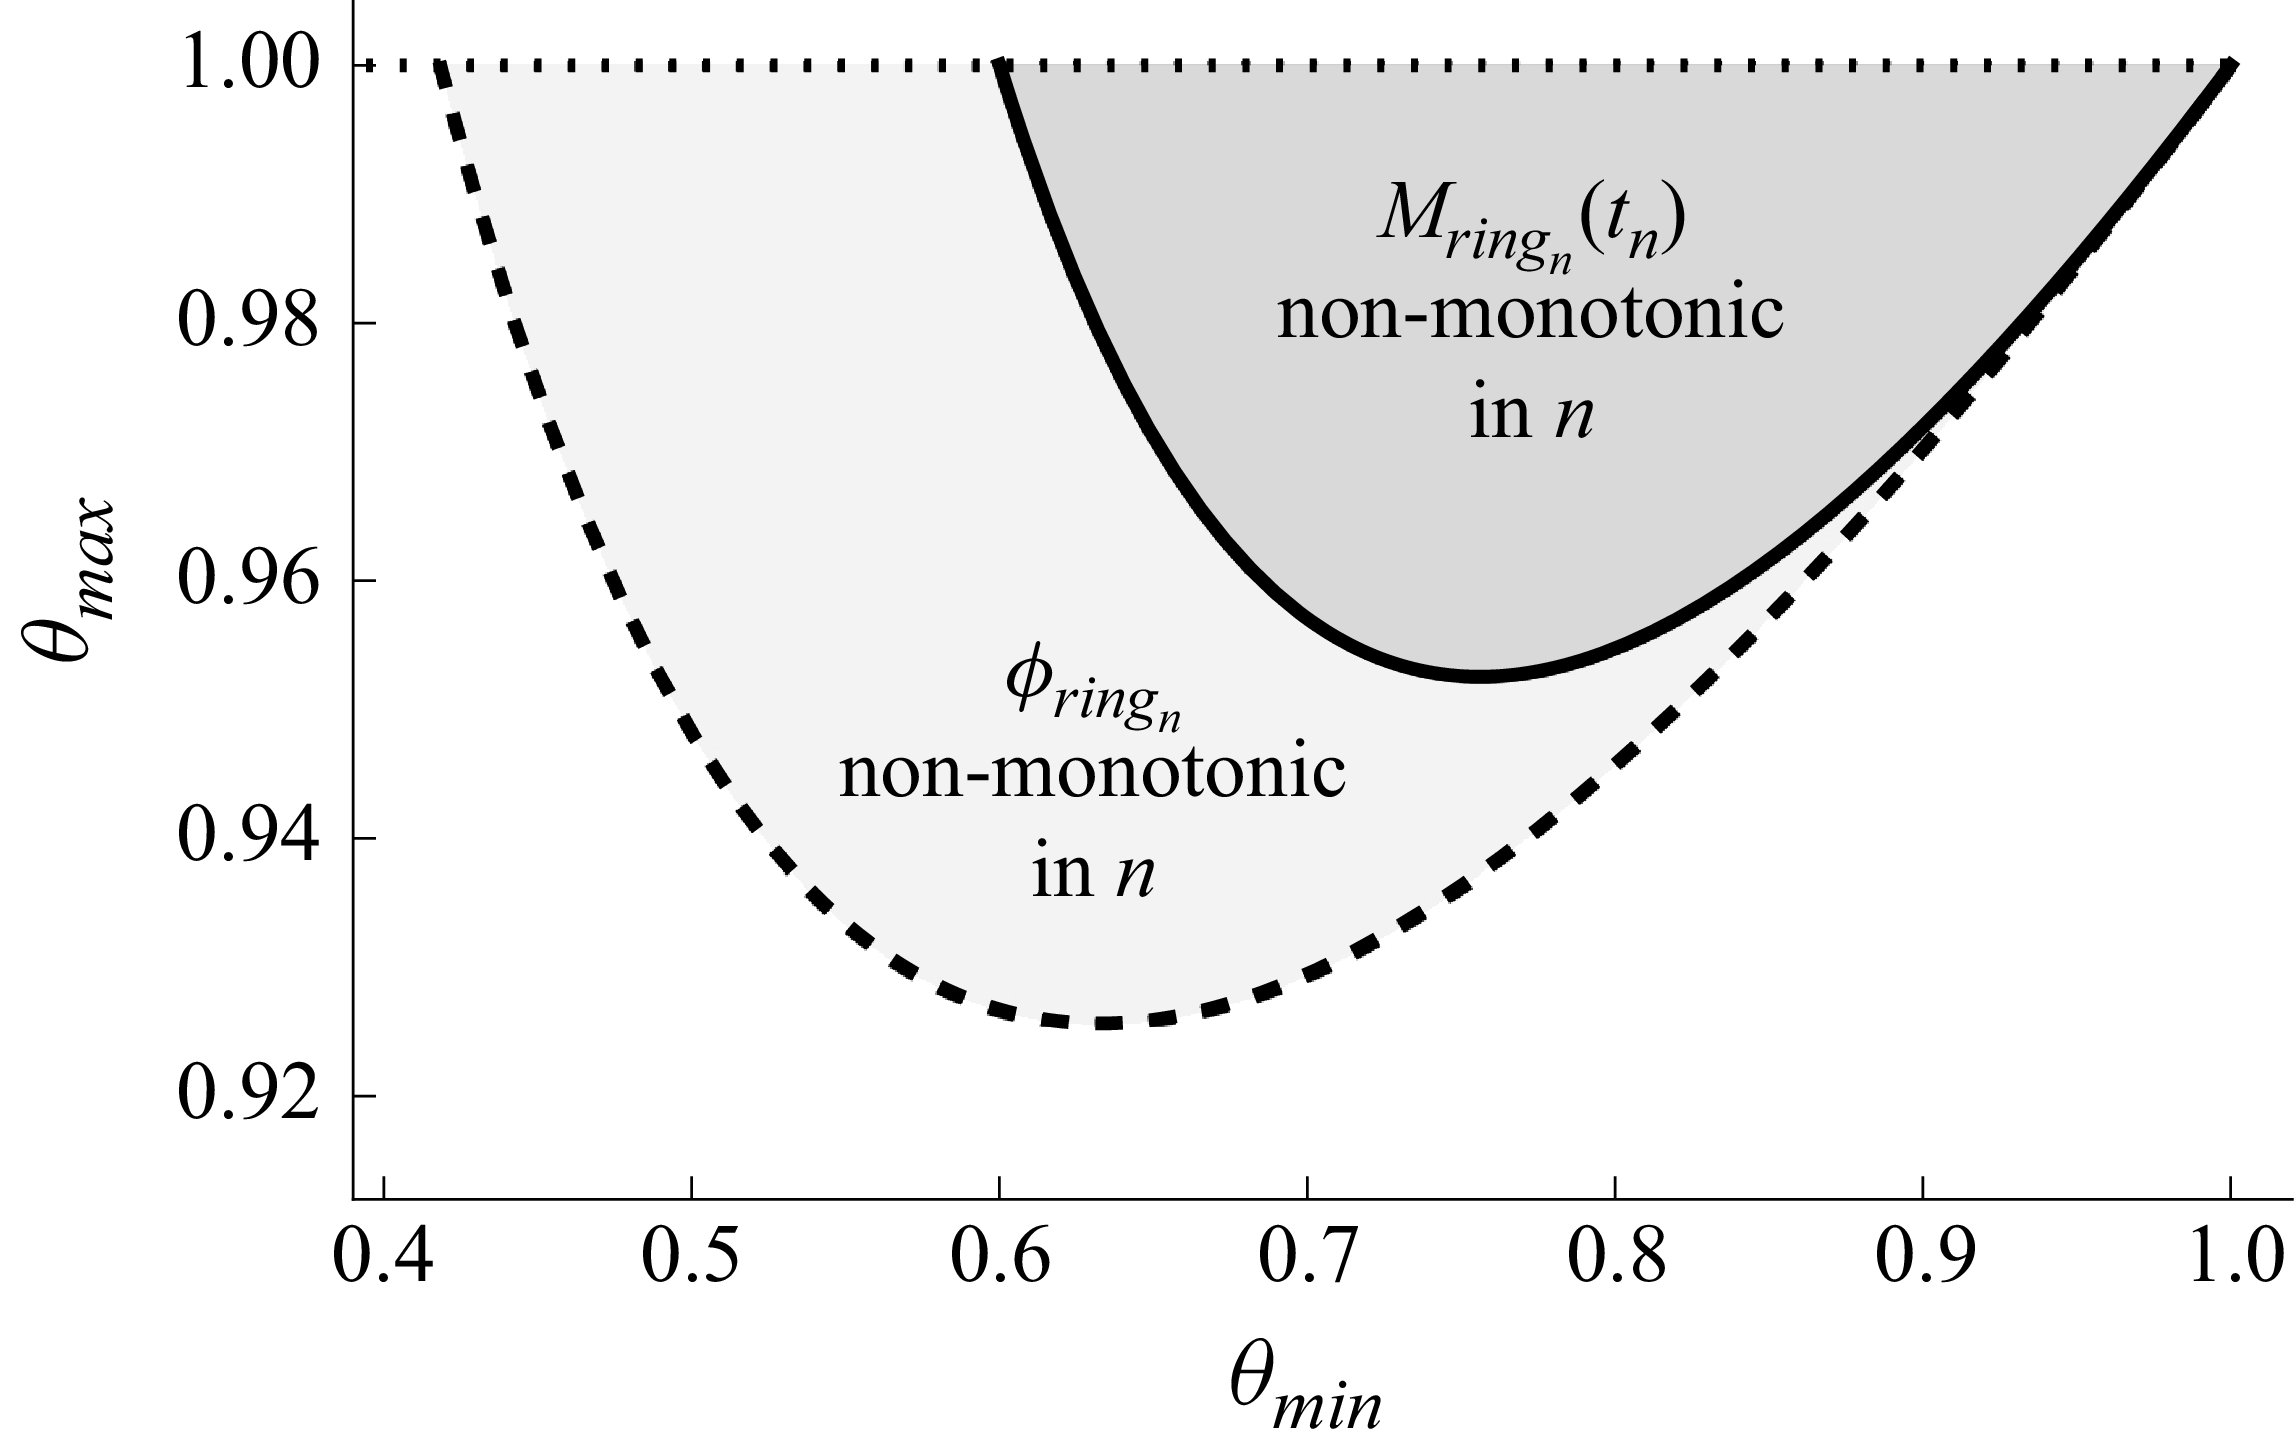


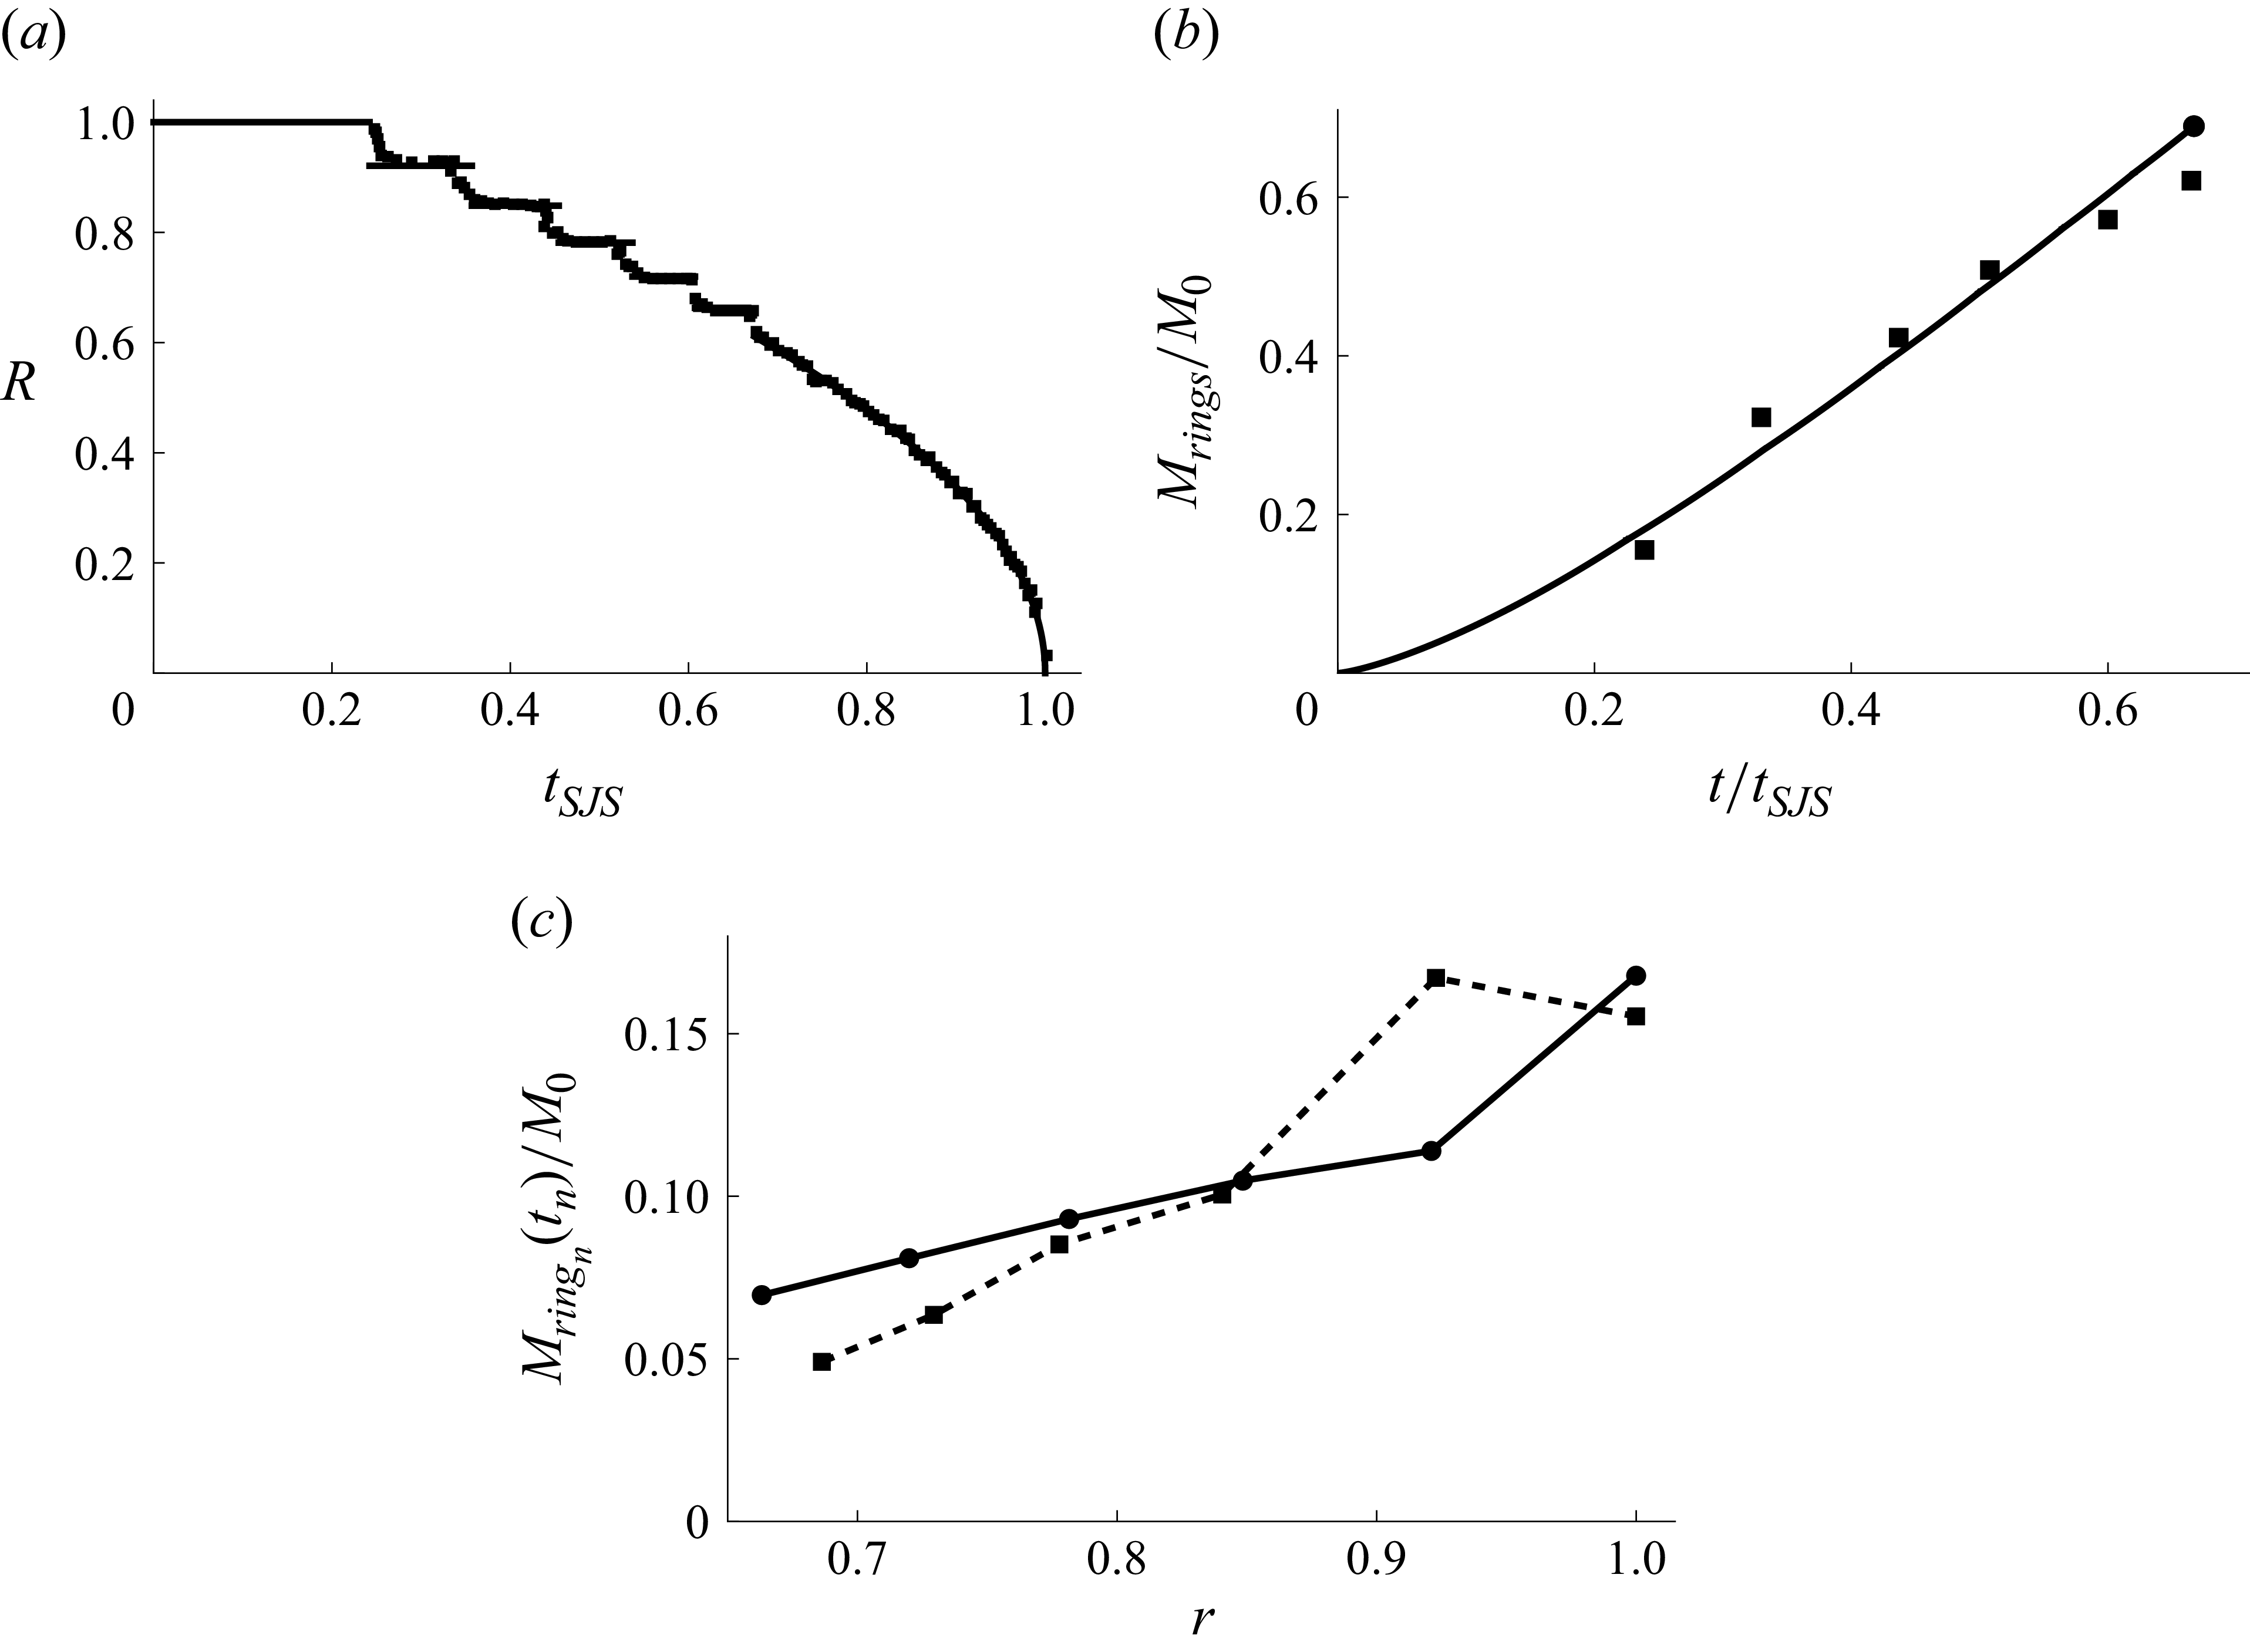


 Open access