


1. Introduction
Recent sociolinguistic work on interspeaker variation has been particularly interested in the social structure of variation – for instance, how gender, socioeconomic class and age predict differences in language use (e.g., Armstrong Reference Armstrong2001; Sankoff & Blondeau Reference Sankoff and Blondeau2007; Meinschaefer et al. Reference Meinschaefer, Bonifer and Frisch2015). However, the degree to which phonological systems may vary across members of a language communityFootnote 1 remains a largely open question. It is often assumed that studying the community is equivalent to studying its members (Tamminga et al. Reference Tamminga, MacKenzie and Embick2016), an assumption implicit in studies that pool all speakers together when investigating variation because those speakers’ grammars are expected not to be meaningfully different from the patterns obtained for the community, and individuals’ behaviour is often intentionally abstracted away from when probing wider variation (Patrick Reference Patrick, Chambers, Trudgill and Schilling-Estes2002; Labov Reference Labov, Celata and Calamai2014).
Blaxter et al.’s (Reference Blaxter, Beeching, Coates, Murphy and Robinson2019) recent work challenges this assumption of functional equivalence. They show that understanding the structure underlying individual variation within a community can offer considerable insight into the constraints on that variation both within the community and in broader typology. Their work further demonstrates that the community grammar may mask the fact that individuals pattern categorically and distinctly, which can be critical information to avoid inferring an incorrect generalisation when seeking to understand the structure of the phonological system(s) at play.
From a theoretical perspective, some types of interspeaker variability are not generally treated as reflecting differences in the grammar. In particular, speakers may vary in the magnitude of an effect without necessarily implying that their grammars are (categorically or meaningfully) distinct. To illustrate with examples, one English speaker’s average vowel duration difference before voiced (e.g., bead) and voiceless (e.g., beet) final consonants may be different from another speaker’s even though both produce longer vowels before voiced final consonants. Similarly, one speaker may be more likely to apply a phonological process in a given context than another speaker, but both speakers apply the phonological process in the same contexts and therefore, in one interpretation of the term, they have the same grammar.
In classical Optimality Theory, grammars are defined as the order of constraints used to evaluate candidates for surface realisations (Prince & Smolensky [1993] Reference Prince and Smolensky2004). More recent adaptations of Optimality Theory introduce probabilistic surface-form production, or constraint weight distributions introduce the potential for grammars to differ with respect to the probabilities of realisation associated with each surface form (e.g., Goldwater & Johnson Reference Goldwater, Johnson, Spenader, Eriksson and Dahl2003; van Oostendorp Reference van Oostendorp2004; Wilson Reference Wilson2006; Hayes & Wilson Reference Hayes and Wilson2008; Coetzee & Pater Reference Coetzee, Pater, Goldsmith, Riggle and Yu2011; Anttila Reference Anttila and Aronoff2018). This conception of the grammar is shared by traditional variationist sociolinguistics; two speakers are understood to share a grammar if the relative ranking of significant predictors by statistical effect sizes (i.e., coefficients or factor weights) is the same for the two speakers, regardless of whether the exact size of those statistical effects varies between them (e.g., Tagliamonte Reference Tagliamonte2006).
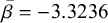
One question that emerges from modelling constraint weights as probability distributions is thus the extent to which individual speakers are best analysed as sharing a (community) grammar (a) when constraint weights (or weight distributions) differ significantly, or (b) when they yield different constraint rankings across speakers, leading to different surface forms being produced with reasonable regularity. Figure 1 illustrates hypothetical contexts where phonologists may want to further probe the notion of a shared community grammar.Footnote 2 In the bottom left panel, speakers cluster around a single mean for each constraint’s weight and the distributions of the weights for each constraint visibly cluster around only that mean. In this case, the rankings are consistent across speakers and, though the specific weights for each constraint vary across speakers, they deviate from a clear community mean. In the top left panel, however, constraint B is bimodally distributed, and we may interpret this pattern as indicating that there are in fact two distributions for B with the community, one clustered around each mode. Regardless, however, the resulting rankings are equivalent, meaning that the output will be consistent across speakers regardless of which subgroup they belong to for the weight assigned to constraint B. The top right panel more closely reflects what the literature would predict us to obtain across speakers in the current study (but with multiple multimodal distributions rather than only one; see §2). In this case, not only would we argue that we have two subgroups for the weighting of constraint B, but these rankings yield distinct outputs because the relative ranking of constraints A and B is not consistent across speakers; sometimes A is ranked higher than B, while at other times B is ranked higher than A. Finally, the bottom right panel shows a case in which the constraints’ distributions are sufficiently wide (i.e., exhibit large enough standard deviations) that speakers will have distinct rankings for constraints A and B even though their weights for each constraint form a single probability distribution across the community. The current study tests whether the top right panel (multiple individual grammars and no clear community grammar) is most accurate for a hallmark case of within-community variation. More broadly, I probe inter-speaker variability to determine (a) to what extent do speakers have distinct grammars, and (b) whether a single community grammar exists given the extreme variability proposed in the literature.
Simulated data illustrating how constraint weight distributions’ modalities (i.e., number of peaks) and standard deviation (i.e., degree of variability) challenge conceptions of shared community grammars.

To address these questions, we investigate a well-known instance of seemingly stable variation found in Laurentian French (also known as Canadian French, Québec French and Québécois; for discussion of terminological considerations, see Côté Reference Côté2012, Reference Côté2020). Laurentian French characteristically features both tense and lax high vowels, with tenseness being fully predictable only in final syllables within the native lexicon (see §2.1).Footnote 3 In non-final syllables, the analysis of tenseness is obfuscated by considerable intra- and inter-speaker variability (e.g., Dumas Reference Dumas1983, Reference Dumas1987; Poliquin Reference Poliquin2006; see §2.2), leading to the proposal that the language community divides into subgroups that happen to have converged on the same small set of distinct grammars.
Considerable work has gone into producing theoretical accounts of the individual grammars that were proposed (e.g., Poliquin Reference Poliquin2006; Fast Reference Fast2008; Bosworth Reference Bosworth2011; Gauthier Reference Gauthier and Luo2013; Hall Reference Hall2016). Unfortunately, these accounts have nearly invariably relied on the perceptual acceptability judgements of 12 speakers collected by Poliquin (Reference Poliquin2006), because high vowels cannot reliably be classified as tense or lax using only one or two acoustic dimensions. On average, but not strictly for any given pair of tokens, lax high vowels exhibit higher F1 and, with some variation, an F2 reflecting a more central position than for tense high vowels (e.g., Arnaud et al. Reference Arnaud, Sigouin and Roy2011; Sigouin Reference Sigouin2013). Cuerrier & Reiss (Reference Cuerrier, Reiss and Vogel2020) notably supplement the perceptual judgements in the literature with some targeted acceptability judgements and elicitations for specific words of interest to confirm hypothesized geminates, for instance with illicite ‘illicit’ as rather than, with gemination of the in addition to the initial being added when deriving from licite ‘licit’. Compounding the limitations imposed by the use of perception (rather than production) from a small set of speakers as the basis for past theoretical accounts, Poliquin’s speaker categories reflect idealised patterns that excluded participants’ responses when they did not conform to those idealised patterns, and therefore do not take into account the variation in speakers’ acceptability judgements.Footnote 4 I resolve the methodological problem of obtaining data for analysis by exploiting automated classification through speaker-adapted forced alignment (see §3.1) to drastically increase the numbers of speakers and tokens available for analysis. On one hand, I show that Poliquin (Reference Poliquin2006) undergenerated speaker grammars relative to the variation I observe. On the other hand, however, speakers’ coefficients for a given predictor of laxing generally fall within a somewhat unimodal distribution at the community level (as in the bottom right panel of Figure 1), indicating that the community grammar is a useful construct for phonologists even in a context where the existence of a single community grammar (with unimodal constraint weights) is in question. The results further suggest that underexplored aspects of the phonological system (particularly prosody) contribute to the conditioning of high-vowel tenseness for many speakers.
2. High-vowel tenseness in Laurentian French
The Laurentian French vowel inventory is shown in Table 1, adapted from Côté (Reference Côté2012), who provides example words for each phoneme.Footnote 5 In addition to the conservation of a large number of vowel contrasts, a characteristic aspect of Laurentian French is the production of both tense and lax high vowels.Footnote 6 As described in §2.1, the tenseness of high vowels is perfectly predictable in final syllables within the native lexicon. However, as shown in §2.2, tenseness in non-final syllables is subject to considerable variation, both within and across speakers. The current study leverages the categorically predictable nature of the final-syllable patterns described in §2.1 to test the phonological processes illustrated in §2.2, while additionally probing the relationship between individual and community grammars for high-vowel tenseness in Laurentian French.
The vowel inventory of Laurentian French, adapted from Côté (Reference Côté2012).

2.1. Tenseness in final syllables
The tenseness of high vowels in final syllables is fully predictable within the native lexicon (e.g., Légaré Reference Légaré1978; Dumas Reference Dumas1983; Walker Reference Walker1984; Poliquin Reference Poliquin2006; Côté Reference Côté2012; Sigouin Reference Sigouin2013; Sigouin & Arnaud Reference Sigouin, Arnaud, Wolters, Livingstone, Beattie, Smith, MacMahon, Stuart-Smith and Scobbie2015), as illustrated in (1). Whereas high vowels consistently surface as tense in open final syllables (as in (1a)), they surface as lax in most closed final syllables (as in (1b)). The apparent exception to closed-syllable laxing is in final syllables closed by a lengthening coda consisting of any of : there is some debate in the literature about whether vowels that undergo lengthening in this context surface as tense (Légaré Reference Légaré1978; Poliquin Reference Poliquin2006), lax (Cuerrier & Reiss Reference Cuerrier, Reiss and Vogel2020), or variable depending on the lengthening consonant (Côté Reference Côté, LeBlanc, Martineau and Frenette2010, Reference Côté2012; Burness et al. Reference Burness, MacLeod, Tahtadjian and Ahn2022). Lengthening contexts will not be a focus of the current study. The reader is referred to Saint-Amant Lamy (Reference Lamy2022) for a thorough investigation of the vocalic system preceding final rhotics (with comparison to other lengthening consonants).

2.2. Tenseness in non-final syllables
In this section, I follow Poliquin’s (Reference Poliquin2006) analysis of high-vowel tenseness in non-final syllables, which is based on perceptual acceptability judgements from 12 speakers, and which has served as the basis for most subsequent theoretical work (e.g., Fast Reference Fast2008; Bosworth Reference Bosworth2011; Hall Reference Hall2016). As illustrated in (2), high vowels are eligible to surface as lax in non-final closed syllables, but the process is optional (unlike in final syllables). Furthermore, high vowels can optionally delete in certain non-final syllables, as in difficile [ʣifsɪl] $\sim $
[ʣɪfsɪl] ‘difficult’; Poliquin (Reference Poliquin2006: 24) argues that this deletion triggers closed-syllable laxing in the initial syllable due to resyllabification of the medial syllable’s onset. We will later return to this context, which I tentatively label as ‘late-closed’ given the characterisation in the literature.Footnote
7
$\sim $
[ʣɪfsɪl] ‘difficult’; Poliquin (Reference Poliquin2006: 24) argues that this deletion triggers closed-syllable laxing in the initial syllable due to resyllabification of the medial syllable’s onset. We will later return to this context, which I tentatively label as ‘late-closed’ given the characterisation in the literature.Footnote
7

High vowels can additionally be sensitive to the tenseness of high vowels in other word-internal syllables. In disyllabic words, for instance, a high vowel in an open initial syllable may undergo laxing if the final syllable is open and contains a phonemically identical high vowel (i.e., if the final syllable contains a tense high vowel), as shown in (3).Footnote 8 Whereas only a limited number of words have the phonological profile for laxing disharmony, laxing harmony can occur in a wider range of words. High vowels in non-final syllables can surface as lax when a high vowel surfaces as lax in a subsequent syllable of the word (Dumas Reference Dumas1983, Reference Dumas1987; Poliquin Reference Poliquin2006). The examples in (4) illustrate the proposed harmony patterns using the terminology from Poliquin (Reference Poliquin2006), followed by the vowel tenseness sequence for ease of reference (where T indicates a tense high vowel, L a lax high vowel and N a non-high vowel).


Although some speakers in Poliquin’s data accepted no pronunciations with harmony (the pattern in (4a)), two main patterns emerged for the majority of speakers. Speakers may allow only the initial syllable to harmonise in tenseness with the final syllable (leaving intervening vowels unaffected, as in (4b)), or they may apply harmony right-to-left from the last syllable as in (4c)–(4e). Among speakers with local harmony, some do not apply harmony iteratively; for them, only the penult is a possible target for laxing harmony, as in (4c). Finally, speakers who do apply harmony iteratively vary with respect to the role of intervening non-high vowels (i.e., neutral vowels, which lack the [+high] specification required to participate in harmony, such as the /e/ in inédite /inedit/ ‘unpublished.fem’). For some speakers, these neutral vowels block laxing harmony as in (4d), making them phonologically opaque. For other speakers, these neutral vowels are transparent to laxing harmony, and thus are ignored when determining whether laxing harmony can apply to an earlier vowel, as in (4e).Footnote 9
3. Methods
The current study investigates (a) which grammars successfully predict high-vowel tenseness in Laurentian French at the individual level, and (b) how individual grammars relate to the grammar(s) of the community (i.e., across speakers). To address these two topics, we require a large source of data in terms of both number of speakers and number of tokens per speaker; otherwise, we may not have critical tokens to determine a speaker’s harmony pattern or we may not have enough tokens to estimate the relative contributions of factors affecting high-vowel tenseness. Furthermore, we must be able to classify high vowel realisations as tense or lax in an efficient way. These two first aspects of the study are described in §§3.1 and 3.2, respectively. §3.3 then describes the methods used to create individual grammars (i.e., statistical models for each speaker), which will be analysed at the community and individual levels.
3.1. Data source
The data examined in the current study were drawn from Milne & Lamontagne (Reference Milne and Lamontagne2016), which comprises two sources. The first is the political debates of the Assemblée nationale du Québec (National Assembly of Quebec) from May 2011 (Assemblée nationale du Québec 2011, henceforth ANQ; for details about data preparation, see Milne Reference Milne2014). The ANQ contributes approximately 60 hours of speech from 105 different speakers. While all speakers provided training data (see below), 45 did not provide any words with high vowels in non-final syllables. Only the remaining 60 speakers from this first corpus are therefore included in the analysis of tenseness in non-final syllables, though the full 105 were included during acoustic model training and testing.
The second corpus is compiled from the spontaneous speech collected in eight survey locations from the Laurentian sub-corpus (Côté Reference Côté, Durand, Kristoffersen and Laks2014; Côté & Saint-Amant Lamy Reference Côté, Lamy, Pustka, Berghe and Weiland2023) of the Phonologie du français contemporain corpus (Durand et al. Reference Durand, Laks, Lyche, Pusch and Raible2002, henceforth PFC), providing data from communities in the Canadian provinces of Quebec (Chelsey, Montreal, La Pocatière, Pointe-Fortune, Quebec City, Saguenay, Trois-Rivières) and Ontario (Hawkesbury), in addition to data from speakers from multiple regions surveyed at Laval University in Quebec City.Footnote 10 In total, the PFC contributed approximately 60 hours of speech from 71 speakers.Footnote 11 All 71 PFC speakers contributed data for tenseness in non-final syllables.
These two corpora cover a range of types of speech (including read comments; prepared speeches made in a professional setting; conversations with a member of the corpus collection team; and conversations with friends or family) and speaker social demographics (region, age, gender, profession). Dumas (Reference Dumas1987) posits from impressionistic observations that these sociolinguistic factors do not predict speakers’ individual grammars, and preliminary analysis of the data (Lamontagne Reference Lamontagne2021b) confirms that speaker patterns varied across and within survey locations in the PFC sub-corpus;Footnote 12 that neither age nor gender was predictive of patterns; and that there was no significant difference across speakers between guided and unguided conversations (i.e., between those led by a member of the corpus collection team and those where the interlocutor was a person already known to the speaker). Lamontagne (Reference Lamontagne2021b) further suggests from the overlapping patterns between corpora that the corpora do not evidently pattern differently with respect to the application of high-vowel laxing in non-final syllables. Data from both corpora were consequently grouped together for the analysis, yielding a corpus of about 120 hours of speech, particularly because increasing the number of tokens improves the generalisability of acoustic representations for model training. However, I restrict in-depth discussion to grammars that were obtained for at least one PFC speaker, in case stylistic variation between the two corpora plays a role in our presentation of the results on speaker grammars (§4.2.2).
3.2. Data classification
Classification of tenseness was automated by adapting the SPLAlign forced aligner (Milne Reference Milne2014).Footnote 13 The aligner considers the full spectrum (but not segment duration) to perform segmentation, which avoids the pitfalls of relying on one or two individual acoustic measures to classify high-vowel tenseness (e.g., Arnaud et al. Reference Arnaud, Sigouin and Roy2011; Sigouin Reference Sigouin2013), and which allows classification of a far larger number of tokens than would feasibly be coded manually – and with higher accuracy than has been obtained from acoustic classification in the previous literature. Furthermore, the forced aligner adapts to acoustic differences between speakers such as may arise from different vocal tract sizes or from differences in the articulatory implementation of the tenseness distinction (as observed by Dalton Reference Dalton2011; Dalton & Mielke Reference Dalton and Mielke2013).
In total, 48,357 tokens of final-syllable high vowels in native French words – where tenseness is categorically predictable (see §2.1) – were used to train aligner models on the tense–lax distinction. The aligner achieved 87.56% accuracy on test items (20% of the data not used for training), and when classification is trained on alternating subsets of 80% of the data and tested on the remaining 20%, accuracy reaches up to 91%. These values were computed for the initial alignment training on the corpus under analysis, but underestimate the accuracy of the aligner itself for two reasons. First, the test data were set up to be maximally unlikely to be correctly coded in a way representative of typical aligner use (e.g., using a language model distributed online or amongst colleagues trained on other data, with no explicit retraining of acoustic models to improve accuracy). The 20% of the data in the test set therefore primarily included speakers on which the aligner had not been trained and for whom it would therefore often be least accurate. Second, the accuracy ratings preliminarily include tokens of high vowels in final syllables ending in a lengthening coda (based on earlier goals for testing this alignment method; see Milne & Lamontagne Reference Milne and Lamontagne2016), which is a context where high-vowel laxing exhibits variation (for lengthening consonants in general, see, e.g., Lamontagne et al. Reference Lamontagne, Owens, Rosychuk, Villeneuve and Zamarlik2024; for pre-rhotic vowel variation in particular, see Saint-Amant Lamy Reference Lamy2022).
Lamontagne et al. (Reference Lamontagne, Owens, Rosychuk, Villeneuve and Zamarlik2024) employed similar methods for training the aligner to classify the tenseness of lengthened high vowels. However, they strictly evaluated accuracy on the same speakers who were used for training, unlike the above benchmark (Milne & Lamontagne Reference Milne and Lamontagne2016, who sought to test the potential of the models for classifying the tokens of new speakers). They additionally excluded lengthened high vowels (i.e., those before lengthening codas, where variation occurs) for their verification of aligner classification accuracy in a corpus of spontaneous Laurentian French in televised interviews on two Radio-Canada programmes, achieving 96% accuracy at predicting the expected tenseness category in the final syllable of native French words.
The aligner was then leveraged to classify the tenseness of high vowels in non-final syllables, with the option of classifying each one as tense, lax, or deleted, as in Table 2 (for type and token counts by syllable type relevant to the harmony patterns described in §2.2, see Table 3).Footnote 14 As an additional indicator of reliability, preliminary data exploration confirmed that the trends for the first two formants (higher F1 for lax vowels compared to tense ones; variable trend for more central F2 for lax vowels compared to sentence ones; both cues indirectly available to the aligner during classification) and for duration (lax high vowels tend to be shorter than tense ones, which represents a cue not used by the aligner to determine tenseness classification) reflect patterns from perceptual coding of high-vowel tenseness in the literature (see Milne & Lamontagne Reference Milne and Lamontagne2016). Across the 131 speakers in the sample, we obtain 25,483 tokens of non-deleted high vowels in non-final syllables. There is a median of 152 tokens and an average of 194.7 tokens per speaker, with an interquartile range of 37.5 to 266.5.
Possible aligner outputs for /ilymin/ illumine ‘illuminate’.

Distribution of individual tokens and unique types by syllable position, in addition to the number of speakers having at least one token in that syllable position for that word length. The values presented only include non-deleted tokens (i.e., those that surfaced as either tense or lax and therefore are included in the current analysis).

3.3. Statistical models
The present analysis employs three main sets of statistical techniques to better understand the structure of the language community. First, drawing on predictors informed by the literature on high-vowel laxing in Laurentian French (§3.3.1), Bayesian mixed-effects logistic regression were computed for each speaker to determine their individual grammar (§3.3.2). Second, in order to understand the community grammar, I then employ descriptive statistics aimed at understanding the contributions of each predictor across speakers and the relations between different predictors at the community level (§3.3.3). Third, as described in §3.3.4, I finally perform clustering on the grammars inferred by our regression models to infer the distinct grammars within the community as well as to gain insight into their relative prevalence. §3.3.5 then summarises the series of analyses employed in the current study.
3.3.1. Independent variables
The predictors chosen for analysis were primarily drawn from Poliquin’s (Reference Poliquin2006) original proposal for possible speaker patterns, in addition to including prosodic factors based on the hypothesis that the reason penults and initial syllables pattern distinctly is that penults are in foot-dependent position and initial syllables are assigned a secondary ‘stress’ (Armstrong Reference Armstrong1999; Poliquin Reference Poliquin2006). These factors were further confirmed to be relevant using a random forest analysis (for the preliminary analyses, see Lamontagne Reference Lamontagne2021a,Reference Lamontagneb). Random forest analysis (i.e., random decision forests) is a statistical technique that creates decision trees – essentially flow charts that, in this case, try to determine whether a given token is more likely to be tense or lax. This allows the researcher to select the predictors that may condition a dependent variable, but without presupposing which (if any) interactions are present, and while including predictors that may be correlated or that may have no effect. This method has the benefit of reducing the risk of overfitting relative to decision trees because, when applied for regression tasks, it takes the average prediction across all trees computed. In this case, the goal was to confirm which predictors should be included in the mixed-effects regression models by determining which ones had a significant effect and, in particular, which interaction terms to include.
I consider seven main predictors alongside three interactions: whether the token is in the initial syllable, whether it is in the penult, whether the token is an odd-numbered syllable from the start of the word (parity from the left), whether the token is an odd-numbered syllable from the end of the word (parity from the right), whether the final syllable contains a lax high vowel, whether the following syllable contains a lax high vowel, and what the rhyme shape is (open, closed or late-closed).
This model structure crucially enables us to assess harmony patterns in the literature in addition to those suggested by random forest analysis in preliminary work (Lamontagne Reference Lamontagne2021a):

The remaining predictors in the analysis were to test the behaviour of high vowels in word-initial syllables and penultimate syllables.
3.3.2. Speaker-level models
I employ Bayesian mixed-effects logistic regression using the blme package (Chung et al. Reference Chung, Rabe-Hesketh, Dorie, Gelman and Liu2013) in R (R Core Team 2021), for which each speaker’s model is individually computed with random intercepts for words, and for which all predictors were assigned weakly informative priors. Bayesian regression was selected over frequentist regression because Bayesian regression typically provides smaller prediction errors when applied to smaller sample sizes in previous work (e.g., Celeux et al. Reference Celeux, El Anbari, Marin and Robert2012). The inclusion of Bayesian models is further motivated by the objective of comparing speaker grammars independently from potential (statistical) influence of others speakers’ patterns: coefficients for each speaker are not pulled towards a community norm, because the prior distribution was an uninformative one (all outcomes were treated as equally likely a priori). The use of mixed-effects models in particular additionally allows words to vary through the use of random intercepts. This is useful in cases where a single lexical item exhibits idiosyncratic patterns either for an individual speaker or more broadly.
I elected to compute individual models rather than to have by-speaker random slopes for two main reasons, drawing on Bell et al. (Reference Bell, Fairbrother and Jones2019). First, random effects are assumed to fit a normal distribution, which is not expected for these data if Poliquin’s (Reference Poliquin2006) proposal is correct. Second, random effects are subject to shrinkage; their range is compressed because they are modelled as parameters being abstracted from (i.e., other values are possible and may be obtained in future work) rather than parameters for direct interpretation (as is the care here, since speakers’ individual patterns will be analysed). In total, 113 speakers had converging models and so are included in the current analysis.
3.3.3. Analysis of community patterns
A central question for the current study is whether different native learners acquire distinct systems, perhaps with some statistical noise such that the exact rates of laxing differ. To investigate this, I apply four metrics to the coefficients obtained from speakers’ regression outputs (§3.3.2): the consistency of a predictor’s effect, the normality of the distribution of coefficients, the modality of the coefficients, and the correlation between predictors. I discuss each metric at greater length in the appropriate section of the results for ease of reference, but will here provide an overview of the motivation for considering the metric.
First, I probe the consistency of a predictor’s effect. While two speakers may differ in how strongly a factor like the syllable being closed predicts high-vowel laxing, for instance, we are interested in the extent to which this effect is found (regardless of effect size, i.e., coefficient absolute value) across participants. If speakers consistently favour laxing in this context, even if at different rates, it is reasonable to generalise this across speakers (i.e., to the community), and it would be expected that a learner would acquire a closed-syllable laxing rule regardless of who that learner interacted with. This first metric will be determined primarily based on the mean and standard deviation of model coefficients as well as by visual inspection of violin plots that depict the distribution of coefficients.Footnote 15
Second, I consider the normality of the distribution of coefficients – in other words, whether we appear to have a Gaussian distribution (i.e., a normal distribution or ‘bell curve’) for predictor coefficients across speakers. Figure 1 and the surrounding discussion illustrate the importance of this consideration. If the distribution is not Gaussian, two main outcomes may apply. One is that some speakers may have extreme patterns that skew in one direction. For instance, if most speakers exhibit a weak preference for closed-syllable laxing, but then an important subset has increasingly extreme coefficients, such that they either especially favour closed-syllable laxing or instead tense in that context. The other is that speakers are better described as having substantially different targets, which may yield categorically different surface forms (the top-right panel of Figure 1) or not (the top-left panel of Figure 1). Normality is tested using p-values for the Shapiro–Wilk test, which indicates how unlikely data are to fit a Gaussian distribution. These p-values are accompanied by visualisations through Q–Q plots, which plot predicted (x-axis) and actual (y-axis) quartiles against each other in the data, such that a straighter line indicates a more normal distribution.
Third, I examine the unimodality of the distribution of coefficients across speakers. This is a more direct investigation of the second possibility described for non-normality. In other words, it evaluates the likelihood that speakers are not simply exhibiting differences in overall laxing rates, but crucially that their grammars have different targets altogether in their input. Modality will be tested through Hartigan’s dip test, which indicates confidence that a distribution is not unimodel, and is visualised through the violin plots used for the first metric.
Fourth, I verify the correlations between predictors’ coefficients. This test draws directly on Poliquin’s (Reference Poliquin2006) proposal that speakers acquire one – and only one – type of laxing harmony. If this were true, there should be a significant negative correlation between the coefficients for (a) the interaction between a final syllable containing a lax high vowel and the token being in the penult (i.e., local non-iterative harmony) and (b) the interaction between a final syllable containing a lax high vowel and the token being in the initial syllable (i.e., non-local harmony). In other words, having one harmony pattern should predict not having another. These correlations are visualised in scatterplots (one set of factor coefficients against the other), accompanied by Spearman’s rank correlation coefficients and significance, which indicate whether a change in one coefficient predicts the other coefficient changing in a predictable direction.
3.3.4. Clustering analysis
Following from the goal of evaluating the degree of within-community uniformity in grammars for tenseness, the current study also seeks to determine whether the language community exhibits variation whereby its sub-groups of speakers exhibit categorically distinct grammars, as proposed by Poliquin (Reference Poliquin2006). To investigate this possibility, I employ clustering using affinity propagation (Frey & Dueck Reference Frey and Dueck2007), which groups speakers based on their coefficients in our regression models, using the apcluster package in R (Bodenhofer et al. Reference Bodenhofer, Kothmeier and Hochreiter2011). Affinity propagation generally performs better than alternative methods like k-means clustering and expectation-maximization algorithms, with the added benefit that it does not require the number of clusters be prespecified (Frey & Dueck Reference Frey and Dueck2007). Affinity propagation functions by finding ‘exemplars’ – in this case, speakers representative of a grammar – and determining which other speakers form a cluster with them (i.e., determining which groups of speakers share a grammar). This method has the additional advantage of limiting the risk of outliers’ overly affect clustering, because it allows clusters to have only one member.
3.3.5. Summary of analysis
In summation, I use Bayesian mixed-effects logistic regression to evaluate individual speakers’ production of high vowels in non-final syllables, classified as tense or lax using a forced aligner trained on high vowels in final syllables. I then use the coefficients derived from those models to evaluate how cohesive the community patterns are overall, as well as whether there is preliminary evidence for speakers acquiring one possible harmony pattern to the exclusion of others. Finally, I infer clusters of speakers that share grammars, in order to better understand the grammars that coexist within the dialect.
4. Results
The current study probes the structure of variation within the community, crucially testing how speakers vary relative to their community and whether they exhibit categorically distinct grammars of high-vowel tenseness. We will first examine the distribution of predictor coefficients across the community (§4.1) to determine the extent to which the community superficially forms a cohesive unit and the extent to which the community-level patterns suggest a single target grammar rather than multiple grammars in a pooled analysis. I then investigate how best to characterise individual speakers’ grammars and further test whether speaker grammars truly fall into distinct groups (§4.2). For reasons of space, full model outputs are provided as Supplementary Material.
4.1. Community variation
The distribution of coefficients enables us to infer whether we should generalise a phonological pattern from a subset of speakers, thereby describing it as a rule or pattern observed for the broader community. The alternative is that the community is fundamentally heterogeneous, as would be the case if Poliquin (Reference Poliquin2006) is correct that speakers within the community exhibit different harmony systems. To probe this issue, I will analyse how consistently predictors of laxing have a detectable effect across speakers (§4.1.1); how normally distributed the coefficients are across speakers (§4.1.2); and whether there appears to be a single dominant pattern across speakers or instead speakers are superficially behaving like they form distinct groups (§4.1.3). Finally, I summarise general conclusions about the cohesion of the community in §4.1.4. The statistical parameters are summarised in Table 4.

4.1.1. Effect consistency
The Bayesian mixed-effects models (coefficient distributions illustrated in Figure 2) offer an indication of speaker variation across the language community that is not biased by other speakers’ patterns. We find standard deviations of coefficients across speakers that are generally sufficiently large that they eclipse the mean coefficient. In other words, speakers’ coefficients may be positive (favouring lax) or negative (favouring tense) for factors, yielding categorically different phonological interpretations for different speakers. Effect consistency results are consistent with previous descriptions that grammars are distinct across speakers, as observed impressionistically by Dumas (Reference Dumas1983, Reference Dumas1987) and as proposed based on perceptual data by Poliquin (Reference Poliquin2006). However, visual inspection of Figure 2 suggests that the community may be functioning more as a unit than expected: the coefficient distributions appear to be relatively normal (though not completely normal; see §4.1.2), making it less likely that speakers have acquired categorically distinct targets.
Violin plot showing the distribution of speaker coefficients for Bayesian mixed-effect model predictors (facets). The wide horizontal line in red depicts a coefficient of zero (i.e., no effect); positive values favour lax realisations, while negative values favour tense realisations. The median coefficient is identified using the narrow blue line.

4.1.2. Normality
Normality (conformity to a Gaussian distribution) provides evidence for the community acting as a single unit, with inter-speaker variation attributable not to fundamentally distinct grammars as a macro level, but to statistical noise (such as might be modelled by differences in constraint weights in OT). The p-values for the Shapiro–Wilk test (Table 4) reveal evidence for non-normal distributions across the community in many factors, suggesting that preliminary visual inspection overestimates the degree of normality observed (likely as a result of plausible unimodality, as discussed in §4.1.3). Another common tool for evaluating normality is Q–Q plots (Figure 3), in which normal distributions form straight lines because the expected (x-axis) and obtained (y-axis) values linearly predict each other.
Q–Q plot of coefficients’ distribution. A relatively linear distribution in a facet is indicative of a more normal distribution of coefficients for that facet’s predictor.

Speakers are distributed non-normally in the adjusted mean (intercept; $p<0.0001$
) as shown by the exceedingly low intercepts for some speakers in Figure 2 and confirmed, for illustrative purposes, by the curvature in Figure 3. We further observe that the intercept is what differs most in size across speakers (
$p<0.0001$
) as shown by the exceedingly low intercepts for some speakers in Figure 2 and confirmed, for illustrative purposes, by the curvature in Figure 3. We further observe that the intercept is what differs most in size across speakers ( $\bar {\beta}=-3.3236$
;
$\bar {\beta}=-3.3236$
; $\sigma =2.9171$
), indicating a large difference in baseline laxing preference across the community. Other predictors for which significantly non-normal distributions are observed are: whether the token is in the initial syllable (
$\sigma =2.9171$
), indicating a large difference in baseline laxing preference across the community. Other predictors for which significantly non-normal distributions are observed are: whether the token is in the initial syllable ( $p=0.0386$
); whether the token is in a closed syllable (
$p=0.0386$
); whether the token is in a closed syllable ( $p<0.0001$
); whether the token is in an odd-numbered syllable from the left (
$p<0.0001$
); whether the token is in an odd-numbered syllable from the left ( $p<0.0001$
) or right (
$p<0.0001$
) or right ( $p<0.0001$
); and whether the final syllable contains a lax high vowel (
$p<0.0001$
); and whether the final syllable contains a lax high vowel ( $p<0.0001$
), in addition to a marginal result suggesting that speakers pattern differently when the token is an initial syllable in a word with a lax high vowel in the final syllable (
$p<0.0001$
), in addition to a marginal result suggesting that speakers pattern differently when the token is an initial syllable in a word with a lax high vowel in the final syllable ( $p=0.0896$
). Whereas the coefficients for local harmony seems to be relatively uniformly distributed (
$p=0.0896$
). Whereas the coefficients for local harmony seems to be relatively uniformly distributed ( $p=0.7780$
), the results suggest lower confidence in the potential uniformity of final syllable’s effects on the penult (
$p=0.7780$
), the results suggest lower confidence in the potential uniformity of final syllable’s effects on the penult ( $p=0.2033$
) and the effects of final syllables on odd-numbered syllables from the right (
$p=0.2033$
) and the effects of final syllables on odd-numbered syllables from the right ( $p=0.3043$
). In other words, the cases are somewhat more bimodal or have long tails (depending on the factor), as supported by Figures 2 (distribution) and 3 (curvature).
$p=0.3043$
). In other words, the cases are somewhat more bimodal or have long tails (depending on the factor), as supported by Figures 2 (distribution) and 3 (curvature).
In summary, speakers do not consistently fall on a normal distribution for predictors. The next section tests this question further, in light of the fact that the limited size of the dataset may influence significance, and normality is sensitive to parameters like skew that are of less interest to our central question for this portion of the analysis. If the community grammar does not reflect a single shared norm or represent a single shared target for acquisition, the distribution should exhibit more than one mode (as in the top panels of Figure 1).
4.1.3. Modality
If the speakers across the community form a multimodal distribution, we have strong evidence that the community does not form a cohesive unit, but rather contains multiple distinct grammars (recall Figure 1) as expected under Poliquin’s (Reference Poliquin2006) account. To evaluate modality, I perform Hartigan’s dip test (Hartigan & Hartigan Reference Hartigan and Hartigan1985) implemented in R using the diptest package (Maechler Reference Maechler2021). In this test, the p-value indicates the confidence in rejecting the null hypothesis that a distribution is unimodal. We find that the p-values for the unimodality of coefficient distributions differ considerably across predictors, but we can reject unimodality for no predictor with confidence (Table 4). This conclusion accords with what we observe in Figure 2. In other words, these results are more consistent with the bottom two panels in Figure 1, where the language community functions as a more (left panel) or less (right panel) cohesive unit when we consider individual predictors’ effects across speakers.
In particular, the predictors most likely to have two separate targets are generally not predictors capturing harmony. Instead, speakers are most likely to have distinct target phonological conditioning for whether syllables that are followed by a syllable in which the underlying high-vowel nucleus was deleted (‘late-closed’) favour laxing or not (e.g., difficile ‘difficult’ /difisil/ being realised as [ʣif $\emptyset $
sɪl]
$\emptyset $
sɪl] $\sim $
[ʣɪf
$\sim $
[ʣɪf $\emptyset $
sɪl], or certificat ‘certificate’ /sɛrtifikɑ/ as [sɛʁʦif
$\emptyset $
sɪl], or certificat ‘certificate’ /sɛrtifikɑ/ as [sɛʁʦif $\emptyset $
kɑ]
$\emptyset $
kɑ] $\sim $
[sɛʁʦɪf
$\sim $
[sɛʁʦɪf $\emptyset $
kɑ]).Footnote
16
This may reflect a syllable structure effect, or, because the deleted vowel was necessarily a high vowel, it may indicate that speakers apply opaque harmony in which the triggering vowel is deleted (see §5.2.3 for discussion).
$\emptyset $
kɑ]).Footnote
16
This may reflect a syllable structure effect, or, because the deleted vowel was necessarily a high vowel, it may indicate that speakers apply opaque harmony in which the triggering vowel is deleted (see §5.2.3 for discussion).
4.1.4. Summary of community-level comparisons
Examining both the consistency of effects (favouring vs. disfavouring) and the distribution of coefficients (as illustrated in Figure 1) allows us to evaluate how cohesively a community behaves in terms of phonological conditioning of laxing. While we find that speakers vary considerably within the community, we find superficial evidence for community-level phonological targets. In the following section, I examine the behaviour of individual speakers to determine whether their grammars vary categorically when analysed independently.
4.2. Individual grammars
I turn to speakers’ individual grammars. Recall that Poliquin (Reference Poliquin2006) proposes that individual speakers infer only one harmony system amongst four possibilities if they acquire harmony: (a) local iterative harmony with neutral intervening vowels being transparent; (b) local iterative harmony with a final-syllable high vowel with neutral intervening vowels being opaque; (c) non-local harmony; or (d) local non-iterative harmony. In §4.2.1, I test whether harmony systems are truly anti-correlated with one another within the community – in other words, whether speakers acquire one harmony system to the exclusion of other patterns. In §4.2.2, I probe which systems speakers have acquired and whether the speaker profiles proposed by Poliquin are supported by production data from a larger sample of speakers.
4.2.1. Exclusivity of harmony systems
I first examine whether speakers treat harmony patterns as mutually exclusive alternatives, and thus acquire only one harmony system, as proposed by Poliquin (Reference Poliquin2006). To do this, I test correlations between predictor coefficients: if speakers acquire one pattern to the exclusion of others, coefficients should be negatively correlated (i.e., an increase in one coefficient should predict a decrease in other coefficients). If, on the other hand, speakers acquire these harmony patterns independently, then there should be no strong correlation. This is the pattern predicted by a learning algorithm in which redundant solutions producing the same output are all permitted – but not favoured – by forms generating that output.
I illustrate and quantify correlations using the PerformanceAnalytics package in R (Peterson & Carl Reference Peterson and Carl2020), producing Figure 4. Crucially, between-predictor correlations are rarely significant (p-value; asterisks in top right), and are limited in size (absolute value of correlation size; numbers in top right and angle of line in bottom left).Footnote 17 In other words, it is not evident that learners acquire one harmony system to the exclusion of others; native learners may acquire multiple systems (as will be discussed in §5.1.1). The marginally significant anticorrelation between initial and penultimate syllables’ conditioning from the final syllable containing a lax high vowel gives some credence to the proposal that at least some speakers treat harmony patterns as alternatives to each other, however (here non-local harmony and local non-iterative harmony, respectively).
Correlation matrix for the coefficients of harmony predictors. Along the descending diagonal, histograms are plotted with the associated density plot overlain, giving an overview of the distribution of coefficients across speakers. A scatter plot illustrates the relationship between the two associated predictors (column and row) in the bottom left, while the corresponding cell in the top right shows Spearman’s rank correlation coefficient for that pair of predictors alongside the significance level.

4.2.2. Speaker profiles
While we have examined the extent to which the language community appears to be cohesive at the macro level (i.e., when looking at coefficient distributions across speakers; §4.1) and the extent to which speakers acquire one harmony system to the exclusion of others (§4.2.1), I have not yet directly described the grammars that emerge from these results. My analysis reveals 17 clusters across 113 speakers, of which 6 clusters consist of a single exemplar whose pattern could not be generalised to other speakers (i.e., the speaker effectively has a grammar that appears to be unique within the dataset, which may be because of distinct grammars or sparseness of critical data). As signalled in §3.2, this section focuses on clusters containing PFC speakers to minimise the risk that stylistic differences between corpora affect high-vowel laxing patterns in non-final syllables. Table 5 presents the clusters containing at least one PFC speaker, and a counterpart to Table 5 including all clusters and speakers is provided in the Supplementary Material. A first observation consistent with Dumas’s (Reference Dumas1983; Reference Dumas1987) intuitions is that variation in high-vowel laxing in non-final syllables is found within and across regions.
Clusters labelled by the exemplar speaker (selected by the clustering function) and the list of speakers in the cluster.

Summary of the phonological conditioning of high-vowel tenseness for each exemplar with more than one speaker (see Table 5 for lists of speakers grouped with each exemplar).

Coefficients for clusters containing more than one speaker, grouping facets by predictor.

Coefficients for clusters containing more than one speaker, grouping facets by cluster.

Probing the clusters further, we can infer several core patterns (see Table 6), of which I will focus on a few.Footnote 18 I illustrate the coefficient distributions associated with clusters in Figures 5 (facets for predictors) and 6 (facets for clusters).Footnote 19 Of particular interest for our purposes is the degree to which variation is observed across clusters and, crucially, how speakers in different clusters exhibit analytically distinct grammars. For instance, we find the patterns described by Poliquin (Reference Poliquin2006) in clusters cqell1 (non-local harmony), cqams1 (local non-iterative harmony), ANQ007 (local iterative harmony with opaque neutral vowels) and cqbdb1 (local iterative harmony with transparent neutral vowels), illustrated in (6) with examples from the corpus.Footnote 20

However, we further observe that speakers exhibit patterns beyond this range, in addition to some exhibiting more than one harmony pattern. A more detailed examination of clusters reveals that the literature undergenerates grammars relative to what we observe at the individual (and cluster) level. For instance, clusters like ANQ016’s and cqfdb1’s display disharmony rather than harmony, suggesting that speakers may have generalised from words like ici /isi/ [ɪsi] ‘here’ and suffit /syfi/ [sʏfi] ‘suffice.3sg.pres’ (both cqaab1), in which laxing can occur in the initial syllable and not in the final syllable, to other contexts, as in université /ynivɛrsite/ [ʏnivɛʁsite] ‘university’ and sécurité /sekyrite/ [sekʏʁite] ‘security’ (also both cqaab1).
We additionally observe a pattern suggestive of a reinterpretation of harmony whereby foot structure plays a role, evidenced by sensitivity to syllable polarity (odd or even position). The clusters represented by cocaf1 and cqewd1 both alternate counting from the end of the word (odd syllables favour tense vowels; even ones favour lax), while those represented by cqfdb1 alternate tenseness counting from the start of the word (odd syllables favour tense vowels; even ones favour lax). I illustrate this with the alternating-syllable laxing patterns going leftwards in spiritualité /spiritɥalite/ [spirɪʦɥalɪte] ‘spirituality’ (cqewd1) and distribution /ʣɪstribʏsjɔ̃/ [distʁibysjɔ̃] ‘distribution’ (cqhrl1), and rightwards in vérification /verifikasjɔ̃/ [veʁɪfikasjɔ̃] ‘verification’ and publicité /pyblisite/ [pyblɪsite] ‘advertisement’ (both cqejb1), respectively. This suggests that there are differences not only in the laxing system, but potentially also in prosodic organisation across groups, or in how they treat footing or rhythm as conditioning high-vowel laxing (see §5.2.2).
5. Discussion
High-vowel tenseness in Laurentian French has been at the centre of considerable theoretical debate because of the complex grammars that have been proposed to coexist within the language community. Our results reveal that the situation is simultaneously simpler than previously expected at the community level and more complex at the speaker level. In §5.1, I discuss insights for variation at the individual and community levels, focusing on high-vowel tenseness. In §5.2, I expand on the implications of these results for other aspects of Laurentian French phonology.
5.1. Grammars of tenseness in Laurentian French
This section discusses the content of and interplay between individual and community grammars with respect to tenseness in particular, comparing the diverse findings for individuals to what we observe from the community as a whole. I focus on the community grammar as comprising the patterns observable across individuals (reflected by the strongest effects – those with more extreme coefficients and smaller standard deviations in Table 4 – as well as the overall distributions in Figure 2).Footnote 21 §5.1.1 summarises cross-community patterns; §5.1.2 revisits individual grammars; and §5.1.3 discusses the relationships between the two.
5.1.1. Community summary
Overall, the community typically disfavours laxing high vowels in non-final syllables, but frequently harmonises a high vowel to agree with a high vowel in the following syllable, making the most likely pattern at the community level closest to the local iterative laxing harmony (with opaque neutral vowels) pattern illustrated in (4d), though the local non-iterative laxing harmony pattern illustrated in (4c) is also fairly common. The difference between the two is that, while both harmonise in adjacent syllables, the former does so iteratively until a non-high vowel is reached (as in similitude /similityd/ [sɪmɪlɪʦʏd] ‘similarity’, inédite /inedit/ [ineʣɪt] ‘unpublished.fem’), while the latter applies only a single time and therefore only the penult is eligible for harmony (yielding forms like [similɪʦʏd] and [ineʣɪt]). Furthermore, if laxing were to occur in a non-final syllable for any reason (like closed-syllable laxing, not supported as a typical pattern), the iterative pattern would apply laxing harmony (divulguer /divylge/ [ʣɪvʏlge] ‘to divulge’), whereas the non-iterative pattern would not (thus [ʣivʏlge]). Another common pattern is the laxing of a high vowel before a syllable from which another high vowel has been deleted, which I discuss at greater length in §5.2.3.
5.1.2. Individual grammars
Using production data, we can confirm many of the phonological processes generating lax high vowels in non-final syllables proposed in the literature. We find closed-syllable laxing (e.g., realising bulgare /bylgɑr/ ‘Bulgarian’ as [bʏl.gɑʁ]) in speakers cqewd1, cqbdb1 and cocaf1, among others, but this phenomenon is relatively limtied. Interestingly, closed-syllable laxing was found to be a significant unifying component of no inferred cluster; instead, it appears to be relatively variable across speakers even though it is a visible trend for several clusters (most strongly for clusters cqams1, cocaf1 and ANQ017). This suggests that closed-syllable laxing is highly variable, which is further reinforced by the much smaller range for coefficients compared to other predictors.
We additionally observe that the laxing harmony patterns proposed by Poliquin (Reference Poliquin2006) are confirmed in production, as illustrated by the example clusters in (7). We notably find more patterns than tested for in Poliquin’s perceptual acceptability task, which may partly explain the high individual variability in his participants’ judgements.

The laxing harmony patterns repeated in (7) intentionally exclude the non-harmony category in (4) because some form of harmony or disharmony was generalised for each cluster containing at least two speakers. However, these remaining cluster patterns often involve some form of prosodic condition. Poliquin suggests that speakers aim to spread harmony to the initial syllable because of secondary prominence or ‘stress’ falling on that syllable (see also, e.g., Déchaîne Reference Déchaîne1991; Astésano Reference Astésano2001) and, separately, that speakers generalise patterns inferred from disyllabic words to establish their harmony system for words of all lengths. Generalisation of this prosodic conditioning from forms like midi /midi/ [mɪʣi] ‘noon’ and the availability of non-laxing in words like limite /limit/ [limɪt] ‘limit’ could lead speakers to acquire a disharmonic or alternating pattern, which may be further reinforced by forms like [ʣɪf(i)sɪl] for difficile /difisil/ ‘difficult’, which appear to involve alternating tenseness (see, e.g., cluster cocaf1, where this conditioning requires a lax vowel in the final syllable; the ANQ007 cluster generalises to a preference for rightwards alternation instead, without consideration of the final syllable’s vowel).
Some other speakers (e.g. cluster cqfdb1) also favour alternation of tenseness in high vowels, but without conditioning by syllable polarity. These patterns both yield [defɪniʦɪf] for définitif /definitif/ ‘final’,Footnote 22 as well as [mɪlitɛːʁ] for militaire /militɛr/ ‘military’. The cocaf1 cluster, however, requires a high lax vowel in the final syllable for such tenseness preferences based on a syllable’s distance from the end of the word to play a role, resulting in [defɪniʦɪf] and [militɛːʁ]. I will argue in §5.2.2 that this conditioning of high-vowel tenseness by syllable polarity from the start or end of the word (varying by speaker; e.g., cluster ANQ007 for rightwards alternations, but cqewd1 for leftwards alternations) may suggest phonologised prosodic reduction for many speakers.
5.1.3. The existence of a community (grammar)
Individual grammars were best described as categorically distinct; effects were present, absent or even reversed for individual speakers, and these patterns were sufficiently strong that speakers could be grouped into clusters with significantly different grammars (see §5.2.1). However, these differences formed relatively unimodal distributions of coefficients across speakers. Therefore, I conclude that the Laurentian French language community superficially functions as a unit – reinforcing its description as a single language community – despite relatively extreme variation, in which individual speakers have distinct phonological systems.
This shared community pattern could explain why high-vowel laxing seems to be so stable across time (see descriptions in Dumas Reference Dumas1983, Reference Dumas1987; Poliquin Reference Poliquin2006). Speakers are not exposed to clearly multimodal systems during acquisition, and therefore may generate factor weights that target the community-level phonology rather than the grammars of individual speakers. They may also be less likely to socially index specific pronunciations – that is, to associate them with particular social groups or communicative contexts (see Eckert Reference Eckert2019) – because of this inability to reliably correlate variants with speaker groups or contexts of use.
The case of high-vowel tenseness in Laurentian French is potentially peculiar given the asymmetry between final and non-final syllables with respect to sociolinguistic evaluation. On one hand, producing a lax high vowel in final syllables is relatively neutrally perceived by Laurentian French listeners even in formal contexts (Lappin Reference Lappin1982; Cox Reference Cox1998; Reinke & Ostiguy Reference Reinke and Ostiguy2005; Chalier Reference Chalier2021), but producing a tense high vowel where a lax high vowel is expected in the dialect will often be seen as ‘snobby’ (Paradis & Dolbec Reference Paradis and Dolbec1998). On the other hand, in non-final syllables, not only is high-vowel tenseness seemingly not stigmatised, but untrained Laurentian French speakers even have relatively large difficulty reliably perceiving high-vowel tenseness (see the control condition in Lamontagne & Mielke Reference Lamontagne and Mielke2013). This perceptual difficulty may be bolstered by phonetic centralisation and greater within-category dispersion in non-final syllables in Laurentian French speech, particularly in less formal contexts (Lancien & Côté Reference Lancien and Côté2018).
In theoretical terms, the most intuitive instantiation is presented in Exemplar Theory, where the ability to generalise patterns to a socially or phonologically contentful token cluster is how tags or indices are associated with exemplar clouds (e.g., Johnson Reference Johnson, Johnson and Mullennix1997, Reference Johnson2006; Sumner et al. Reference Sumner, Kim, King and McGowan2014; Pierrehumbert Reference Pierrehumbert2016). Whereas final-syllable tenseness is likely to be a more compact cluster (involving lower dispersion with each allophone) and to be tagged for sociolinguistic factors (namely dialect), tenseness in non-final syllables is likely to be more acoustically variable (leading to more flexible categorisation by listeners) and may be associated with no social factors.Footnote 23 This difference between syllables may explain why preliminary analyses do not find consistent evidence of task effects in the PFC corpus (Lamontagne Reference Lamontagne2021b), nor do we find that ANQ speakers are reliably absent from clusters containing PFC speakers.Footnote 24
5.2. The broader phonological system of Laurentian French
In this section, I describe the implications of the results for theoretical descriptions of Laurentian French. §5.2.1 first addresses the question of tenseness, with a focus on the range of harmony systems exhibited at the individual level and the phonological status of tenseness in the dialect. In §5.2.2, I discuss the implications of the results for a broader aspect of the dialect’s phonological system: prosody. Finally, in §5.2.3, I address the question of syllable structure and how the results suggest the presence of derivational opacity resulting from vowel deletion.
5.2.1. The relationship between phonetics and phonology
Given the high degree of individual variation – and despite the normal distribution of coefficients across the community – it must be questioned whether we should treat high-vowel laxing as a single phenomenon for the dialect (i.e., across speakers). This question is reinforced by ultrasound evidence demonstrating that Laurentian French speakers differ in their articulatory implementation of the tense–lax distinction in high vowels; some speakers produce only tongue height differences, whereas others produce both tongue height and tongue root differences (Dalton Reference Dalton2011; Dalton & Mielke Reference Dalton and Mielke2013). There may thus be underlying articulatory motivations for which grammar of high-vowel laxing speakers acquire.
Based on the findings of the current study, future work should aim to correlate the articulatory implementation of tenseness with speakers’ laxing patterns. Speakers may base their articulatory implementation on the phonological patterns they infer during acquisition or vice versa. In particular, a typological proposal by Ćavar & Lulich (Reference Ćavar and Lulich2019) uses tongue muscle fibre composition (e.g., Sanders & Mu Reference Sanders and Liancai2013) to explain cross-linguistic patterns in features’ propensities to participate in harmony. Applied to the Laurentian French case, speakers who leverage the slower-moving tongue root muscles would be most inclined to exhibit local harmony (iterative or not, but likely favouring iterative patterns) because of the greater time and articulatory effort to reposition the tongue root compared to other parts of the tongue. On the other hand, speakers who make greater use of the faster-moving tongue body muscles are more free to produce non-local (height distinction) and prosodic (centralisation pattern) patterns.
5.2.2. The prosodic system of Laurentian French
Depending on the speaker, laxing harmony does not solely confer special status to initial syllables and penults. Syllables at regular intervals from word boundaries show distinct conditioning of tenseness in many speakers. The preference for alternation suggests that foot structure conditions laxing for some speakers and is a criterion for harmony for some others. Arguments for foot structure playing a role in segmental phonology in Laurentian French have been accumulating in recent work, for example based on vowel length and diphthongisation (Armstrong Reference Armstrong1999; Lamontagne Reference Lamontagne2020); prominence assignment (Lamontagne Reference Lamontagne2020; Lamontagne & Goad Reference Lamontagne and Goad2022); and vowel deletion (Armstrong Reference Armstrong1999; Garcia et al. Reference Garcia, Goad, Guzzo, Jesney, O’Hara, Smith and Walker2017; Guzzo et al. Reference Guzzo, Goad and Garcia2018; Lamontagne Reference Lamontagne2023b). The current study adds high-vowel laxing in non-final syllables to this growing list of phenomena and suggests iterative footing (aligning with Verluyten Reference Verluyten1982; Tranel Reference Tranel1994; Jun & Fougeron Reference Jun and Fougeron2002; Garcia et al. Reference Garcia, Goad, Guzzo, Jesney, O’Hara, Smith and Walker2017; Guzzo et al. Reference Guzzo, Goad and Garcia2018; Lamontagne Reference Lamontagne2023a,Reference Lamontagneb; contra Verluyten Reference Verluyten1982; Mertens Reference Mertens1987 for other varieties).
One surprising aspect of the results for polarity is its direction; polarity is computed from the start of the word for some clusters of speakers, but from the end of the word for others. Theoretical analyses of prominence in French typically propose footing from the end of the word (see, e.g., Jun & Fougeron Reference Jun and Fougeron2002), with the exception of a bidirectional analysis by Goad & Buckley (Reference Goad and Buckley2006). When we combine this variability in directionality with the observation that not all parity results imply harmony, evidence for two types of laxing systems emerges. One system, described in the previous section, truly involves high-vowel harmony. The other, however, appears to treat high-vowel laxing as prosodic – likely specifically a form of phonological reduction. Left-edge parity effects are likely the consequence of rhythmic variation (distinct from footing; see, e.g., Di Cristo & Hirst Reference Di Cristo and Hirst1993). Left-edge parity is similarly found to condition high-vowel duration – but not high-vowel deletion – in Laurentian French (Lamontagne Reference Lamontagne2023a,Reference Lamontagneb, who pools speaker data in the analysis). For speakers having the second type, Laurentian French may share similarities with Belgian French, where lax high vowels have been described as resulting from reduction (Hambye & Simon Reference Hambye and Simon2012).
5.2.3. Syllable structure effects and implications for derivational opacity
With respect to syllable structure, we find that codas have a limited effect in non-final syllables at the community level, though several speakers exhibit significant closed-syllable laxing. Poliquin (Reference Poliquin2006) posits that open syllables followed by the onset of a syllable in which the nucleus was elided, as in difficile /difisil/ [ʣif $\emptyset $
sɪl]
$\emptyset $
sɪl] $\sim $
[ʣɪf
$\sim $
[ʣɪf $\emptyset $
sɪl] ‘difficult’ and certificat /sɛrtifikɑ/ [sɛʁʦif
$\emptyset $
sɪl] ‘difficult’ and certificat /sɛrtifikɑ/ [sɛʁʦif $\emptyset $
kɑ]
$\emptyset $
kɑ] $\sim $
[sɛʁʦɪf
$\sim $
[sɛʁʦɪf $\emptyset $
kɑ] ‘certificate’, should pattern like closed syllables in favouring laxed variants, but with uncertainty as to whether closed-syllable laxing or harmony with a deleted vowel motivated laxing. This context, which I have labelled ‘late-closed’, cannot be reduced to closed-syllable laxing based on our results; high vowels in late-closed syllables undergo laxing more often than those in typical closed syllables, even though the direction of effect is typically the same. In light of this, opaque harmony with an elided vowel or prosodic laxing (§5.2.2) is more likely to explain laxing in late-closed contexts. This is further supported by cluster patterns: every cluster that had a significant or strong marginal effect for the deletion of nuclei in following syllables also exhibited a form of laxing harmony (non-local harmony for cqams1; local harmony for ANQ017 and cqbdb1).
$\emptyset $
kɑ] ‘certificate’, should pattern like closed syllables in favouring laxed variants, but with uncertainty as to whether closed-syllable laxing or harmony with a deleted vowel motivated laxing. This context, which I have labelled ‘late-closed’, cannot be reduced to closed-syllable laxing based on our results; high vowels in late-closed syllables undergo laxing more often than those in typical closed syllables, even though the direction of effect is typically the same. In light of this, opaque harmony with an elided vowel or prosodic laxing (§5.2.2) is more likely to explain laxing in late-closed contexts. This is further supported by cluster patterns: every cluster that had a significant or strong marginal effect for the deletion of nuclei in following syllables also exhibited a form of laxing harmony (non-local harmony for cqams1; local harmony for ANQ017 and cqbdb1).
5.3. Implications for phonological theory
The results of the current study not only reinforce the viability of pooling speakers’ data even when their behaviour is highly variable (albeit with the caveat that individual speakers’ patterns should nonetheless also be investigated), but also speak to theoretical issues for phonological analysis. I focus here on the acquisition of highly variable phenomena and the resulting implications for long-distance phonological patterns. With respect to acquisition, Poliquin (Reference Poliquin2006) assumes that speakers exhibit exactly one (or no) form of harmony because they would infer one pattern or another from ambiguous disyllabic words. While it is true that disyllabic words represent the most common word length in the present study, at 10,749 out of 25,483 tokens (42.18%), we nonetheless observe a large number of words for which harmony processes yield distinct outputs. Inference of individual speakers’ harmony patterns often requires substantial data, because most individual words cannot distinguish motivations for laxing and because of the probabilistic nature of the phenomenon.
More importantly, however, speakers do not consistently learn only one form of harmony. Any model of phonological inference (e.g., the algorithms in Tesar & Smolensky Reference Tesar and Smolensky1993; Boersma Reference Boersma1997; Goldwater & Johnson Reference Goldwater, Johnson, Spenader, Eriksson and Dahl2003; Heinz Reference Heinz2010) must therefore be capable not only of handling variable input and output, but crucially also of promoting grammars that may superficially be redundant for any given form that was assigned low – or null – probability. In the case of the phenomenon under examination, this implies initial-targeting harmony and penult-targeting harmony in the same system, for example.
An alternative interpretation is that learners are not identifying triggers and targets per se, but rather acquiring phonotactic patterns. Heinz (Reference Heinz2010), working in Subregular Phonology, may offer a solution consistent with the data under examination (and, in fact, the formulation of the predictors included in our statistical models). In particular, he models long-distance phenomena like harmony and disharmony not as the result of conflicting constraints, as in Optimality Theory, nor as the application of feature-changing rules, but instead as cumulative phonotactic restrictions. He crucially hypothesises that long-distance phonotactic patterns derived from agreement should be unable to yield blocking (if a segment ever precedes another at any distance in the word, then intervening segments should never affect grammaticality), which also implies that long-distance phonotactic patterns derived from disagreement will not be learnable by a model like the one he proposes. Therefore, certain speaker patterns we obtain may present an optimal test case for a question that Heinz leaves open, because they offer a way to distinguish between models with noise (i.e., allowing infrequent exceptions) and models using triples instead of only doubles for phonotactic restrictions (i.e., including three segments in the phonotactic generalisation and not only two).
5.4. Concluding discussion
The current study is the first large-scale study of speakers’ patterns for Laurentian French high-vowel laxing in non-final syllables based on production data. It thereby offers additional data for theoretical analysis of patterns that have been at the centre of considerable debate within phonology, and provides insight the complex relationship between speakers and their language community. It has been made possible by the congruence of multiple advances in corpus phonology and statistical methods. First, corpora must be sufficiently large to probe communities, as each speaker essentially equates to a single data point. Second, the data coding was made feasible by recent advances in forced alignment. Third, advances in statistical tools were critical at many stages. The result is that the current study provides both new data on Laurentian French tenseness, being the first to offer a large-scale analysis of individual differences in production, and novel nuances to an oft-used example of variable phonological systems.
The main limitation of the present study is that it is not as yet certain whether speakers typically realise tenseness distinctions in final and non-final syllables in identical manners. For instance, just as speakers vary in whether tongue root placement is used in the realisation of the laxing contrast, it may be that some speakers use different articulatory strategies depending on the position in the word, or that they exhibit more gradient differences in tenseness in non-final syllables compared to final syllables. This possibility should be at least partly addressed by the aligner adjusting its representation of tenseness for this variation thanks to speaker adaptation and triphone models. However, it does mean that the accuracy estimates for non-final syllables may differ from those for final syllables. I believe that the results nonetheless offer a useful window into how those non-final vowels pattern phonologically.
While this study could shed light on the structure of phonological variation within the community and expose novel patterns not discernible in previous work due to the data type (perceptual acceptability, impressionistic observations) or the size of the dataset (few speakers or few stimuli), many questions remain open. The results suggest that prominence plays an important role for a large subset of speakers, but prominence was not quantified directly (e.g., through pitch and duration), leaving for future work the phonetic investigation of this proposal. Further, the results suggest a mechanism by which tenseness may play a role in the reorganisation of the phonological inventory in Laurentian French, as previously proposed by Côté (Reference Côté2012) and Lamontagne (Reference Lamontagne2019) based on other phenomena. However, this remains an open question to be explored diachronically.
Supplementary material
The supplementary material for this article can be found at https://doi.org/10.1017/S0952675725100249. It lists the full set of clusters identified by the Affinity Propagation analysis (i.e., including clusters containing only speakers in the Assemblée nationale du Québec corpus).
Acknowledgements
I would like to thank Marie-Hélène Côté for access to the Phonologie du français contemporain corpus data, Peter Milne for collaboration in earlier work leading towards to the current analysis, and Heather Goad and Monica Nesbitt for discussion of earlier analyses. I further thank Marie-Hélène Côté, Julien Eychenne and three anonymous reviewers for comments on earlier versions of the article.
Competing interests
The author declares no competing interests.
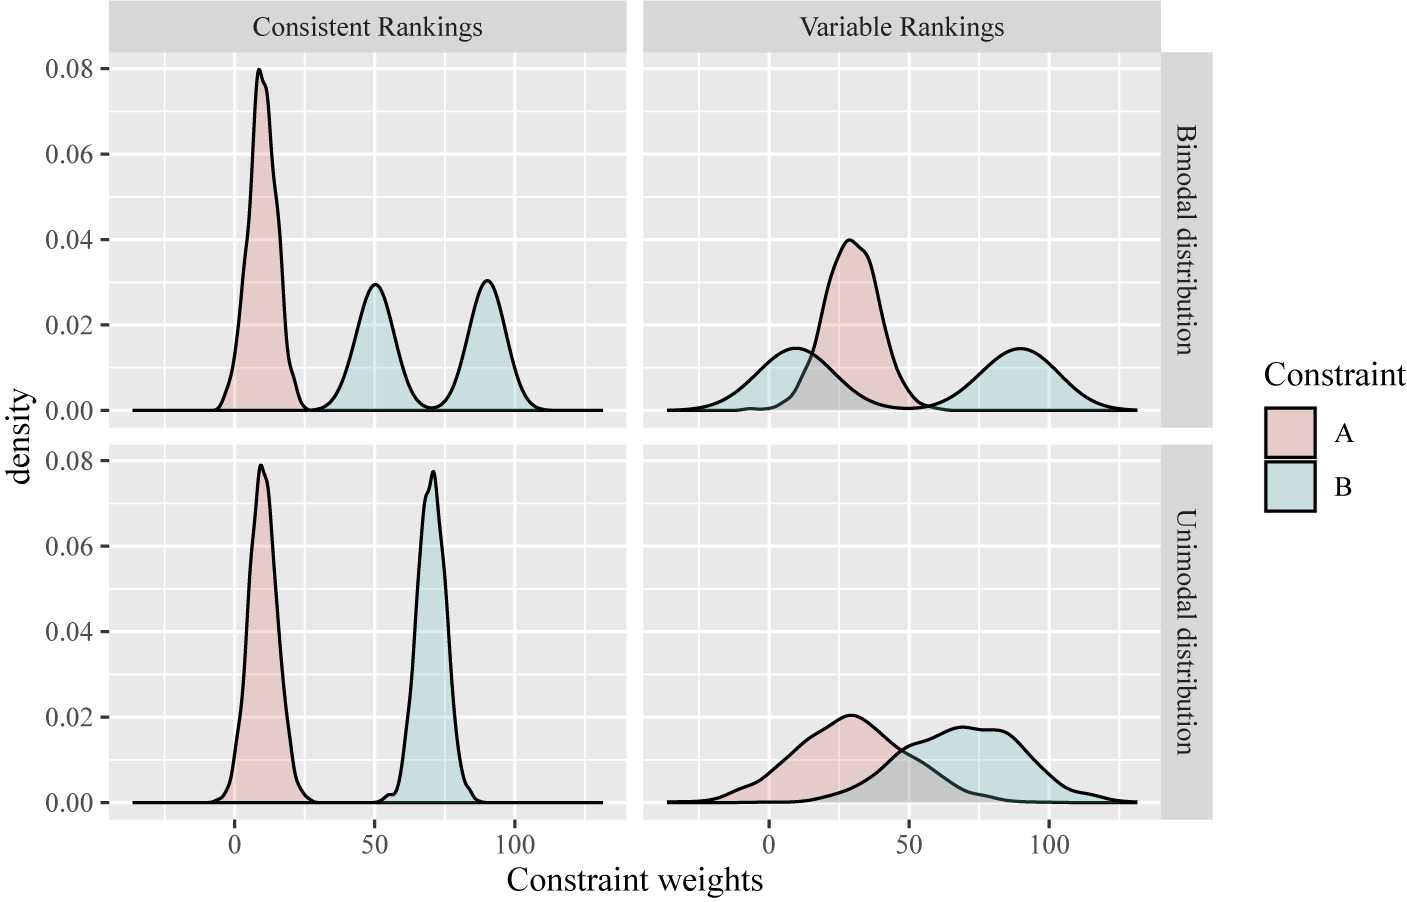
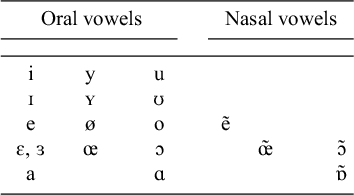
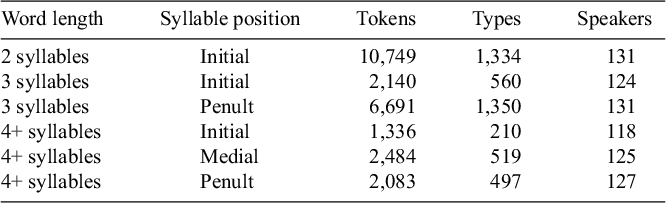
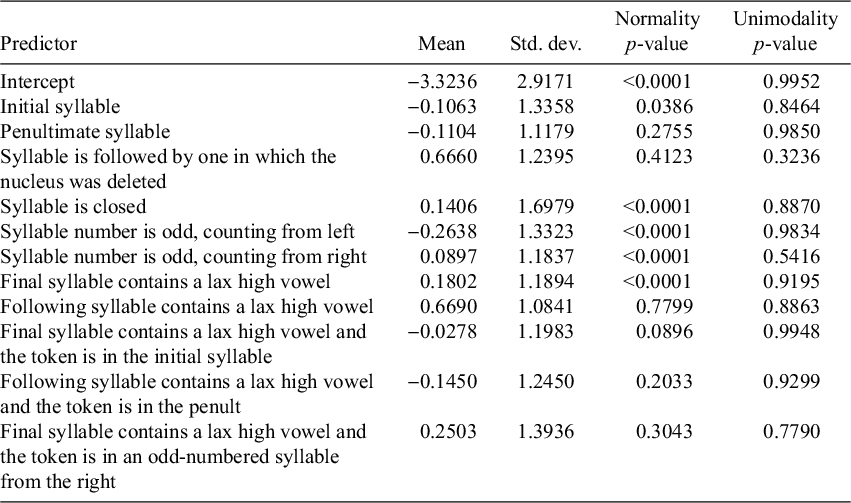

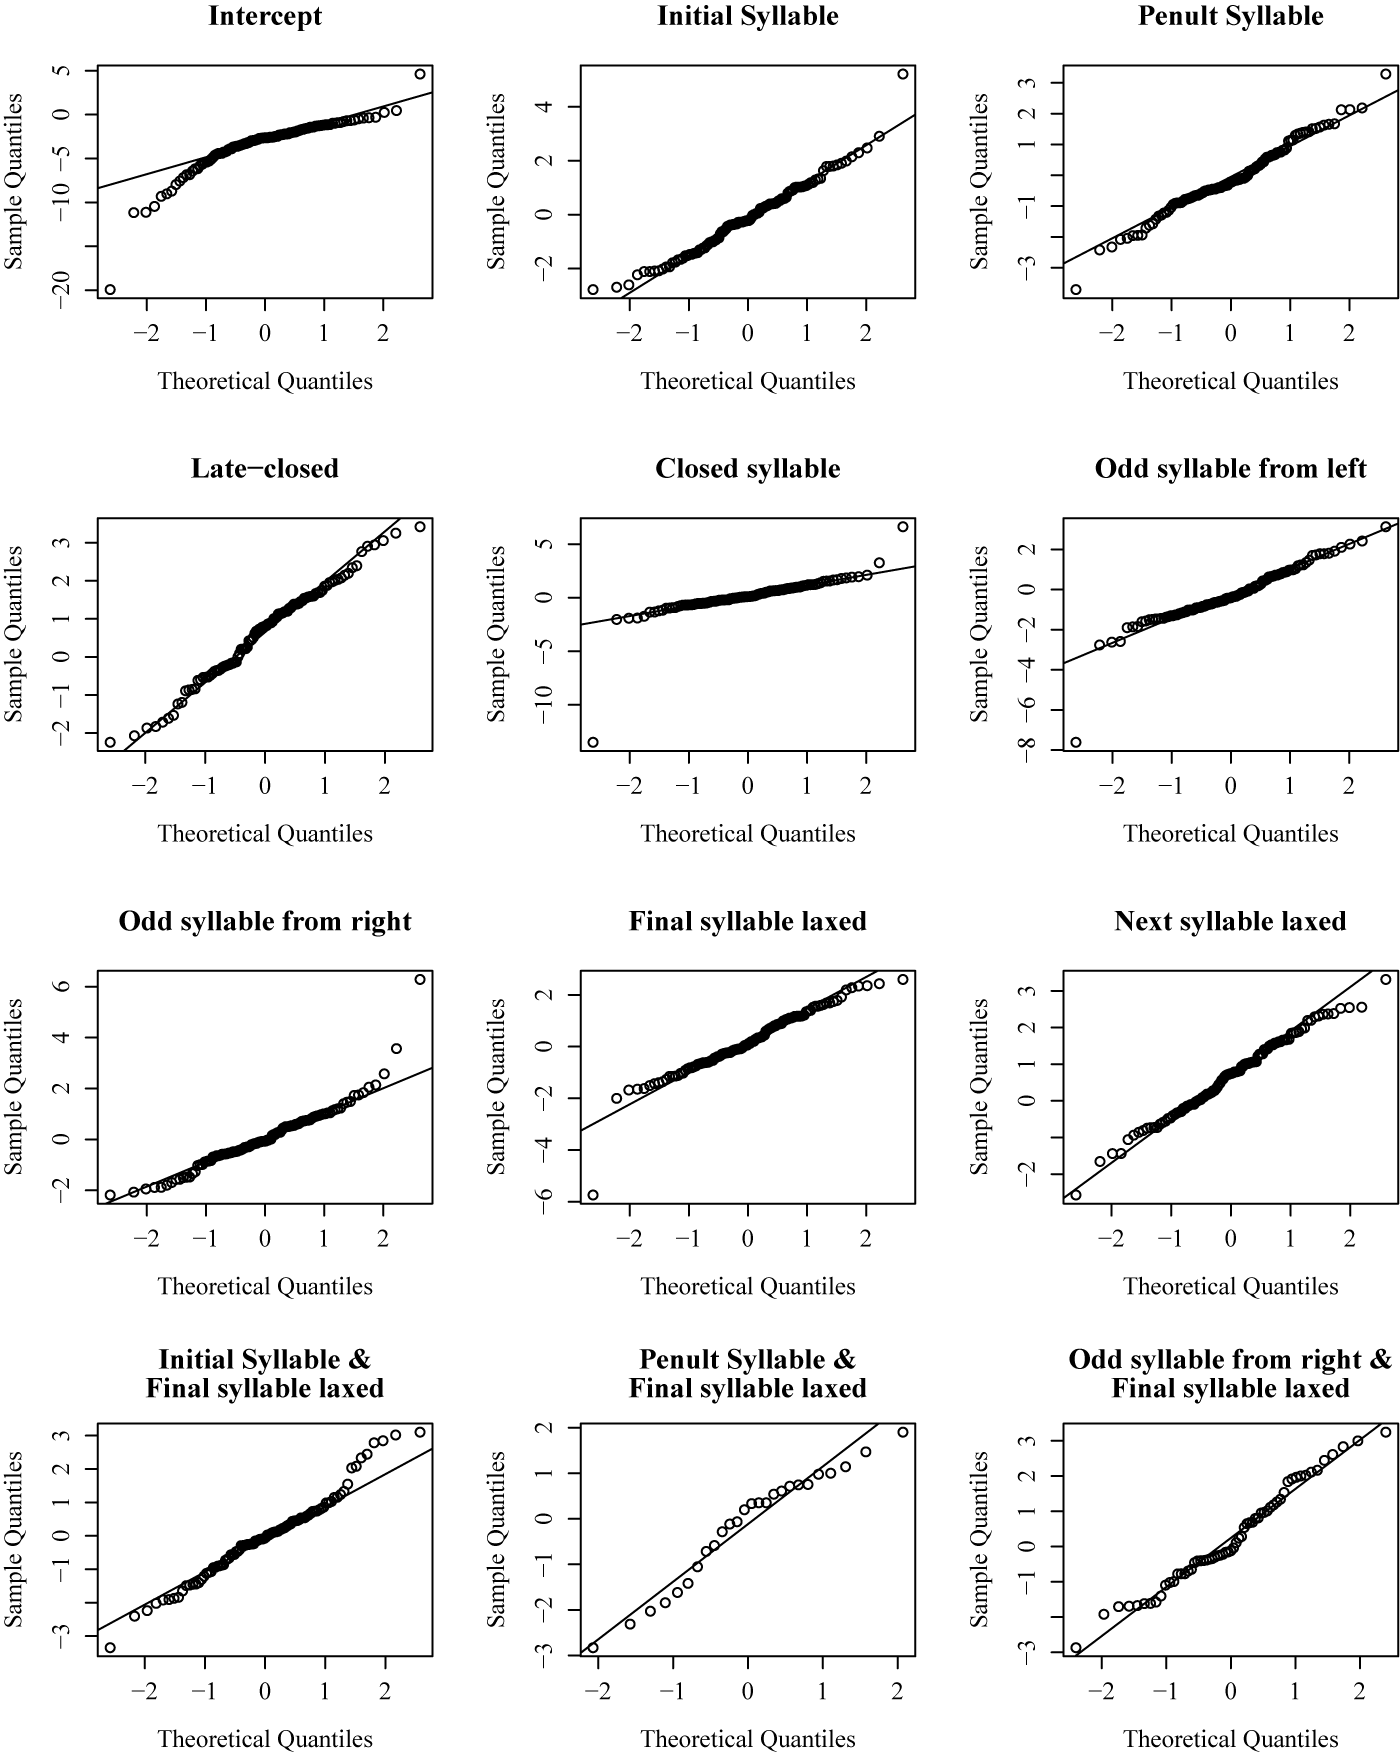

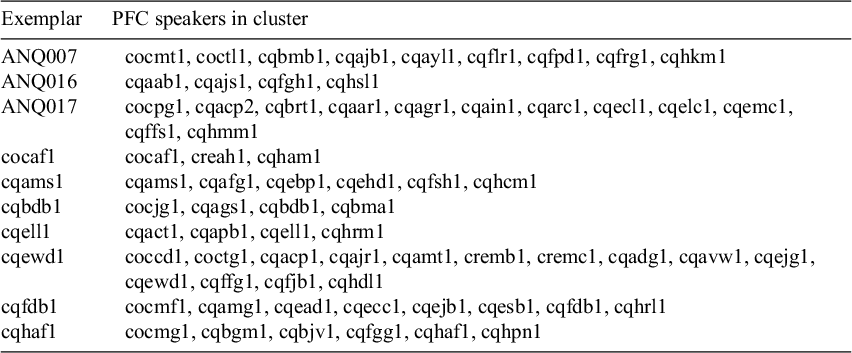
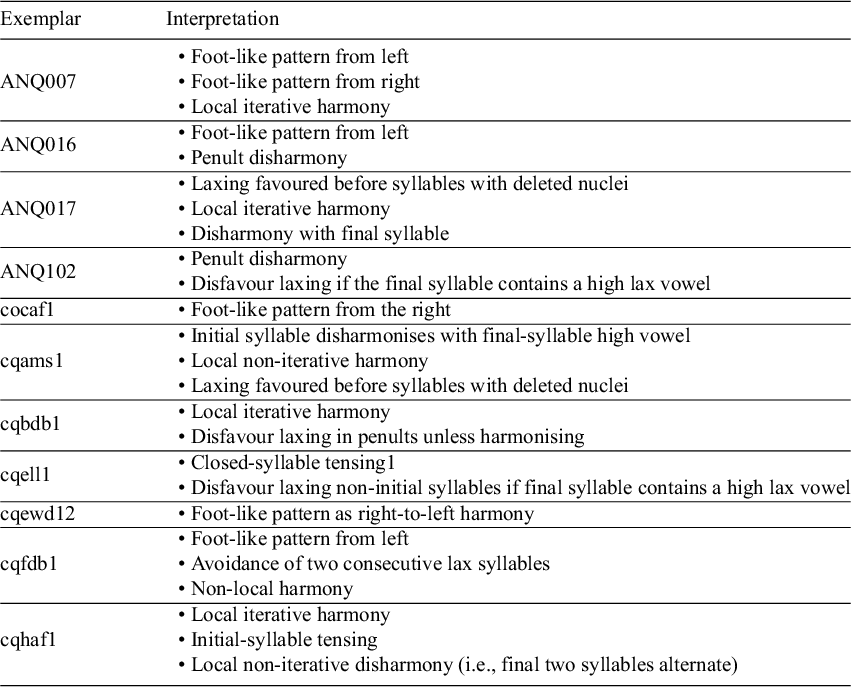
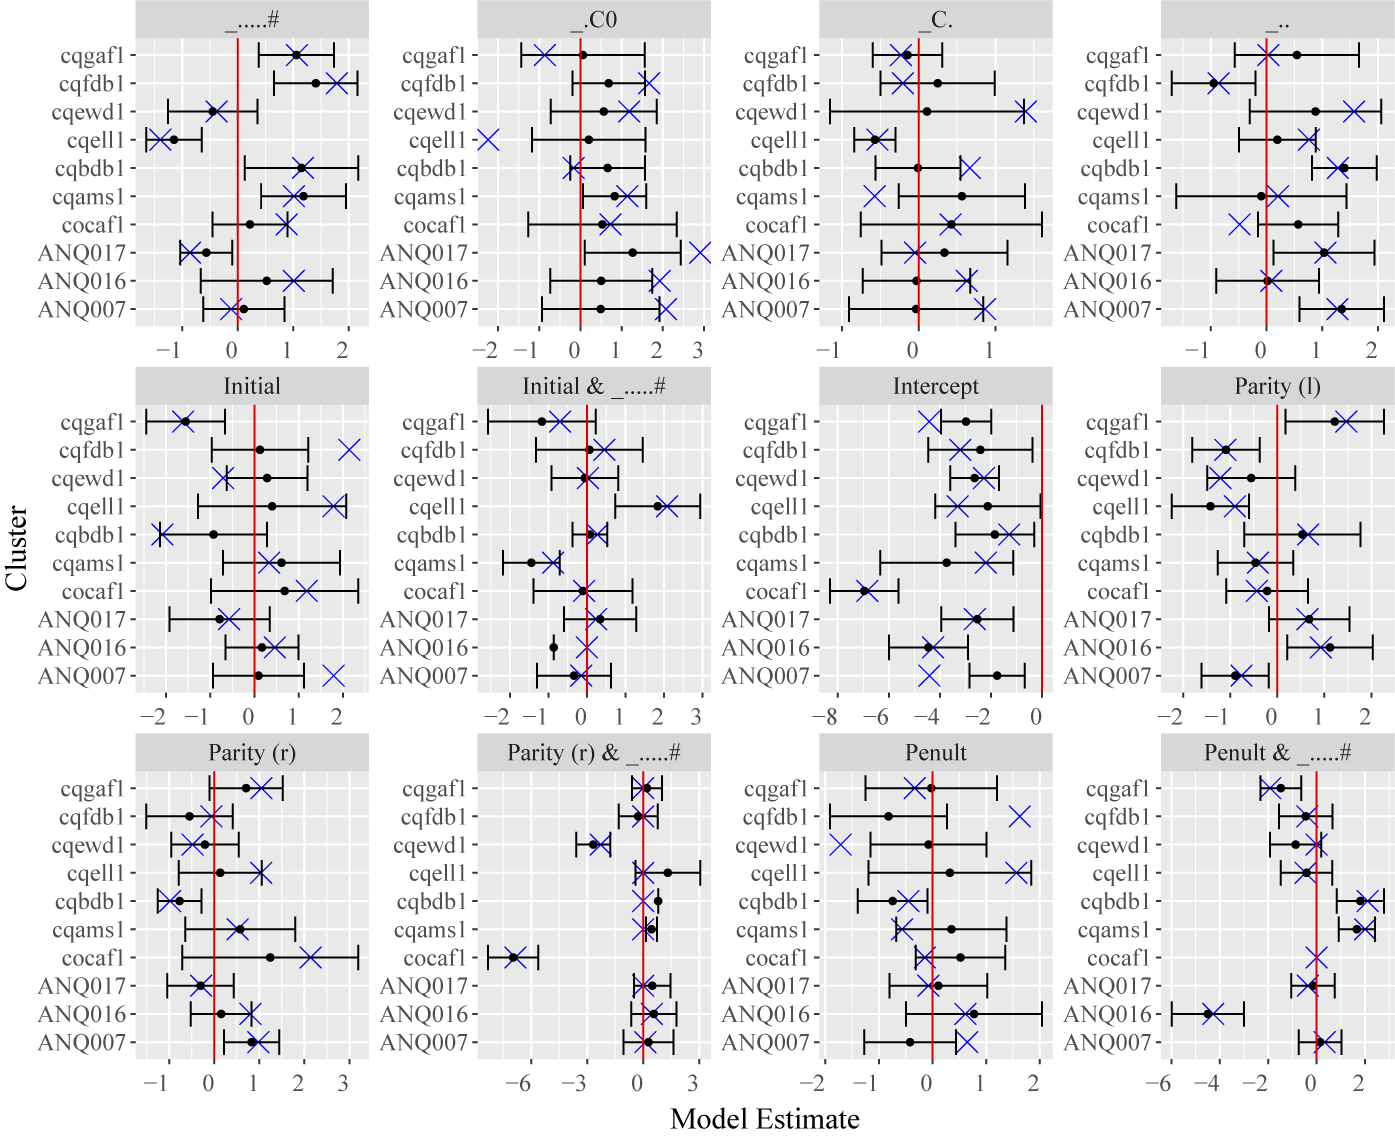
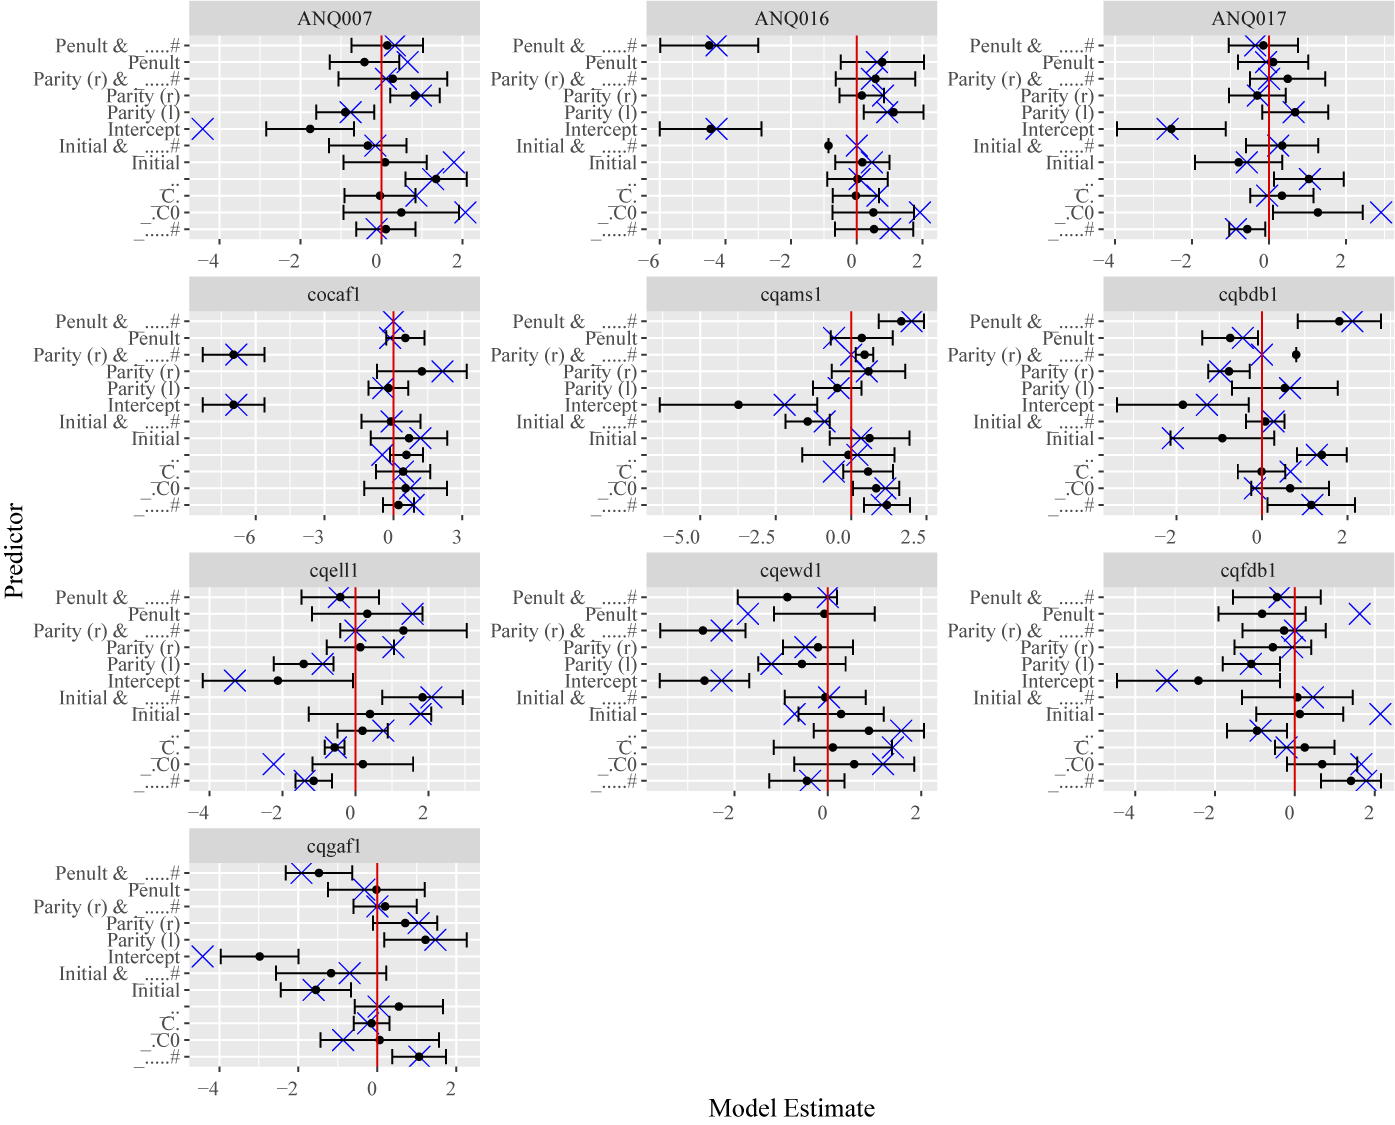


 Open access