

The use of GM plants as food and feed has been debated for more than two decades. As plant products are used to partially replace marine resources in fish feed production, the GM debate has also become part of fish farming. Availability of GM-free ingredients has become a challenge for the feed industry(Reference Anonymous1, Reference Kaushik, Hemre and Lie2). Soyabean and maize are the most commonly grown GM plants, with 77 and 26 % of the global acreage of these respective crops planted with GM varieties(Reference James3).
The current technology used for genetic modification is based on random integration of the novel DNA into the plant genome(Reference Somers and Makarevitch4). This integration can cause rearrangements of both the transgenic construct and DNA at the insertion site (often causing instability in transgene expression), as well as genome-wide mutations(Reference Fladung5–Reference Kumar and Fladung7). These processes can cause unintended effects in the GM plant with altered levels of nutrients, anti-nutrients or unknown compounds, although unintended effects are not unique to GM plants and can occur in traditionally bred plants as well(Reference Cellini, Chesson and Colquhoun8, Reference Kuiper, Kleter and Noteborn9), and such effects are screened for during the approval process of GM plants. Additionally, the novel protein itself may have toxic effects or elicit a harmful immunological response including allergic hypersensitivity(Reference Prescott, Campbell and Moore10).
Cry proteins are expressed in many GM crops to make the plants resistant to insects. These proteins are naturally found in the soil bacterium Bacillus thuringiensis, hence are often referred to as Bt-proteins or Bt-toxins. These toxins bind to specific receptors in the mid-intestine of target insects, causing damage to the intestinal wall and resulting in their death(Reference Knowles11), although the different Cry proteins have slightly different properties and target different insects. The Norwegian Scientific Committee for Food Safety(Reference VKM12) has questioned the safety of Bt-toxins and identified knowledge gaps. Studies in mice using isolated Cry1Ac protoxin from B. thuringiensis (Reference Vázquez-Padrón, Moreno-Fierros and Neri-Bazán13) and recombinant Cry1Ac from transgenic Escherichia coli (Reference Vázquez-Padrón, Moreno-Fierros and Neri-Bazán13–Reference Moreno-Fierros, García and Gutiérrez15) have indicated that this protein binds to the intestinal mucosa, where it induces in vitro hyperpolarisation of the intestinal tissue and stimulates antibody production. If transgenic Bt-protein (Cry1Ab in this case) causes similar changes in salmon, this may help explain differences in haematology, levels of stress-related proteins(Reference Sagstad, Sanden and Haugland16), intestinal weight and changes in intestinal nutrient transport(Reference Hemre, Sagstad and Bakke-McKellep17) observed in salmon fed MON810 maize. MON810 is one of several modification events producing Bt-maize and has a gene-introduced coding for the Cry1Ab protein. Questions regarding the safety of Bt-maize have also been raised for other species. A 90 d rat study with Bt-maize (MON863, expressing Cry3Bb1) conducted by Monsanto(Reference Hammond, Dudek and Lemen18) was reanalysed by others claiming signs of hepatorenal toxicity(Reference Séralini, Cellier and de Vendomois19). However, this reanalysis was discarded by the European Food Safety Authority(20) and others(Reference Doull, Gaylor and Greim21), concluding that the observed effects were spurious occurrences without biological relevance. In a three-generational study performed on rats with Bt-corn (modification event and type of Cry protein not specified), histopathological changes in the kidney and liver were observed(Reference Kiliç and Akay22).
The outcome of feeding trials with GM ingredients may be limited with respect to a restricted and biased selection of parameters investigated(Reference Cellini, Chesson and Colquhoun8, Reference Kuiper, Kok and Engel23). Molecular profiling methods such as proteomics and transcriptomics may increase the chances of identifying potential effects of GM feeds and may help reveal the mechanisms behind those effects. Limited work has been conducted in this area, but proteomic profiling of the liver has been used in the assessment of GM soya in feed for salmon(Reference Sissener, Martin and Cash24), and suppression subtractive hybridisation complementary DNA (cDNA) libraries have been constructed for salmon fed GM soya and maize(Reference Frøystad, Lilleeng and Bakke-McKellep25, Reference Frøystad-Saugen, Lilleeng and Bakke-McKellep26). Microarray is another profiling technique that might be useful in evaluating the effects of GM feed ingredients. The Genomics Research on All Salmonids Project (GRASP) has produced a cDNA array of 16 000 genes from salmon and trout expressed sequence tags and contigs(Reference von Schalburg, Rise and Cooper27), which can provide novel insight into various biological systems of salmon.
The presence of confounding factors is always an issue when testing diet ingredients; thus it is crucial that the diet ingredients are sufficiently characterised, so that possible differences can be taken into account during diet formulation if possible, or at least when interpreting the results of the trial. There are numerous different mycotoxins that can potentially be present in maize, and there is limited knowledge regarding the effects of these on fish. Mycotoxins are secondary metabolites of moulds, chemically stable, not inactivated by heat treatment(28), and thus can be assumed to survive standard processing of fish feeds.
The aim of the present study was to investigate potential differences in the gene expression profile in the intestine, as the first site of exposure to the feed ingredients, and the liver, as the main metabolic organ, between Atlantic salmon fed feeds containing GM MON810 maize and the near-isogenic non-modified maize, respectively. This investigation is part of a larger feeding trial, from which a range of health and performance-related parameters have been reported previously(Reference Sagstad, Sanden and Haugland16, Reference Hemre, Sagstad and Bakke-McKellep17). Furthermore, characterisation of the diet ingredients was extended with analyses of mycotoxins and metabolite profiling to reveal potential differences between the GM and non-GM maize.
Materials and methods
Ingredients, diets and feeding
We made two experimental diets, containing either the GM maize (modification event MON810) or the untransformed, near-isogenic parental line (non-GM maize). Both were kindly supplied by the Monsanto Company (St Louis, MO, USA). The maize ingredients were dried and ground before feed production, and the inclusion level of maize in the diets was 30 %. Proximate analyses of the maize ingredients, as well as analysis of phytate content, are reported by Hemre et al. (Reference Hemre, Sagstad and Bakke-McKellep17). Screening for herbicide residues in these maize ingredients revealed no content above the detection level, neither in the GM nor in the non-GM maize(Reference Sissener, Johannessen and Hevrøy29). The mycotoxins aflatoxin B1, aflatoxin B2, aflatoxin G1, aflatoxin G2 and ochratoxin A were determined quantitatively using HPLC–fluorescence, while deoxynivalenol (DON), HT-2 toxin, nivalenol, T-2 toxin and zearalenone were determined quantitatively using liquid chromatography–MS. All mycotoxin analyses were performed by the Institute of Veterinary Science, Oslo, Norway.
Low-temperature quality fishmeal and fish oil supplied most of the protein and lipid in the diets. National Research Council(30) recommendations were followed for vitamin and mineral additions. Rovimix, which contains 8 % astaxanthin, was added as a pigment source. The diets were made at the Nofima Feed Technology Centre (Bergen, Norway). Formulation and analysed composition, including a selection of vitamins and minerals (which have also been published previously(Reference Hemre, Sagstad and Bakke-McKellep17)), of the diets are given in Table 1. The diets were compositionally similar in all analysed nutrients. Each diet was fed to triplicate tanks in excess, from automated feeders running in intervals of 20 s intervened by 200 s (05.00 to 08.00 hours and 14.00 to 03.00 hours).
Formulation and chemical composition of the two experimental diets (g/kg)
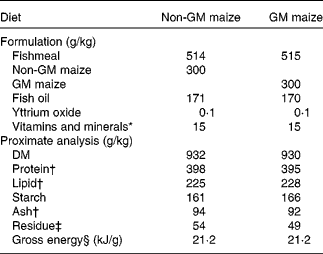
* Vitamins and minerals were added according to National Research Council recommendations(30).
† Fatty acid composition (g/kg of total fatty acids) and total amino acids were equivalent in the two diets. Ca varied from 18·6 to 19·0 g/kg, P from 12·7 to 13·1 g/kg, Zn from 206 to 214 mg/kg, Fe from 154 to 166 mg/kg and Se from 1·4 to 1·6 mg/kg. Vitamin A1 (21·2 μg/g), vitamin A2 (1 μg/g), α-tocopherol (159–174 μg/g) and thiobarbituric acid-reactive reagents (50–55 nmol/g) were added. B vitamins were not analysed but added according to National Research Council recommendations(30).
‡ Residue was calculated as 1000 − (moisture+protein+lipid+starch+ash).
§ Gross energy was calculated according to Tacon(Reference Tacon101).
GC–MS-based metabolite profiling
Samples of non-GM and GM maize (n 3) were ground to powder with a mortar and pestle, and 300 mg were transferred to 2 ml round-shaped Eppendorf tubes. Then, 400 μl of 100 % methanol containing the internal standard ribitol (20 μg/400 μl) were added to the tubes and vortexed. Samples were then treated for 15 min at 70°C in a shaking incubator (200 rpm). After the samples had been cooled down to ambient temperature, 200 μl CHCl3 were added, and the samples were vortexed for 10 s. Then, 400 μl distilled water were added, and the samples were again vortexed for 15 s at full speed. The tubes were placed in a centrifuge for 10 min at 13 000 rpm at 4°C. The supernatant (300 μl) was transferred to 1·5 ml round-bottomed Eppendorf tubes and further dried in a speed vacuum without heating. The dried residue was re-dissolved in 80 μl of methoxyamine hydrochloride (20 mg/ml) in pyridine and derivatised at 30°C for 90 min in a shaking incubator (200 rpm). Finally, the samples were treated with 80 μl of N-methyl-N-(trimethylsilyl)trifluoroacetamide and placed at 37°C in a shaking incubator (200 rpm) for 30 min. The samples were transferred to 1·5 ml of autosampler vials with glass inserts and subjected to metabolite profiling by GC–MS. An Agilent 6890/5975 GC–MS system was used for all analyses. Sample volumes of 1 μl were injected with a split ratio of 25:1. GC separations were carried out on a HP-5MS capillary column (inner diameter 30 m × 0·25 mm and film thickness 0·25 μm). Injection temperature was 230°C, and the interface was set to 250°C. The carrier gas was He at a constant flow rate of 1 ml/min. The GC temperature programme was held isothermically at 70°C for 5 min, ramped from 70 to 310°C at a rate of 5°C/min and finally held at 310°C for 7 min (analysis time: 60 min). The MS source was adjusted to 230°C, and a mass range of m/z 50–700 was recorded. All mass spectra were acquired in electron impact ionisation mode. Chromatogram visualisation and peak area integration were carried out using Agilent ChemStation software (Agilent Technologies, Waldbronn, Germany). For mass spectra evaluation and peak identification, AMDIS software (version 2.64; National Institute of Standards and Technology, Boulder, CO, USA) was used in combination with the following mass spectral libraries: a NIST05 database and a target TMS database (Max-Planck Institute for Molecular Plant Physiology, Golm, Germany). Detected metabolites were measured using peak area integration, assessed quantitatively based on the internal standard ribitol and finally expressed as mg/kg dry weight.
Experimental animals and rearing conditions
The feeding trial took place at the Feed Technology Centre, Nofima (Austevoll, Norway). Fish were acclimatised to rearing conditions for 2 weeks before being randomly distributed into six dark-green fibreglass tanks (1·5 × 1·5 × 0·9 m), each containing forty-five fish. Initial weight averaged 155 (sd 3) g. The feeding trial lasted for 82 d, from 17 June until 9 September 2004. The fish were exposed to continuous light, salinity varied between 31 and 32 g/l, and the temperature averaged 8 (sd 0·5)°C. A flow-through system of 50–55 litres/min ensured high water quality, maintaining average water oxygen content at 7·8 mg/l (88 % saturation). The trial was approved by the National Animal Research Authority in Norway.
Sampling procedure
Fish were not deprived of feed before sampling, as various feed effects on the intestine, such as soyabean meal-induced inflammation, intestinal mass and enzyme activities, have been shown to decrease rapidly when salmon were not fed(Reference Baeverfjord and Krogdahl31, Reference Krogdahl and Bakke-McKellep32). The fish were pre-anaesthetised with Aqui-S™ isoeugenol (540 g/l; Scan Aqua, Årnes, Norway) and thereafter fully anaesthetised with metacainum (50 mg/l; MS-222™; Norsk Medisinaldepot AS, Oslo, Norway). Tissues from the liver and distal intestine were immediately placed in RNAlater™ (Ambion, Huntingdon, UK) and stored as recommended by the manufacturer.
RNA isolation and quality control
Total RNA from the liver and distal intestinal samples was extracted using the same procedure as described by Sagstad et al. (Reference Sagstad, Sanden and Haugland16). Briefly, total RNA was isolated from 50 to 70 mg of tissue in TRIzol reagent (Invitrogen Life Technologies, Grand Island, NY, USA) using a phenol–chloroform extraction method. Liver tissue was homogenised using MagNA Lyser Green Beads (Roche, Mannheim, Germany) and a MM301 shaker machine (Retsch Norge AS, Haan, Germany) at full speed for 4 min, while intestinal tissue was homogenised with a Polytron (Kinematica, Bohemia, NY, USA) without the use of beads. The final samples were diluted in 50–300 μl RNase-free double-distilled water (MilliQ Biocel; Millipore Corp., Bedford, MA, USA) and treated with the DNA-free™ kit (Ambion) according to the manufacturer's instructions, before being stored at − 80°C. Quantity and quality of RNA samples were assessed with the NanoDrop® ND-1000 UV–Vis Spectrophotometer (NanoDrop Technologies, Wilmington, DE, USA) and the Agilent 2100 Bioanalyser (Agilent Technologies, Palo Alto, CA, USA) using the RNA 6000 Nano LabChip® kit (Agilent Technologies). The quality of the RNA samples (optical density (OD)260/OD280 1·8–2·00, RNA integrity number (RIN) number 8–10) was found sufficient for labelling and hybridisation. Samples were divided into two aliquots, one for microarray and one for quantitative PCR (qPCR) analyses.
Microarray design
The microarray experiment was designed to comply with the Minimum Information About a Microarray Experiment guidelines(Reference Brazma, Hingamp and Quackenbush33). Minimum Information About a Microarray Experiment compliant data have to be uploaded to the Array Express database (accession no. E-TABM-1056). A common reference design was utilised with each individual sample hybridised together with a common reference sample to the cGRASP version 2.0 16K cDNA microarray. Total RNA from fish fed the control diet (non-GM) was pooled to make an RNA reference pool (nine fish), with each fish represented equally. The reference RNA was hybridised against individual fish in the control diet (non-GM, n 9, only intestinal and liver samples were not hybridised due to time constraints) and the treatment diet (GM, n 9, both intestine and liver). A total of eighteen arrays were analysed for the intestine, and nine arrays for the liver (Fig. 1).
Common reference design was used for the microarray hybridisations. For the intestinal samples, both the nine samples from fish fed the GM maize diet (three from each of three tanks) and the nine samples from fish fed the non-GM diet were hybridised against the reference sample, which was a pool of all non-GM samples. For the liver samples, only sample the fish fed the GM maize diet were hybridised against the reference sample.

RNA labelling and microarray hybridisation
Total RNA (10–20 μg) was transcribed into cDNA and indirectly labelled with fluorescent dye using aminoallyl- and aminohexyl-modified nucleotides (SuperScript™ Indirect cDNA Labelling System; Invitrogen). The pooled reference RNA was always labelled with Cy3 (Amersham Biosciences, Piscataway, NJ, USA), and RNA from individual fish was labelled with Cy5. After labelling, reference and individual samples were paired into one tube according to yield and dye incorporation, combined and concentrated by a vacuum concentrator (Vacufuge™; Eppendorf, Hamburg, Germany). Before hybridisation, slides were post-print processed and pre-hybridised. The post-print process was performed by washing twice in 0·2 % SDS for 5 min, five times in Milli-Q water for 1 min and then the slides were dried for 2 min by centrifugation. Microarrays were pre-hybridised for 90–120 min in 5 × saline–sodium citrate (SSC), 0·1 % SDS, 3 % bovine serum albumin (fraction V) at 30°C followed by three quick washes (20 s) in Milli-Q water and immediately thereafter dried by centrifugation. The hybridisation mix was composed of 4 μl of LNA dT blocker (Genisphere, catalogue no. CW3920), 46 μl of DIG Easy Hyb (Roche catalogue no. 1796·895) and 10 μl of labelled cDNA resuspended in nuclease-free water (catalogue no. 9939; Ambion), giving a total volume of 60 μl. Microarray hybridisations were run in the dark under HybriSlips hybridisation covers (Erie Scientific, Portsmoth, NH, USA) in slide hybridisation chambers (Corning Inc., Corning, NY, USA) submerged in a 30°C water-bath for 16–18 h. Coverslips were floated off at 30°C in 2 × SSC, 0·1 % SDS for 20 min. Arrays were washed twice in 2 × SSC, 0·1 % SDS for 10 min at room temperature, twice in 1 × SSC for 10 min and twice in 0·1 × SSC for 10 min at room temperature. The slides were dried by centrifugation for 2 min.
Fluorescent images of hybridised arrays were acquired immediately at 10 μm resolution using a ScanArray™ 5000XL Microarray Acquisition scanner (Packard BioChip Technologies, Billerica, MA, USA). Cy3 and Cy5 cyanine fluorophores were excited at 543 and 633 nm, respectively, and the same laser power (100 %) and photomultiplier tube settings (80–90 %) were used for all slides in the present study. The photomultiplier tube voltage was adjusted for each slide by doing a line scan at 50 μm resolution.
Pre-processing, filtration and normalisation of microarray data
The images were processed using Gene Pix version 5.1 at the NMC core Facility Laboratory, before the data were filtered and normalised using J-Express Pro version 2.8(Reference Dysvik and Jonassen34) (www.molmine.com, Bergen, Norway). The foreground signal intensity values for each channel were extracted from the data files, and all flagged and control spots or spots saturated in either channel were filtered out before the data were normalised using the global lowess method(Reference Cleveland and Devlin35), which performs local background correction to adjust spot intensities. After normalisation, weak spots with a foreground signal of less than the background plus 1·5 standard deviations were filtered out. All arrays were compiled into a single expression profile data matrix containing the log ratios of the two foreground signal intensities, disregarding rows with more than 40 % missing values, before replacing missing values using the LSimpute adaptive method(Reference Bo, Dysvik and Jonassen36). Finally, samples were scale-normalised to make the distribution of log ratios comparable(Reference Yang, Dudoit and Luu37).
Microarray data analysis
The scale-normalised intestinal data were then subjected to correspondence analysis(Reference Fellenberg, Hauser and Brors38) and significance analysis of microarrays (SAM)(Reference Tusher, Tibshirani and Chu39), both implemented in J-Express 2009 (Molmine, Bergen, Norway). The two-class, unpaired SAM was run with 400 permutations to look for differentially expressed genes on a gene-by-gene basis. Furthermore, gene-set enrichment analysis (GSEA)(Reference Subramanian, Tamayo and Mootha40) was conducted to identify differentially expressed gene sets. The gene sets were created on the basis of Gene Ontology (Gene Ontology Consortium; www.geneontology.org), by mapping the Gene Ontology annotations in the cGRASP version 2.0 annotation file (dated February 2008) to the Gene Ontology accession numbers in the Gene Ontology OBO file dated 9 September 2009. The analysis was run with probes collapsed to genes, so that each gene would contribute equally to the statistical analysis. Both gene and sample permutations were tried with 10 000 iterations. As an alternative method to identify individual regulated genes, the rank product procedure was run with 1000 permutations.
The liver data could not be analysed statistically in J-Express, due to limitations in the design as described earlier with only the nine GM samples hybridised to the non-GM reference pool. In order to extract information from this dataset and use it to select potentially interesting genes to follow up by qPCR, the whole gene list with intensity values for each sample was copied into Excel. For each gene, the average intensity across all samples, standard deviation and CV were calculated. The list was sorted by average intensity, and ‘genes of interest’ were selected near the top and the bottom of the list, under the rationale that these genes must be the ones most differentially regulated between the diet groups. Only genes with a relatively low CV (as large individual variation in a gene would make it less likely to identify significant differences) and consistency in the direction of regulation (e.g. that ideally nine out of nine samples all had negative or positive intensity values) were selected.
After analysing the intestinal data, it became apparent that some of the differences observed might be due to chips being hybridised on different days or the different batches of chips used, rather than diet effects (these observations are further described in the Results section). As chip batches and hybridisation days had not been properly randomised across diet groups, such effects would be difficult to distinguish from diet effects. Consequently, the same approach as for the liver samples was attempted to avoid the problem of possible day and batch effects between the two diet groups.
Quantitative PCR
For verification, some genes that were selected based on the microarray results were analysed by real-time qPCR. Samples from the same individual fish as in the microarray analysis were used, as well as some additional samples of high-quality RNA from the same tanks (totally nine non-GM and eleven GM samples from the intestine, and thirteen liver samples from each diet group). Potential reference genes were chosen from the literature: elongation factor 1-α(Reference Moore, Somamoto and Lie41), heat shock protein (HSP) 90B, β-actin(Reference Olsvik, Lie and Jordal42), acidic ribosomal phosphoprotein(Reference Hevrøy, El-Mowafi and Taylor43) and RNA polymerase 1(Reference Jørgensen, Kleveland and Grimholt44). For the target genes, primers were designed using Primer Express® 2.0 (Applied Biosystems, Foster City, CA, USA) and tested by one-step RT-PCR (Qiagen, Hilden, Germany) and agarose gel electrophoresis to confirm a single amplification product of the expected size. All primer (Invitrogen, Oslo, Norway) sequences are given in Table 2 and were designed to be within the protein-coding region of the mRNA sequence.
Primer sequences and GenBank accession numbers for the sequences from which the primers were designed
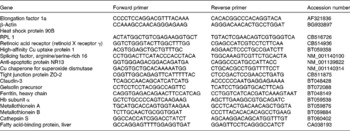
RPL 1, RNA polymerase 1.
Constant amounts of 250 ng RNA were reverse transcribed to cDNA on a GeneAmp® PCR 9700 machine (Applied Biosystems), using the TaqMan® reverse transcriptase kit with oligo(dT) primers (Applied Biosystems) in 30 μl of reaction volume. Samples were run in triplicate wells, and one ninety-six-well cDNA plate was made for the intestinal and one for the liver samples. Each plate contained a dilution curve (from a pooled sample) for the determination of amplification efficiency, in addition to non-template and non-amplification controls. For real-time PCR, SYBR® Green I Mastermix (Roche), forward and reverse primers and cDNA were mixed in 384-well plates using a Biomek® 3000 Laboratory automation workstation (Beckman Coulter, Fullerton, CA, USA). Thermal cycling was performed on a LightCycler® 480 System (Roche Applied Science, Indianapolis, IN, USA) according to the following protocol: pre-incubation at 95°C, forty-five cycles of amplification with 10, 20 and 30 s at 95, 60 and 72°C, respectively. Finally, melting curve analysis was carried out between 65 and 95°C to confirm the presence of a single amplified product.
Quantitative PCR data analysis
Cycle threshold values were calculated using the second maximum derivative method in LightCycler® software. Efficiency was determined by the formula E = 10^( − 1/slope), with the slope of the linear curve of cycle threshold values plotted against log dilution(Reference Higuchi, Fockler and Dollinger45). The stability of the reference genes was evaluated by geNorm(Reference Vandesompele, De Preter and Pattyn46) and NormFinder(Reference Andersen, Jensen and Orntoft47) as implemented in GenEx 4.3.5 (MultiD Analyses AB, Gothenburg, Sweden). Statistical testing was conducted with a pairwise random reallocation test in REST© 2005 (Corbett Life Sciences, Mortlake, NSW, Australia)(Reference Pfaffl, Horgan and Dempfle48), with cycle threshold values as the input variable and 5000 permutations. Results were considered significant when P values were below 0·05. However, all P values below 0·15 are given in the tables.
Results
Maize ingredients and diets
The only mycotoxin that differed between the two maize types was DON, with a level of 90 μg/kg in the GM maize, while the level in the non-GM maize was below the detection limit ( < 2·5 μg/kg; Table 3). The levels of all other analysed mycotoxins were below their detection limits in both maize types. Several metabolites were present in different levels in the GM and non-GM maize (Table 4). The content of the sugar alcohols arabitol, sorbitol and mannitol was 3·4-, 3·7- and 2·9-fold higher in the non-GM maize, while maltose was 2·9-fold higher. Of organic acids, benzoic acid was 2·4-fold higher, while gluconic acid, δ-lactone and gluconic acid were 3·3- and 2·4-fold higher, respectively. p-Coumaric acid, (E)-cafferic acid, erythronic acid and galactonic acid were also higher in the non-GM maize: 2·1-, 2·4-, 2·5- and 2·4-fold, respectively. The most pronounced difference, however, was methyl linoleate, which was 78-fold higher in the non-GM maize. Total levels of sugars and fatty acids were similar in both maize types, while there was a 2·1-fold difference in the total level of organic acids, mainly due to higher levels of phosphoric and gluconic acid in the non-GM variety. Of the sixty-three measured metabolites, forty-eight compounds were confirmed based on Skogerson et al. (Reference Skogerson, Harrigan and Reynolds49) (i.e. approximately 75 %).
Mycotoxins in the non-GM and GM maize varieties used in the feeds (in μg/kg)
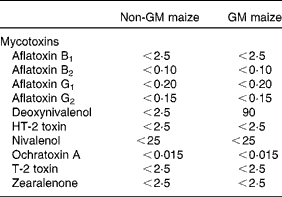
(Mean values of three analytical parallels and standard deviations)

n.i., Not identified.
* Mean value was significantly different from that for the non-GM maize (P < 0·05).
Microarray results
Some of the arrays hybridised with intestinal samples exhibited poor quality, based on log plots of red v. green channel intensity. Good-quality samples exhibited a relatively tight distribution cloud around the diagonal, while the poor-quality samples exhibited a poor relationship between the two channels. After removal of poor-quality samples with obvious technical defects, seven intestinal samples from the non-GM group and five intestinal samples from the GM group were retained for further analysis. For the liver samples, all nine arrays were of acceptable quality. After pre-processing and filtering, 7061 genes were used for analysis for the intestinal samples and 7239 genes for the liver samples.
Correspondence analysis is used for the visualisation of structures in the data, to look for the greatest covariances (between samples and genes), and can reveal clustering of the samples with the most similar overall gene expression profiles. For the intestinal samples, fish fed the diets containing GM and non-GM maize were clearly separated from each other, suggesting global differences between the two groups (Fig. 2). On which day the hybridisations had been performed also appeared to have some effect. All the samples from fish fed the diet containing GM maize clustered closely together in the plot, suggesting little technical variation among these, while the non-GM samples scattered more widely in the plot, and the arrays hybridised on days 1 and 2 seemed to clearly separate from each other.
Correspondence analysis plot of the pre-processed and normalised data (only including the samples that were used in the final data analysis, not the ones excluded due to poor quality). The numbers 26–1, 26–6, 26–9, 32–6, 32–10, 34–6 and 34–7 represent the individual samples from the non-GM-fed group, while the five remaining samples (clustering closely together in the figure) are from the GM-fed group. The numbers 1–5 in squares show the day on which the hybridisations were conducted (hybridisation days 1–5). As can be seen from the plot, samples from the two diet groups were not randomised across hybridisation days, and a day effect might be apparent in the data and would be difficult to distinguish from a diet effect. The samples from GM-fed fish cluster tightly together, while there seems to be much more variation (technical or biological) between the samples of non-GM-fed fish.

The output of SAM is a ranked list of the most differentially expressed genes between the two diet groups. A t-score is calculated for each gene, and the false discovery rate (FDR, q value), which is the expected proportion of false positives on the list, is calculated by permutation and can be used to account for multiple testing. Of the 7061 genes in the distal intestine, 494 genes were identified as differentially regulated with a q value of 0. Of these, 125 genes were up-regulated in the group fed the diet with GM maize, with an average fold change of 1·7, while 369 genes were down-regulated in this group, with an average fold change of 2·4. If the FDR cut-off value had been set at 5 %, the number of differentially regulated genes would be 2490. Rank product results showed a similar picture in terms of more genes being down-regulated and also many of the same genes towards the top of the list, but FDR values were somewhat higher than with SAM. With an FDR limit of 5 %, 404 genes appeared to be down-regulated in the group fed the diet with GM maize, while sixteen appeared to be up-regulated in this group with the rank product method. With GSEA, no significantly enhanced gene sets were identified in either diet group (no gene sets with an FDR below 20 %).
From the intestinal data, eight genes were followed up by qPCR based on the SAM/rank product results. These were retinoic acid receptor (retinoid X receptor γ), high-affinity Cu uptake protein 1, Hb subunit α4, splicing factor arginine/serine-rich 16, anti-apoptotic protein NR13, Cu chaperone for superoxide dismutase (SOD), ferritin heavy chain and tight junction protein ZO-2. Furthermore, another three genes (metallothionein (MT)-A, MT-B and cathepsin S precursor) were followed up based on the Excel ranking of intensities. Microarray and qPCR results for these genes are given in Tables 5 and 6. One of the probes from the arrays that was followed up appears to have been incorrectly annotated as Hb subunit α, BLAST search in the NCBI database matched this sequence to salmon 60S ribosomal protein L14 with an e value of 6e − 142 and a query coverage of 66 %, and no matches to Hb appeared in the list. As the primer pair used for qPCR was based on the (correctly annotated) Hb subunit α sequence from the liver data, this gene was excluded from further analysis. The annotations of all other sequences followed up by qPCR were checked and found to be correct. In cases where the full mRNA sequence for salmon was available in the GenBank, this was used as a basis for designing primers. However, for two of the genes, new primer pairs were also designed from the exact nucleotide sequence that appeared on the array, but this made no difference to the results (data not shown).
Selected genes from the intestine, which were selected for the follow-up with quantitative PCR (qPCR) based on significance analysis of microarrays (SAM)/rank product results*
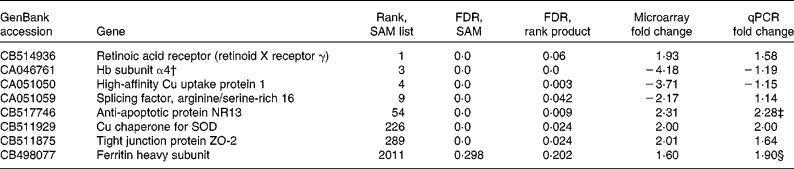
FDR, false discovery rate; SOD, superoxide dismutase.
* The rank from the SAM list and the FDR values from both the SAM and the rank product analyses are given, in addition to microarray and qPCR fold changes. P values from the qPCR data are given if below 0·15. Positive values for fold change means that the gene is up-regulated in the GM-fed group compared with the non-GM-fed group, whereas negative values means a down-regulation in the GM-fed group.
† This sequence appears to have been incorrectly annotated as Hb, BLAST search in the NCBI database matched this sequence to salmon 60S ribosomal protein L14 with an e value of 6e − 142 and a query coverage of 66 %, and no matches to Hb appeared in the list.
‡ P = 0·04.
§ NS, P = 0·12.
(hybridisations of the non-GM samples not included in the analysis)*
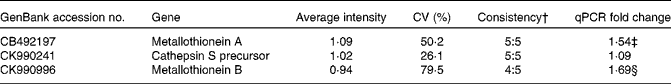
* The three selected genes were ranked numbers 1, 4 and 11 in the list of highest intensity values. P values from the qPCR data are given if below 0·15.
† Ratio of samples apparently regulated in the same direction.
‡ NS, P = 0·12.
§ NS, P = 0·06.
From the liver data, seven genes (claudin-3, gelsolin precursor, ferritin heavy subunit, MT-B, Hb subunit α, fatty acid-binding protein and Cu chaperone for SOD) were followed up based on the Excel ranking of intensities. Microarray and qPCR results for these genes are given in Table 7.
Selected genes from the liver followed up by quantitative PCR (qPCR) based on the ranked list of average intensities from the nine GM samples co-hybridised with the pooled reference sample of the non-GM-fed fish*
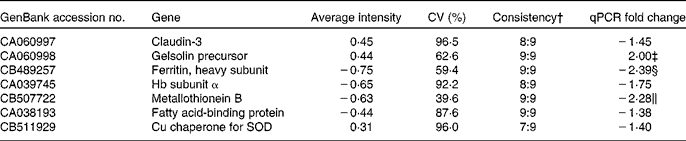
SOD, superoxide dismutase.
* P values from the qPCR data are given if below 0·15.
† Ratio of samples apparently regulated in the same direction.
‡ P = 0·033.
§ P = 0·019.
∥ NS, P = 0·07.
Quantitative PCR results
The non-amplification and non-template controls were negative for all genes. For the intestinal data, elongation factor 1α, β-actin and HSP90 were used for normalisation based on expression stability and amplification efficiency, while HSP90 and RNA polymerase 1 were used to normalise the liver data.
Of the ten genes that were tested in the distal intestine, only one was identified as significantly different between the diet groups: anti-apoptotic protein NR13. The fold difference of 2·28 obtained by qPCR for this gene corresponds well with the 2·30-fold regulation observed in the microarray data. Overall, significant correlation (r 0·85, P < 0·05, Hb was excluded) was observed between the fold changes observed in the microarray and the qPCR data. There was a tendency towards the up-regulation of both MT-A and MT-B (P = 0·12 and 0·06, respectively), and also ferritin heavy subunit (P = 0·12). However, for the two genes that appeared down-regulated in the GM group from the microarray data, no similar trend could be observed in the qPCR data. Correlation between qPCR fold changes and intensities from the Excel analysis was also significant (r 0·65, P < 0·05). The qPCR data were also analysed, including only the exact same individual samples that were used in the microarray dataset; however, results regarding fold changes were very similar to the data that are presented, but none of the genes had P values below 0·15, due to a smaller sample size than for the full dataset (results not shown).
In the liver, gelsolin precursor was significantly up-regulated with a fold difference of 2·0 (P = 0·03), while ferritin heavy subunit was significantly down-regulated (P = 0·02) with a fold difference of − 2·39. There was also a tendency towards the down-regulation of MT-B (fold change: − 2·28, P = 0·07). Since only the group fed the diet with GM maize was hybridised, no fold change values were available from the microarray data for comparison, but there was a relatively good agreement between the directional change in the qPCR data and the average intensities from the microarray data, and these values were significantly correlated (r 0·66, P < 0·05).
Discussion
The present study is part of a larger feeding study in which nutritional, physiological, stress and immune responses were evaluated and published elsewhere(Reference Sagstad, Sanden and Haugland16, Reference Hemre, Sagstad and Bakke-McKellep17, Reference Frøystad-Saugen, Lilleeng and Bakke-McKellep26). The analyses reported in the present study were conducted on preserved samples from this trial, to further elaborate the differences observed. The main findings reported in the previous studies were that fish fed the diet containing GM maize had significantly lower feed intake, resulting in reduced growth, but with no differences in feed conversion or digestibility. The relative sizes of the liver and the distal intestine were higher for fish fed the diet containing GM maize, and maltase activity in mid- and distal intestine and Na-dependent d-glucose uptake were also significantly higher. Evaluating stress and immune response-related biomarkers, higher levels of granulocytes and of granulocytes plus monocytes relative to lymphocytes in the blood, higher total SOD enzyme activity both in the liver and distal intestine, lower catalase activity in the liver and an increased protein level of HSP70 in the liver have been reported(Reference Hemre, Sagstad and Bakke-McKellep17). The design also included a reference diet containing suprex maize, with a similar macronutrient composition as the experimental diets. Regarding some parameters, the reference group was intermediate between the GM and non-GM groups (i.e. growth and liver index) and not significantly different from either, indicating that fish in both diet groups were within the normal range for healthy salmon. However, the present experiment was carried out to shed some light on these observed differences by identifying possible differences between the two maize ingredients that might be responsible, and using microarray to screen for the effects on the fish as the previous study has shown significant effects on several physiological parameters, but has been unable to elucidate the cause/mechanism of these effects.
Microarray is often considered a tool for the generation of hypotheses, rather than a method for providing all the answers. We chose to allow 40 % missing values due to the high level of noise present in the data, in order not to lose valuable information. This, in addition to the suspicion of potential day or batch effects, made it crucial to verify the microarray results for the intestine by qPCR. The liver microarray data could not be used to draw inferences but simply to generate hypotheses for further testing; as the group fed the diet with non-GM maize was only represented by one pooled sample and statistical testing was not possible. Furthermore, the pooled non-GM sample was consistently labelled with Cy5, while the GM samples were labelled with Cy3, which would confound diet effects with dye bias(Reference Tseng, Oh and Rohlin50–Reference Smyth, Yang, Speed, Brownstein and Khodursky52). Dye bias could explain the better correlation obtained for the intestinal data between qPCR and microarray fold differences (r 0·85) compared with the correlation between qPCR and intensity values of only the GM-fed group hybridised against the reference (r 0·65). From this, it appears that day or batch effects, if present, are at least less prominent than the dye bias and may not present a problem.
However, some discrepancies between the microarray and qPCR results are not readily explained. Especially, the down-regulated genes in the microarray were not verified by qPCR. There were more regulated genes and larger fold changes in this direction, which might indicate a systematic bias. The positively regulated genes, on the other hand, were generally supported by the qPCR data regarding the direction and magnitude of the change, although the qPCR results were non-significant for most genes, and the statistical confidence in the microarray analysis appears overestimated. Rank product might be more realistic than SAM in terms of FDR values, but this analysis also revealed many down-regulated genes (including the two that were not verified by qPCR). The FDR is the ratio of false positives to rejected hypotheses (ratio of features expected to be false discoveries)(Reference Benjamini and Hochberg53). It is surprising that this value is zero in the SAM analysis for a long list of genes, despite modest fold differences. Due to large variations in gene expression data, twofold or greater differences are often required to achieve statistical significance, although this will also depend on the level of replication. However, many, if not most, biological processes involve less than twofold changes(Reference Bild and Febbo54). Modest fold changes have often been reported in nutrigenomic studies(Reference Jordal, Torstensen and Tsoi55, Reference Garosi, De Filippo and van Erk56).
In order to better understand the long list of differentially regulated genes, GSEA could be a useful approach(Reference Subramanian, Tamayo and Mootha40). Despite the large number of apparently up- or down-regulated individual genes, no gene sets were significant. This could support the theory that the genes that came up in the SAM list as differentially regulated are caused by artefacts and do not represent true biological effects, in which case one would expect to see some pattern with certain pathways (gene sets) being affected. However, this could also reflect on the poor annotation of the salmon genome; unknown sequences on the array will not be included in gene sets, which can reduce the usefulness of GSEA. Approximately 25 % of the genes on the cGRASP array are uncharacterised, and about one-third of the known sequences lack a functional annotation.
qPCR is the most frequently used method for reliable quantification of gene expression(Reference Rajeevan, Ranamukhaarachchi and Vernon57) and is generally considered to be more accurate than microarray. Up-regulation of anti-apoptotic protein and also a tendency towards the up-regulation of both MT-A, MT-B and ferritin heavy subunit in the distal intestine detected by qPCR indicate that there is a differential effect of the two feeds on the fish. In salmonids, there are two MT isoforms, MT-A and MT-B, which seem to possess slightly different roles, although these are not fully explored(Reference Vergani, Sigel, Sigel and Sigel58). MT are assumed to have roles related to the regulation of physiological metals, detoxification of xenobiotic metals and scavenging of free radicals and reactive oxygen metabolites, although the mechanisms are not completely understood(Reference Kaji, Yamamoto and Tsubaki59–Reference Kang62). MT are often used as indicators for heavy metal exposure in fish and also of cellular stress, as they are induced by acute physical stress as well as by glucocorticoid hormones(Reference Farag, Stansbury and Hogstrand63, Reference Olsson, Hochachka and Mommsen64). There is no in vivo evidence of antioxidant properties of MT in fish, but this has been indicated by in vitro studies(Reference Vergani, Sigel, Sigel and Sigel58). Physiological metals, such as Cu, Zn and Fe, with redox properties, and thus also MT, have roles in apoptosis, which can be induced by oxidative damage(Reference Formigari, Irato and Santon65). A difference in mRNA expression of MT could suggest differences in mineral/heavy metal content between the diets; however, mineral mix was added in equal amount to both diets, and the selection of analysed minerals exhibited minor differences between the diets (Table 1, footnote).
There were also indications of changes in antioxidant status in the liver, with the up-regulation of gelsolin precursor, down-regulation of ferritin heavy chain and a tendency towards the down-regulation of MT-B. Gelsolin is an actin-binding protein and a key regulator of actin filament assembly and disassembly, which is important in cell motility. It may possibly also inhibit apoptosis by stabilising mitochondria, although this role is somewhat controversial and may be involved in gene regulation(Reference Silacci, Mazzolai and Gauci66). Ferritin is a key molecule in limiting pro-oxidant stress and plays an important role in Fe homeostasis. Expression of ferritin heavy subunit in mammals is induced by cytokines and inflammation, and also by hormones, growth factors and second messengers(Reference Torti and Torti67). Furthermore, it is up-regulated by oxidative stress. Both transcriptional and post-transcriptional mechanisms for this induction have been suggested(Reference Torti and Torti67), which might limit the changes observed on an mRNA level as in the present study. It is interesting to note that both MT-B and ferritin heavy subunit exhibit opposite trends in the liver and distal intestine.
The results from both the liver and distal intestine strengthen the indications of differences in cellular stress response/oxidative stress between fish fed diets containing GM and non-GM maize. In a previous work on the same fish as used in the present study, changes were detected in the enzyme activity/protein levels of SOD, catalase and HSP70, but changes were not detected in transcription of the corresponding genes(Reference Sagstad, Sanden and Haugland16), thus these effects would not have been detected in a microarray study. Low correlation is often observed between mRNA and protein; protein levels are determined by degradation and secretion, as well as by transcription, and there are post-translational modifications and time discrepancies between mRNA and protein expression(Reference Pratt, Petty and Riba-Garcia68–Reference Kuo, Kuo and Liang70). Another issue is how to interpret changes detected in gene expression. If there is an up-regulation of antioxidant defences, this does not necessarily mean that the fish are stressed; they may still be able to maintain homeostasis. However, this may require additional energy, thus affecting growth, and may also render the fish more vulnerable to infectious diseases or other secondary stressors.
Inconsistent and confusing results have been obtained when three feeding trials with diets containing GM maize in fish feed were carried out. The main conclusion in the three trials ranges from no difference(Reference Sanden, Krogdahl and Bakke-McKellep71), reduced growth and stress response in salmon fed GM maize diets(Reference Sagstad, Sanden and Haugland16, Reference Hemre, Sagstad and Bakke-McKellep17) (the trial from which samples were obtained for the present study), and reduced growth and stress response in zebrafish fed non-GM maize diets(Reference Sissener, Johannessen and Hevrøy29). A possible explanation could be varying levels of mycotoxins, which have been used to explain higher weight gain in the GM-fed group in studies with broilers, broiler chicks and piglets(Reference Flachowsky, Chesson and Aulrich72), although cause–effect relationships were not established. It is not known whether the level of 90 μg/kg of DON in the maize, which would constitute 27 μg/kg in the feed, has any negative effect on fish, but salmon is known to be particularly sensitive to harmful plant components. In rainbow trout (Salmo gairdneri), DON concentrations from 1000 μg/kg caused growth depression(Reference Woodward, Young and Lun73), but lower concentrations were unfortunately not tested. The European Food Safety Authority has set the tolerable daily intake for humans at 1 μg/kg body weight per d(28).
Regarding the stress and antioxidant responses reported previously in the fish used for the present study(Reference Hemre, Sagstad and Bakke-McKellep17), various mycotoxins have been shown to increase HSP70 expression in rat brain, the placenta of pregnant rats, rat fetal livers and cell cultures(Reference Sehata, Kiyosawa and Makino74–Reference El Golli, Hassen and Bouslimi76), and to increase SOD-1 in rat brain(Reference Sehata, Kiyosawa and Makino74), but decrease it in the liver of pregnant rats(Reference Sehata, Kiyosawa and Sakuma75). DON induces lipid peroxidation in human intestinal cells(Reference Kouadio, Mobio and Baudrimont77), which could explain the indications of oxidative stress in our fish. In rat liver culture, there was a concentration-dependent increase in oxidative stress caused by DON, increased lipid peroxidation and decreased SOD, while antioxidant supplementation protected against toxicity(Reference Sahu, Garthoff and Robl78). In a hepatic cell line, DON exposure seemed to cause the generation of reactive oxygen species, and increased catalase and SOD activities(Reference Bodea, Munteanu and Dinu79). Furthermore, feedstuffs naturally contaminated with the mycotoxins DON and zearalenone decreased the number of lymphocytes and total leucocytes in hens(Reference Chowdhury, Smith and Boermans80), which also seems to fit with results reported from fish in the present study(Reference Hemre, Sagstad and Bakke-McKellep17). Apoptosis has been suggested as one of the main mechanisms of DON toxicity in intestinal cells(Reference Maresca, Mahfoud and Garmy81), which fits with the up-regulation of anti-apoptotic protein in the intestine of our salmon fed the GM maize diet. Our observed down-regulation of MT-B in the liver is consistent with reports on rats fed mouldy wheat containing DON in addition to other mycotoxins(Reference Vasatkova, Krizova and Adam82). However, treatment with DON slightly decreased d-glucose uptake in mice(Reference Hunder, Schümann and Strugala83), and in human epithelial cells, the Na-dependent d-GLUT were strongly inhibited by DON(Reference Maresca, Mahfoud and Garmy81). This is contrary to the results reported in our salmon(Reference Hemre, Sagstad and Bakke-McKellep17), where the intestine from fish fed the diet containing GM maize exhibited increased glucose uptake.
Large variability in mycotoxins is observed between locations and growing seasons both in GM and non-GM maize, but the general trend is reduced levels in Bt-maize compared with conventional maize varieties, due to better resistance against Fusarium spp. when there is limited insect damage to the plant(Reference Bakan, Melcion and Richard-Molard84–Reference Munkvold, Hellmich and Showers87). When data on the relationship between mycotoxins (fumonisins, DON and zearalenone) and Bt-maize were reviewed, nineteen out of twenty-three studies have shown that mycotoxin concentrations were higher in non-GM varieties, but regarding DON specifically, the relationship was less clear with five against three studies(Reference Ostry, Ovesna and Skarkova88).
Differences were observed in metabolite profiles between the two maize varieties, but this is to be expected in crops grown in separate fields; growing season and location are generally more prominent factors causing variation than genetic background(Reference Skogerson, Harrigan and Reynolds49, Reference Röhlig, Eder and Engel89–Reference Röhlig and Engel91). This was also the case for protein expression when GM maize was compared with its near-isogenic line, but differences due to the particle bombardment were also detected(Reference Zolla, Rinalducci and Antonioli92). Reasons for the particularly large fold difference in methyl linoleate are not clear, but linoleic acid-derived hydroperoxides are supposed to be modulators of mycotoxin biosynthesis in plants(Reference Boutigny, Richard-Forget and Barreau93). Interestingly, p-coumaric acid, benzoic acid and (E)-cafferic acids were also higher in the non-GM maize. p-Coumaric, benzoic and caffeic acids have been shown to be elevated in wheat strains with a high degree of resistance to Fusarium infection(Reference Hamzehzarghan94). The non-GM maize also had higher levels of mannitol, which is increased in response to salt and osmotic stress, but possibly also has a role in response to pathogen attack(Reference Stoop, Williamson and Mason Pharr95). Gluconic acid, a mild organic acid derived from glucose, was also higher in the non-GM maize. Gluconic acid is abundantly present in plants but is also produced by various micro-organisms and fungi; the mycotoxin-producing fungus Aspergillus niger is commonly used in industrial production(Reference Ramachandran, Fontanille and Pandey96). It has also been shown that gluconic acid can function as an anti-fungal compound in plants(Reference Kaur, Macleod and Foley97). Potentially, one or several of the metabolites exhibiting different levels in the GM and non-GM maize could be related to effects observed in the fish. However, lack of relevant literature regarding effects of these metabolites on production animals, including fish, makes it difficult to speculate. As maize is a commonly used feed ingredient, one might expect that if any of these metabolites had equally negative effects on the health, feed intake and growth of production animals as mycotoxins, such literature would have existed. Cry proteins represent another difference between GM and non-GM maize ingredients. However, salmon diets are extruded (heat-treated under pressure), which would be expected to denature(Reference De Luis, Pèrez and Sánchez98), as has also been found for zebrafish diets receiving less heat treatment than commercial salmon diets(Reference Sissener, Johannessen and Hevrøy29). Consequently, we consider DON a more likely cause of the observed effects than any of the other differences in metabolites, although the evidence for DON as a causative factor is circumstantial and requires direct testing.
The use of near-isogenic lines in the evaluation of GM plants, despite being the recommended control(99, 100), is not perfect in this regard, as shown by both the mycotoxin and metabolite analyses of our two maize types. When numerous differences are present between the GM and non-GM varieties, some of which might be due to unintended effects of the genetic modification, while others are random differences that would vary between locations and seasons even in genetically identical cultivars, it becomes challenging to elucidate the cause of observed differences in animals fed these plants. Regarding fish, more knowledge is required on the effect of low mycotoxin doses in order to distinguish these from potential ‘GM effects’. The present microarray data support and strengthen indications of changes in cellular stress/antioxidant status observed previously in the liver and distal intestine of these fish. However, it cannot be concluded whether the observed effects can be attributed to the analysed difference in DON or to another aspect of the GM maize ingredient.
Acknowledgements
We are grateful to Matthew Rise at the University of Victoria, Canada, and Susan Douglas at the Institute for Marine Biosciences (NRC IMB), Canada, for helping with the microarray design. We thank Jacob Wessels for great technical assistance before, during and after the feeding trial and Betty Irgens for technical assistance at the molecular laboratory. The authors wish to acknowledge the support of the Norwegian Research Council (grants no. 142474 and 172151) and of the OECD's Co-operative Research Program: Biological Resource Management for Sustainable Agriculture Systems in the funding of the present study. The maize ingredients used in the present study were obtained from the Monsanto Company, but no economical funding or further support was received from this company. Consequently, the authors state that there are no conflicts of interest regarding the present study. The contributions of the authors were as follows: M. S., G.-I. H. and A. S. participated in the planning of the feeding trial and diets, A. S. isolated and tested the quality of RNA, and M. S., together with S. P. L. and J. W., planned and conducted the microarray laboratory work in Canada. K. P. was responsible for the pre-processing and quality control of the microarray data at CBU. J. R. conducted the analysis and verification of metabolites in the maize samples. N. H. S., in collaboration with M. S., analysed the microarray data, performed the qPCR laboratory work and analysis, and was the main author. All authors have given inputs in the writing process and proofread the manuscript.


