


Introduction
Cardiac arrest (CA) often leads to devastating outcomes with patient failure to regain consciousness mainly attributed to postanoxic encephalopathy.Reference Carr, Kahn, Merchant, Kramer and Neumar1–Reference Zandbergen, de Haan, Stoutenbeek, Koelman and Hijdra5 However, some patients regain consciousness in the first few days while others recover after several months of persistent vegetative state (VS) periods; therefore, predicting clinical outcomes in the acute phase of postanoxic encephalopathy is a difficult but important task. For this purpose, many assessment tools including electroencephalography (EEG), P300s, and somatosensory evoked potentials, or magnetic resonance imaging (MRI) have been used to inform consciousness recovery prognoses. EEG has been widely used due to its portability and availability in the ICU and its ability to measure brain activity to determine prognosis in postanoxic patients. Various electroencephalographic patterns including isoelectric, low voltage, myoclonus with an EEG correlate, a nonreactive background, or burst suppression have been shown to correlate with poor prognosis.Reference Bisschops, van Alfen, Bons, van der Hoeven and Hoedemaekers6–Reference Rundgren, Rosen and Friberg11 Other patterns, such as diffuse slow-wave activity, were correlated with a better prognosis.Reference Kawai, Thapalia and Verma12
Early recovery of consciousness in the first few days after CA is one of the most explicit and self-evident prognostic factors for long-term and ultimate clinical outcomes; the failure to regain consciousness often forces physicians to stand at the crossroads and decide if the probability of consciousness recovery is favorable or not and then determine what therapeutic interventions are necessary in a patient’s best interests.Reference Fugate, Wijdicks and Mandrekar7,Reference Bouwes, Binnekade and Kuiper13–Reference Tjepkema-Cloostermans, Hofmeijer, Trof, Blans, Beishuizen and van Putten15 Despite the importance of early consciousness recovery, the majority of post-cardiac resuscitation procedure (CPR) studies have evaluated long-term prognostic outcomes on the scale of months.
The aim of this retrospective cohort study was to evaluate the role and clinical implications of EEG for predicting early recovery of consciousness after CA. The American Clinical Neurophysiology Society’s (ACNS) Standardized Critical Care EEG Terminology criteria have been widely used in the critical care field and it is regarded as the standard EEG classification for the critically ill patients.Reference Hirsch, LaRoche and Gaspard16 To this end, we evaluated the associations between initial EEG patterns and level of consciousness cross-sectionally. We then evaluated specific EEG patterns with respect to consciousness state trajectories longitudinally.
Material and Methods
Ethical Approval
All aspects of this study were approved by our Institutional Review Board, and informed consent was waived because of minimal risk to subjects.
Subjects and Study Protocol
We examined a cohort of consecutive patients resuscitated following CA from April 2015 to November 2017 in the intensive care unit of our tertiary medical center. We excluded those with arrest due to traumatic brain injury, neurodegenerative disease, or exsanguination and those transferred to our institution more than 24 hours after return of spontaneous circulation (ROSC). Patients were treated with standardized protocols based on their specific clinical situations. At our institution, all comatose patients after CA are admitted to the ICU and undergo EEG upon ICU arrival at an average of 6 hours after ROSC. If clinical seizures are suspected or there are subclinical electrographic seizures on EEG study, EEG monitoring is maintained for several days for seizure treatment. If initial EEG shows non-epileptiform discharges or patients do not manifest clinical seizures, we perform EEG daily for 30 minutes, but this may convert to continuous EEG anytime if seizures are identified during follow-up.
Patients placed on targeted temperature management (TTM) are infused with iced saline to obtain a 33°C core body temperature. Cooling is maintained for 24 hours with a target temperature of 33°C after which we perform rewarming at 0.3°C/h.
Clinical information on age, sex, history of hypertension, diabetes mellitus, ischemic heart disease, congestive heart failure, chronic kidney disease, hepatic disease, strokes of any type, and use of TTM were obtained. In our institution, detailed clinical evaluations including neurological examination, Glasgow Coma Scale (GCS) scores, the presence of convulsive seizures, and vital signs are documented every 2 hours in the ICU.
EEG Recordings and Analyses
We acquired standard EEG recordings with pad electrodes according to the International 10–20 system for electrode placement with additional subtemporal electrodes (T1/T2). The minimal EEG duration was 30 minutes. Visual EEG analysis was performed on blinded data by two experienced specialists (IUS and SWC). Predominant EEG patterns obtained at 3 days after CA (or at 3 days after TTM) were classified according to the ACNS Standardized Critical Care EEG Terminology criteria,Reference Hirsch, LaRoche and Gaspard16 into periodic discharges (PDs), rhythmic delta activity (RDA), spike-and-wave or sharp-and-wave (SW), low voltage (<20 uV; including suppressed voltage <10 uV), and burst suppression. If EEG patterns did not conform to any of the above patterns including diffuse slow-wave activity or background delta or theta slow activity, it was classified as other patterns. EEG patterns which were present in >50% of the record or epoch that included the pattern were considered predominant (“abundant” and/or “continuous”) for the purposes of EEG pattern classification. Because EEG activity may be disturbed or suppressed within 24 hours after CA, even in patients with a good outcome,Reference Hofmeijer, Beernink, Bosch, Beishuizen, Tjepkema-Cloostermans and van Putten8,Reference Cloostermans, van Meulen, Eertman, Hom and van Putten14,Reference Tjepkema-Cloostermans, Hofmeijer, Trof, Blans, Beishuizen and van Putten15,Reference Hofmeijer, Tjepkema-Cloostermans and van Putten17,Reference Tjepkema-Cloostermans, van Meulen, Meinsma and van Putten18 we analyzed the EEG findings at 3 days after CA (or at 3 days after TTM) to clear the potential sedation effect.
Assessment of Consciousness Status
Our primary outcome of interest was early recovery of consciousness documented by repeated clinical examinations using GCS scores, and our secondary outcome was mortality within 28 days. (During the period of this study, the active withdrawal of life-sustaining measures was not allowed in this country.Reference Ahn and Bae19 The law of the withdrawal of life support practices had been only recently enacted in the year of 2018.) Before performing assessments of consciousness status in our institution, we attempt to increase arousals as maximally as possible to reduce diagnostic error and gain best performance GCS score. Among the GCS scores documented every 2 hours, we analyzed the highest GCS scores per day at the day of CA, 3 days after CA (or at 3 days after TTM), and at 10 days after CA (or at 10 days after TTM) to evaluate early recovery of consciousness. Clinical assessments of functional outcomes were performed at 1 month using modified Rankin scale (mRS scores ranging from 0 [no symptoms] to 6 [death]).Reference van Swieten, Koudstaal, Visser, Schouten and van Gijn20
Statistical Analyses
All statistical analyses were performed using SPSS for Windows version 13.0 (SPSS Inc., Chicago, IL, USA). Independent t-tests were used to compare continuous variables. Pearson’s chi-squared tests were used to compare categorical variables. Kruskal–Wallis H test was used to compare ordinal variables. Values are expressed as means ± standard deviations or median with interquartile range. To assess longitudinal changes in GCS scores based on specific EEG patterns, repeated measures analysis of variance (ANOVA) was performed at each time point. Variables were entered into our models as covariates when significance levels in univariate analysis were p < 0.20. Statistical significance was assumed at p < 0.05.
Results
Baseline Characteristics
A total of 71 consecutive patients after CA were enrolled. Table 1 shows the clinical and demographic characteristics of the entire study population and by EEG patterns. The study population included 31 (43.7%) women, and the mean age was 64.1 ±13.1 years. Hypertension (n = 27, 38%) was the most frequent past medical history, followed by diabetes mellitus (n = 18, 25.4%), stroke (n = 11, 16.7%), chronic kidney disease or on dialysis (n = 8, 11.3%), ischemic heart disease (n = 6, 9%), congestive heart failure (n = 5, 7.5%), and hepatic disease (n = 3, 4.2%).
Baseline characteristics by EEG subtypes

Values are mean ±standard deviation, median with IQR (interquartile range), and the number of patients (%).
Chi-square test was used for categorical variables and analysis of variance (ANOVA) for continuous variables.
† Sedative agents included fentanyl, remifentanil, dexmedetomidine, and propofol.
‡ Anti-seizure medications included valproate, levetiracetam, topiramate, and phenobarbital.
Among the total of 71 patients, with the analysis of the EEG findings at 3 days after CA (or at three days after TTM), 9 were grouped as having a predominant EEG pattern of PDs, 4 were RDA, eight were SW, 22 were low voltage, 5 were burst suppression, and 23 were other EEG patterns. In the other EEG pattern group with 23 subjects, 17 had diffuse delta or theta slow-wave activity and 6 had background slow activity. The mean duration of asystole time was 17.0 ± 11.3 minutes, and 27 (38%) patients manifested convulsive seizure for 10 days of follow-up yet there were no significant differences between all EEG patterns groups. TTM was applied in 27 (38%) patients, but there were also no significant differences between each group. However, the continuous infusion of sedative agents and the use of anti-seizure medications differed significantly between the EEG patterns groups. The sedative agents that were used included fentanyl, remifentanil, dexmedetomidine, and propofol, while continuous intravenous benzodiazepines were not used in all EEG patterns groups. The administration of sedative agents was significantly prevalent in the burst suppression group (n = 3, 60%). The anti-seizure medications that were administered were valproate, levetiracetam, topiramate, and phenobarbital and were used most frequently in the SW group (87.5%). There was also a significant difference in the reactivity to external stimuli on EEG between the EEG patterns groups. The reactivity was most frequently observed in the other EEG groups (52.2%).
In laboratory tests, the mean values for white blood cell count (13.8 ± 6.1 × 10³/ul), C-reactive protein (124.5 ± 53.6 mg/l), blood urea nitrogen (33.5 ± 24.3 mg/dl), creatinine (1.5 ± 1.3 mg/dl), aspartate aminotransferase (143.7 ± 259.5 U/l), and alanine aminotransferase (113.9 ± 188.5 U/l) were elevated above the normal reference ranges, yet these did not differ significantly between each EEG pattern group.
Association between Initial EEG Patterns and GCS Scores by Kruskal–Wallis H test
Initial GCS scores, GCS scores 3 days after CA (or 3 days after TTM), and 10 days after CA (or 10 days after TTM) were significantly different among EEG subtypes (p < 0.001, respectively) (Table 2). Initial GCS scores were significantly higher in RDA and the other EEG group compared to the PDs, SW, low voltage, and burst suppression groups (p < 0.001), and these differences maintained throughout the 10-day follow-up (p < 0.001). The interval change of the GCS scores during the 10-day follow-up was highest in the other EEG group (p < 0.001). Figure 1 and Supplementary table show the changes of GCS scores and the daily GCS scores within 10 days after CA by each specific EEG patterns.
GCS scores for 10 days follow-up and functional outcome and mortality within 28 days by EEG subtype
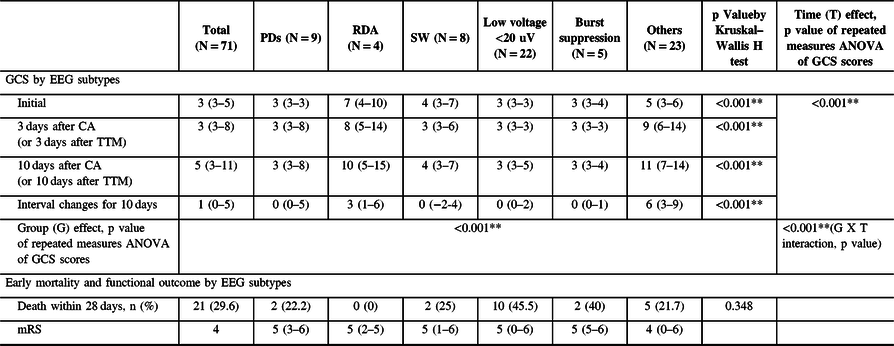
Values are mean ±standard deviation, median with IQR (interquartile range), and the number of patients (%).
Chi-square test was used for categorical variables and analysis of variance (ANOVA) for continuous variables.
Group (G) effect, Time (T) effect, and G × T interaction were analyzed by repeated measures ANOVA (gray-colored columns and rows) adjusted by the cofounding covariates: EEG reactivity to external stimuli and the use of sedative and anti-seizure medications.
Changes in GCS within 10 days after CA by each EEG subtype.

Group and Time Effect of EEG Patterns on GCS Scores by Repeated Measures ANOVA and Evolution of EEG Patterns
Gray-colored columns and rows in Table 2 show the effects by each specific EEG pattern group (the intergroup effect), time (from 3 days after CA to 10 days after CA: the intra-group effect), and the group × time interactions (reflecting whether there was a significant influence of specific EEG patterns on temporal changes in GCS scores) adjusted by the confounding covariates including EEG reactivity to external stimuli and the use of sedative and anti-seizure medications.
Significant group × time interactions were observed for the follow-up period (p < 0.001), suggesting that there was significant impact of specific EEG patterns on temporal changes in GCS scores for 10 days. The GCS scores increased the most in the other EEG pattern group and the least in the PDs, low voltage, burst suppression, and SW EEG pattern groups (p < 0.001 by Kruskal–Wallis H test). There were also significant group and time effects of EEG pattern (p < 0.001).
During the follow-up period, other EEG patterns different from the initial predominant EEG patterns were observed in 26 (33.8%) patients. The PDs group had been accompanied by SW and/or RDA patterns subsequently (n = 3, 33.8%). The SW group had been accompanied by RDA and PDs (n = 3, 37.5%). Five (22.7%) patients in the low-voltage group had RDA concomitantly. The burst suppression group had been accompanied by EEG seizure (polyspike and wave complex in 2 Hz frequency) in one (20%) patient. Fourteen (60.9%) patients in the other EEG pattern group had a concomitant RDA pattern.
Early Mortality and Functional Outcomes at One Month by EEG Subtype
A total of 21 (29.6%) patients died within 28 days after CA (Table 2). This early mortality was highest in the low-voltage group (45.5%) followed by the burst suppression (40%), SW (25%), PDs (22.2%), others (21.7%), and RDA (0%) groups. However, there were no statistically significant differences among groups. All groups had severe disability (mRS 4-5) at 1 month.
Discussion
In this study, we showed the significant impact of specific EEG patterns on temporal changes in GCS scores for 10 days (group × time interactions). Initially, specific EEG patterns were independently associated with an early consciousness state within 10 days (group effect). This significant association mainly resulted from the findings that the PDs, SW, low voltage, and burst suppression EEG pattern groups showed a significantly decreased initial consciousness state compared to the RDA and the other EEG pattern groups. Most of the early recovery of consciousness occurred within 3 days after CA and afterward recovery was modest. This suggests that EEG patterns may predict both an early consciousness state and the extent of the recovery degree within 10 days.
Most studies investigating post-CPR have evaluated long-term outcomes such as neurologic outcome at several months or survival to hospital discharge.Reference Crepeau, Rabinstein and Fugate2,Reference Hofmeijer, Beernink, Bosch, Beishuizen, Tjepkema-Cloostermans and van Putten8,Reference Elmer, Rittenberger and Faro21 This study focused on early recovery of consciousness within 10 days, and in this regard, we evaluated the validity of EEG’s potential usefulness for predicting early recovery using widely accepted EEG classifications (the ACNS’s Standardized Critical Care EEG Terminology criteria) in the ICU for critically ill patients.
Our findings in this study with regard to the association between EEG patterns and clinical outcomes are consistent with those of previous studies. Despite their evaluating longer-term clinical outcomes than were evaluated in this study, our study also demonstrated that PDs, low voltage, and burst suppression were associated with worse consciousness state within 10 days of CA.Reference Bisschops, van Alfen, Bons, van der Hoeven and Hoedemaekers6,Reference Hofmeijer, Beernink, Bosch, Beishuizen, Tjepkema-Cloostermans and van Putten8,Reference Rossetti, Carrera and Oddo10,Reference Rundgren, Rosen and Friberg11,Reference Elmer, Rittenberger and Faro21–Reference Young23 These results suggest that the poor prognosis in patients with PDs, low voltage and burst suppression EEG patterns can be applied to the early acute phase after CA. The mortality within 28 days was also highest in the low voltage and burst suppression groups in our study, although not statistically significant.
Our study has several limitations. Our cohort size was insufficient to allow a conclusive result. Furthermore, the observational study design (which was inevitable due to the characteristic clinical situations of CA) as well as ICU care (where an enormous number of confounding factors may occur and influence clinical outcomes) combines to make the power of this study weak. For instance, there were large variances in the standard deviations of the GCS scores in several groups. However, we could not identify other factors resulting in the outliers beyond the variables that were used in the analysis of this study. In addition, the use of GCS is one of the limitations of this study. Although GCS is the most widely used and was developed to describe the level of consciousness in the ICU, there are significant limitations associated with use of this scale,Reference Moskopp, Stahle and Wassmann24,Reference Rowley and Fielding25 and recently, many other coma scales such as the Coma Recovery Scale – Revised (CRS-R) have been developed to assess level of consciousness with better test–retest reliability, intra/inter-rater reliability, as well as concurrent validity.Reference Bodien, Carlowicz, Chatelle and Giacino26,Reference Giacino, Kalmar and Whyte27 Future large sophisticated studies are needed to confirm these results and help clinicians make more accurate neurological prognostications.
In conclusion, consciousness states were significantly worse in PDs, SW, burst suppression, and low-voltage EEG pattern groups compared to the RDA and the other EEG pattern group including diffuse slow-wave activity and background delta or theta slow activity within 10 days after CA. There was also a significant impact of specific EEG patterns on temporal changes in GCS scores for 10 days. The GCS scores increased the most in the other EEG pattern group and the least in the PDs, SW, burst suppression, and low-voltage EEG pattern groups. Most of the early recovery of consciousness occurred within 3 days after CA and afterward recovery was modest.
Conflict of Interest
The authors declare that they have no competing interests.
Author Contributions
YHC and TK initiated the research and designed the protocol. YHC and TK gathered the clinical findings of patients and prepared the study protocol and documents to obtain ethical approval. IUS and SWC reviewed EEG findings of the patients. YHC and TK contributed to the writing of the manuscript. YHC and TK contributed to the final manuscript. All authors discussed the study results and approved the final version of manuscript.
Supplementary Material
To view supplementary material for this article, please visit https://doi.org/10.1017/cjn.2020.65.


