The intestinal epithelium and gut-associated lymphoid tissue is spatially separated from luminal microbes by immunoglobulins, antimicrobial peptides and a protective mucus barrier(Reference Hooper and MacPherson1). The mucus layer provides a physical barrier to prevent invasion of the epithelium by pathogens and microbial leakage into the lamina propria(Reference Okumura and Takeda2). In the colon, where the densest population of micro-organisms is found, mucus is divided into two distinct layers: a sterile inner layer that adheres to the intestinal epithelium and a loose outer layer that contains bacteria(Reference Johansson, Larsson and Hansson3). The basic skeleton of intestinal mucus layer is formed by mucins, including the predominant gel-forming MUC2 mucin produced and secreted by goblet cells(Reference Johansson, Larsson and Hansson3,Reference Johansson and Hansson4) . The depletion of goblet cells has been related to adverse health outcomes(Reference Pelaseyed, Bergström and Gustafsson5). It has been recognised that individuals with ulcerative colitis have reduced goblet cell density and a compromised mucus layer as compared with healthy controls(Reference Pullan, Thomas and Rhodes6,Reference Strugala, Dettmar and Pearson7) .
Choline is an essential dietary nutrient required for the synthesis of membrane phospholipids, formation of the neurotransmitter acetylcholine and methyl group metabolism(Reference Li and Vance8). Although common dietary constituents act as choline sources, dietary choline intake in humans varies greatly(Reference Zeisel and Da Costa9,Reference Wallace and Fulgoni10) . Evidence suggests that, for a significant number of individuals, choline consumption is far below the adequate intake(Reference Zeisel and Da Costa9). For example, only 7 % of women in developed countries and fewer in developing countries consistently achieve the daily recommended intake of choline(Reference Trujillo-Gonzalez, Friday and Munson11). Growing evidence highlights a critical role for choline in health and links inadequate choline intake to impaired liver and muscle function in humans and other animals(Reference Zeisel, Da Costa and Franklin12).
After absorption in the intestine via active transport, most dietary choline is converted to phosphatidylcholine (PC), which accounts for 95 % of the total choline pool in mammals(Reference Li and Vance8,Reference van der Veen, Kennelly and Wan13) . PC is abundant in the gastrointestinal mucus barrier where its hydrophobic properties are thought to play a role in maintaining mucus integrity(Reference Treede, Braun and Sparla14,Reference Stremmel, Merle and Zahn15) . Importantly, patients with ulcerative colitis have lower PC concentrations in the mucus layer of the distal intestine compared with healthy controls, suggesting that low PC levels might play a role in the pathogenesis of the inflammatory bowel disease(Reference Ehehalt, Wagenblast and Erben16). Clinical trials have shown beneficial effects of supplying exogenous PC in a modified-release capsule (that prevents absorption in the proximal intestine) to the colonic epithelium of ulcerative colitis patients(Reference Stremmel, Merle and Zahn15,Reference Karner, Kocjan and Stein17,Reference Stremmel, Ehehalt and Autschbach18) . While these data suggest that exogenous PC might have anti-inflammatory effects in the setting of colitis, the role that choline, the diet-derived substrate for de novo PC synthesis, plays in protecting against colonic infection and inflammation remains poorly understood. In the present study, we aimed to characterise the role that dietary choline plays in maintaining colonic immune homoeostasis in the context of infectious colitis.
In addition to dietary and genetic factors, the physiological levels of choline are impacted by the gut microbiota(Reference Waite, Cabilio and Vance19,Reference Romano, Vivas and Amador-Noguez20) . Certain gut microbes such as commensal Escherichia coli strains are capable of converting dietary choline to trimethylamine, which decreases choline bioavailability to the host(Reference Romano, Martinez-del Campo and Kasahara21,Reference Craciun and Balskus22) . Conversely, altered dietary choline levels could result in compositional changes in the gut microbiota. In a human study where dietary choline levels were manipulated, the abundance of Gammaproteobacteria and Erysipelotrichia were changed, suggesting a modulation effect of dietary choline on gut microbial composition(Reference Spencer, Hamp and Reid23). The important contributions of gut microbiota to host metabolism and innate immunity have been recognised(Reference Round and Mazmanian24,Reference Nicholson, Holmes and Kinross25) and specifically, gut microbial factors are involved in the origin or progression of intestinal inflammation, which impacts host resistance to infection(Reference Frank, St Amand and Feldman26,Reference Willing, Dicksved and Halfvarson27) . Diet is a major determinant of gut microbial composition(Reference Turnbaugh, Ridaura and Faith28), and defining the changes to the gut microbiota in response to specific dietary nutrients in the context of intestinal inflammation can provide insight into the microbial factors that initiate or perpetuate disease. To date, most studies investigating gut microbial changes in the setting of dietary choline deficiency focus on the correlations between microbes and liver health; however, the relationship between changes in the gut microbial community due to variations in dietary choline level and gut mucosal homoeostasis remains uncharacterised.
The aim of the present study was to determine the effects of dietary choline deficiency on mucosal barrier function and immune responses during infection. We hypothesised that a choline-deficient (CD) diet would increase susceptibility to colitis induced by Citrobacter rodentium, a murine attaching-effacing pathogen that induces pathological features comparable with those seen in ulcerative colitis(Reference Mundy, MacDonald and Dougan29). We found that mice fed a CD diet developed more severe colitis following C. rodentium infection compared with mice fed diets containing sufficient (choline-sufficient (CS)) or excess (choline-excess (CE)) levels of choline. A CD diet was linked to greater loss of goblet cells and increased production of pro-inflammatory cytokines after infection. Furthermore, the enrichment of bacterial genera Allobaculum and Turicibacter was identified as indicators of dietary choline depletion. Taken together, our data show that adequate levels of dietary choline are important for maintaining goblet cell abundance and colonic immune function during colitis development. However, a CE diet did not confer significant beneficial effects compared with the CS diet following C. rodentium infection.
Materials and methods
Mice
Female C57BL/6J mice (Jackson Laboratory) aged 6 to 8 weeks were maintained in animal facilities at the University of Alberta under specific pathogen-free conditions. All mice were housed on aspen wood chip bedding materials in sterilised filter-topped cages with nestlets, tunnels and nesting materials as enhancements. The room was environmentally controlled for temperature (20–22°C), relative humidity (40 %) and light cycle (12-h light and 12-h darkness). Mice were acclimatised for 1 week before all experiments and were given ad libitum access to water and a standard chow diet (LabDiet®, 5053, 2000 parts per million choline chloride). For conducting experiments, mice were then randomly grouped into six cages with 4–5 mice per cage by a blinded laboratory animal technician and balanced for average body weight. The cages were allocated to three isoenergetic dietary treatments differing only in choline content (Table 1): CD (0 g choline/kg diet), CS (1 g choline/kg diet) and CE (4 g choline/kg diet). The body weight was recorded each week and mice were euthanised after 4 weeks of dietary treatment to harvest gut contents and tissues.
Composition of experimental diets

CD, choline-deficient; CS, choline-sufficient; CE, choline-excess.
* Harlan Teklad.
† Safeway.
‡ Sigma-Aldrich.
§ Crisco J.M. Smucker Company.
|| Mazola ACH Food Companies Inc..
¶ TenderFlake.
** DSM Nutritional Products Inc..
For the infectious colitis model, mice not harbouring commensal E. coli, as confirmed by plating on MacConkey agar (BD), received dietary treatment (CD, CS or CE) for 3 weeks and subsequently exposed to C. rodentium by oral gavage. Mice were euthanised 7 d post-infection (DPI) for tissue sample collection and faecal C. rodentium enumeration. The infection study was repeated twice with the total number of eighteen mice in each treatment. The protocol was approved by the University of Alberta’s Animal Care Committee and in direct accordance with the guideline of the Canadian Council on the Use of Laboratory Animals.
Bacterial strains
The C. rodentium strain (DBS100) was cultivated in 5 ml of Luria–Bertani medium (Fisher Scientific) at 37°C for 16 h. Each mouse received 0·1 ml of culture medium containing approximately 1·0 × 109 colony-forming units/ml of C. rodentium. Enumeration of C. rodentium was conducted by serial dilutions of faecal samples plated on MacConkey agar, and total colony-forming units per g of faeces were then calculated.
Tissue collection
At 4 weeks after dietary treatment or 1 week after C. rodentium infection, mice were euthanised by CO2 asphyxiation. The terminal 5 mm segment of distal colon was collected for histological analysis, and the remaining colon tissue was harvested for subsequent gene expression, cytokine and chemokine, or phospholipid analysis. Ileal, caecal and colonic contents from the non-infectious study were collected for microbial compositional analysis. All samples were immediately placed in 10 % of neutral buffered formalin for histological analysis or snap-frozen in liquid N2.
Histology
The distal 5 mm of the colon were fixed with 10 % of neutral buffered formalin and embedded in paraffin, sectioned into 5 μm slices and stained with haematoxylin and eosin(Reference Wlodarska, Willing and Keeney30). Images were taken using an EVOS FL Auto Imaging System (Thermo Scientific). Well-oriented cross sections were assigned a pathology score based on pathological features of the lumen, surface epithelium, mucosa and submucosa using a blinded histopathology evaluation, as described previously(Reference Wlodarska, Willing and Keeney30).
Quantification of total bacterial load
Total bacterial load in faeces was quantified using a primer set UniF340/UniR514 (online Supplementary Table S1). The real-time quantitative PCR reaction was performed on an ABI StepOne™ real-time System (Applied Biosystems) using PerfeCTa SYBR Green Supermix (Quantabio). The amplification programme consisted of an initial denaturation step at 95°C for 3 min followed by forty cycles of 10 s at 95°C and 30 s at 60°C. A standard curve for a 10-fold serial dilution series was created using gDNA from a gut commensal E. coli strain with a genome size of 5 190 098 bp(Reference Ju, Shoblak and Gao31). The threshold cycle (Ct) value was associated with 16S rDNA copies (log10 copy number) to construct a function for quantification of all samples. The total bacterial load was expressed as 16S rDNA copies per gram of faeces on a base 10 logarithmic scale.
Microbial composition analysis
Total DNA was extracted from ileal, caecal and colonic contents using the QIA stool extraction kit (Qiagen Inc.) with an additional bead-beating step as described previously(Reference Willing, Vacharaksa and Croxen32). Amplicon libraries were constructed which targeted the V3–V4 region of the 16S rRNA gene following the Illumina 16S metagenomic Sequencing Library Preparation protocol. The paired-end sequencing and data analysis were performed using the protocols and pipelines published previously(Reference Ju, Shoblak and Gao31). Briefly, raw sequence data were filtered using FASTX-Toolkit by eliminating bases with quality scores lower than 33. Paired-end sequencing reads were subsequently merged using the PANDAseq algorithm(Reference Masella, Bartram and Truszkowski33). Dereplication of merged sequences and removal of singletons were conducted by VSEARCH, and sequences were chimera-checked against the gold.fa database using USEARCH version 8(Reference Edgar, Haas and Clemente34,Reference Rognes, Flouri and Nichols35) . The high-quality reads were clustered into operational taxonomic units with 97 % of identity using VSEARCH. Taxonomy was assigned using Quantitative Insight into Microbial Ecology 1.9.1 toolkit default set-up with the Ribosomal Database Project classifier(Reference Caporaso, Kuczynski and Stombaugh36). The α-diversity analyses were estimated by normalising the number of sequences per sample to the lowest number of reads. The linear discriminant analysis (LDA) effect size (LEfSe) analysis was performed to identify differentially abundant genera among treatment groups determined by the Kruskal–Wallis test (α = 0·05)(Reference Segata, Izard and Waldron37). The threshold on the logarithmic score of LDA analysis was set to 2·0.
RNA isolation and cDNA synthesis
Distal colon tissue was snap-frozen in liquid N2 and preserved at –80°C until RNA extraction. RNA was isolated using a GeneJET RNA purification kit (Thermo Scientific) following the manufacturer’s instructions. The purity and concentration of RNA samples were assessed by gel electrophoresis using a 2× RNA GEL Loading Dye (Thermo Scientific) and a NanoDrop ND-2000 spectrophotometer (NanoDrop Technologies). One microgram of total RNA was used for reverse transcription using the qScript Flex cDNA synthesis kit (Quantabio).
Gene expression analysis
Colonic gene expression was analysed by real-time quantitative PCR using PerfeCTa SYBR Green Supermix (Quantabio). Primers and optimised annealing temperatures for genes analysed are listed in online Supplementary Table S1. The thermal cycling system and programme was used as described above. The β-actin gene was used as a housekeeping gene for normalisation. The fold change of gene expression compared with the CD group was calculated using the 2–ΔΔCt method.
Cytokine analysis
Colon tissues obtained from the infected and non-infected mice were subjected to an assay targeting a panel of cytokines and chemokines. The distal colon tissue was homogenised in homogenisation buffer containing a protease inhibitor cocktail (Sigma-Aldrich) and dithiothreitol (Sigma-Aldrich). The protein concentration of the supernatant was determined by bicinchoninic acid assay after centrifugation at 10 000 g for 10 min to remove debris. For the infected tissue, an array of mouse cytokine/chemokine was determined using Multiplex LASER Bead Technology (MD31, Eve Technology). For the non-infected tissue, an MSD Pro-inflammatory Panel (mouse) kit (Meso Scale Discovery) was used to quantify cytokines according to the manufacturer’s recommendations. Cytokine concentrations were normalised to 100 μg of protein.
Lipid measurements
Total protein concentrations of tissue homogenates were determined by bicinchoninic acid assay before tissue lipids were extracted from homogenates (1 mg/ml) by the method of Folch et al. (Reference Folch, Lees and Sloane Stanley38). PC and phosphatidylethanolamine were separated by TLC using the solvent system chloroform–methanol–acetic acid–water (50:30:8:4). Bands were visualised after exposure to iodine and measured by phosphorous assay, as described previously(Reference Zhou and Arthur39,Reference Kennelly, van der Veen and Nelson40) .
Faecal mucin assay
Faecal pellets were collected 3 weeks after dietary treatment, pooled from 4–5 mice per cage, freeze-dried and ground to a powder. Faecal mucin content was quantified using a fluorometric assay kit (Cosmo Bio) according to the manufacturer’s protocol.
Statistical analysis and visualisation
The minimal sample size was calculated based on our preliminary data on C. rodentium abundance and the inflammatory marker monocyte chemoattractant protein-1 (MCP-1) that gives 80 % of power at the 0·05 level of significance. The G*Power software (version 3.1.9.2, http://gpower.hhu.de/) was used to perform the calculation. We assumed to detect a 10 % of difference in mean values among treatment groups. The normality of body weight, faecal mucin content, gene expression and cytokine/chemokine data was checked by the Shapiro–Wilk test. One-way ANOVA for parametric and the Kruskal–Wallis test for non-parametric data were used to compare the difference between treatments. Multiple post hoc comparisons were performed using Tukey or Dunn’s tests. For microbial composition analysis, the comparison of individual taxa/operational taxonomic units between treatments was performed using the Kruskal–Wallis test. Permutational multivariate ANOVA was used to identify the difference between treatment groups using the adonis function in the vegan package (R v3.4.4). The principal coordinate analysis based on Bray–Curtis dissimilarities was plotted using the phyloseq package (R v3.4.4)(Reference McMurdie and Holmes41). P values indicate statistical significance as follows: ** P < 0·01; * P < 0·05. R (v3.4.4) and GraphPad Prism were used for visualising results.
Accession number(s)
The raw sequences of the 16S rRNA gene amplicon reads were deposited in the Sequence Read Archive under accession number PRJNA517744.
Results
Insufficient dietary choline decreases colonic PC concentrations following Citrobacter rodentium infection
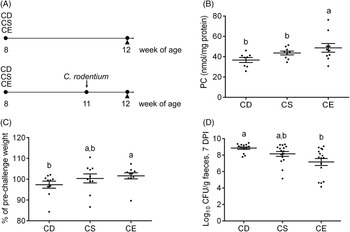
To examine the effect of dietary choline levels on intestinal PC synthesis and the susceptibility to colitis, we fed mice isoenergetic diets that differed only in choline content (Table 1; Fig. 1(A)): CD, CS and CE. A non-infectious model was established by a 4-week dietary treatment to investigate the relationship between dietary choline supplementation and intestinal PC concentrations. At 4 weeks after dietary interventions, mice fed the CD diet had lower hepatic PC concentrations compared with mice fed the CE diet, while hepatic phosphatidylethanolamine concentrations were unchanged between groups (Table 2). Similarly, PC concentrations were lower in the proximal small intestines of mice fed the CD diet as compared with mice fed the CS diet (Table 2), indicating that feeding mice a CD diet for 4 weeks depletes hepatic and small intestinal PC pools. Interestingly, there was no difference in colonic PC concentrations between CD, CS and CE groups (online Supplementary Fig. S1(a)). The experimental model of colitis was conducted 3 weeks after the initiation of the dietary treatment. Mice were subsequently exposed to C. rodentium by oral gavage before continuing the dietary treatment for one further week. In contrast to the non-infectious mice, after C. rodentium colonisation, PC concentrations were significantly lower in colons of the CD group compared with the CE group (Fig. 1(B)). These data suggest that under normal physiological conditions, homoeostatic systems exist to maintain colonic PC concentrations in the setting of dietary choline deficiency (possibly by increasing uptake from circulation); however, under inflammatory conditions, these homoeostatic systems fail and colonic PC concentrations drop. The phosphatidylethanolamine concentrations in the colon were not different between groups either with or without C. rodentium infection (online Supplementary Fig. S1(b) and (c)).
(A) Experimental timeline for the non-infectious model (top) and the infectious colitis model (bottom). (B) Phosphatidylcholine (PC) concentrations in the colon after Citrobacter rodentium infection 7 d post-infection (DPI) (n 10). (C) Changes in the body weight after C. rodentium infection 7 DPI, expressed as the percentage of pre-challenge body weight (n 10). (D) Enumeration of C. rodentium in the faeces 7 DPI. Data are presented as mean values with their standard errors. CD, choline-deficient (n 13); CS, choline-sufficient; CE, choline-excess (n 16); CFU, colony-forming units. Each dot represents an individual mouse. a,b Means that do not share a letter are significantly different (one-way ANOVA and Tukey’s test) (α = 0·05).

Phospholipid concentrations in liver and small intestine 4 weeks after dietary treatment (non-infectious model)
(Mean values with their standard errors; n 8)
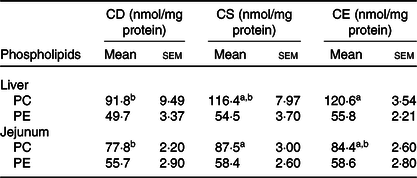
CD, choline-deficient; CS, choline-sufficient; CE, choline-excess; PC, phosphatidylcholine; PE, phosphatidylethanolamine.
a,b Mean values within a row with unlike superscript letters are significantly different according to one-way ANOVA combined with the Tukey test (α = 0·05).
Insufficient dietary choline exacerbates the severity of Citrobacter rodentium-induced colitis
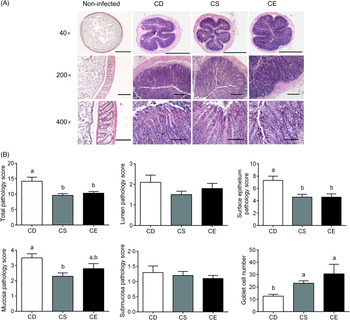
The body weight was not significantly impacted by dietary choline levels as there was no significant difference betweent treatments 3 weeks after dietary intervention (online Supplementary Fig. S1(d)). Following C. rodentium infection, mice fed the CD diet experienced moderate body weight loss relative to their body weight before infection, while mice fed the CS or CE diets maintained their body weight (Fig. 1(C)). At 7 d post-infection, the CD group exhibited significantly higher C. rodentium loads in faeces than that in the CE group (P < 0·05, Fig. 1(D)). Analysis of haematoxylin and eosin-stained colon sections after C. rodentium infection revealed that mice in all three treatment groups developed colonic hyperplasia (Fig. 2(A)), a typical feature of C. rodentium infection(Reference Mundy, MacDonald and Dougan29). However, the CD group showed more extensive damage to the colonic epithelium when compared with mice fed the CS or CE diets, as reflected by a significantly higher total pathology score (Fig. 2(B)). Specifically, mice fed the CD diet had more alterations to the surface epithelium than mice fed the CS or CE diets, as characterised by increased regenerative change, desquamation and epithelial ulceration (Fig. 2(A) and (B)). Furthermore, insufficient dietary choline was associated with the higher pathology score of the mucosa layer as indicated by increased crypt length (Fig. 2(B)). Interestingly, there was a dose–response relationship between dietary choline levels and goblet cell loss, with the most dramatic loss of goblet cells observed in the colons of mice fed the CD diet (P < 0·05, Fig. 2(B)). Total pathology scores or the detailed pathological assessments were not significantly different between mice fed CS and CE diets at 7 DPI (Fig. 2(B)).
(A) Distal colon sections from choline-deficient (CD), choline-sufficient (CS) and choline-excess (CE) mice 7 d post-infection (DPI) were stained with haematoxylin and eosin. Sections from non-infected mice were used as references to show normal histological morphology of the distal colon. Original magnification and bars: top: 40×, 1000 μm; middle: 200×, 500 μm; bottom: 400×, 100 μm. (B) Pathology scores of the colon tissue 7 DPI. The assessment included the inflammation and damage of lumen, surface epithelium, mucosa and submucosa, as well as the number of goblet cells. For all the treatment, n 10. Data are mean values with their standard errors. a,b Means that do not share a letter are significantly different (one-way ANOVA and Tukey’s test) (α = 0·05).

Dietary choline deficiency increases colonic inflammatory tone after Citrobacter rodentium infection
To determine whether dietary choline intake influences colonic inflammation after infection, we profiled inflammatory cytokine and chemokine concentrations in the colon 7 d after C. rodentium colonisation. In general, mice fed a CD diet showed enhanced production of pro-inflammatory cytokines and chemokines in response to C. rodentium infection (Table 3, online Supplementary Table S2). In line with a greater abundance of faecal C. rodentium at 7 DPI and more severe damage to the surface epithelium and mucosa, mice fed the CD diet had higher MCP-1 concentrations in colonic tissue compared with mice fed the CE diet (P < 0·05, Table 3). Furthermore, the chemokines eotaxin-1 (also known as CC-motif chemokine ligand 11, CCL11) and Regulated upon activation, normal T cell expressed and secreted (RANTES, also known as CCL5), as well as the inflammatory cytokine IL-9, were elevated in the colon of mice fed the CD diet relative to mice fed the CE diet (P < 0·05, Table 3), suggesting an increased colonic inflammation in response to C. rodentium colonisation in the CD group. Collectively, there was a clear pattern of increased pro-inflammatory responses in the CD mice after C. rodentium colonisation. However, we did not observe significant differences in the cytokine and chemokine levels between the CS and CE groups, which was consistent with results from the pathological assessment (Table 3). In the absence of C. rodentium infection, no significant differences were found in inflammatory cytokine and chemokine expression or concentrations in the colon among treatment groups (online Supplementary Fig. S2 and Table S3).
Colonic cytokine/chemokine levels 7 d post-Citrobacter rodentium infection
(Mean values with their standard errors; n 10)
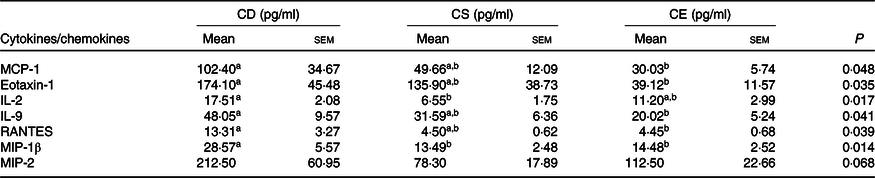
CD, choline-deficient; CS, choline-sufficient; CE, choline-excess; MCP-1, monocyte chemoattractant protein-1; Eotaxin-1, CC-motif chemokine ligand 11, CCL11; RANTES, regulated upon activation, normal T cell expressed and secreted, CCL5; MIP-1β, macrophage inflammatory protein-1β; MIP-2, macrophage inflammatory protein 2.
a,b Mean values within a row with unlike superscript letters are significantly different according to one-way ANOVA or the Kruskal–Wallis test combined with the Tukey or Dunn’s test (α = 0·05). The lower detection limit for listed cytokines is 0·64 pg/ml.
Dietary choline supplementation impacts colonic mucosal defence system
Faecal mucin content was analysed 3 weeks after dietary treatment. The CD group had the lowest concentration of faecal mucin, whereas the faecal mucin content was significantly higher in CE group than that in the CD and CS groups (Fig. 3(A)). Interestingly, no difference was observed in mRNA levels of MUC2 among treatment groups after 4 weeks of dietary treatment (Fig. 3(B)). The mRNA levels of antimicrobial peptides, the regenerating islet-derived 3 (Reg3) family of proteins Reg3β and Reg3γ, tended to be higher in the CE treatment (Fig. 3(C) and (D)), indicating an impact of dietary choline intake on mucosal homoeostasis.
(A) Faecal mucin content in choline-deficient (CD), choline-sufficient (CS) and choline-excess (CE) mice 3 weeks after the dietary intervention. CD (n 14); CS and CE (n 12). mRNA expression levels of (B) mucin 2 (MUC2), (C) regenerating islet-derived 3 (Reg3) family of proteins β (Reg3β) and (D) γ (Reg3γ) in the colon (n 8). Data are mean values with their standard errors. a,b Means that do not share a letter are significantly different (one-way ANOVA and Tukey’s test) (α = 0·05).

Changes to dietary choline levels do not alter the overall gut microbial structure
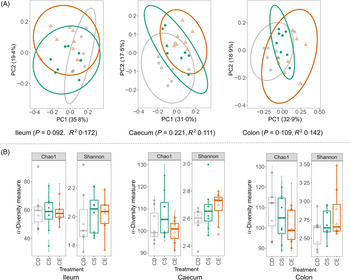
The total bacterial load in faeces from CD, CS and CE groups after 4 weeks of dietary treatment was determined by real-time quantitative PCR. No significant difference was detected in bacterial 16S rRNA gene copies between treatments, suggesting that dietary choline levels did not alter the total bacterial abundance (online Supplementary Fig. S2(d)). The gut microbial composition was characterised by sequencing 16S rRNA gene amplicons (V3–V4 region) from ileal, caecal and colonic contents on an Illumina MiSeq platform. The sequencing obtained an average of 18 685 (sd 6019) quality-controlled and chimera-checked reads per sample. At all three intestinal segments, dietary choline levels did not cause a dramatic shift in gut microbial structure as determined by the permutational multivariate ANOVA (Fig. 4(A)). Specifically, there was no difference in the microbial structure among three treatment groups at caecum (P = 0·221) and colon (P = 0·109), which was evaluated using Bray–Curtis dissimilarities with 999 random permutations (adonis). Dietary choline levels exhibited a trend to shift the structural pattern of the microbial community in the ileum (P = 0·092) which explained 35·8 % of variation in bacterial composition. To evaluate phylogenetic richness and evenness of microbial communities, Chao1 diversity index and Shannon index were calculated in each sample at different intestinal segments. Chao1 and Shannon index did not vary among treatment groups at each intestinal site, which suggested that dietary choline levels showed minimal effects on the α-diversity of the microbial community (Fig. 4(B)). Therefore, enhanced damage to the colonic epithelium of mice fed the CD diet compared with mice fed the CS or CE diets in the context of subsequent infection was not linked to broad changes to the structure of the gut microbiota.
(A) Principal coordinate (PC) analysis plots of gut bacterial communities based on Bray–Curtis dissimilarities. Each point represents an individual mouse. The R 2 and P values of the adonis test with 999 random permutations are shown. (B) Chao1 and Shannon indexes of the gut microbiota from different dietary treatment groups. CD (![]() ), choline-deficient; CS (
), choline-deficient; CS (![]() ), choline-sufficient; CE (
), choline-sufficient; CE (![]() ), choline-excess. For all treatment groups, n 8. Data are presented as box plots, where the boxes represent the 25th–75th percentiles and the lines within the boxes represent the medians.
), choline-excess. For all treatment groups, n 8. Data are presented as box plots, where the boxes represent the 25th–75th percentiles and the lines within the boxes represent the medians.

Dietary choline deficiency alters the relative abundance of certain bacterial taxonomies in the gut
To assess the composition of gut microbes in the dietary-treated groups, sequences were assigned to taxonomy using Ribosomal Database Project Classifier. Dietary choline levels did not impact the microbial structures at different intestinal sites; however, the abundance of certain bacteria was influenced by choline supplementation. There were notable changes in the abundance of bacterial genera Allobaculum, Turicubacter, unclassified_Planococcaceae and Oscillospira, which were altered by choline depletion (Table 4). We observed a consistent increase in the relative abundance of Allobaculum and Turicibacter by dietary choline depletion at all three intestinal segments, suggesting the stimulatory effect of choline deficiency on these two bacterial genera (Table 4). Specifically, the genus Allobaculum represented an average of 0·1, 0·01 and 0·06 % of total microbial communities in the CE group at the ileum, caecum and colon, respectively. When choline was depleted in the diet, the average abundance of Allobaculum in the CD group reached 1·73, 0·19 and 0·91 % at the ileum, caecum and colon, respectively. We were unable to detect the genus Turicibacter in the CE group at all three intestinal sites; however, the relative abundance of Turicibacter was significantly increased in the CD group, representing 0·83 % of total microbiota in the colon. In addition to significant changes of Allobaculum and Turicibacter in response to choline levels, we observed changes in certain bacterial taxonomies which were limited to the intestinal site. There was a decrease in unclassified_Planococcaceae in the ileum and caecum of the CD mice compared with that in the CS and CE groups, and the colonic microbiota of the CD mice had significantly lower levels of the genus Oscillospira compared with the CS and CE groups (Table 4).
Relative abundance of bacterial taxonomies altered by dietary choline levels (summarised down to the genus level)
(Mean values with their standard errors; n 8)

CD, choline-deficient; CS, choline-sufficient; CE, choline-excess; FDR, false discovery rate.
a,b Mean values within a row with unlike superscript letters are significantly different according to the Kruskal–Wallis test combined with Dunn’s test (α = 0·05). P values and adjusted P values using the Benjamini–Hochberg FDR method are reported.
LEfSe analysis was applied to identify specific taxa that varied in relative abundance by choline treatments and thus could be used as biomarkers of choline status (online Supplementary Fig. S3). In the caecal and colonic microbial communities, the genera Turicibacter and Allobaculum were consistently detected as biomarkers in the CD group, whereas Oscillospira, Ruminococcus, unclassified_Planococcaceae and unclassified_Erysipelotrichaceae were identified as biomarkers in CE group, notably associating dietary choline supplementation with these specific bacterial taxa. Taken together, these results showed that a few specific bacterial taxa responded to changes in choline availability, although varying dietary choline levels did not significantly shift the overall microbial structure.
Discussion
In the present study, we showed that mice fed insufficient dietary choline have exacerbated severity of C. rodentium-induced colitis compared with mice fed sufficient or excess dietary choline. The enhanced inflammatory responses in the setting of a CD diet was characterised by increased loads of C. rodentium, greater loss of goblet cells and elevated production of pro-inflammatory cytokines compared with mice fed the CS or CE diets. Our results identified choline as a dietary factor that influences host gut mucosal homoeostasis and immune response to infection. However, no additional significant protection against C. rodentium-induced colitis was conferred by a CE diet relative to a CS diet. In addition, dietary choline levels did not shift the overall structural pattern of the gut microbiota; however, certain bacterial taxa were characterised as responders to the depletion of dietary choline.
It was surprising that, in the absence of C. rodentium infection, mice fed the CD diet had normal colonic PC concentrations relative to mice fed the CS or CE diets after 4 weeks of dietary treatment. It has been shown previously that mice fed a CD diet for 3 weeks maintain normal choline-containing metabolite concentrations in the brain by slowing the rate of choline oxidation to betaine and by sustaining the delivery of choline to the brain in blood(Reference Li, Agellon and Vance42). Therefore, mice have the ability to maintain colonic and brain PC concentrations for prolonged periods in the setting of choline deficiency, although normal cellular functions might be impaired, as indicated by lower faecal mucin contents in the CD group compared with the CS or CE groups. However, mice fed the CD diet had the lowest levels of PC in the colon in response to C. rodentium infection, indicating a failure of the homoeostatic systems required to maintain colonic PC concentrations in the setting of epithelial damage. Specifically, the infection placed an increased demand on colonic epithelial cells for PC due to rapid intestinal epithelial cell turnover (PC is required for cellular proliferation and membrane biogenesis) and due to accelerated mucus production. There is evidence that humans with ulcerative colitis have lower colonic PC concentrations relative to healthy controls(Reference Ehehalt, Wagenblast and Erben16), and that delivering exogenous PC to the distal intestinal epithelium reduces some metrics of disease severity(Reference Stremmel, Merle and Zahn15,Reference Karner, Kocjan and Stein17,Reference Stremmel, Ehehalt and Autschbach18) . At the expansion phase of C. rodentium infection (4–8 DPI)(Reference Willing, Vacharaksa and Croxen32), the colonisation of C. rodentium triggers a dramatic reprogramming of cellular composition and function in enterocytes(Reference Hopkins, Roumeliotis and Mullineaux-Sanders43). Our data suggest that low-colonic PC concentrations in the context of intestinal inflammation and epithelial turnover exerted negative effects on inflammatory disease progression.
Goblet cells produce and secrete critical components of the gastrointestinal mucus layer and therefore function to protect the host from invasion by luminal microbes(Reference Johansson and Hansson4). In the present study, mice fed the CD diet had more severe loss of goblet cells in response to C. rodentium infection, relative to mice fed the CS or CE diets. A compromised mucus barrier has been shown to allow increased translocation of C. rodentium and lipopolysaccharide to colonic crypts and lamina propria(Reference Khan, Ma and Knodler44). Consistent with the greater loss of goblet cells, mice fed the CD diet had greater colonic damage and enhanced production of pro-inflammatory cytokines/chemokines in response to C. rodentium infection relative to mice fed adequate levels of dietary choline. Although no difference was observed in PC concentrations in the colon tissue among treatment groups, CD mice exhibited the lowest concentration of faecal mucin 3 weeks after dietary treatment. It is conceivable that an inability to produce and maintain PC concentrations of colon mucus due to insufficient dietary choline further compromises the integrity of the mucus layer. Taken together, our data suggest that dietary choline is important for maintaining goblet cell mucus granule abundance in the context of C. rodentium infection.
Exacerbated colitis severity in mice fed a CD diet was linked to the impaired ability of the host to control C. rodentium proliferation, as indicated by higher faecal C. rodentium abundance at 7 DPI compared with mice fed the CS or CE diets. Previous studies have shown that feeding pregnant rats a CD diet impaired immune function in dams(Reference Dellschaft, Ruth and Goruk45) and lymphocyte development in pups(Reference Lewis, Richard and Goruk46). Our data suggest that a CD diet impairs intestinal immune homoeostasis and allows an uncontrolled proliferation of C. rodentium. Furthermore, in vitro experiments showed that the PC content of membranes in intestinal epithelial cells influences the ability of the cell to block pro-inflammatory signalling cascades(Reference Treede, Braun and Sparla14). There was an enhanced production of pro-inflammatory cytokines/chemokines in the colon of mice from the CD group, indicating an inability of CD mice to control inflammatory signalling after the infection. Elevated colonic levels of eotaxin-1, macrophage inflammatory protein 2 (MIP-2) and MCP-1 have been reported previously in mice infected with C. rodentium and represent increased immune cell recruitment (including neutrophils) to the injured colonic mucosa(Reference Khan, Ma and Knodler44,Reference Coburn, Horst and Chaturvedi47) . Therefore, in addition to impairing the ability of mice to maintain the mucosal homoeostasis after C. rodentium infection, a CD diet exacerbates inflammatory signalling relative to the diet containing adequate levels of choline.
It has been recognised that gut commensal microbes contribute to the integrity of the gut mucus barrier and immune homoeostasis(Reference Round and Mazmanian24). Therefore, we investigated the effect of dietary choline levels on gut commensal microbes after 4 weeks of dietary treatment. Different choline levels did not impact the total bacterial abundance in faeces. The microbial structure as well as the diversity of microbial communities at all three intestinal sites were not different among treatments. However, certain bacterial taxa responded to dietary choline levels. Adlercreutzia, a genus belongs to the phylum Actinobacteria, was identified as one of the biomarkers in the ileal contents from the CE group, which revealed findings that are consistent with previous studies(Reference Roberts, Gu and Buffa48). The genera Allobaculum and Turicibacter, both belong to the class Erysipelotrichia, were enriched by the CD diet. The abundance of Erysipelotrichia has previously been positively associated with a high risk of fatty liver development with a choline-depleted diet, and the bacterial class was identified as a biomarker for choline availability(Reference Spencer, Hamp and Reid23). Interestingly, the genus Allobaculum has been identified as a high-choline diet characteristic taxa in a previous study(Reference Zhu, Gregory and Org49); however, the choline levels in the chow diet (0·08 % of total choline) and choline-supplemented diet (1·0 % of total choline) from the previous study were significantly different from our present experiment. The mechanism through which dietary choline levels modulate members from the class Erysipelotrichia remains to be fully elucidated.
In colonic contents, the genus Oscillospira was decreased with lowering the dietary choline level. Currently, our understanding about the functionalities of the understudied anaerobic bacterial genus Oscillospira is quite limited; however, it has been characterised as a butyrate producer and its abundance was reduced with inflammation(Reference Gophna, Konikoff and Nielsen50,Reference Konikoff and Gophna51) . An increase in the relative abundance of Oscillospira has been observed in multiple animal species after long-term fasting, suggesting that Oscillospira may be able to forage for host glycans(Reference Kohl, Amaya and Passement52). The decrease in the genus Oscillospira in the present study by dietary choline depletion was consistent with the lowest faecal mucin contents in the CD group, indicating a potential limited host-produced glycans as substrates for this specific commensal microbe. Dietary choline showed an impact on gut mucosal defence system as indicated by changes in faecal mucin contents and antimicrobial peptides gene expression. It was noticeable that we did not detect the well-recognised mucin utiliser, Akkermansia, in microbial communities from the present study. In addition, the CE group tended to have an increased gene expression level of Reg3β and Reg3γ, which are produced by intestinal epithelial cells and play a critical role in segregation of gut microbes and epithelial cells(Reference Vaishnava, Yamamoto and Severson53,Reference Loonen, Stolte and Jaklofsky54) . No significant difference was observed in total bacterial load and the overall microbial community structure among treatments, indicating that the alteration in specific bacterial taxa may contribute to the changed profile of Reg3β and Reg3γ. For example, a previous study has suggested that Allobaculum may have a direct interaction with the host in terms of Reg3γ expression(Reference Collins, Hoffman and Martinez55); however, future research is needed to provide evidence of host–microbe interactions between specific commensal bacteria and gut mucosal defence factors. Taken together, the results suggest that changes in the niche for specific gut microbes resulted from dietary choline supplementation and these gut microbes may in turn influence the gut mucosal homoeostasis.
Using highly controlled diets, this is the first study to highlight the importance of choline in maintaining intestinal homoeostasis in the context of infectious colitis, which expands our understanding of this essential nutrient. Choline requirements in humans are highly individualised(Reference Zeisel and Da Costa9) and the gut microbiota may become a biomarker of choline status to provide a novel approach for assessing responses to dietary intervention. The present study was limited to female mice; therefore, future studies should include males. Furthermore, human clinical trials will be essential in confirming the clinical outcomes and the accuracy of microbial biomarkers. This study represents a relatively short-term dietary intervention, and future work should consider more chronic choline deficiency. While we have provided the evidence of microbial biomarkers of choline deficiency, knowledge of physiological characteristics and basic roles of gut microbes such as the class Erysipelotrichia and the genus Oscillospira are extremely limited. Future studies focusing on interactions between these bacterial biomarkers, dietary choline supplementation and host physiology will elucidate the causalities and consequences of altered microbial communities in specific dietary settings. In addition, the contribution of dietary choline to intestinal mucus structure needs to be further investigated to help identify the mechanism through which an adequate level of choline intake reduced infection severity and inflammation.
To conclude, in the present study, we showed that mice fed a CD diet have exacerbated severity of C. rodentium-induced colitis compared with mice fed the CS or CE diets. In addition, dietary choline levels did not have global impacts on the overall microbial structure; however, certain bacterial taxa were identified as potential indicators for choline availability.
Acknowledgements
We would like to thank Karen B. Kelly, Nicole Coursen and Andrew J. Forgie, from the Department of Agricultural, Food and Nutritional Science, Univeristy of Alberta, for helping with the preparation of diets, animal work and cytokine analysis.
This work was supported by grants from the Natural Sciences and Engineering Research Council of Canada to B. P. W. (grant number 436154) and R. L. J. (grant number 03932). T. J. and J. P. K. were supported by Graduate Student Scholarships from Alberta Innovates-Technology Futures. B. P. W. is supported by the Canada Research Chair Program.
T. J. and J. P. K. performed the animal experiment, performed analyses and wrote the manscript; B. P. W. and R. L. J. conceived and designed the experiment as well as reviewed and edited the manuscript.
The authors declare no conflicts of interest.
Supplementary material
For supplementary material referred in this article, please visit https://doi.org/10.1017/S0007114520002639