


Introduction
The transition from hunting and gathering to farming represents a fundamental shift in human lifeways and in the relationship between humans and non-humans. North of the Linearbandkeramik (LBK) zone in Europe, widespread evidence for farming in the British Isles, northern Germany and southern Scandinavia is first present after 4000 BC (Rowley-Conwy et al. Reference Rowley-Conwy, Gron, Rowley-Conwy and Sørensen2020; Sørensen Reference Sørensen, Gron, Sørensen and Rowley-Conwy2020). Wedged between these regions, the Dutch wetlands and their Swifterbant Culture sites provide clear evidence for crop husbandry between 4300 and 4000 BC, as well as possible animal husbandry (for an overview see Raemaekers et al. Reference Raemaekers2021).
These early dates coupled with the forager characteristics of Swifterbant Culture sites (evidence for hunting, trapping, fishing and gathering) have led to debate on whether farming in the Dutch wetlands pre-dates its adoption in the wider region (Rowley-Conwy Reference Rowley-Conwy, Colledge, Conolly, Dobney, Manning and Shennan2013; Shennan Reference Shennan2018: 152). While evidence for arable farming is well established (Huisman & Raemaekers Reference Huisman and Raemaekers2014), the early emergence of animal husbandry in the Dutch wetlands remains contentious, hampered by the lack of multi-stranded data.
This article presents a study of suids and cattle/aurochs from Swifterbant Culture sites in Swifterbant using zooarchaeology, stable isotope analysis and vegetation analysis, with the aim of uncovering human–animal interactions in the crucial period 4300–4000 BC. We focus on investigating the development of new and redefined relationships between humans and animals that occurred in the transition to animal husbandry, such as control over diet and habitat. Due to the uniquely early dates, the Swifterbant Culture has the potential to provide new insights into these processes in northern Europe. Moreover, the evidence for both farming and foraging characteristics among these communities provides a critical case-study for “decentering traditional domestication narratives” (Lien et al. Reference Lien, Swanson, Ween, Swanson, Lien and Ween2018: 4).
Background
Swifterbant
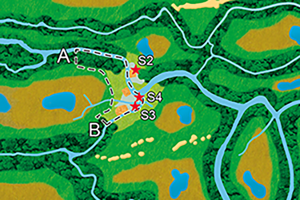
The distinct material culture of the Swifterbant Culture is identified in the Netherlands, Belgium and Germany from c. 5000 BC onwards (Raemaekers & de Roever Reference Raemaekers, de Roever, Vanmontfort, Louwe Kooijmans, Amkreutz and Verhart2010). The first sites (S2–4) were excavated near the eponymous Dutch town of Swifterbant in 1972–1979 (Figure 1). S3 and S4 were conventionally dated to 4300–4000 BC—coincident with a plateau in the radiocarbon (14C) curve—but Bayesian modelling of new 14C dates on barley (Hordeum vulgare) remains has narrowed down the occupation of S3 to 4220–4050 BC and of S4 to 4240–4160 BC (Dreshaj et al. Reference Dreshaj, Raemaekers and Dee2024). S3 has the largest and least-fragmented faunal assemblage of these early sites (Kranenburg & Prummel Reference Kranenburg, Prummel, Raemaekers and de Roever2020).
Above) archaeological sites and impression of the distribution of the major landscape units present in the Swifterbant river system area (to scale); below) reconstruction of the riverbank where the sites are located (not to scale). Based on extensive excavation and coring data (see OSM1) (illustration by Mans Schepers & Siebe Boersma).

At the time of occupation, the Swifterbant sites were located in a freshwater wetland area that consisted of a system of small rivers with riverbanks and floodplains. Local vegetation can roughly be divided into aquatic, grassland, pioneer and woodland communities (Schepers Reference Schepers2014). Habitation was situated on the riverbanks, which were seasonally relatively dry and predominantly covered with riparian woodlands, grassland and ruderal vegetation along the streams and near the settlements. Extensive reed swamps, wet forests and marshy vegetation were found in the basin behind the levees, which also contained patches of open water. Small dune patches, emerging like islands from the wetland landscape, were the only permanently dry elements in the direct vicinity. Periodic flooding of the riverbanks indicates that occupation was most probably not year-round (Schepers Reference Schepers2014: 97).
Arable farming
While the presence of cereals at Swifterbant was demonstrated in the 1970s, the debate over local cultivation was resolved with the identification of tillage levels at S4 (Huisman & Raemaekers Reference Huisman and Raemaekers2014; Schepers & Woltinge Reference Schepers, Woltinge, Raemaekers and de Roever2020). The new site chronology dates these levels to 4240–4160 BC (see above). Whether these fields were artificially fertilised, for instance through manuring, or if the repeated flooding with mineral-rich clay provided sufficient nutrients, is unclear. Both the geomorphology of the landscape and extensive coring emphasise that these field plots would have been relatively small, approximately 1600m2 (Schepers & Woltinge Reference Schepers, Woltinge, Raemaekers and de Roever2020: 21).
Fauna
The faunal spectrum at Swifterbant is similar to that of other Late Mesolithic/Early Neolithic sites in the Netherlands (Figure 2). However, there are subtle differences over time. The site of Hardinxveld, near Dordrecht, yielded evidence for small suids and caprines between 4450 and 4250 BC (Çakırlar et al. Reference Çakırlar, Breider, Koolstra, Cohen, Raemaekers, Gron, Sørensen and Rowley-Conwy2020; Brusgaard et al. Reference Brusgaard, Dee, Dreshaj, Erven, van den Hurk, Raemaekers and Çakırlar2022). The nearby sites of Brandwijk (4200–3700 BC) and Schipluiden (3630–3380 BC) also yielded remains of probably domestic pig and, in the case of Schipluiden, cattle populations (Zeiler Reference Zeiler, Louwe Kooijmans and Jongste2006; Çakırlar et al. Reference Çakırlar, Breider, Koolstra, Cohen, Raemaekers, Gron, Sørensen and Rowley-Conwy2020; Kamjan et al. Reference Kamjan, Gillis, Çakırlar and Raemaekers2020). The 4240–4050 BC Swifterbant sites are therefore key sites that bridge the temporal span in the Netherlands when new forms of human-animal relationships were consolidated.
Percentages of faunal remains at Dutch wetland sites from the Late Mesolithic to Middle Neolithic, shown chronologically (figure by authors using data from Zeiler Reference Zeiler, Louwe Kooijmans and Jongste2006; Çakirlar et al. Reference Çakirlar2019; Demirci et al. Reference Demirci, Lucquin, Çakırlar, Craig and Raemaekers2021).

At S3, the main assemblage for this study, suids (Sus sp.: Sus scrofa/Sus domesticus) are well represented with a NISP (Number of Identified Specimens) of 2295; Bos sp. (Bos primigenius/Bos taurus) have a NISP of 326 (see online supplementary material (OSM) Table S1). Palaeogenomic studies of the Swifterbant suids revealed European wild boar haplotypes (Krause-Kyora Reference Krause-Kyora2011) but genetic admixture with wild populations was probably extensive by this time (Frantz et al. Reference Frantz2019). The faunal assemblage otherwise comprises primarily otter (Lutra lutra), beaver (Castor fiber) and red deer (Cervus elaphus), as well as abundant fish remains. The discovery of nine caprine (Ovis/Capra) specimens provides undisputed evidence for the presence of domesticates as wild caprines are not native to the area (Zeiler Reference Zeiler1997a).
Methods
We performed biometric analysis through Logarithmic Size Index (LSI) analysis, determined age-at-death and conducted stable isotope analysis on Bos and Sus remains from S3 to reconstruct relative size distributions, kill-off patterns, diet and environment (Figure 3) (details in OSM1). Using Zooarchaeology by Mass Spectrometry, we re-identified three of the S3 caprines as sheep (Ovis aries), one as cattle and one Bos as a Cervidae (see OSM1). We also conducted stable isotope analysis on seven Bos samples from S4—which, due to its early and narrow date range, provides important information on the chronology of animal husbandry—and include three unpublished Bos and caprine stable isotope results from the recent ‘Windplan Blauw’ rescue excavations. We compare the results visually and statistically to relevant assemblages from the Mesolithic and Neolithic in the wider region.
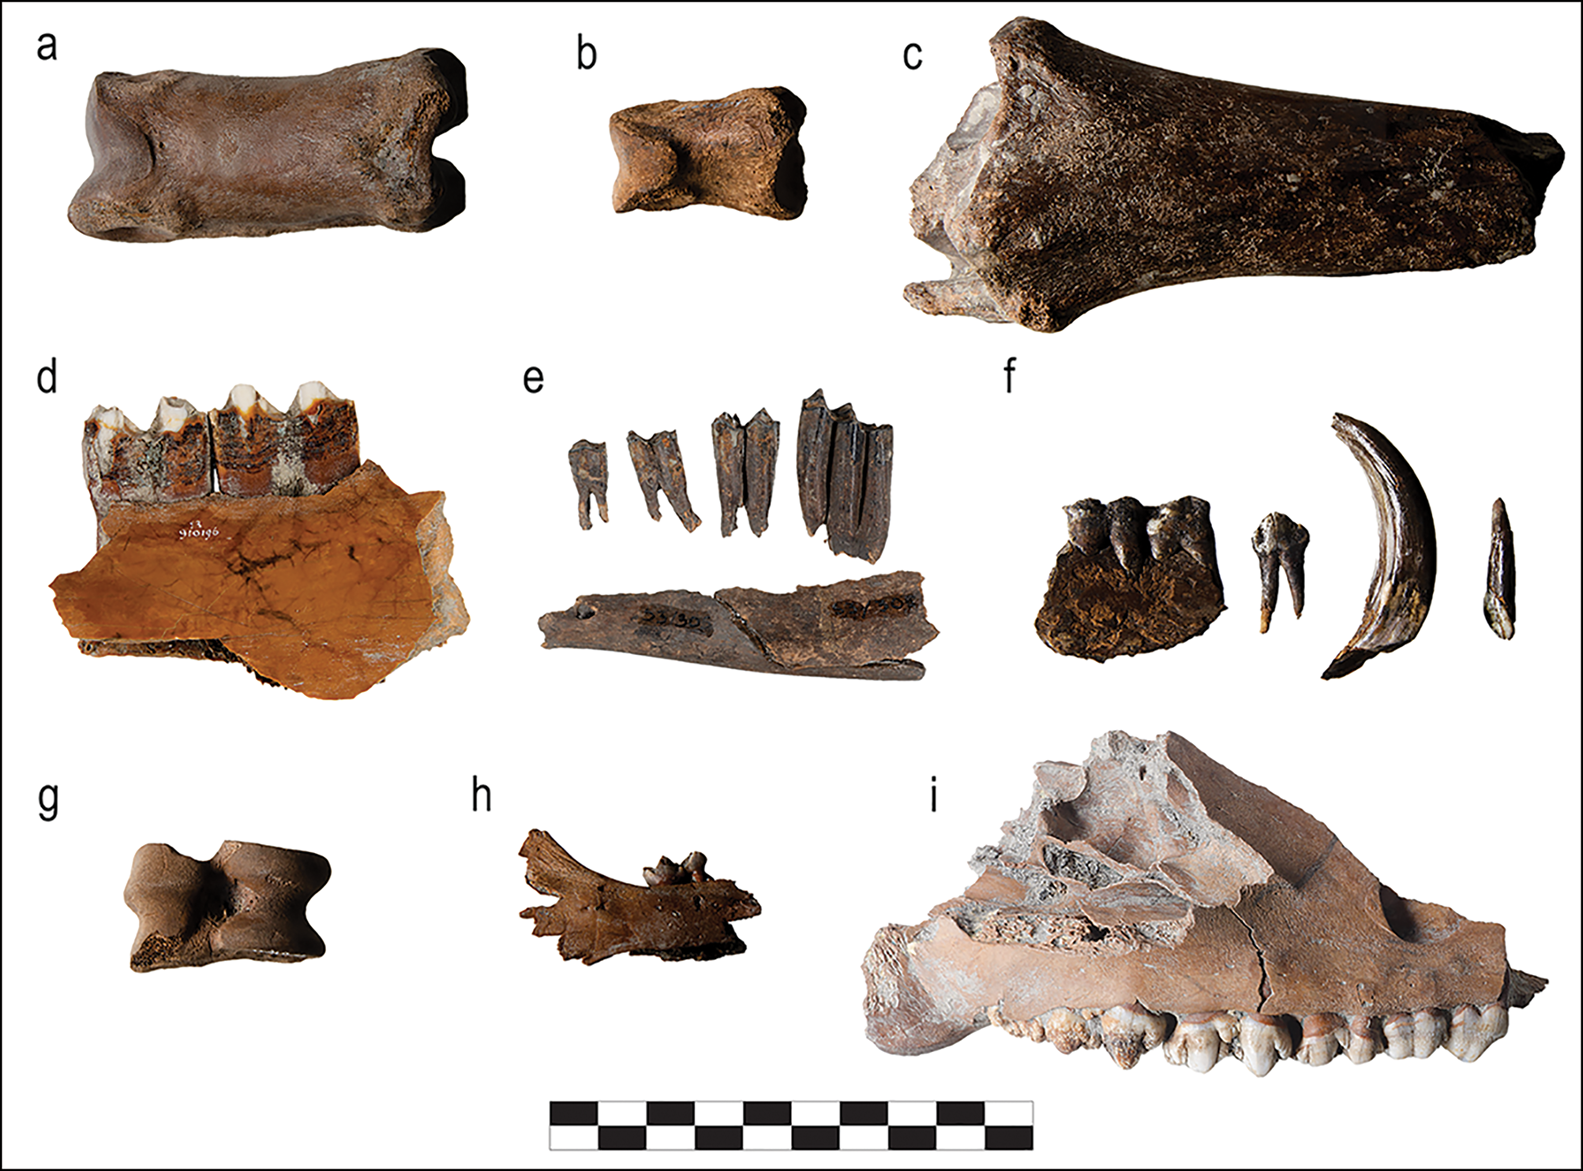
A selection of faunal remains from S3 analysed in this study: a) aurochs phalanx, situated in isotope cluster 2 (EDAN0263); b) domestic cattle phalanx, cluster 1 (EDAN0282); c) domestic cattle tibia, cluster 2 (EDAN0270); d) domestic cattle mandible, cluster 1 (EDAN0191); e) sheep mandible (EDAN0352); f) suid mandible that exhibited elevated δ15N values (EDAN0266); g) suid astragalus, probably wild boar based on metrics (EDAN0309); h) suid mandible that exhibited elevated δ15N values (EDAN0162); i) suid mandible exhibiting enamel hypoplasia (EDAN0172).
Interpretation of stable isotope results requires a nuanced understanding of the local landscape and vegetation. We therefore re-examined previous phytosociological vegetation analyses that detailed plant communities at Swifterbant (Schepers et al. Reference Schepers, Scheepens, Cappers, van Tongeren, Raemaekers and Bekker2013) (details in OSM1). More than using individual plants would do, phytosociology allows for the understanding of vegetation on a landscape ecological level. Here, understanding vegetation thus serves as a proxy for understanding variation in nutrient availability on the landscape level and not as a goal in itself.
Results
Bos
The Swifterbant Bos are significantly smaller than the Ertebølle aurochs (5400–4000 BC), the LBK domestic cattle (5500–4500 BC) and the Swifterbant Culture cattle from Bazel, Belgium (4800–3800 BC) (Figure 4a) (statistics and details in OSM1). They are significantly larger than the cattle at the younger site of Schipluiden (3630–3380 BC). There is little variation in Bos size at S3 with only one exception (EDAN0263), which is, based on metrics, an aurochs (Bos primigenius) (Figures 3 & S1).
Logarithmic Size Index analysis of S3 cattle postcranial elements and suid lower teeth, compared to published assemblages (figure by authors using data from Albarella & Payne Reference Albarella and Payne2004; Manning et al. Reference Manning, Timpson, Colledge, Crema and Shennan2015a; Ervynck et al. Reference Ervynck, Lentacker, Muylaert, van Neer and Meylemans2016; Crombé et al. Reference Crombé, Aluwé, Boudin, Snoeck, Messiaen and Teetaert2020; Brusgaard et al. Reference Brusgaard, Dee, Dreshaj, Erven, van den Hurk, Raemaekers and Çakırlar2022).

Animals of all ages are present in the Bos assemblage, except for very young calves (<6 months). Tooth wear indicates that most of the cattle were between three and eight years old at death (Figure 5a), while the majority of long bones could be aged to 24–30 months or older (Table S7). One foetal bone is present in the assemblage (Zeiler Reference Zeiler1997b). The frequency of different Bos skeletal elements indicates that all body parts are represented at the site (Table S2).
Cattle and suid age profiles at S3 based on tooth wear and eruption compared to published assemblages (figure by authors using data from Albarella & Payne Reference Albarella and Payne2004; Kamjan et al. Reference Kamjan, Gillis, Çakırlar and Raemaekers2020; Brusgaard et al. Reference Brusgaard, Dee, Dreshaj, Erven, van den Hurk, Raemaekers and Çakırlar2022).

The Bos form two distinct dietary clusters, with significantly different δ13C and δ15N values (Figures 6, 7 & S9, Table S15). Cluster 1 consists of Bos with highly elevated δ15N values (mean +11.6‰), similar to the humans and dogs. Their δ13C values (mean –21.1‰) are slightly higher than the Cervidae. The S3 sheep correspond with this cluster. Cluster 2, in contrast, has δ15N values (mean +5.6‰) comparable with wild herbivores. Their δ13C values (mean –23.1‰) are more depleted than the local Cervidae and more similar to the Bos and Cervidae from Hardinxveld. The Windplan Blauw caprine exhibits values more similar to cluster 2. There is no discernible correlation between the cattle clusters and their metrics (Figure S11). Cranial and postcranial elements show the same pattern (Figure S12).
δ13C and δ15N results from Swifterbant S3, S4, and Windplan Blauw. Baseline fauna are all from S3 (figure by authors).

Summary chart showing mean and standard deviation of δ13C and δ15N values from Swifterbant (based on Figure 6) compared to human and faunal values from Hardinxveld (see OSM1). The two groups of Bos were defined by a cluster analysis (figure by authors using data from Smits et al. Reference Smits, Millard, Nowell and Pearson2010; Çakırlar et al. Reference Çakırlar, Breider, Koolstra, Cohen, Raemaekers, Gron, Sørensen and Rowley-Conwy2020; Brusgaard et al. Reference Brusgaard, Dee, Dreshaj, Erven, van den Hurk, Raemaekers and Çakırlar2022).

Suids
The S3 suids are significantly smaller than the wild boar from Mesolithic Polderweg (5450–5300 BC) but not those from De Bruin 1 (5400–5150 BC) (Figure 4b). There is no significant difference in size from the Neolithic pigs at Schipluiden. A few exceptionally small and large individuals stand out. The survivorship profile reveals an emphasis on adults overall, as at Polderweg (Figure 5b), but loose teeth also suggest an abundance of piglets aged 3–5 months (thus unweaned or not fully weaned) (Table S9). As with the Bos, all skeletal elements from Sus are represented at the site.
The S3 suids display a wide range of δ13C and δ15N values, just like the Mesolithic wild boar at Hardinxveld (Figures 6, 7 & S13) but, overall, the S3 suids have more elevated δ15N values. Two individuals have significantly enriched δ15N values (+11.9‰), comparable with the cluster 1 cattle. Both are small in size. The specimen EDAN0162 is a piglet so it may have a suckling signature but EDAN0266 is an adult (Figure 3h & f). Two other suids have slightly elevated δ15N values (>+9‰); both are adults and small in size.
There is otherwise no discernible correlation between size and δ13C and δ15N values (Figure S14). One sampled individual has enamel hypoplasia, an indicator of stress sometimes seen in early domestic pigs (Figure 3i) (Dobney et al. Reference Dobney, Ervynck, Albarella and Rowley-Conwy2004).
Discussion
The results demonstrate two distinct dietary regimes for Bos and caprines at Swifterbant. The size of the Bos at S3 is consistent with their being (morphologically) domestic, particularly given their small size in comparison to the earlier-dated LBK domestic cattle from central Europe. The aurochs specimen is the exception. This makes the S3 Bos the earliest morphologically domestic cattle in Europe north of the LBK zone. Several suids from S3 also appear to be morphologically domestic, of which two have anomalous diets. Do these findings suggest local animal management at Swifterbant?
Human-animal interactions at Swifterbant
The presence of morphologically domestic cattle and suids could point to animal management in Swifterbant. The fact that the Bos are larger than the cattle at Schipluiden is consistent with findings from central Europe where domestic cattle continuously decrease in size from the Early Neolithic to the Late Neolithic (Manning et al. Reference Manning, Timpson, Shennan and Crema2015b). The predominance of adult cattle at S3 is mirrored in Neolithic assemblages at LBK sites and at Schipluiden, but S3 lacks the young calves found at these sites where cattle were exploited for dairy production (Gillis et al. Reference Gillis2017; Kamjan et al. Reference Kamjan, Gillis, Çakırlar and Raemaekers2020). Cattle could have been kept to adult age for a multitude of reasons, including meat, breeding and feasting. The find of a cattle foetal bone supports a scenario of live cattle being kept at Swifterbant. It is otherwise difficult to draw conclusions from the S3 age profiles due to the small sample size. At S4, due to fragmentation, only one adult and one calf (< 3 months) could be identified (Kranenburg & Prummel Reference Kranenburg, Prummel, Raemaekers and de Roever2020). These sites were, however, likely part of a wider system in this landscape and their seasonal occupation may mean that animals were also kept and slaughtered in other areas, or in other seasons.
If the assumption of local animal husbandry is made, the clustering of cattle and sheep dietary isotopes requires further explanation: two different dietary management regimes or the import of livestock from elsewhere are both possibilities. Phytosociological analysis of the local area demonstrates that the difference in mean δ15N values between the clusters could not have been caused by natural variation in nutrient availability in the environment and therefore must be due to human intervention (Figure 8). The fact that the two clusters are also represented in the Bos from S4 demonstrates that the two dietary regimes were already in place at the onset of settlement in the Swifterbant region, from 4240–4160 BC onwards.
Variation in the total amount of nitrogen in the soil (in mg per kg) for the most frequently identified plant communities at Swifterbant arranged from highest to lowest (figure by authors).

One possible explanation for the substantially elevated δ15N values of the cluster 1 Bos and the three sheep is salt-marsh grazing. Elevated δ15N values are observed in cattle and caprines grazing in salt-marsh regions in the prehistoric and historic Netherlands (Prummel et al. see item in References) and in Bronze Age Britain (Britton et al. Reference Britton, Müldner and Bell2008). Cattle and red deer from the coastal site of Schipluiden also have elevated δ15N values (Kamjan et al. Reference Kamjan, Gillis, Çakırlar and Raemaekers2020). Salt marshes were not available in the immediate Swifterbant area. The coast was 50–80km away but represents a terra incognita for this period: due to erosion, there are no preserved coastal sites from the fifth millennium BC. Between the coast and Swifterbant was a brackish, marshy environment that may explain the elevated δ15N values if transhumance were practised (Vos Reference Vos2015). Salt-marsh grazing would therefore indicate seasonal mobility.
Another explanation is manured pasture or feed (Bogaard et al. Reference Bogaard, Heaton, Poulton and Merbach2007). However, if the arable fields at Swifterbant were manured, it is questionable whether livestock would have grazed on or been fed with the stubble consistently enough to produce such elevated δ15N values. Current data indicate that the arable fields at Swifterbant were small and therefore probably not suitable for this purpose. Alternatively, the values could be a result of ‘self-manuring’, whereby plants on (sufficiently small) pasture grounds repeatedly used for grazing will obtain elevated δ15N values due to the accumulation of animal dung, leading to elevated values in the livestock themselves (Shahack-Gross et al. Reference Shahack-Gross, Simons and Ambrose2008; Makarewicz Reference Makarewicz2014). If livestock grazed on the small open plots on the Swifterbant riverbank (Figure 1), this may have occurred. This would also explain the fact that the phytosociological vegetation analyses resulted in the identification of the open environment grassland community Triglochino-Agrostietum nasturtietosum, which persists only under extensive grazing (Sýkora et al. Reference Sýkora, Schaminée, Weeda, Schaminée, Stortelder and Weeda1996; Schepers Reference Schepers2014). Finally, nutritional stress is known to raise δ15N values but not to the degree established in the Swifterbant animals (Doi et al. Reference Doi, Akamatsu and González2017).
The cluster 2 cattle, in contrast, have notably depleted δ13C values. Bone collagen δ13C values of between –22.5‰ and –18.5‰ are typical of herbivores foraging on C3 plants in an open environment (Berthon et al. Reference Berthon, Kovačiková, Tresset and Balasse2018). The δ13C values of cluster 2 are instead most consistent with a diet composed significantly of closed-canopy vegetation, which typically produces more negative values (<–22.5‰, Drucker et al. Reference Drucker, Bocherens, Bridault and Billiou2003). Cluster 2 δ13C values are comparable with aurochs grazing in the dense forests of Atlantic Denmark, whereas the domestic cattle from the Scandinavian Neolithic generally grazed in open environments (Noe-Nygaard et al. Reference Noe-Nygaard, Price and Hede2005; Gron & Rowley-Conwy Reference Gron and Rowley-Conwy2017). The morphological aurochs from S3 also falls within cluster 2; its diet thus corresponds with the Danish aurochs.
Seasonal foddering with forest vegetation would not deplete livestock collagen δ13C values to the extent witnessed in cluster 2; for this, a year-round diet is necessary (Berthon et al. Reference Berthon, Kovačiková, Tresset and Balasse2018). While forest-grazing cattle are not consistent with findings from the Scandinavian Neolithic, there is no reason to assume that this could not have been a management strategy in the Dutch wetlands. Forest-grazing and forest fodder were, after all, cattle husbandry practices used by earlier LBK communities in Europe (Gillis & Zanon Reference Gillis, Zanon, Nicoud, Balasse, Desclaux and Théry-Parisot2021). The Swifterbant area was characterised by forests on the riverbanks, and major parts of the area—in the basins behind the riverbanks—would have been too wet year-round for livestock grazing (Figure 1). Keeping livestock in this region may have necessitated utilising these woods. Alternatively, the cluster 2 cattle may have been acquired from elsewhere (see below).
The presence of very small suids (all adults) at S3 with elevated δ15N values suggests that there were domestic pigs in the assemblage, particularly given the individual with enamel hypoplasia, while the very large suids probably represent wild boar. Suids with isotopic values similar to those of humans and/or dogs at a site might indicate pig husbandry as loosely managed pigs often forage on human refuse (Rosvold et al. Reference Rosvold, Halley, Hufthammer, Minagawa and Andersen2010; Balasse et al. Reference Balasse, Cucchi, Evin, Bălăşescu, Frémondeau, Horard-Herbin, Stépanoff and Vigne2018). It is also possible that the Swifterbant pigs were kept in the same manner as the cattle and sheep, leading to similarly elevated nitrogen values.
The intermediate size of the suids overall could reflect a pig population with genetic admixture—in other words, hybridisation between wild boar and pigs of Near Eastern descent, a documented phenomenon across Europe by this time (Frantz et al. Reference Frantz2019). It could also represent a mixed assemblage made up of managed domestic pigs, hunted wild boar and hybrids (wild or managed). Such a mix would explain the diversity in isotopic values of suids at S3, which are comparable with the Hardinxveld wild boar overall, and the age profile that is similar to Hardinxveld but contains more piglets.
An alternative scenario is that the morphologically domestic animals were not in fact managed by Swifterbant communities. It has been suggested that early incidences of livestock in northern Europe result either from foragers exchanging with neighbouring farming communities, the raiding of those communities or the hunting of feral herds that escaped from farming settlements (Gron & Sørensen Reference Gron and Sørensen2018). If the cluster 2 cattle were hunted feral cattle, this would explain why they have δ13C values comparable to aurochs—although it does not explain why the caprine, which even feral are not typically forest-grazing, also has such low values. The cluster 2 cattle could also have been forest-grazed livestock obtained from other farming communities, though if so it is not currently possible to establish their source. The LBK settlements in the southern Netherlands and Germany date to earlier than Swifterbant. Contemporary farming settlements may have existed downriver to the east, in modern Germany, but current data are too limited to explore this.
A scenario in which livestock are incidentally acquired but not husbanded at Swifterbant would fit with the dates of the emergence of farming in northern Germany and southern Scandinavia, which first occurs after 4000 BC. However, several lines of evidence argue against this. First, the tightly clustered Bos metrics, which suggests a fairly homogeneous assemblage in terms of size, and the scarcity of aurochs fit better with a scenario of cattle management than hunting. The presence of all body parts of Bos and Sus and of a Bos foetal bone also suggests the management of animals on location rather than hunting or just the exchange of butchered remains. This is further implied by the fact that isotopic results from both cranial and postcranial elements fit in the two clusters. Thus, cranial parts found on site—which are less likely to occur through hunting or gift exchange of butchered parts—also derive from animals with distinct diets. Local livestock grazing would also explain the presence of a grassland community that persists only under extensive grazing. The discovery at S3 of several suid coprolites, including two containing cereal remains and one with sheep wool in it, again suggests the presence of live livestock (Kubiak-Martens & van der Linden Reference Kubiak-Martens and van der Linden2022). Finally, the evidence for arable farming testifies to agricultural practices at Swifterbant.
Rethinking the transition
We argue that these lines of evidence make a scenario of local animal management in the period 4240–4050 BC more likely than a scenario of solely exchanging/raiding/hunting livestock. While this would be the earliest evidence for such a practice in northern Europe, and thus inconsistent with the transition narrative in other regions, there is no reason to assume that early farming appeared in the same way at the same time everywhere in northern Europe. Indeed, the Swifterbant Culture already provides evidence for early arable farming unlike anything known in northern Europe for this period (Raemaekers et al. Reference Raemaekers2021). This demonstrates that these communities had already adapted their lifeways to the needs of other species in their care. While the keeping of livestock would have had very specific requirements, there is nothing to suggest these communities did not have the knowledge for such an undertaking, nor that the local environment could not have supported it. In fact, that such dynamic practices should be present in the Swifterbant region is unsurprising considering the richness of resources in this wetland environment (cf. Zeder Reference Zeder2016: 336). The enigmatic dietary regimes of the animals may therefore be the result of management strategies suited to this landscape and its seasonal changes.
The results of this study do, however, leave room for multiple forms of human-animal interactions at Swifterbant. It is plausible, for example, that some cattle and sheep were kept in this region, while some were brought from elsewhere, through transhumance, exchange, raiding or the hunting of feral animals—which could explain the isotopic evidence for two dietary systems. Yet the contrast between earlier Swifterbant Culture sites, where few Bos remains are found, and the presence at Swifterbant of morphologically domestic cattle with managed diets indicates that a change in human-Bos interactions had by this time occurred. The human-suid relationship appears to remain more fluid with an enduring focus on wild boar alongside possible pig management. These results suggest that earlier Swifterbant Culture sites, such as Hardinxveld (5450–4250 BC), could fit with a model where foragers incidentally acquire livestock (Gron & Sørensen Reference Gron and Sørensen2018), but that by 4240–4160 BC in the Swifterbant region communities had assumed control over the diet of domesticated animals. These communities managed their domestic animals and crops while also exploiting natural resources through hunting, gathering, fishing and fowling.
This perspective on the Neolithisation process in the Netherlands has far-reaching implications for our understanding of the Neolithic in northern Europe as a whole. It suggests that sweeping narratives should be reassessed to focus more on local trajectories and regional processes. These results thereby support arguments that domestication should be ‘decentred’ and studied as a multitudinous practice involving complex multispecies relations (cf. Lien et al. Reference Lien, Swanson, Ween, Swanson, Lien and Ween2018). This perspective also has implications for how scholars and the general public view the emergence of agricultural and pastoral societies. There is still the tendency to perceive this as a process whereby farming replaces hunting and gathering, in an evolutionary, linear trajectory (Lavi et al. Reference Lavi, Rudge and Warren2023). The Swifterbant Culture provides a case study that forces us to rethink these narratives and instead investigate the flexibility of prehistoric societies.
Conclusion
This study provides new multi-proxy indications for management of animals in the period 4240–4050 BC, and potentially as early as 4240–4160 BC, in the Dutch wetlands, which included control over diet and/or grazing environment. The discovery of two distinct dietary groups is, to our knowledge, the only example of this in Early Neolithic Europe. The reasons for this distinction remain enigmatic and could reflect different management strategies and/or the acquisition of livestock from elsewhere. We aim to explore this through further analyses. The combined evidence from S3 and S4 suggests that domestic cattle and caprines were managed by Swifterbant communities. Loose pig management may also have taken place, with the continued hunting of wild boar and their interbreeding with the Swifterbant suids.
These results have implications for understanding the adoption of farming practices in northern Europe. Indications for livestock management at Swifterbant in combination with cultivated fields points to communities practising agriculture 4240–4050 BC in an area where the start of the Neolithic is generally placed after 4000 BC. As such, we argue that broad statements about the Neolithisation process north of the LBK zone should be reassessed and replaced with approaches that consider local trajectories. The dynamic processes in the Dutch wetlands can therefore provide new impetus for exploring the emergence of farming in prehistory and the flexibility of prehistoric societies.
Acknowledgements
The authors thank the Flevoland Provincial Archaeological Depot for access to the faunal remains; Elma Schrijer (ADC Archeoprojecten) for the Windplan Blauw data; Jørn Zeiler for helpful discussions on S3; Stephan Hennekens (Wageningen University) for the raw nitrogen data as calculated for different plant communities; Wietske Prummel and colleagues for sharing their salt-marsh isotope data; the scientific and technical staff at the Centre for Isotope Research for their assistance; and the four anonymous reviewers and editor for their insightful comments on this article.
Funding statement
This study is part of ‘The Emergence of Domesticated Animals in the Netherlands’ project, funded by the Dutch Research Council (406.18.HW.026).
Data availability
All data supporting this study are available within the online supplementary materials.
Supplementary material
To view supplementary material for this article, please visit https://doi.org/10.15184/aqy.2024.58.


 Open access