


Tackling the overconsumption of discretionary foods has been described as important for both human and planetary health(Reference Hadjikakou1). Discretionary foods are defined by the Australian Dietary Guidelines(2) as ‘…foods and drinks not necessary to provide nutrients the body needs, but that may add variety’. Such foods and drinks are often high in energy, saturated fat, added sugar, salt or alcohol. Foods and drinks typically included in this definition are sugar-sweetened drinks, cakes, chocolate, ice cream and salty snacks. Non-discretionary foods are contrary, food and beverage items belonging to the core food groups: cereals, vegetables, fruits, legumes, nuts and seeds, fresh meat and fish, and dairy(Reference Hadjikakou1).
From a health perspective, excessive consumption of energy-dense and nutrient-poor food items is associated with an increased risk of CHD, diabetes type 2, some cancer types and dental caries(3,Reference Clinton, Giovannucci and Hursting4) . From a sustainability point of view, the environmental impact of discretionary food products is suggested to be substantial, due to the high degree of processing and packaging related to these products(Reference Friel, Barosh and Lawrence5). The EAT-Lancet Commission described the healthy sustainable reference diet in 2019(Reference Willett, Rockström and Loken6). This diet included plenty of vegetables, fruits, whole grains, legumes, nuts and unsaturated oils. It included, however, a low quantity of foods and components which are typically prevalent in discretionary foods, such as red meat, processed meat, added sugar, refined grains and starchy vegetables(Reference Willett, Rockström and Loken6). In Australia and New Zealand, discretionary foods are estimated to contribute about 30 % of the total food-related greenhouse gas emissions (GHGe)(Reference Hadjikakou1,Reference Drew, Cleghorn and Macmillan7–Reference Hendrie, Baird and Ridoutt9) . It is argued that reducing the production and consumption of discretionary food products should be seen as a crucial step towards aligning human and planetary health and creating a more sustainable food system(Reference Hadjikakou1,10) .
In Denmark, new guidelines for the maximum intake of discretionary foods and drinks were recently suggested for both children and adults, due to both nutritional and sustainability aspects(Reference Biltoft-Jensen, Hess and Christensen11). In Norway, the food-based dietary guidelines recommend maintaining a good balance between the amount of energy consumed and the amount of energy spent through physical activity and limiting the consumption of energy-dense foods and drinks that are high in sugar, saturated fat and salt(12). However, we do not have specific guidelines for discretionary foods, and little is known about the amount consumed among children and adolescents and how such foods and drinks affect the quality of their diet from a nutritional perspective.
The present study aimed to identify the amount of discretionary foods and drinks consumed by Norwegian children and adolescents, describe how such products contribute to the intake of total energy and nutrients, and study the distribution in intake of discretionary foods and drinks across different meals. Secondly, we aimed to explore factors associated with children and adolescents having the highest consumption of discretionary foods and drinks.
Methods
Study population and design
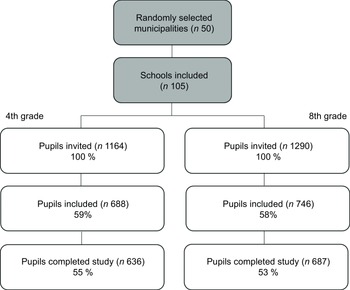
This study was a secondary analysis of data from the ‘Ungkost 3’-study, which is a national survey of dietary intake among Norwegian children in 4th grade (9–11 years) and 8th grade (12–14 years)(Reference Hansen, Myhre and Johansen13). The data were collected during the second half of 2015 and included 108 schools in fifty randomly selected municipalities in Norway. The final sample included 636 pupils in 4th grade and 687 pupils in 8th grade, representing a participation rate of 55 % and 53 % respectively, as illustrated in Fig. 1. All invited pupils were given information about the study and their parents or guardians signed a written consent form. The pupils were instructed through a physical classroom demonstration on how to record their dietary intake in a web-based food diary (WebFR) for 4 d. The start of the registration period was either a Wednesday or a Sunday to secure that 3 weekdays (Monday – Friday), and 1 weekend day (Saturday – Sunday) were included for all participants.
Flow diagram of recruitment and participation

Assessment of dietary intake
The WebFR was based on the Danish Web-based Dietary Assessment Software for Children (WebDASC)(Reference Biltoft-Jensen, Trolle and Christensen14) validated for use among 9- to 11-year-old Danish children(Reference Biltoft-Jensen, Hjorth and Trolle15) and later validated in a similar Norwegian population(Reference Medin, Hansen and Astrup16,Reference Medin, Astrup and Kasin17) . The food diary was developed and adapted for use in a Norwegian context including a database with 570 of the most commonly used food and beverage items in Norway. Pictures showing portion sizes in a series of two to four pictures were included. The food diary was structured around six meals including three main meals (breakfast, lunch and dinner) and three snacks in between. An interactive character was used to guide the participants through the day’s eating occasions. As an evening meal is common in Norway, the snack after dinner was defined as ‘supper’ for the analyses included in this paper. The remaining two snacks between breakfast and lunch, and lunch and dinner, were merged into a common ‘snack’. The food and beverage items could be recorded through drop-down lists with different categories or through free text search. The recording included portion size estimations and the number of portions consumed. The food diary included prompting questions regarding the use of butter or margarine, bread spreads and beverages with the meal. At the end of the day, the participant was shown an overview of all recorded food and beverage items during the day with the possibility of adding or deleting food items. The food diary was designed in such a way that the children and adolescents could do a lot of the recording themselves in collaboration with their guardians. Guardians were instructed to assist the youngest participants (4th graders). After completing each day’s recording, the participant got access to a computer game as a reward. If the participant forgot to record their dietary intake, an automated email was sent to the participants’ guardians as a reminder.
Participant characteristics
Information about the children’s and adolescents’ age, sex, self-reported weight and height and parental education was provided from questions included in the written consent form. Parental education level was categorized into low and high education. A low education level was defined as both parents and guardians having a high school education or lower whereas a high education level was defined as at least one parent or guardian having a university or university college degree. Underweight, normal weight, overweight and obese participants were defined by using the age and sex-specific BMI (ISO-BMI) defined by Cole and Lobstein(Reference Cole and Lobstein18). Due to few obese participants, overweight and obesity were merged into one category when comparing quartiles.
Definition of discretionary foods and drinks
In the present study, we included cakes, buns, waffles, muffins, biscuits and other pastries, potato crisps, chips and similar snacks, ice cream, including sorbet, sweet desserts, all sugar-sweetened drinks including soft drinks, fruit drinks, sports drinks and energy drinks, sugar confectionaries, including chocolate, sugar candy or sweets, sweet spreads and sweet snack bars in the definition of discretionary foods. This definition was based partly on previous work by Medin et al. in the same study population(Reference Medin, Myhre and Diep19) and recent studies in another Norwegian(Reference Røed, Medin and Vik20), a Danish(Reference Cramer-Nielsen, Bestle and Biltoft-Jensen21) and seven European populations(Reference Livingstone, Celis-Morales and Navas-Carretero22).
Estimated energy requirements
The estimation of average energy requirements was based on the Nordic Nutrition Recommendations reference values for the age groups and an average physical activity level(10). For the 4th graders, the estimated daily energy requirement was 7120 kJ for girls and 7660 kJ for boys using reference values for 9-year-olds with an average physical activity level of 1·57. The corresponding values for the 8th graders were 9170 kJ for the girls and 9990 kJ for the boys using an average physical activity level of 1·73(10).
Data analysis and statistics
The dietary calculation programme ‘Kostberegningssystem’, database version AE-14, at the University of Oslo, Norway(Reference Rimestad, Løken and Nordbotten23) was used to calculate the dietary variables. Descriptive analyses were conducted to assess the background characteristics of the participants, to calculate the participants’ intake of discretionary foods and drinks, their contribution of nutrients and their distribution across meals. For micronutrients, analyses were conducted for Vitamin D, calcium and iron as these nutrients previously have been shown to be below recommended intakes in groups of this population and they are particularly important for children and adolescents who are still growing. Dietary supplements were excluded from the analyses of dietary intake.
To test differences between participants in the lowest quartile (≤25) and the highest quartile (≥75) of discretionary food and drink intake concerning background variables, the Pearson chi-squared test or Ficher’s exact test was used. For selected food groups, the Independent samples t test was used. As the results revealed significant differences between boys and girls, the analyses were done separately for both genders.
All statistical analyses were conducted in IBM SPSS Statistics version 28. The tests conducted used a two-sided significance level of 1 %, to account for multiple testing.
Ethics
The study was acknowledged by the Norwegian Centre for Research Data (reference number: 41 946). Written consent was obtained from the parents/guardians of all participants. All children and adolescents completing the study received a gift certificate worth 200 NOK (approximately 20 EUR).
Results
Characteristics of the study population
The background characteristics of the participants in Ungkost 3 are shown in Table 1. The age ranged from 8 to 15 years, with the majority of 4th graders being 9 years old and the majority of 8th graders being 13 years old. Most of the children in both 4th and 8th grade (77 %) were of normal weight, and 82 % of the 4th graders and 71 % of the 8th graders came from families where at least one of the parents/guardians had education from a university or university college.
Background characteristics of the study population in Ungkost 3
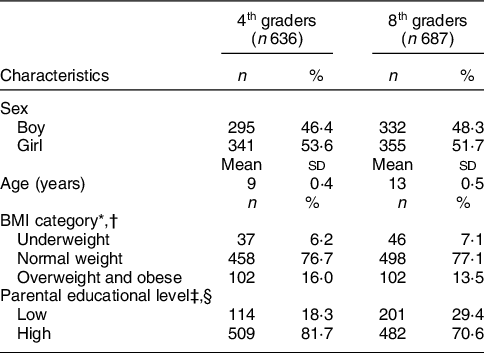
* Based on Cole and Lobstein, using ISO-BMI(Reference Cole and Lobstein18).
† Missing BMI values: n 39 for 4th graders and n 41 for 8th graders.
‡ Low education is defined as both parents/guardians having an education maximum at the high school level. High education is defined as at least one parent/guardian having a university or university college degree.
§ Missing parental education values: n 13 for 4th graders and n 4 for 8th graders.
Intake of discretionary foods
The majority of the children and adolescents included some types of discretionary foods and drinks in their diet, as shown in Table 2. Discretionary foods and drinks constituted about 20 % of the total energy intake for both the 4th and the 8th graders, and also related to estimated reference energy requirements as defined by the Nordic Nutrition Recommendations(10). Sugars-sweetened drinks constituted about 60 % of the total intake of discretionary foods and drinks in grams in both age groups.
Intake of discretionary foods and drinks (DF) among 4th graders and 8th graders
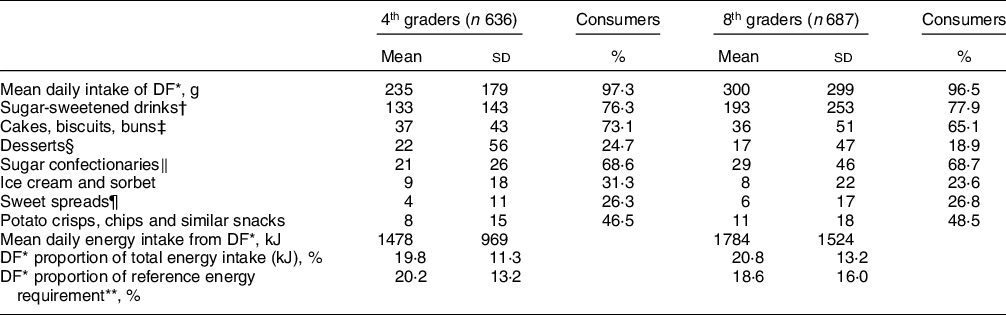
* DF: Discretionary foods.
† Includes soft drinks, cordial and iced tea.
‡ Includes cakes, muffins, waffles, buns, biscuits and other pastries.
§ Includes puddings, jelly, whipped cream, etc.
‖ Includes chocolate, sugar candy and sweets.
¶ Including chocolate spread, honey and other sweet spreads.
** Based on estimated daily energy requirements for children and adolescents in Nordic Nutrition Recommendations 2012(10).
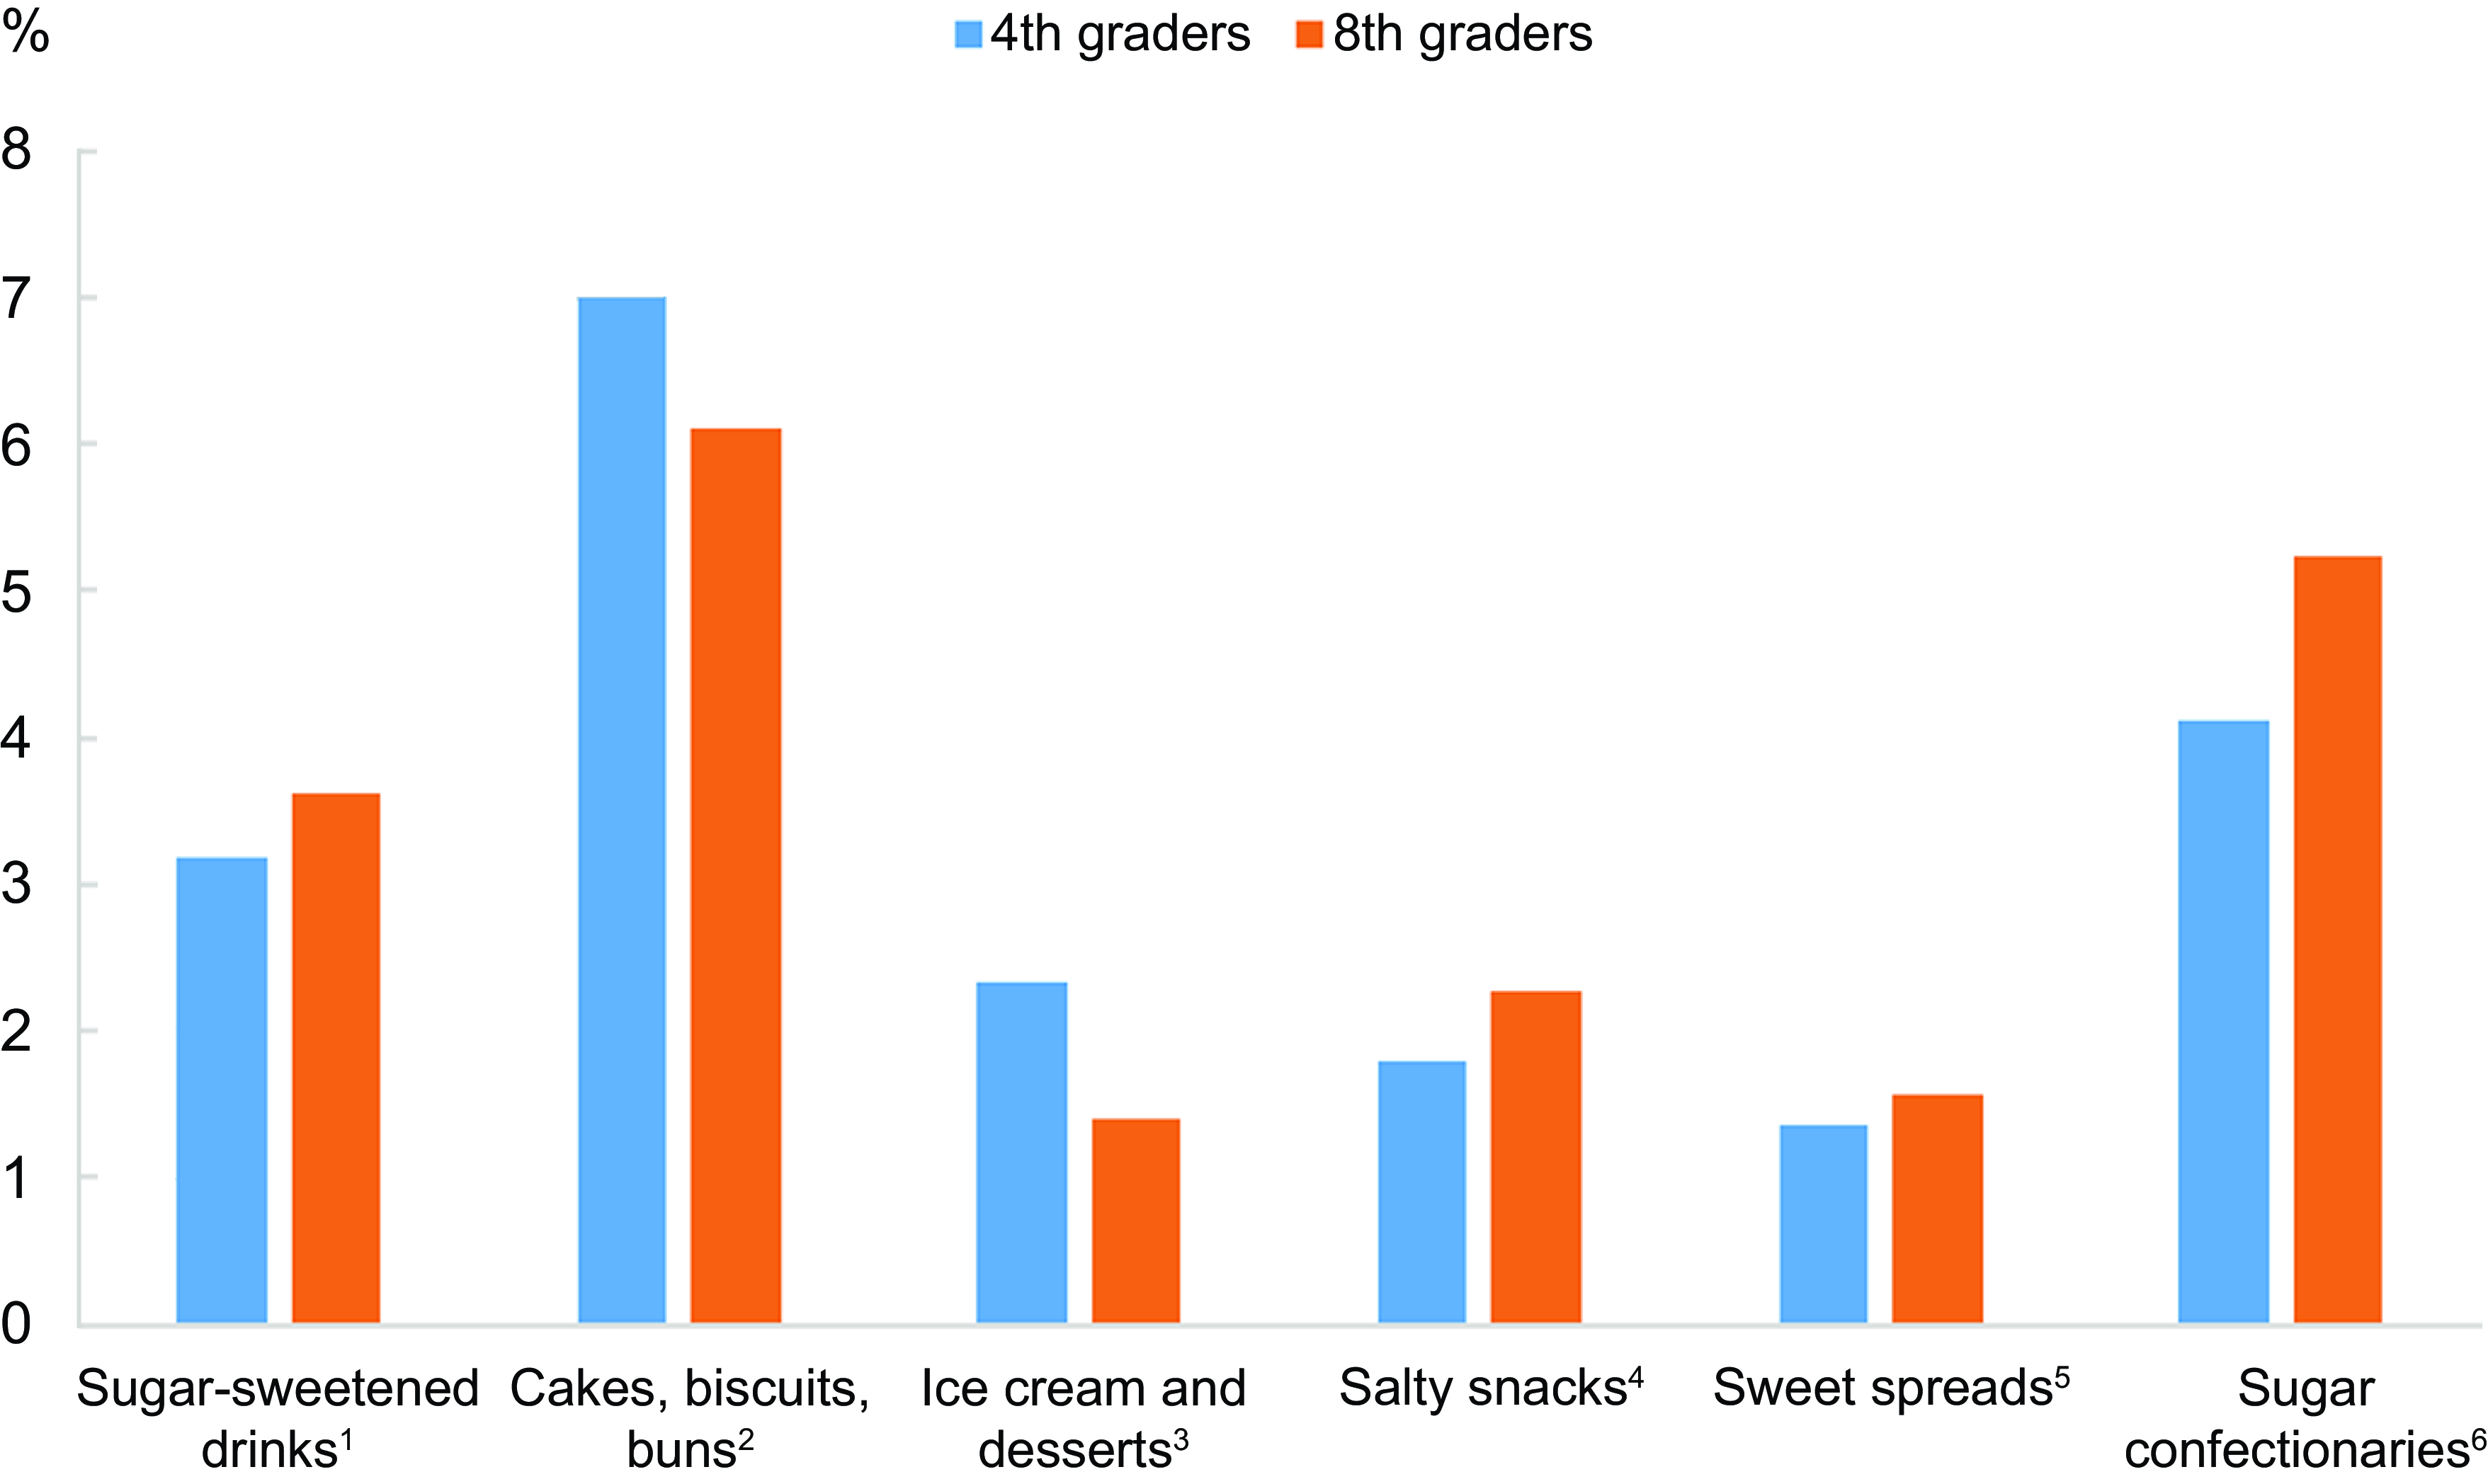
Figure 2 illustrates how different types of discretionary foods and drinks contributed to the total energy intake among the 4th and 8th graders. Cakes, biscuits and buns constituted the largest contribution of the total energy intake in both age groups, followed by sugar confectionaries and sugar-sweetened drinks.
Percentage contribution of discretionary foods and drinks to the total energy intake among the 4th and 8th graders. Non-discretionary foods and drinks are not included in the figure. 1Includes soft drinks, cordial and iced tea. 2Includes cakes, muffins, waffles, buns, biscuits and other pastries. 3Includes ice cream, sorbet, puddings, jelly, whipped cream, etc. 4Includes crisps, chips and similar snacks. 5Includes chocolate spread, honey and other sweet spreads. 6Includes chocolate, sugar candy and sweets
The contribution of selected nutrients from discretionary foods and drinks is shown in Table 3. Discretionary foods and drinks constituted about two-thirds of the total daily intake of added sugar for both the 4th and the 8th graders. About 17 % of the total intake of saturated fat and about 8 % of the total salt intake came from discretionary foods and drinks. Discretionary foods and drinks contributed to about 10 % of the daily intake of dietary fibre and calcium, about 8 % of the protein intake, and about 10 % of the daily intake of vitamin D and iron in both age groups.
Mean daily intake of nutrients* from discretionary foods and drinks (DF) and the total diet
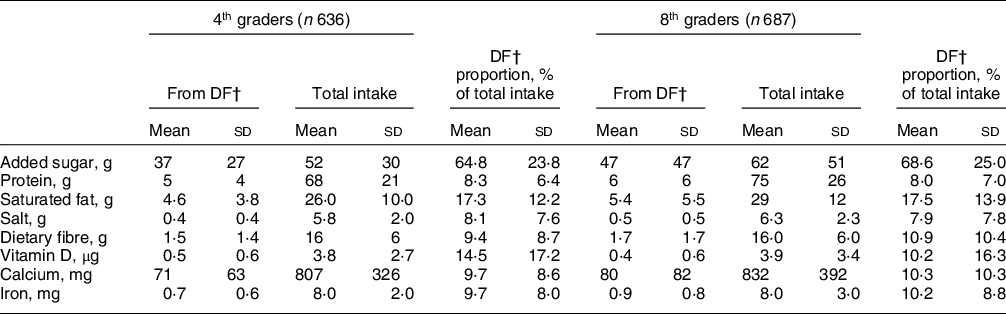
* Dietary supplements are excluded from the analysis.
† DF: Discretionary foods and drinks.
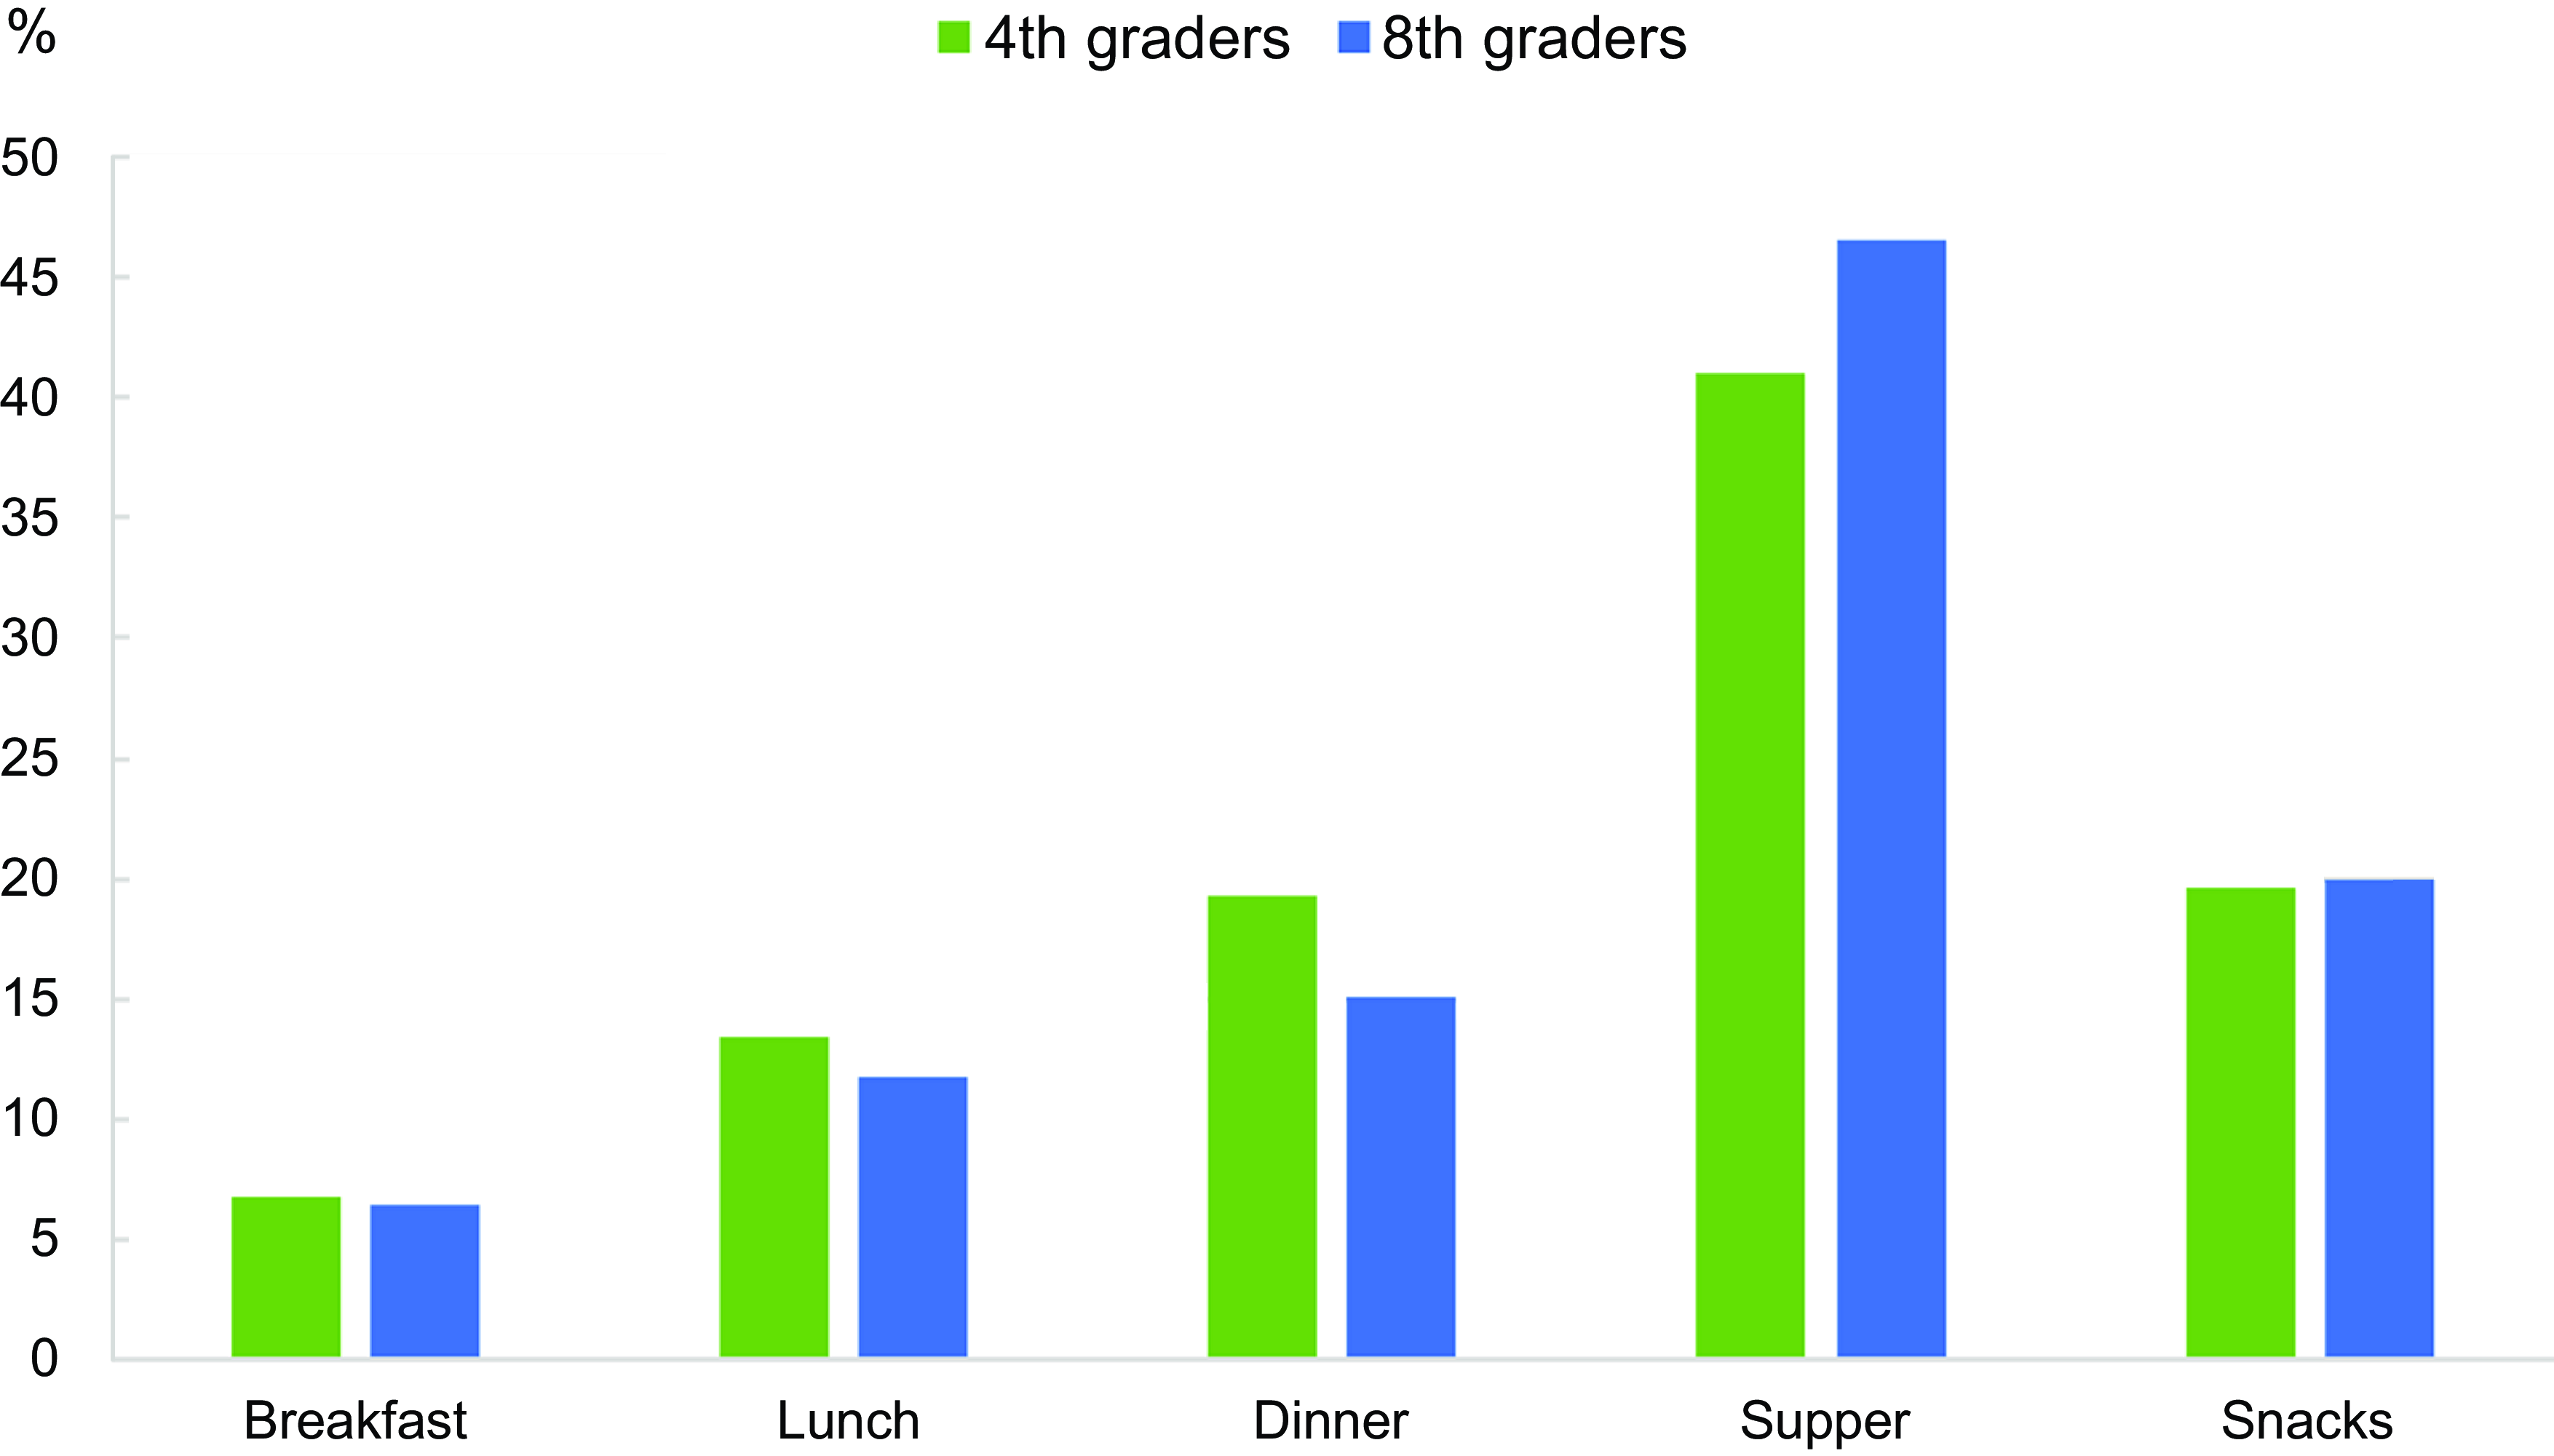
The supper meal contributed more than 40 % and the snacks contributed about one-fifth of the total energy from discretionary foods and drinks in both age groups (Fig. 3). The breakfast and lunch meals contributed the least to the total discretionary foods and drinks consumption.
Percentage distribution for the intake of energy (kJ) from discretionary foods and drinks at different meals among the 4th and 8th graders
A wide distribution in the intake of discretionary foods and drinks was found among children and adolescents. Almost 60 per cent of the 4th and 8th graders in the quartile having the highest (≥75 percentile) proportion of their energy intake from discretionary foods and drinks were girls. Due to significantly more girls than boys in the highest quartile, the analyses for other background characteristics were done separately for each gender, as shown in Tables 4 and 5.
Characteristics among 4th graders in the lowest and highest quartile for the proportion of daily energy intake from discretionary foods and drinks
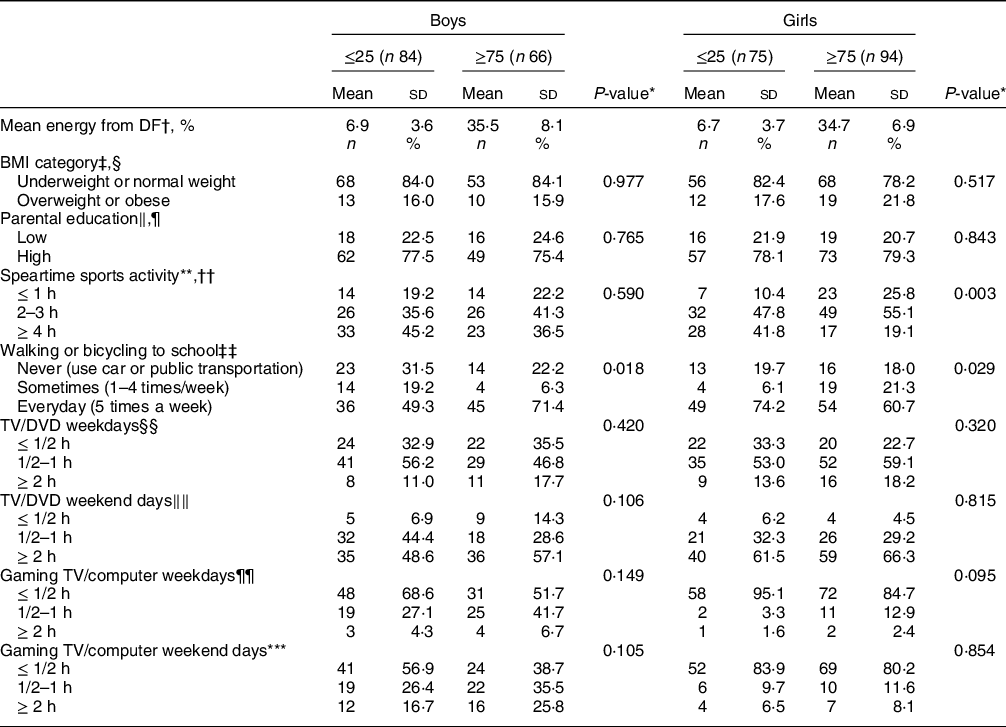
* Chi-square of Fishers’ exact test. Fisher’s exact test for Girls TV weekend days and Gaming weekend days, and for girls and boys Gaming weekdays. Significance level P < 0·01.
† DF: Discretionary foods and drinks.
‡ Based on Cole and Lobstein(Reference Cole and Lobstein18).
§ Missing BMI values n 20.
‖ Low education: both parents/guardians have an education maximum at the high school level. High education: at least one parent/guardian having a university or university college degree.
¶ Missing parental education values: n 9.
** Number of h/week of sports activities outside school hours.
†† Missing sports activities values: n 27.
‡‡ Missing walking or bicycling to school values: n 28.
§§ Missing TV/DVD weekdays: n 30.
‖‖ Missing TV/DVD weekend days: n 30.
¶¶ Missing gaming weekdays: n 43.
*** Missing gaming weekend days: n 37.
Characteristics among 8th graders in the lowest and highest quartile for the proportion of daily energy intake from discretionary foods and drinks
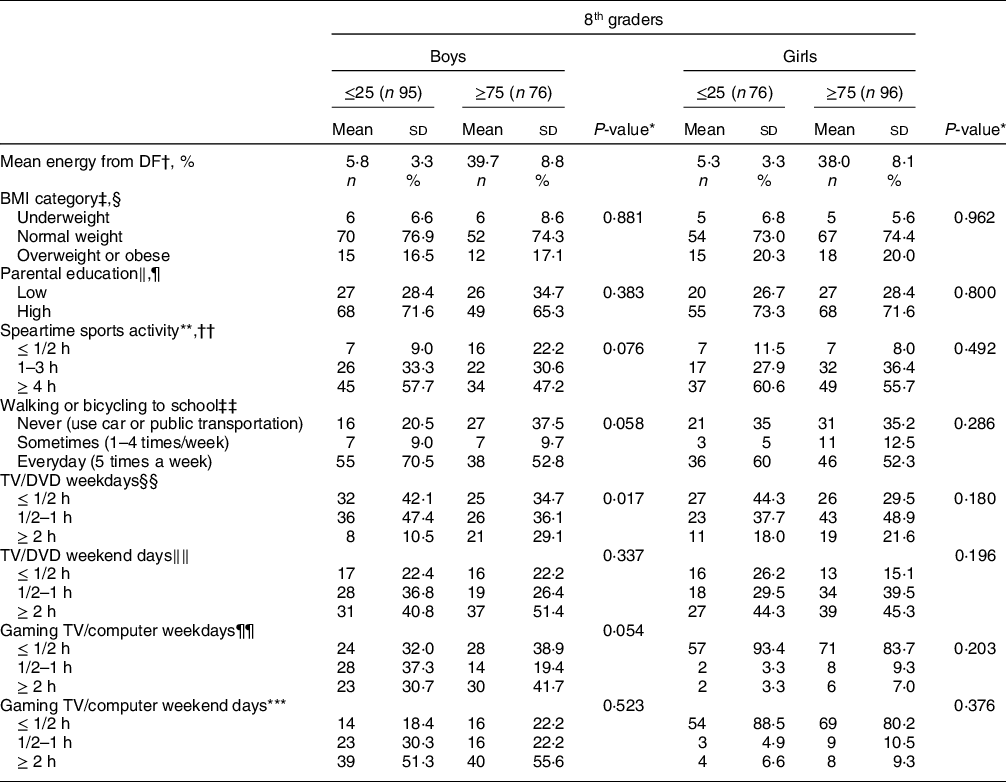
* Chi-square test. Fisher’s exact test for girls Gaming weekdays and Gaming weekend days. Significance level P < 0·01.
† DF: Discretionary foods and drinks.
‡ Based on Cole and Lobstein(Reference Cole and Lobstein18).
§ Missing BMI values n 18.
‖ Low education: both parents/guardians have an education maximum at the high school level. High education: at least one parent/guardian having a university or university college degree.
¶ Missing parental education values: n 3.
** Number of h/week of sports activities outside school hours.
†† Missing sports activities values: n 44.
‡‡ Missing walking or bicycling to school values: n 45.
§§ Missing TV/DVD weekdays: n 46.
‖‖ Missing TV/DVD weekend days: n 48.
¶¶ Missing gaming weekdays: n 49.
*** Missing gaming weekend days: n 48.
Among the 4th graders, a significantly higher proportion of the girls in the ≤25 percentile for discretionary food and drink intake had ≥4 h of sports activities outside school hours compared with those in the ≥75 percentile. However, this was not found for the boys in 4th grade (Table 4) nor the 8th graders (Table 5). No significant differences in discretionary food and drink intake were seen according to BMI category, parental education level or screen time (Tables 4 and 5).
Tables 6 and 7 show the intake of selected food groups among the 4th and 8th graders in the lowest and highest quartile for the proportion of daily energy intake from discretionary foods. Among the 4th graders, the intake of fruit and vegetables, whole grain and fish and seafood was significantly higher for the children in the ≤25 percentile compared to the ≥75 percentile for discretionary food and drink intake. For the adolescents (8th graders), the same tendency was found for whole grain and fish and seafood (Table 7). For red and processed meat, the opposite tendency was observed with a higher intake among those in the lowest quartile for discretionary foods compared to the highest. However, this was only significant for the girls in the 4th grade. Among the 8th graders, the energy intake was significantly higher among those in the ≥75 percentile for discretionary food and drink intake compared to the ≤25 percentile; however, this difference was not seen for the 4th graders.
Intake of selected food groups among 4th graders in the lowest and highest quartile for the proportion of daily energy intake from discretionary foods and drinks
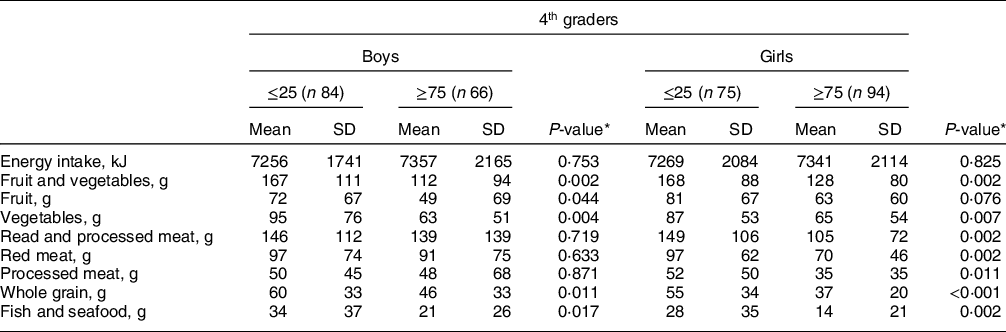
* Independent samples t test.
Intake of selected food groups among 8th graders in the lowest and highest quartile for the proportion of daily energy intake from discretionary foods and drinks
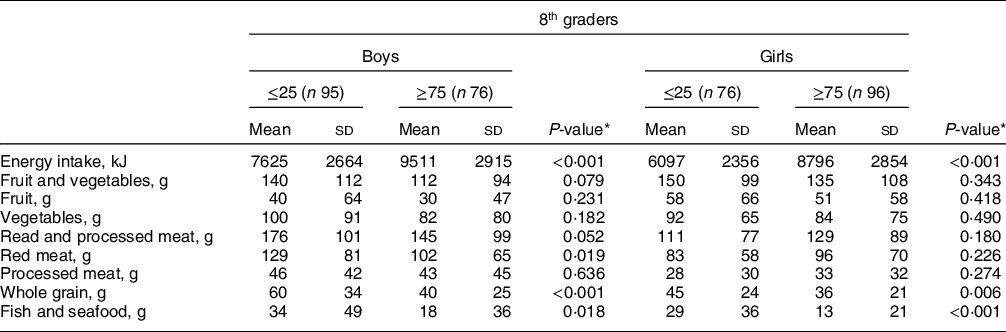
* Independent samples t test.
Discussion
The present study found that discretionary foods and drinks were consumed by almost all 4th and 8th graders in Norway and constituted more than 20 % of their total energy intake. Discretionary foods and drinks contributed to about two-thirds of the total daily intake of added sugar in both age groups and contributed with limited amounts of dietary fibre, vitamin D, calcium and iron. The supper meal contributed the most to the energy intake from discretionary foods and drinks in both age groups. There were significantly more girls than boys in the quartile with the highest proportion of energy intake from discretionary foods and drinks. The intake of whole grains, and fish and seafood was higher among the quartile of 4th and 8th graders having the lowest proportion of their energy intake from discretionary foods and drinks. The same tendency was seen for fruit and vegetables, but only for the 4th graders.
Definition of discretionary foods and drinks
The definition of discretionary foods and drinks varies between studies and has consequences for the estimates of total consumption. Studies conducted in Australia and New Zealand include processed meats, sausages, commercial burgers and pizza in the definition(Reference Hadjikakou1,Reference Drew, Cleghorn and Macmillan7–Reference Hendrie, Baird and Ridoutt9) , whereas studies from European populations,(Reference Cramer-Nielsen, Bestle and Biltoft-Jensen21,Reference Livingstone, Celis-Morales and Navas-Carretero22) which are more comparable to a Norwegian setting, do not include such food items. In the present study, we included the definition as described in Denmark(Reference Cramer-Nielsen, Bestle and Biltoft-Jensen21) and other European populations(Reference Livingstone, Celis-Morales and Navas-Carretero22) and from a previous study using data from the same population(Reference Medin, Myhre and Diep19), which means that we did not include processed meats, sausages, burgers and pizza.
Intake of discretionary foods and drinks
The observed contribution from discretionary foods and drinks to total energy intake in the present study corresponds with data from a recent Australian publication by Fayet-Moore et al. (Reference Fayet-Moore, McConnell and Tuck24) using data from a nationally representative sample of almost 3000 children and adolescents from 2–18 years. Fayet-Moore et al. found that 99% of Australian children and adolescents consumed discretionary foods, in comparison to 97 % in the present study. In the present study, discretionary food and drinks constituted more than 20 % of the participants’ total energy intake. Even higher intake was found in the Australian study where more than one-third of daily energy intake came from discretionary foods and drinks for all age groups except children aged 2–3 years(Reference Fayet-Moore, McConnell and Tuck24), although as already explained, the definition of discretionary foods included more food groups in the Australian study.
According to Danish dietary recommendations, the consumption of discretionary foods and drinks should not exceed 5 % of the total energy intake among 9-year-olds and 6 % among 13-year-olds(Reference Biltoft-Jensen, Hess and Christensen11). Denmark is a country comparable to Norway in several manners. The present study indicates that Norwegian children and adolescents consume about four times the maximum recommended amount, according to the Danish recommendations(Reference Biltoft-Jensen, Hess and Christensen11).
Discretionary foods and drinks constituted more than two-thirds of the total daily intake of added sugar for both the 4th and the 8th graders and this exceeded the maximum recommended intake of 10 percentage of energy (E %) from added sugar. At the same time, discretionary foods and drinks contributed a very limited amount of dietary fibre, vitamins and minerals, strengthening the current definitions of discretionary foods and drinks as being of low nutritional quality(Reference Hadjikakou1).
Types of discretionary foods and drinks consumed and distribution between meals
Among the Norwegian children and adolescents, the discretionary food and beverage items contributing the most to the total energy intake were cakes, biscuits and buns, followed by sugar confectionaries and sugar-sweetened beverages in both age groups. Cakes, muffins, scones, cake-type desserts, sweet biscuits and pastries were the food items contributing the most to daily discretionary foods energy intake in the Australian study by Fayet-Moore et al.(Reference Fayet-Moore, McConnell and Tuck24). The present study indicated that the supper meal contributed the most to the energy intake of discretionary foods, followed by snacks. Fayet-Moore et al.(Reference Fayet-Moore, McConnell and Tuck24) found dinner to be the highest contributing meal, in addition to snacks.
As the food diary used in the present study was organized into six eating occasions including three main meals (breakfast, lunch and dinner) and three snacks, everything consumed after dinner was recorded in the last snack which was defined as supper, as described in the method section. This implies that both traditional Norwegian supper consisting of, for example, bread and milk and also typical snack products like potato crisps or sugar confectionaries are included in this meal category. Norway also has a tradition of children consuming sweets and other snacks particularly on Saturday evenings, which probably also has contributed to the higher intake of discretionary foods from supper.
Characteristics of low v. high consumers of discretionary foods and drinks
We found significantly more girls than boys in the quartile with the highest contribution from discretionary foods and drinks to the total energy intake. We also found a tendency among the 4th graders to a higher frequency of sports activities outside school hours among those girls having the lowest proportion of their energy intake from discretionary foods and drinks. It has previously been demonstrated that children and adolescents with higher levels of physical activity have a more preferable dietary pattern than those with lower physical activity levels(Reference Manz, Mensink and Finger25–Reference Platat, Perrin and Oujaa28).
No significant differences in intake of discretionary foods were seen related to BMI, parental education level or screen time. The sample in the Ungkost study had parents/guardians with higher education compared to the general population in Norway(29), and this may have affected the results. The Australian publication described above found no significant differences between sex, socio-economic status, physical activity or BMI. However, more females than males exceeded the recommended maximum discretionary foods and beverages servings, as females have lower maximum discretionary foods and beverages serving target due to lower mean energy requirements(Reference Fayet-Moore, McConnell and Tuck24).
Implications for sustainability aspects
To add variation to the diet and to ensure a realistic dietary pattern, it is relevant to include some energy from discretionary foods and drinks(Reference Lassen, Christensen and Trolle30). However, the results from the present study show that the intake among Norwegian children and adolescents largely exceeds recommended maximum intake in comparable countries(Reference Biltoft-Jensen, Hess and Christensen11).
The results in the present study indicated that the 4th graders with the lowest proportion of daily energy intake from discretionary foods and drinks had higher intakes of fruit and vegetables, whole grains, and fish and seafood compared to those with the highest discretionary food and drink intake. The same tendency was found for whole grains and fish and seafood among the 8th graders. Fruits and vegetables, whole grains and fish and seafood are food groups the population are recommended to increase the intake of, and which should be included in a sustainable diet(Reference Willett, Rockström and Loken6). The intake of red and processed meat was also higher among those 4th graders with the lowest proportion of daily energy intake from discretionary foods and drinks, but only for the girls. A high intake of red and processed meat does not align with recommendations for a sustainable diet(Reference Willett, Rockström and Loken6,Reference Springmann, Spajic and Clark31) . One could argue that the result with a higher intake of the food groups included in the present study in the ≤25 percentile for discretionary food intake implies that a low intake of discretionary food leads to a higher intake of whole foods at the expense of more processed foods, which typically characterize discretionary foods.
A recent systematic review of methods for combining health and environmental assessment of foods and diets argues that future research on sustainable diets would benefit from a greater focus on dietary changes that enable reduced intake of discretionary foods and excessive energy intake(Reference Guo, Bryngelsson and Strid32). The Australian study by Hadjikakou(Reference Hadjikakou1) showed that discretionary foods and drinks account for a significant part of the diet-related life cycle water use, GHGe and land use. A recent Danish study highlighted the need to avoid excessive consumption of discretionary foods and drinks to meet nutrient and food group recommendations without exceeding energy needs(Reference Cramer-Nielsen, Bestle and Biltoft-Jensen21). The authors argue that one of the main points to consider when adopting a more sustainable healthy plant-based diet is to limit discretionary foods and drinks(Reference Cramer-Nielsen, Bestle and Biltoft-Jensen21). This also complies with Australian data, showing a large potential to save dietary emissions by significantly reducing discretionary food intake(Reference Hendrie, Baird and Ridoutt9). A study among Swedish adults studying secular trends in diet-related GHGe since the year 2000 showed that men and women in all age groups decreased their dietary GHGe over the last 20 years and at the same time decreased their intake of discretionary foods(Reference Mehlig, Blomqvist and Klingberg33).
National dietary guidelines
Several countries have included specific guidelines for the consumption of discretionary foods and drinks, such as Australia(2), Denmark(Reference Biltoft-Jensen, Hess and Christensen11) and the United States(Reference Britten, Marcoe and Yamini34). As such, food and beverage items contribute a high proportion of the intake of added sugar and limited amounts of nutrients, one could argue that Norway also should include guidelines for discretionary foods intake. As the environmental impact of discretionary food consumption is suggested to be substantial(Reference Friel, Barosh and Lawrence5), the recent work with revising the Nordic Nutrition Recommendations and the subsequent Norwegian revised recommendations should take these aspects into account.
A qualitative study among Australian children and adolescents suggested that the maintained excessive intake of discretionary foods and drinks may be partly due to misinterpretation of the national guidelines among the youth. Whilst Australian children and adolescents agreed that discretionary foods and drinks should be consumed only sometimes and in small amounts, they still interpreted this to represent regular intake(Reference Velardo and Drummond35). A recent qualitative study in a Norwegian setting found that adolescents experience several barriers to healthy dietary behaviours and that these barriers varied with socio-economic position(Reference Havdal, Fosse and Gebremariam36). Among the adolescents in the lower socio-economic position neighbourhoods, fast food restaurants were a preferred social arena and western dishes were preferred over the food served at home(Reference Havdal, Fosse and Gebremariam36). In the current study, the parental education level was high which indicates a high socio-economic position among the participating children and adolescents.
Strength and weaknesses
A strength of this study is that it includes a large, nationally representative sample size. Moreover, the WebFR has previously been validated in a similar sample as the current study sample using objective markers(Reference Medin, Hansen and Astrup16,Reference Medin, Carlsen and Andersen37) . The WebFR was able to rank participants according to their intake of foods rich in carotenoids(Reference Medin, Carlsen and Andersen37); however, energy intake was significantly underestimated compared with total energy expenditure(Reference Medin, Hansen and Astrup16). The data collection period did not include the spring and summer semester, and this may have influenced the results as typical seasonal products as, for example, strawberries or ice cream have been underestimated.
The participation rate in the present study was 55 % among the 4th graders and 53 % among the 8th graders. The high proportion of non-participating children and adolescents may affect the generalizability of the results. A large proportion of the children lived in families with one or more parents/guardians with high education level. In 2015, 39 % of individuals between 30–66 years in Norway held a higher educational degree(29). In the current study, 82 % of the 4th graders and 71 % of the 8th graders had a least on parent/guardian with higher education, indicating that this sample is a selection of children and adolescents from highly educated families. As it is well known that lower socio-economic status is associated with a more unhealthy diet(Reference Watts, Mason and Loth38), this may also affect the generalizability of the study. The data on body weight and height were self-reported, which is a weakness to the study as weight is often underestimated whereas height is overestimated(Reference Connor Gorber, Tremblay and Moher39). In the present study, energy intake among the participants was probably underreported as previous results in the same study population showed that more than one-third of the children and adolescents were identified as under-reporters of energy(Reference Medin, Hansen and Astrup16). As unhealthy foods most typically are underreported due to social desirability bias(Reference Börnhorst, Huybrechts and Ahrens40), this might indicate that children and adolescents in Norway consume even more discretionary foods and drinks than was seen in the results from the present study.
Lastly, the data from the present study were collected in 2015, and changes may have occurred in the last 8 years.
Conclusion
This study found that Norwegian children and adolescents consume about 20 % of their total energy intake from discretionary foods and drinks. Discretionary foods and drinks contributed to about two-thirds of the children and adolescents’ intake of added sugar, and limited amounts of dietary fibre, vitamins and minerals. Supper was the meal that contributed the most to the children’s and adolescents’ intake of discretionary foods. The quartile which had the lowest proportion of their energy intake from discretionary foods seemed to have a higher intake of whole grains, and fish and seafood in their diet compared to the upper quartile, suggesting healthier and more sustainable food habits.
Acknowledgements
The authors are grateful to all children, adolescents and parents/guardians who participated in the Ungkost study.
Financial support
This research received no specific grant from any funding agency, commercial or not-for-profit sectors.
Conflicts of interest
There are no conflicts of interest.
Authorship
M.M.P., J.B.M., T.H.T. and L.F.A. formulated the research questions and designed the study. T.H.T. planned and J.B.M. carried out the practical work with the Ungkost 3 study. M.M.P. analysed the data and wrote the article, and L.F.A. had the primary responsibility for the final content. All authors provided critical revision of the manuscript for important intellectual content and approved the final manuscript.
Ethics of human subject participation
This study was conducted according to the guidelines laid down in the Declaration of Helsinki, and all procedures involving research study participants were acknowledged by the Norwegian Centre for Research Data. Written informed consent was obtained from all subjects.


 Open access