

Human milk oligosaccharides (HMO) are currently discussed as participating in the development of a normal microflora in neonates, as soluble receptors for pathogens preventing their adhesion to the epithelial cells and as modulators of inflammatory processes(Reference Sharon and Ofek1–Reference Bode, Rudloff, Kunz, Strobel and Klein4). The total oligosaccharide content in human milk ranges from 5 to 15 g/l compared to about 1 g/l in mature bovine milk(Reference Kobata and Ginsburg5–Reference Parkkinen and Finne8). Neutral oligosaccharides comprise about 70 % of the total oligosaccharide content in human milk, whereas acidic oligosaccharides account for 30 %(Reference Kunz and Rudloff9). As the intestine of the breast-fed infant is continuously exposed to such high concentrations of oligosaccharides for up to several months, it is intriguing to consider whether ingested oligosaccharides may modulate neonatal intestinal development. Recent studies using the intestinal cell line Caco-2 revealed that specific neutral oligosaccharides are minimally digested, could in part be taken up and get enriched by intestinal cells(Reference Engfer, Stahl, Finke, Sawatzki and Daniel10–Reference Gnoth, Rudloff, Kunz and Kinne12). Hence, they might have the potential to affect enterocyte function.
Renewal of the intestinal villi is a well-regulated sequential process of proliferation, differentiation and apoptosis. We have recently shown that neutral and acidic HMO were able to reduce cell proliferation and enhance alkaline phosphatase activity particularly in undifferentiated cell lines(Reference Kuntz, Rudloff and Kunz13). However, up to now, no information is available regarding a direct effect of HMO on intestinal cell integrity and the mechanisms involved. Processes affecting cell fate are highly regulated and cell cycle genes like cyclins, cyclin-dependent kinases (CDK) and inhibitors play an important role in that context(Reference Vermeulen, Van Bockstaele and Berneman14, Reference Serrano15). Dependent on their level of expression, cyclins regulate cell progression and are responsible for arresting cells at a defined state. Various molecular studies showed that a G1 arrest is associated with a decrease in cyclin D and cyclin E(Reference Stein and Dulic16, Reference Dai and Grant17). This decrease was found to be associated with changes in CDK protein levels and activity. Concomitant to these changes CDK inhibitors such as p27kip1 and p21cip1 were up-regulated and arrested cells in cell cycle phase G1 or G2(Reference Mani, Wang, Wu, Francis and Pestell18, Reference Baghdassarian and French19).
Although most of the in vitro studies on p21cip1 regulation have concentrated on p53-dependent and p53-independent transcriptional regulation, a series of new studies has shown that p21cip1 can be regulated by post-translational mechanisms. Phosphorylation of p21cip1 modulates not only interaction and binding with target proteins but also its stabilization(Reference Li, Dowbenko and Lasky20). These phosphorylation events in cell cycle progression occur through different signal cascades such as receptor-mediated MAPK activation which could result in both G1 and G2 arrest.
Thus, the objective of the present study was to investigate how oligosaccharides induce inhibition of cell proliferation and which mechanism participates in these intestinal cell dynamics.
Materials and methods
Isolation of human oligosaccharides from human milk and human milk oligosaccharide preparation
Oligosaccharides were isolated from human milk as described previously(Reference Kunz, Rudloff, Hintelmann, Pohlentz and Egge7, Reference Kuntz, Rudloff and Kunz13, Reference Rudloff, Obermeier, Borsch, Pohlentz, Hartmann, Brösicke, Lentze and Kunz21). Briefly, after centrifugation, the lipid layer was removed, and the proteins were precipitated from the aqueous phase with ice-cold ethanol. Lactose was removed by gel filtration on Sephadex G-25 (Pharmacia Biotech, Uppsala, Sweden). The total oligosaccharide fraction was further separated into an acidic fraction (acidic HMO), consisting of compounds with N-acetylneuraminic acid residues, and a neutral fraction (neutral HMO) without N-acetylneuraminic acid residues, using HPLC anion-exchange on a Resource Q column (Pharmacia Biotech) at the following conditions: 100 % eluent A (H2O) from 0 to 7·5 min, a linear gradient to 55 % eluent B (0·6 m-NaCl) for 42·5 min, a linear gradient to 100 % eluent B for 2 min, and a constant flow with 100 % eluent B for 8 min. A flow rate of 2 ml/min was used. The eluting fractions were monitored at 214 nm. Afterwards, pooled HPLC fractions were desalted by gel filtration on Sephadex G-25 (Pharmacia Biotech).
Cell culture
The human colon cancer cell line HT-29 was obtained from the American Type Culture Collection (Rockville, MD, USA); Caco-2 cells were a gift from R. K. Kinne (Max Planck Institute of Molecular Physiology, Dortmund, Germany). The fetal intestinal colon cell line HIEC was generously donated by J. F. Beaulieu (Department of Anatomy and Cell Biology, Faculty of Medicine, Université de Sherbrooke, Sherbrooke, Quebec, Canada)(Reference Perreault and Beaulieu22). Cells were cultured in 75 cm2 tissue culture flasks (Renner, Darmstadt, Germany) in RPMI 1640 (HT-29 and HIEC) or Dulbecco's modified Eagle's medium (Caco-2) supplemented with 10 % fetal calf serum, 2 mm-glutamine (Invitrogen, Karlsruhe, Germany), 100 units/ml penicillin and 100 mg/ml streptomycin (Invitrogen). The cultures were kept in a humidified atmosphere of 5 % CO2 at 37°C. Cells were passaged at preconfluent densities using 0·05 % trypsin and 0·5 mm-EDTA (Invitrogen).
Cell cycle analysis
Intestinal cells (HT-29, Caco-2 and HIEC) were seeded at a density of 50 000 onto six-well culture flasks and allowed to adhere for 24 h. Thereafter, the medium was replaced and incubated for another 24 h in the presence or absence of the test compounds. Cells were trypsinized, pelleted by centrifugation at 500 g for 3 min, washed twice with PBS and adjusted to 1 × 10⁶ cells/ml. Cells were then fixed by suspending the cells at 4°C in ethanol for 24 h. Thereafter, the suspension was centrifuged for 3 min at 500 g, and the pellet was washed twice in 38 mm-sodium citrate buffer (pH 7·4). After washing and centrifugation, cells were incubated with the dye solution containing 7-amino actin (1 mg/ml) and 1 unit DNase-free RNase in sodium citrate buffer. Cell cycle analysis was performed using a FACScan (Becton Dickinson, San Jose, CA, USA) and the software BD CellQuest™ Pro version 1.41 for data analysis.
RNA extraction and cDNA synthesis
Total RNA from intestinal cells was isolated using TRIzol reagent (Invitrogen) according to the manufacturer's instruction with slight modifications. Total RNA was quantified by measuring the absorbance at 260 nm, and the purity was checked by the 260/280 nm absorbance ratio. cDNA synthesis was carried out in a reaction volume of 50 μl containing 500 ng RNA, 50 mm-2-amino-2-hydroxymethyl-1,3-propanediol hydrochloride (pH 8·3), 75 mm-KCl, 3 mm-MgCl2, 10 mm-dithiothreitol, 100 ng oligodeoxythymidine 15 primer, 500 μm of each deoxynucleotide triphosphate (dATP, dGTP, dCTP and dTTP), 10 units ribonuclease inhibitor and 200 units Moloney murine leukaemia virus RT; all reagents were obtained from Invitrogen. The samples were incubated at 37°C for 60 min, followed by an incubation at 95°C for 15 min.
Analysis of mRNA expression (real-time quantitative PCR)
mRNA expression of cell cycle genes such as cyclins (cyclin A, B, D, E), cyclin-dependent kinase inhibitors (CDKI) and p53 were determined in intestinal cells using the real-time PCR technique on a 7500 Real Time PCR System (Applied Biosystems, Darmstadt, Germany) and TaqMan® PCR master mix (Eurogentec, Köln, Germany). Gene-specific primers and probes used in the present study (Table 1) were designed using the sequences accessible in the NCBI Reference Sequence and the software Primer Express 3.0 (Applied Biosystems). Primer and probe sequences were chosen to prevent homologies to undesired genes and other coding sequences and checked by BLAST™ software. To exclude amplification from possible DNA contamination, the probes were designed to overlap exon junctions in cDNA regions derived from intron-bearing genes. All probes were labelled with the fluorescent dyes 6-carboxy-fluorescein as reporter and 6-carboxy-tetramethyl-rhodamine as quencher. Primers were purchased from MWG Biotech (Ebersberg, Germany) and probes from Eurogentec (Seraing, Belgium). A total reaction volume of 25 μl containing reaction buffer with 250 nm of each primer and 150 nm-probe and 1 μl cDNA. The PCR running conditions were: 10 min of initial denaturation at 95°C followed by forty cycles of 30 s at 95°C, 30 s at 58°C for annealing, 30 s at 60°C, and 15 s at 75°C. Samples were run in triplicates. PCR results are shown as the relative expression level of normalized samples (Δ cycle threshold (Ct)) in relation to the expression of the calibrator sample (2− ΔΔCt), which was set at 100 %. The Ct value refers to the cycle number at which the PCR plot crosses the threshold line, ΔCt is calculated by subtracting the Ct value of the corresponding housekeeper gene GAP-DH (endogenous reference control) from the specific Ct value of the target gene. Finally, ΔΔCt is obtained by subtracting the ΔCt of each experimental sample from the ΔCt of the calibrator sample.
Primers and TaqMan® probes for real-time RT–PCR amplifications

BP, backward primer; FP, forward primer.
Detection of receptor phosphorylation
Nearly (70–80 %) confluent HT-29 cultures were incubated in Dulbecco's modified Eagle's medium with 10 % fetal calf serum for 24 h. Subsequently, reagents were added in concentrations indicated in the legends of the figures. After incubation, cells were trypsinized, washed and lysed with extraction buffer. Protein concentration was measured using the BioRad protein assay kit (Richmond, CA, USA). The Proteome Profiler™ array, human phospho-receptor tyrosine kinase array kit to identify the phosphorylation of forty-two different receptor tyrosine kinases, was used according to the manufacturer's instructions (R&D Systems, Minneapolis, MN, USA) loading 250 μg protein/membrane. Blots were developed by applying the chemiluminescence detection kit ECL-Plus (Amersham Biosciences, Arlington Heights, IL, USA). Spot intensity was then analysed with the software Biocat Software (Köln) and density is expressed as area under the curve.
Detection of mitogen-activated protein kinase phosphorylation
After incubation with oligosaccharides as indicated in the figures, cells were washed with PBS, solubilized in lysis buffer and 300 μg total protein were used for the human phospho-MAP array (R&D Systems, Heidelberg, Germany) according to the manufacturer's protocol. Briefly, arrays were incubated with whole-cell lysates overnight at 4°C and washed with the supplied washing buffer. Arrays were then incubated with anti-phosphotyrosine-horseradish peroxidase antibodies for 2 h at room temperature before incubation with a chemiluminescent reagent and film exposure; spot intensity was then analysed applying the software Biocat Software and expressed as area under the curve.
Statistical analysis
Data were evaluated by ANOVA and statistical differences were tested by Bonferroni's test. For each variable at least three independent experiments were carried out. Results are expressed as means and their standard errors. All analyses were done using the GraphPad Software Prism 3 (San Diego, CA, USA); differences were considered significant at P < 0·05.
Results
Cell cycle analysis
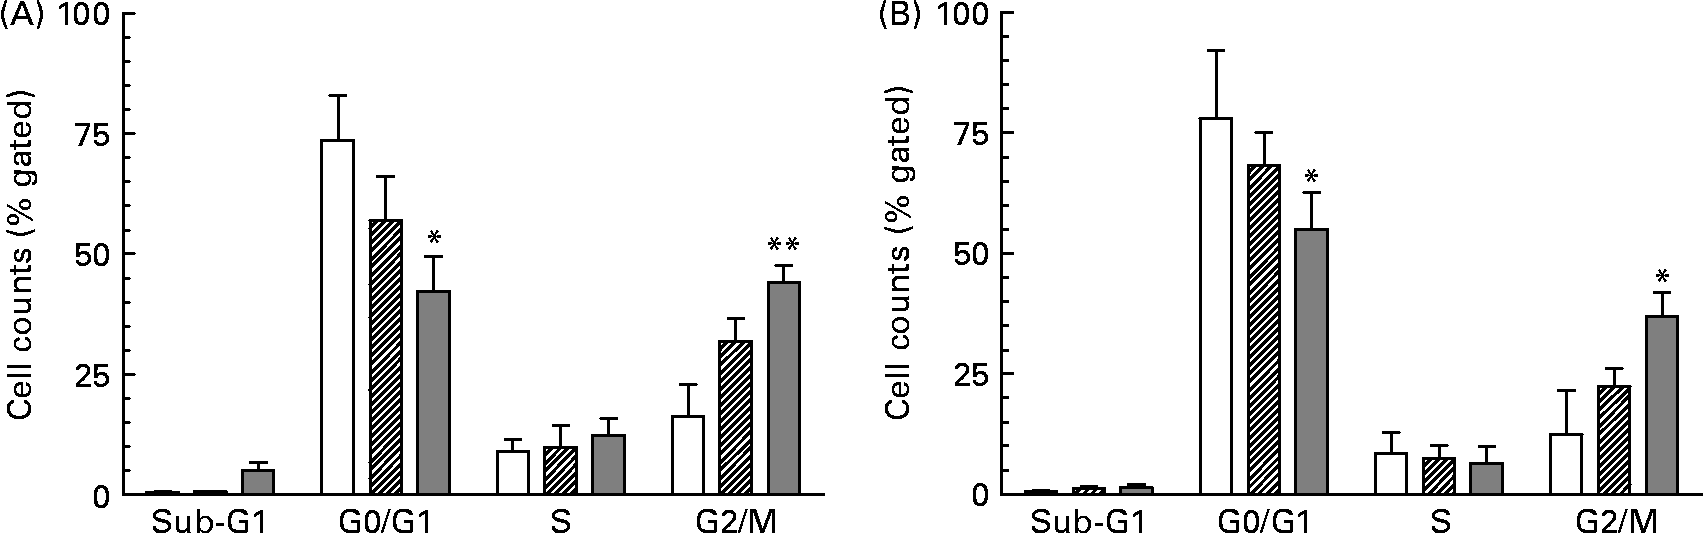
As a consequence of growth inhibition and differentiation cells were fixed to determine their specific cell cycle phase by using flow cytometry. The cell cycle histogram plots and distribution of cell populations in different cell cycle stages for HT-29 are shown in Figs. 1 and 2. It was observed that neutral as well as acidic HMO induced a cell cycle arrest in the G2/M phase which was moderate at a concentration of 7·5 mg/ml but pronounced at 15 mg/ml. Cell cycle analysis of controls without oligosaccharide exposure revealed that 73 % of the HT-29 population was in the G0/G1 phase and 16 % in the G2/M phase (Figs. 1(A) and 2(A)). HT-29 cells exposed to 7·5 mg/ml neutral HMO exhibited a similar distribution of cells among the different cell cycle phases (Fig. 1(B)). The higher dose of oligosaccharides (15 mg/ml) altered the cell population in a way that 42 % of the cell population was in the G0/G1 phase and 44 % in the G2/M phase (Fig. 2(A)). After a 24 h treatment with the lower dose of acidic HMO (Figs. 1(D) and 2(B)), 72 % of the cells were in the G0/G1 phase. This was balanced by a lower percentage of cells in the G2/M stages (16 %). Exposure of HT-29 for 24 h to the high dose of oligosaccharides resulted in a further accumulation of cells in the G2/M stage, 37 % of the cell population were found to be in the G0/G1 stage and 35 % accumulated in the G2/M stage (Fig. 2(B)).
Representative histograms of flow cytometric analysis of the cellular DNA content in control and oligosaccharide-treated HT-29 cells, stained with the fluorescence dye 7-aminoactinomycin. The cells were untreated (A) or treated with 7·5 mg/ml (B, D) and 15 mg/ml (C, E) neutral (B, C) or acidic (D, E) human milk oligosaccharides for 24 h. Cell cycle distribution was performed as described in the Materials and methods. FL3-A, fluorescence intensity.

Distribution of cell cycle phases based on histogram plots for HT-29 cells. The distribution of cell cycle phases is expressed as the percentage of gated cells in the G0/G1, S and G2/M phase of the cell cycle. Cells were treated with (A) neutral human milk oligosaccharides (▨, 7·5 mg/ml; ![]() , 15 mg/ml) or (B) acidic human milk oligosaccharides (▨, 7·5 mg/ml;
, 15 mg/ml) or (B) acidic human milk oligosaccharides (▨, 7·5 mg/ml; ![]() , 15 mg/ml). Values are means with their standard errors depicted by vertical bars (n 2). Mean values were significantly different from those of the control group: *P ≤ 0·05, **P ≤ 0·01. □, Control.
, 15 mg/ml). Values are means with their standard errors depicted by vertical bars (n 2). Mean values were significantly different from those of the control group: *P ≤ 0·05, **P ≤ 0·01. □, Control.
In comparison to control cells, the proportion of cells in the G0/G1 phase significantly decreased in HIEC and Caco-2 cells after incubation with neutral and acidic HMO at a concentration of 15 mg/ml and thus accumulated in the G2/M phase (44 and 33 % in HIEC and Caco-2 cells, respectively). The number of cells in the S phase did not change significantly in both cell lines after incubation with oligosaccharides when compared to controls (Table 2).
(Mean values for two independent experiments)
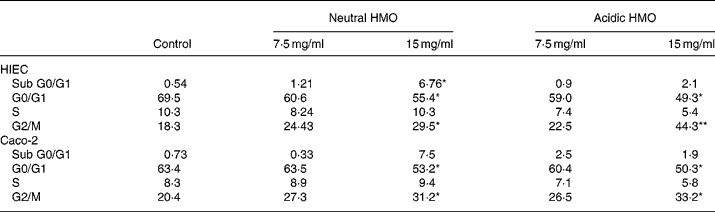
HMO, human milk oligosaccharides.
Mean values were significantly different from those of the control group: *P ≤ 0·05, **P ≤ 0·01.
† For details of procedures, see Materials and methods. Intestinal cells were seeded at a density of 106 cells and were allowed to attach for 24 h. Finally, they were cultured without (control) or with 7·5 or 15 mg/ml neutral and acidic HMO for 24 h. The distribution of cell cycle phases is expressed as percentage of gated cells in the G0/G1, S and G2/M phase of the cell cycle.
Transcriptional regulation of cyclins, cyclin-dependent kinase inhibitors and tumour suppressors with quantitative real-time PCR
In order to relate cell cycle arrest to important cell cycle regulator genes such as cyclins and CDKI and tumour suppressor p53, we performed real-time PCR to quantify differences in the expression level of selected target genes. In Fig. 3, the data for the expression levels of cyclines are summarized for HT-29, HIEC and Caco-2 cells. After incubation of the cells with 15 mg/ml neutral or acidic HMO, mRNA expression levels were determined using the target gene/housekeeping gene ratio by setting the control to 100 %. The expression level of cyclin A, a regulator for S/G2 transition, remained unchanged in all cell lines after the treatment with neutral HMO. In contrast, after incubation with acidic oligosaccharides, a moderate but significant increase was observed in HT-29 (146 (sem 6) %) and HIEC cells (132 (sem 6) %), whereas the cyclin A expression level in Caco-2 cells remained unaffected (Fig. 3). The mRNA expression levels of cyclin B, which is responsible for the regulation of the G2/M cell cycle transition, were markedly increased in all cell lines after incubation with neutral or acidic oligosaccharides. After incubation with neutral HMO, the expression level of cyclin B in HT-29 was increased to 198 (sem 12) % and to 235 (sem 9) % after treatment with acidic HMO. Similar data were obtained for HIEC cells, i.e. both neutral and acidic HMO markedly increased cyclin B expression (221 (sem 12) and 214 (sem 8) %, respectively). Also, in Caco-2 cells cyclin B expression was enhanced to 150 (sem 7) % by neutral HMO and 164 (sem 5) % by acidic HMO compared to controls. Cyclin D and E which regulate the entry of cells into and the progression through the G1 phase of the cell cycle remained unchanged in all cell lines after oligosaccharide treatment.
Changes of mRNA expression levels of cell cycle genes in intestinal HT-29 (A), HIEC (B) and Caco-2 (C) cells with quantitative real-time PCR. Cells were treated with 15 mg/ml neutral (nHMO) or acidic human milk oligosaccharides (aHMO) after reaching a confluency of 30 % over 72 h. Data were analysed as 2− ΔΔCt (Ct, cycle threshold). Values are means of the percentage of controls with their standard errors depicted by vertical bars (n 3). Mean values were significantly different from those of the control group: *P ≤ 0·05, **P ≤ 0·01. □, Cyclin A/GAP-DH; ![]() , cyclin B/GAP-DH;
, cyclin B/GAP-DH; ![]() , cyclin D/GAP-DH;
, cyclin D/GAP-DH; ![]() , cyclin E/GAP-DH.
, cyclin E/GAP-DH.

We then investigated whether the block in cell cycle progression was accompanied by increased levels of CDKI such as p21cip1 and p27kip1. It is well known that both CDKI are able to induce cell cycle arrest and/or differentiation. Treatment of the undifferentiated cell lines HT-29 and HIEC with neutral and acidic HMO resulted in an enhanced expression of p21cip1 and p27kip1 (Table 3). In HT-29 cells, 7·5 and 15 mg/ml neutral HMO enhanced expression of p21cip1 3·7- and 6·6-fold, respectively; acidic HMO were able to enhance mRNA levels of p21cip1 2·8- and 4·1-fold, respectively. Similar observations were made for HIEC cells. p21cip1 expression increased 3·2-fold (15 mg/ml neutral HMO) and 3·6-fold (15 mg/ml acidic HMO) compared to control experiments. p27kip1 mRNA expression was enhanced 2·8- and 4·3-fold in HT-29 and HIEC cells when exposed to neutral HMO; treatment with the same amount of acidic HMO (15 mg/ml) increased p27kip1 mRNA expression 2·5- and 8·3-fold in HT-29 and HIEC cells compared to controls. In contrast to HT-29 and HIEC cells, Caco-2 cells responded only with an increased p21cip1 mRNA level but p27kip1 levels remained unchanged after supplementation with HMO. Hence, neutral as well as acidic HMO induced an increase of p21cip1 levels which reached a maximum of 210 (sem 12) % (15 mg/ml neutral HMO) and 196 (sem 10) % (15 mg/ml acidic HMO) in comparison to control cells (100 %).
(Mean values with their standard errors for three independent experiments)

HMO, human milk oligosaccharides.
Mean values were significantly different from those of the control group: *P ≤ 0·05, **P ≤ 0·01, ***P ≤ 0·001.
† For details of procedures, see Materials and methods. Intestinal cells were seeded at a density of 106 cells and were allowed to attach for 24 h. Finally, they were cultured without (control) or with 7·5 or 15 mg/ml neutral and acidic HMO for 24 h. Real-time PCR was carried out using cell cycle-specific primer and probes (see Table 1). Data were analysed as 2− ΔΔCt (Ct, cycle threshold) and given as means of the percentage of controls.
A well-known regulator of different checkpoints during the cell cycle is the tumour suppressor p53 which is able to regulate G1 or G2 transition. To get insight into the role of p53 in the observed G2/M arrest, we determined p53 mRNA levels in all cell lines after incubation with HMO, but no changes in p53 mRNA levels were observed in any cell line (Table 3).
Influence of signal transduction pathways
Changes in expression levels of cyclins or CDKI are a consequence of activation or inactivation of different signal cascades. Thus, we further investigated whether the effects of oligosaccharides are a result of influencing signalling pathways in the cell line HT-29, representing phenotypical undifferentiated cells. To screen the phosphorylation of several receptors and MAPK in HT-29 cells, we used the protein profiling array to detect different phosphorylation events. Results are shown in Fig. 4 for receptor phosphorylation.
Receptor tyrosine kinase antibody array analysis. Cells were treated with neutral human milk oligosaccharides (nHMO; ![]() ) or acidic human milk oligosaccharides (aHMO;
) or acidic human milk oligosaccharides (aHMO; ![]() ) (7·5 and 15 mg/ml) for 10 min. Lysate was prepared according to the manufacturer's instructions. Phospho-receptor tyrosine kinase array was used to detect phosphorylation of these receptor tyrosine kinases in HT-29. The signal was detected by chemiluminescence and the spot intensity is shown. Values are means of the percentage of controls with their standard errors depicted by vertical bars (n 3). Mean values were significantly different from those of the control group: **P ≤ 0·01, ***P ≤ 0·001. AUC, area under the curve; EGFR, epidermal growth factor receptor.
) (7·5 and 15 mg/ml) for 10 min. Lysate was prepared according to the manufacturer's instructions. Phospho-receptor tyrosine kinase array was used to detect phosphorylation of these receptor tyrosine kinases in HT-29. The signal was detected by chemiluminescence and the spot intensity is shown. Values are means of the percentage of controls with their standard errors depicted by vertical bars (n 3). Mean values were significantly different from those of the control group: **P ≤ 0·01, ***P ≤ 0·001. AUC, area under the curve; EGFR, epidermal growth factor receptor.

Incubation with both neutral and acidic HMO induced a dose-dependent phosphorylation of the ERF receptor within 10 min indicating that oligosaccharides could interact with the epidermal growth factor receptor (EGFR). The effects of acidic oligosaccharides were more pronounced than the neutral oligosaccharide effects. Acidic HMO concentrations of 7·5 and 15 mg/ml induced an EGFR phosphorylation up to 247 (sem 3) and 447 (sem 34) % compared to untreated cells (100 %). Neutral HMO were also able to affect EGFR phosphorylation and enhanced its phosphorylation to 168 (sem 6) and 284 (sem 8) % at 7·5 and 15 mg/ml, respectively. The effect of HMO was EGFR-specific because no other receptor phosphorylation was observed.
As a consequence of receptor phosphorylation different signal pathways could be involved. To determine whether different MAPK were further activated we used the MAPK array to investigate how and to which extent oligosaccharides are able to induce downstream events from EGFR signalling. As shown in Fig. 5, the analysis of these signalling pathways revealed a role for p38 MAPK and extracellular signal-regulated kinase (ERK) 1/2 which were most significant on p38 MAPK. Phosphorylation and activation of different p38 MAPK subtypes, especially p38α and p38δ in HT-29 cells, was induced by acidic HMO (Fig. 5(A)) and to a lesser extent, but still significantly, by neutral HMO (Fig. 5(B)). Furthermore, the activation of p38α was stronger than that of p38δ in HMO-treated cells within 30 min. In addition, PKB-β/Akt (Akt2), a growth factor-regulated protein kinase, and the downstream kinase ERK1 have emerged as critical enzymes in signal transduction pathways involved in cell proliferation and apoptosis. We have shown that both were activated by HMO at concentrations of 7·5 and 15 mg/ml.
Detection of phosphorylated mitogen-activated protein kinases in untreated HT-29 cells (□) and HT-29 cells treated with (A) neutral human milk oligosaccharides (![]() , 7·5 mg/ml;
, 7·5 mg/ml; ![]() , 15 mg/ml) or (B) acidic human milk oligosaccharides (
, 15 mg/ml) or (B) acidic human milk oligosaccharides (![]() , 7·5 mg/ml;
, 7·5 mg/ml; ![]() , 15 mg/ml) after 30 min. After incubation, lysate was prepared and 300 μg lysate were used for each assay. Array signals from scanned X-ray film images were analysed using image analysis software and expressed as spot pixel density. Values are means with their standard errors depicted by vertical bars (n 2). Mean values were significantly different: *P ≤ 0·05. AUC, area under the curve.
, 15 mg/ml) after 30 min. After incubation, lysate was prepared and 300 μg lysate were used for each assay. Array signals from scanned X-ray film images were analysed using image analysis software and expressed as spot pixel density. Values are means with their standard errors depicted by vertical bars (n 2). Mean values were significantly different: *P ≤ 0·05. AUC, area under the curve.

Discussion
The intestine is a continuously renewing tissue that constantly undergoes proliferation, differentiation and apoptosis. Recently, we reported that the exposure of the intestinal cell lines HT-29, HIEC and Caco-2 to HMO significantly inhibited cell proliferation. Whereas neutral oligosaccharides exerted an anti-proliferative effect along with a significant induction of apoptosis and a slight increase in differentiation, acidic oligosaccharides inhibited intestinal cell proliferation only by an induction of alkaline phosphatase activity as a marker of differentiation(Reference Kuntz, Rudloff and Kunz13). To understand the effects of oligosaccharides on growth-associated events of intestinal cells, flow cytometric analyses were carried out. Cytometric analyses showed significant changes of the cell cycle pattern in HT-29, HIEC and Caco-2 cells following oligosaccharide treatment for 24 h (Figs. 1 and 2; Table 2). In control experiments, the major proportion of cells was arrested in the G0/G1 phase. After treatment with neutral or acidic HMO, cells accumulated in the G2/M phase of the cell cycle (44, 30 and 31 of HT-29, HIEC and Caco-2 cells, respectively, after exposure to neutral oligosaccharides; 37, 44 and 33 % of HT-29, HIEC and Caco-2 cells, respectively, after treatment with acidic HMO). This leads to the conclusion that the potent anti-proliferative effect of acidic and neutral oligosaccharides is coupled to an extensive G2/M arrest in intestinal epithelial cells. We further investigated whether the G2/M cell cycle arrest due to the exposure to oligosaccharides was associated with changes in mRNA levels for key proteins regulating the cell cycle. Progression through the cell cycle is regulated by CDK, a family of serine/threonine protein kinases which phosphorylate a variety of proteins for cell cycle control(Reference Nadella and Kirschner23, Reference Ouyang, Ma, Li, Zhang, Liu, Rustgi and Huang24). The cellular concentrations of cyclins vary depending on the cell cycle stage, whereas the levels of CDK remain relatively stable, but must bind to the appropriate cyclin in order to be activated. Therefore, cyclin mRNA expression levels were determined and correlated to flow cytometric events.
After 24 h of oligosaccharide treatment, there was no significant change in cyclin D and E mRNA levels suggesting that cells enter the cell cycle and proceed to G2. Previous studies in intestinal cells demonstrated that cyclin D1 is essential for the progression through the cell cycle(Reference Lewis, Bostick, Xie, Deng, Wargovich, Fina, Roufail and Geisinger25, Reference McKay, Douglas, Ross, Curran, Murray, Cassidy and McLeod26). The present data also indicate that additional cyclins may be responsible for transition and arrest, e.g. cyclin B1, a cell cycle regulatory protein that is generally induced at the G2/M transition and becomes deactivated as the cell exits mitosis. We found that cyclin B1 expression increased after HMO treatment (Fig. 3). This may prevent the cells from entering the G2/M stage, thus corroborating the observed cell cycle arrest at G2/M and the reduced cell proliferation when oligosaccharides were applied. This is in accordance with several other studies which had shown that blocking cell cycle progression at G2/M was due to increasing cyclin B1 expression in different cancer cell lines(Reference Dash and El-Deiry27).
In addition, the G2/M arrest seen in HT-29 and HIEC cells, but not in Caco-2 cells, was associated with a slightly increased mRNA expression level of cyclin A after incubation with acidic oligosaccharides. However, there was no response to an exposure to neutral HMO. If cyclin A were necessary for S/G2 phase transition one might speculate that the G2/M arrest in HT-29 and HIEC cells treated with acidic oligosaccharides is coupled to an increase in both cyclin A and B(Reference Dash and El-Deiry27, Reference Ji, Agrawal and Diederichs28).
The transition through the cell cycle is mediated not only by different time-dependent expression of cyclins but also by the activation of CDK. The interaction of cyclins with their corresponding CDK promotes further activation of target proteins responsible for cell cycle transition. On the other hand, CDKI of the CIP/KIP family are negative regulators of cell cycle progression and CDKI such as p21cip1 and p27kip1 were able to inhibit the formation of cyclin–CDK complexes. The inactivation of the CDK–cyclin B complex by its subsequent binding to p21cip1 is one of the probable mechanisms of G2/M arrest. The present data demonstrate (Table 3) a significant up-regulation of p21cip1 mRNA expression, indicating its role in oligosaccharide-mediated G2/M arrest in all intestinal cell lines. It has recently been shown that p21cip1 interacts with cyclin D throughout the cell cycle, whereas interaction between p21cip1 and cyclin A or cyclin B occurs in the later part of the cell cycle(Reference Li, Hannon, Beach and Stillman29, Reference Harper, Elledge and Keyomarsi30). Thus, the G2/M growth arrest we observed may well be a p21-dependent mechanism. Several lines of evidence suggested that p21cip1 and p27kip1 exert similar effects on cyclin–CDK complexes and cell cycle progression but other observations indicate that these CDKI have no overlapping functions and are not biologically equivalent, because of their differentially regulated expression(Reference Sherr and Roberts31, Reference Blain, Montalvo and Massagué32). In comparison to control cells HMO were able to enhance mRNA levels of p27kip1 significantly in HIEC and HT-29 cells whereas in the more differentiated Caco-2 cells oligosaccharides failed to further increase p27kip1 mRNA levels (Table 3). The present results indicate distinct roles of these CDKI, i.e. p21cip1 promotes cell cycle arrest and p27kip1 induces cell differentiation. Cells arrested in the G2/M phase concomitant with enhanced p21cip1 mRNA and protein levels are often discussed in the context of a p53-dependent mechanism(Reference Matsui, Sowa and Murata33–Reference Aoki, Kong, Suna, Sowa, Sakai, Setiawan and Kobayashi35). This p53-independent G2/M regulation was also seen in the present experiments; however, p53 was not changed in the intestinal cell lines tested in comparison to the control cells (Table 3).
The activation of EGFR and transmission of the extracellular signal through different signalling pathways (the ERK pathway, the stress-activated c-Jun N-terminal kinase and the p38/HOG kinase pathways) in order to provoke cell progression is a well-known and accepted process(Reference Tarnawski and Jones36, Reference Sundaram37). However, recent studies suggest that the EGFR pathway is not simply a growth-promoting signalling pathway, but phosphorylated EGFR also mediates p21cip1 expression and growth arrest or apoptosis via modulation of signalling pathways(Reference Liu and Huang38, Reference Matsumoto, Hatanaka, Bohgaki and Maeda39). From the present study two interesting findings have emerged: firstly, we observed that oligosaccharides were able to induce EGFR phosphorylation and, secondly, we have confirmed that the EGFR/Ras/Raf/ERK pathway is involved. As shown in Figs. 4 and 5 neutral HMO as well as acidic HMO induce a potent phosphorylation of the EGFR within 10 min and, in addition, multiple downstream kinases such as p38α, p38δ, ERK1 and Akt-2/PKB were activated within 30 min. As the EGFR is a glycoprotein and interactions of oligosaccharides with glycoprotein receptors are well documented it is conceivable that oligosaccharide fractions possess a general motif inducing the effects we observed. The cross-talk between EGFR phosphorylation, p38 activation and p21cip1 expression is observed in a variety of in vitro studies. For example, the p38 MAPK pathway can activate the Sp1/Sp3 transcription factors and this seems necessary for EGFR-dependent transactivation of the p21cip1 promoter(Reference Kuwahara, Lillehoj, Lu, Singh, Isohama, Miyata and Kim40–Reference Xu and Shu42).
Based upon the present observations we conclude that oligosaccharides are able to activate p21cip1 expression and stabilization via EGFR and p38 kinase phosphorylation. Fig. 6 summarizes a mechanism how oligosaccharides induce cell cycle arrest by possibly interacting with EGFR.
Proposed mechanism for intracellular pathway-mediated G2/M arrest. CDK, cyclin-dependent kinase; EGFR, epidermal growth factor receptor.

In conclusion, we identify HMO as ingredients which were able to induce growth arrest of intestinal cells by modulating EGFR signal pathways and cell cycle-associated gene expression. However, whether the ability of oligosaccharides to inhibit intestinal cell proliferation has implications for a different effect on the intestinal growth regulation in human milk-fed v. formula-fed infants is not known yet and requires further investigation.
Acknowledgements
There were no conflicts of interest among authors of the present study. S. K. had full access to all of the data in the study and takes responsibility for the integrity of the data and the accuracy of the data analysis. The authors greatly appreciate the excellent technical assistance of Nadine Metz. S. K. performed all the laboratory work, analysis of the data derived from the various experimental procedures, statistical analysis and wrote the manuscript; C. K. and S. R. participated in planning the analyses and in the critical revision of the manuscript. This study was supported by Wyeth Nutrition (USA).


