


1. Introduction
The location of boundary layer transition at low chord Reynolds numbers ( ${{Re}}_c\sim 1\times 10^5$
; Lissaman Reference Lissaman1983) is sensitive to changes in free stream velocity magnitude and direction (Ellsworth & Mueller Reference Ellsworth and Mueller1991; Burgmann & Schröder Reference Burgmann and Schröder2008; Coull & Hodson Reference Coull and Hodson2011). The wings and rotor blades of small unmanned aerial vehicles are examples of lifting surfaces that operate at low chord Reynolds numbers in unsteady conditions (Mueller & DeLaurier Reference Mueller and DeLaurier2003). On lifting surfaces at low Reynolds numbers, transition usually occurs downstream of laminar boundary layer separation (Carmichael Reference Carmichael1981). The highly unstable separated laminar shear layer rapidly transitions to turbulence and may reattach to the lifting surface if the adverse pressure gradient is not too severe (Horton Reference Horton1968). The region of recirculating flow bounded by the streamline that connects the separation and reattachment points is known as a laminar separation bubble (LSB) (Tani Reference Tani1964). LSBs may be classified as either short or long, depending on whether they have a relatively local or global influence on the pressure distribution over the lifting surface (Tani Reference Tani1964).
${{Re}}_c\sim 1\times 10^5$
; Lissaman Reference Lissaman1983) is sensitive to changes in free stream velocity magnitude and direction (Ellsworth & Mueller Reference Ellsworth and Mueller1991; Burgmann & Schröder Reference Burgmann and Schröder2008; Coull & Hodson Reference Coull and Hodson2011). The wings and rotor blades of small unmanned aerial vehicles are examples of lifting surfaces that operate at low chord Reynolds numbers in unsteady conditions (Mueller & DeLaurier Reference Mueller and DeLaurier2003). On lifting surfaces at low Reynolds numbers, transition usually occurs downstream of laminar boundary layer separation (Carmichael Reference Carmichael1981). The highly unstable separated laminar shear layer rapidly transitions to turbulence and may reattach to the lifting surface if the adverse pressure gradient is not too severe (Horton Reference Horton1968). The region of recirculating flow bounded by the streamline that connects the separation and reattachment points is known as a laminar separation bubble (LSB) (Tani Reference Tani1964). LSBs may be classified as either short or long, depending on whether they have a relatively local or global influence on the pressure distribution over the lifting surface (Tani Reference Tani1964).
Reattachment in LSBs is fundamentally a consequence of transition in the separated shear layer. The transition process in LSBs is preceded by the receptivity process in the attached laminar boundary layer upstream of the LSB (Jones et al. 2010). If the Reynolds number is sufficiently large, as is common for lifting surfaces in practice, the laminar boundary layer becomes unstable to Tollmien–Schichting (T-S) waves upstream of separation (Diwan & Ramesh Reference Diwan and Ramesh2009). Although oblique and normal modes both become amplified, the normal mode is the most unstable (Michelis et al. Reference Michelis, Yarusevych and Kotsonis2018). In the region of adverse pressure gradient, an inflection point in the streamwise velocity profile develops, activating the inviscid Kelvin–Helmholtz (K-H) instability mechanism. As the inflection point moves away from the wall, the K-H mechanism becomes stronger (Diwan & Ramesh Reference Diwan and Ramesh2009). If the magnitude of the reverse flow is greater than $6\,\%{-}8\,\%$
of the free stream velocity, a stationary global instability can lead to spanwise-periodic three-dimensional variations in LSB topology and reverse flow magnitude (Rodríguez & Theofilis Reference Rodríguez and Theofilis2010). In LSBs with relatively small reverse flow magnitudes, disturbance growth is convective. However, if the magnitude of the reverse flow exceeds
$6\,\%{-}8\,\%$
of the free stream velocity, a stationary global instability can lead to spanwise-periodic three-dimensional variations in LSB topology and reverse flow magnitude (Rodríguez & Theofilis Reference Rodríguez and Theofilis2010). In LSBs with relatively small reverse flow magnitudes, disturbance growth is convective. However, if the magnitude of the reverse flow exceeds $16\,\%{-}25\,\%$
of the free stream velocity, the LSB may become absolutely unstable, sustaining disturbances in the absence of external perturbations (Rodríguez et al. Reference Rodríguez, Gennaro and Souza2021). Following the initial growth of disturbances that agrees well with linear stability predictions (Dovgal et al. Reference Dovgal, Kozlov and Michalke1994; Diwan & Ramesh Reference Diwan and Ramesh2012), there is a progressive intensification of nonlinear interactions (Dovgal et al. Reference Dovgal, Kozlov and Michalke1994). The increase of perturbation amplitudes eventually leads to the formation of shear layer roll-up vortices near the location of maximum LSB height (Watmuff Reference Watmuff1999). At relatively low levels of free stream turbulence intensity, the roll-up vortices in short LSBs are largely two-dimensional at inception (Lengani & Simoni Reference Lengani and Simoni2015; Istvan & Yarusevych Reference Istvan and Yarusevych2018). However, the vortices undergo rapid deformations and breakdown in the vicinity of the mean reattachment location (Marxen et al. Reference Marxen, Lang and Rist2013). Several authors have linked sudden LSB expansion and stall to changes in the characteristics of the vortical structures produced during the transition process, with less coherent and upstream propagating vortices being observed in long LSBs (Marxen & Henningson Reference Marxen and Henningson2011; Dellacasagrande et al. 2024).
$16\,\%{-}25\,\%$
of the free stream velocity, the LSB may become absolutely unstable, sustaining disturbances in the absence of external perturbations (Rodríguez et al. Reference Rodríguez, Gennaro and Souza2021). Following the initial growth of disturbances that agrees well with linear stability predictions (Dovgal et al. Reference Dovgal, Kozlov and Michalke1994; Diwan & Ramesh Reference Diwan and Ramesh2012), there is a progressive intensification of nonlinear interactions (Dovgal et al. Reference Dovgal, Kozlov and Michalke1994). The increase of perturbation amplitudes eventually leads to the formation of shear layer roll-up vortices near the location of maximum LSB height (Watmuff Reference Watmuff1999). At relatively low levels of free stream turbulence intensity, the roll-up vortices in short LSBs are largely two-dimensional at inception (Lengani & Simoni Reference Lengani and Simoni2015; Istvan & Yarusevych Reference Istvan and Yarusevych2018). However, the vortices undergo rapid deformations and breakdown in the vicinity of the mean reattachment location (Marxen et al. Reference Marxen, Lang and Rist2013). Several authors have linked sudden LSB expansion and stall to changes in the characteristics of the vortical structures produced during the transition process, with less coherent and upstream propagating vortices being observed in long LSBs (Marxen & Henningson Reference Marxen and Henningson2011; Dellacasagrande et al. 2024).
For a given lifting surface geometry, the three principal factors influencing the location and size of the laminar separation bubble are the angle of attack, Reynolds number and disturbance environment. As the angle of attack is increased, the LSB shortens and moves upstream as the roll-up vortex shedding frequency increases due to the stronger adverse pressure gradient and increase in boundary layer edge velocity (Burgmann et al. Reference Burgmann, Dannemann and Schröder2008). An increase in Reynolds number also causes a decrease in LSB length due to earlier transition caused by more rapid disturbance amplification (O’Meara & Mueller Reference O’Meara and Mueller1987). However, the effect of Reynolds number on the location of separation is relatively weak (Dellacasagrande et al. Reference Dellacasagrande, Barsi, Lengani, Simoni and Verdoya2020).
In practice, low-Reynolds-number lifting surfaces often operate in unsteady environments (Coull & Hodson Reference Coull and Hodson2011; Jones et al. Reference Jones, Cetiner and Smith2022). Transient forces on a lifting surface in an unsteady flow differ from those under quasi-steady conditions due to time-lag effects and pressure gradient changes associated with fluid acceleration (Ericsson & Reding Reference Ericsson and Reding1988). One source of time-lag effects is the finite convection speed of pressure fluctuations in the boundary layer (Kistler & Chen Reference Kistler and Chen1963; Ericsson & Reding Reference Ericsson and Reding1988). Another time-lag effect is produced whenever the bound circulation of the lifting surface changes, because this must coincide with the shedding of opposite-signed vorticity into the wake (von Kármán & Sears Reference von Kármán and Sears1938; Ericsson & Reding Reference Ericsson and Reding1988). The induced velocity of the shed vorticity causes a change in effective angle of attack on the lifting surface (von Kármán & Sears Reference von Kármán and Sears1938). Additionally, added mass forces and moving wall effects may become significant for rapid lifting surface accelerations (Ericsson & Reding Reference Ericsson and Reding1988). Unsteady transient changes in operating conditions can lead to substantial changes in aerodynamic loads relative to steady conditions, particularly during the dynamic stall of lifting surfaces undergoing rapid increases in angle of attack (McCroskey Reference McCroskey1981). Although dynamic stall during cyclic pitching motions has received considerable attention (Corke & Thomas Reference Corke and Thomas2015), dynamic stall and reattachment occurring during isolated pitch-up or pitch-down ramps such as those that may occur during aircraft manoeuvres or wind gusts remain less well understood (Jones et al. Reference Jones, Cetiner and Smith2022).
Several studies have investigated LSB formation on pitching and surging lifting surfaces (Brendel & Mueller Reference Brendel and Mueller1988; Ellsworth & Mueller Reference Ellsworth and Mueller1991; Nati et al. Reference Nati, de Kat, Scarano and van Oudheusden2015). For unsteady motions that cause an increase in adverse pressure gradient relative to quasi-steady conditions, such as streamwise deceleration or decreasing angle of attack, the locations of separation, transition and reattachment shift upstream relative to their locations in quasi-steady conditions (Brendel & Mueller Reference Brendel and Mueller1988; Ellsworth & Mueller Reference Ellsworth and Mueller1991; Nati et al. Reference Nati, de Kat, Scarano and van Oudheusden2015). An opposite shift in these locations relative to quasi-steady conditions occurs for motions that cause a decrease in adverse pressure gradient relative to quasi-steady conditions, i.e. streamwise acceleration or increasing angle of attack. As a consequence, the separation, transition and reattachment points exhibit hysteresis loops with respect to these two parameters (Nati et al. Reference Nati, de Kat, Scarano and van Oudheusden2015; Toppings & Yarusevych Reference Toppings and Yarusevych2024). The hysteresis in LSB structure has been linked to hysteresis in transition dynamics, with a lag in shear layer vortex shedding frequency relative to quasi-steady conditions observed by Nati et al. (Reference Nati, de Kat, Scarano and van Oudheusden2015). Under certain conditions, the downstream movement of the transition and reattachment points during acceleration can result in ‘surge-induced stall’ (Greenblatt et al. Reference Greenblatt, Müller-Vahl and Strangfeld2023). Conversely, the delay in separation during an increase in the angle of attack may cause transient LSB formation under nominally stalled conditions, leading to a substantial increase in transient lift forces (Stutz et al. Reference Stutz, Hrynuk and Bohl2022). The presence of an LSB can cause substantial deviations of unsteady lift coefficients from inviscid aerofoil theories (Isaacs Reference Isaacs1945; Greenberg Reference Greenberg1947) for large free stream oscillation amplitudes and low Reynolds numbers, even at small angles of attack (Strangfeld et al. Reference Strangfeld, Müller-Vahl, Nayeri, Paschereit and Greenblatt2016).
Relatively large changes in lift and drag forces may result from relatively small changes in operating conditions if the change affects the ability of the developing turbulent shear layer to reattach (Tani Reference Tani1964). The rapid expansion of a short LSB and the formation of either a long LSB or complete cessation of reattachment is known as bubble bursting (Gaster Reference Gaster1967) and is associated with a substantial loss of lift and increase of drag (Tani Reference Tani1964; Mitra & Ramesh Reference Mitra and Ramesh2019). Bursting occurs when the turbulent shear layer cannot overcome the pressure increase required to form a short LSB (Horton Reference Horton1969). The distance between separation and transition is similar for both short and long bubbles because mean disturbance growth rates are similar in both types of LSBs (Gaster Reference Gaster1967; Horton Reference Horton1969). This is due to the stabilising effect of lower Reynolds number in long LSBs being counteracted by the increased distance of the separated shear layer from the surface (Gaster Reference Gaster1967).
At relatively high chord Reynolds numbers ( ${{Re}}_c\sim 10^6$
), LSB bursting may initiate when the upstream movement of the turbulent separation point reaches the reattachment point of the LSB (Benton & Visbal Reference Benton and Visbal2019). The dynamic stall vortex (DSV) formed in such cases initially has a diameter of the order of the length of the LSB (Benton & Visbal Reference Benton and Visbal2019). At lower chord Reynolds numbers (
${{Re}}_c\sim 10^6$
), LSB bursting may initiate when the upstream movement of the turbulent separation point reaches the reattachment point of the LSB (Benton & Visbal Reference Benton and Visbal2019). The dynamic stall vortex (DSV) formed in such cases initially has a diameter of the order of the length of the LSB (Benton & Visbal Reference Benton and Visbal2019). At lower chord Reynolds numbers ( ${{Re}}_c\sim 10^5$
), bursting initiates with a relatively slow downstream movement of the reattachment point at a nearly constant velocity (Alferez et al. Reference Alferez, Mary and Lamballais2013). Once a critical LSB length is reached, the downstream movement of the reattachment point rapidly accelerates (Alferez et al. Reference Alferez, Mary and Lamballais2013). The precise moment at which the reattachment point begins to rapidly move downstream is sensitive to the initial conditions of the boundary layer, making the bursting process non-deterministic (Alferez et al. Reference Alferez, Mary and Lamballais2013).
${{Re}}_c\sim 10^5$
), bursting initiates with a relatively slow downstream movement of the reattachment point at a nearly constant velocity (Alferez et al. Reference Alferez, Mary and Lamballais2013). Once a critical LSB length is reached, the downstream movement of the reattachment point rapidly accelerates (Alferez et al. Reference Alferez, Mary and Lamballais2013). The precise moment at which the reattachment point begins to rapidly move downstream is sensitive to the initial conditions of the boundary layer, making the bursting process non-deterministic (Alferez et al. Reference Alferez, Mary and Lamballais2013).
Unsteady effects can be significant during the change between reattaching and massively separated flow states. Cessation of reattachment during LSB bursting is followed by oscillations of the trajectory of the separated shear layer (Alferez et al. Reference Alferez, Mary and Lamballais2013; Toppings & Yarusevych Reference Toppings and Yarusevych2023), and these oscillations are associated with a non-monotonic decrease in the lift produced by the lifting surface after LSB bursting (Toppings & Yarusevych Reference Toppings and Yarusevych2024). During both LSB formation and bursting transients, there is an upstream movement in the location of transition, after which the transition location moves downstream to its steady-state position (Alferez et al. Reference Alferez, Mary and Lamballais2013; Toppings & Yarusevych Reference Toppings and Yarusevych2023).
In addition to changes in Reynolds number and adverse pressure gradient, LSB formation and bursting may also be triggered by a change in the initial amplitudes of boundary layer disturbances. In numerical simulations (Marxen & Henningson Reference Marxen and Henningson2011) and experiments (Yarusevych & Kotsonis Reference Yarusevych and Kotsonis2017) employing controlled forcing of boundary layer disturbances, LSB bursting has been observed to occur after the cessation of controlled disturbances. This is because a reduction in the amplitudes of disturbances in the boundary layer leads to a delay in transition and failure of reattachment (Marxen & Henningson Reference Marxen and Henningson2011; Yarusevych & Kotsonis Reference Yarusevych and Kotsonis2017).
The duration of the transient response of an LSB to a change in operating conditions is relatively large compared with the shear layer vortex shedding period. Yarusevych & Kotsonis (Reference Yarusevych and Kotsonis2017) reported transient durations of $23$
and
$23$
and $33$
shedding periods after the initiation and cessation of controlled disturbances, respectively. In their experiment, reattachment occurred in both the natural and controlled flows. For changes in operating conditions that cause cessation or initiation of reattachment, the transient durations are considerably longer. For ramp changes in free stream velocity leading to LSB formation and bursting, Toppings & Yarusevych (Reference Toppings and Yarusevych2023) reported transient durations of the order of
$33$
shedding periods after the initiation and cessation of controlled disturbances, respectively. In their experiment, reattachment occurred in both the natural and controlled flows. For changes in operating conditions that cause cessation or initiation of reattachment, the transient durations are considerably longer. For ramp changes in free stream velocity leading to LSB formation and bursting, Toppings & Yarusevych (Reference Toppings and Yarusevych2023) reported transient durations of the order of $100$
shedding periods. Consistent between the studies of Yarusevych & Kotsonis (Reference Yarusevych and Kotsonis2017) and Toppings & Yarusevych (Reference Toppings and Yarusevych2023) is the observation that transients leading to a reduction in the extent of separation are shorter than those leading to an increase in the extent of separation. This difference is attributed to the increase in stability of the separated shear layer that occurs when a reduction in the extent of separation causes the shear layer to move closer to the wall (Dovgal et al. Reference Dovgal, Kozlov and Michalke1994). Understanding the transient dynamics of LSB formation and bursting is foundational for the design of robust control systems for aircraft wings and turbine blades that operate in unsteady conditions at low Reynolds numbers. Furthermore, end effects are always present in these applications, which may modulate the LSB formation and bursting processes (Toppings & Yarusevych Reference Toppings and Yarusevych2024).
$100$
shedding periods. Consistent between the studies of Yarusevych & Kotsonis (Reference Yarusevych and Kotsonis2017) and Toppings & Yarusevych (Reference Toppings and Yarusevych2023) is the observation that transients leading to a reduction in the extent of separation are shorter than those leading to an increase in the extent of separation. This difference is attributed to the increase in stability of the separated shear layer that occurs when a reduction in the extent of separation causes the shear layer to move closer to the wall (Dovgal et al. Reference Dovgal, Kozlov and Michalke1994). Understanding the transient dynamics of LSB formation and bursting is foundational for the design of robust control systems for aircraft wings and turbine blades that operate in unsteady conditions at low Reynolds numbers. Furthermore, end effects are always present in these applications, which may modulate the LSB formation and bursting processes (Toppings & Yarusevych Reference Toppings and Yarusevych2024).
Through their influence on the streamwise and spanwise pressure gradients on a lifting surface, end effects substantially affect the transition process near the root and tip of a lifting surface (Awasthi et al. Reference Awasthi, Moreau and Doolan2018). Due to larger changes to the spanwise pressure gradient near the wing tip, the spanwise extent of tip effects exceeds that of root effects (Toppings & Yarusevych Reference Toppings and Yarusevych2022). Outside of the end affected regions, the streamwise pressure distribution of a lifting surface operating at low Reynolds number is equivalent to that of a two-dimensional aerofoil at a reduced effective angle of attack (Bastedo & Mueller Reference Bastedo and Mueller1986), and LSB structure and vortex shedding dynamics are analogous to those observed on two-dimensional geometries (Toppings & Yarusevych Reference Toppings and Yarusevych2022). However, in the regions within approximately $0.5c$
of a wing or blade tip or root, the flow-field becomes highly three-dimensional (Huang & Lin Reference Huang and Lin1995; Awasthi et al. Reference Awasthi, Moreau and Doolan2018), and distance of the separated shear layer from the wall decreases (Toppings & Yarusevych Reference Toppings and Yarusevych2022). The reduction in local effective angle of attack near the tip produces a downstream shift in separation and a lengthening of the LSB (Bastedo & Mueller Reference Bastedo and Mueller1986). The spanwise flow present near a tip or root may cause reattachment prior to transition, and the downwash produced by the tip vortex may entirely eliminate the LSB in proximity to the tip (Huang & Lin Reference Huang and Lin1995; Toppings & Yarusevych Reference Toppings and Yarusevych2021). Near the root of a lifting surface, junction flow effects may also inhibit laminar separation (Awasthi et al. Reference Awasthi, Moreau and Doolan2018), and transition may be accelerated due to the influence of disturbances from the end-wall boundary layer (Toppings & Yarusevych Reference Toppings and Yarusevych2022).
$0.5c$
of a wing or blade tip or root, the flow-field becomes highly three-dimensional (Huang & Lin Reference Huang and Lin1995; Awasthi et al. Reference Awasthi, Moreau and Doolan2018), and distance of the separated shear layer from the wall decreases (Toppings & Yarusevych Reference Toppings and Yarusevych2022). The reduction in local effective angle of attack near the tip produces a downstream shift in separation and a lengthening of the LSB (Bastedo & Mueller Reference Bastedo and Mueller1986). The spanwise flow present near a tip or root may cause reattachment prior to transition, and the downwash produced by the tip vortex may entirely eliminate the LSB in proximity to the tip (Huang & Lin Reference Huang and Lin1995; Toppings & Yarusevych Reference Toppings and Yarusevych2021). Near the root of a lifting surface, junction flow effects may also inhibit laminar separation (Awasthi et al. Reference Awasthi, Moreau and Doolan2018), and transition may be accelerated due to the influence of disturbances from the end-wall boundary layer (Toppings & Yarusevych Reference Toppings and Yarusevych2022).
Both tip and root effects are known to influence the stall dynamics of finite-span lifting surfaces. Due to the increase in local effective angle of attack near the wing root, massive separation on full-scale aircraft wings typically begins near the root and progresses towards the tip (Gudmundsson Reference Gudmundsson2014; Andreu Angulo & Ansell Reference Angulo Andreu and Ansell2019). However, at low Reynolds numbers where stall is precipitated by LSB bursting due to a decrease in Reynolds number, massive separation initiates around the location of maximum LSB thickness, which may be located closer to the mid-span than the wing root (Toppings & Yarusevych Reference Toppings and Yarusevych2024). Subsequently, the region of massively separated flow expands towards the root and tip as the stall develops (Toppings & Yarusevych Reference Toppings and Yarusevych2024). During LSB formation during an increase in Reynolds number, this progression is reversed, with reattachment initiating near the root and tip and progressing towards the location of maximum thickness of the resulting LSB (Toppings & Yarusevych Reference Toppings and Yarusevych2024). A limited number of experimental studies have considered the spanwise propagation of dynamic stall during isolated pitching motions, reporting substantial three-dimensionality of the DSV (Coton & Galbraith Reference Coton and Galbraith1999). Since those studies focused on surface pressure measurements (Schreck & Hellin Reference Schreck and Hellin1994; Schreck et al. Reference Schreck, Faller and Luttges1996; Coton & Galbraith Reference Coton and Galbraith1999) and flow visualisations (Moir & Coton Reference Moir and Coton1995), knowledge of the spanwise velocity field development during isolated pitching motions remains limited.
Because LSB formation or bursting can be caused by changes in Reynolds number, angle of attack or external disturbances, there are multiple pathways between short and long LSB flow configurations. However, our knowledge of how LSB formation and bursting dynamics is affected by the way in which the external operating conditions change remains limited, impeding more accurate prediction of LSB formation and bursting in unsteady real-world conditions. The objective of this study is to understand how the type and rate of change of operating conditions affect transient LSB development. Specifically, we compare the transient dynamics of LSB formation and bursting on a lifting surface resulting from changes in Reynolds number to those resulting from changes in angle of attack, focussing on the relationship between the flow field development and the aerodynamic loads. The effect of varying pitch rate is also studied to understand how the duration of a change in operating conditions affects the duration of the flow response. A secondary objective is to elucidate the influence of finite aspect ratio on the LSB formation and bursting processes. These objectives are achieved through wind tunnel experiments on two-dimensional aerofoil and finite wing models, employing lift force measurements simultaneously with particle image velocimetry (PIV).
2. Experimental methods
Experiments were performed in the recirculating wind tunnel at the University of Waterloo. The turbulence intensity in the centre of the empty test section measured using a single hot-wire anemometer with the signal low-pass filtered at 10 kHz was less than $0.09\,\%$
. The integral length scale of the turbulence was estimated using Taylor’s frozen turbulence approximation (Taylor Reference Taylor1938) to be approximately
$0.09\,\%$
. The integral length scale of the turbulence was estimated using Taylor’s frozen turbulence approximation (Taylor Reference Taylor1938) to be approximately $0.3c$
.
$0.3c$
.
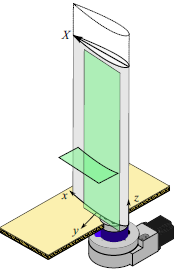
An aspect ratio $2.5$
wing model of chord
$2.5$
wing model of chord $c= 0.2\,\textrm {m}$
with a NACA 0018 cross-section was cantilevered vertically from the floor of the 0.61 m
$c= 0.2\,\textrm {m}$
with a NACA 0018 cross-section was cantilevered vertically from the floor of the 0.61 m $\times$
0.61 m test section. A schematic of the model set-up is presented in figure 1. A two-dimensional aerofoil model was approximated by attaching an extension to the end of the wing model (dashed line in figure 1), so that the model spanned the entire height of the test section. The wing model and extension were machined from acrylic, polished iteratively with sandpaper to 1500 grit and finally polished with a finer polishing paste. The angle of attack of the wing and aerofoil models was controlled through a stepper motor connected to a Velmex B48 rotary table and measured by an incremental encoder with a resolution of
$\times$
0.61 m test section. A schematic of the model set-up is presented in figure 1. A two-dimensional aerofoil model was approximated by attaching an extension to the end of the wing model (dashed line in figure 1), so that the model spanned the entire height of the test section. The wing model and extension were machined from acrylic, polished iteratively with sandpaper to 1500 grit and finally polished with a finer polishing paste. The angle of attack of the wing and aerofoil models was controlled through a stepper motor connected to a Velmex B48 rotary table and measured by an incremental encoder with a resolution of ${0.036}^{\circ }$
. Angles of attack of the wing and aerofoil models were set relative to the measured zero-lift angle. The uncertainty of the angle of attack is estimated to be
${0.036}^{\circ }$
. Angles of attack of the wing and aerofoil models were set relative to the measured zero-lift angle. The uncertainty of the angle of attack is estimated to be $0.06^{\circ }$
(
$0.06^{\circ }$
( $95\,\%$
confidence). The wing model was attached to the rotary table through a 6-axis JR3 30E12A4 load cell. The voltage signals from the load cell were amplified using a JR3 amplifier and recorded using a
$95\,\%$
confidence). The wing model was attached to the rotary table through a 6-axis JR3 30E12A4 load cell. The voltage signals from the load cell were amplified using a JR3 amplifier and recorded using a $24$
-bit National Instruments PCI-4472 data acquisition card at a sampling rate of 10 kHz. The absolute uncertainty in instantaneous lift force measurements is estimated to be less than 0.2 N. However, since the assumed constant bias error of the load cell does not affect comparisons between force measurements, the presented uncertainties in aerodynamic coefficients account solely for random errors in the measurements. The reference velocity used in the calculation of lift coefficients was obtained from a single hot-wire anemometer located in the test section
$24$
-bit National Instruments PCI-4472 data acquisition card at a sampling rate of 10 kHz. The absolute uncertainty in instantaneous lift force measurements is estimated to be less than 0.2 N. However, since the assumed constant bias error of the load cell does not affect comparisons between force measurements, the presented uncertainties in aerodynamic coefficients account solely for random errors in the measurements. The reference velocity used in the calculation of lift coefficients was obtained from a single hot-wire anemometer located in the test section $2.75c$
upstream of the model.
$2.75c$
upstream of the model.
Model set-up and coordinate system definition. PIV measurement planes in green.
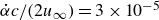
Controlled (a,b) angle of attack and (c,d) Reynolds number changes leading to (a,c) LSB bursting and (b,d) formation on the suction surface of the aerofoil and wing models. Colours in panels (a) and (b) correspond to different pitch rates.
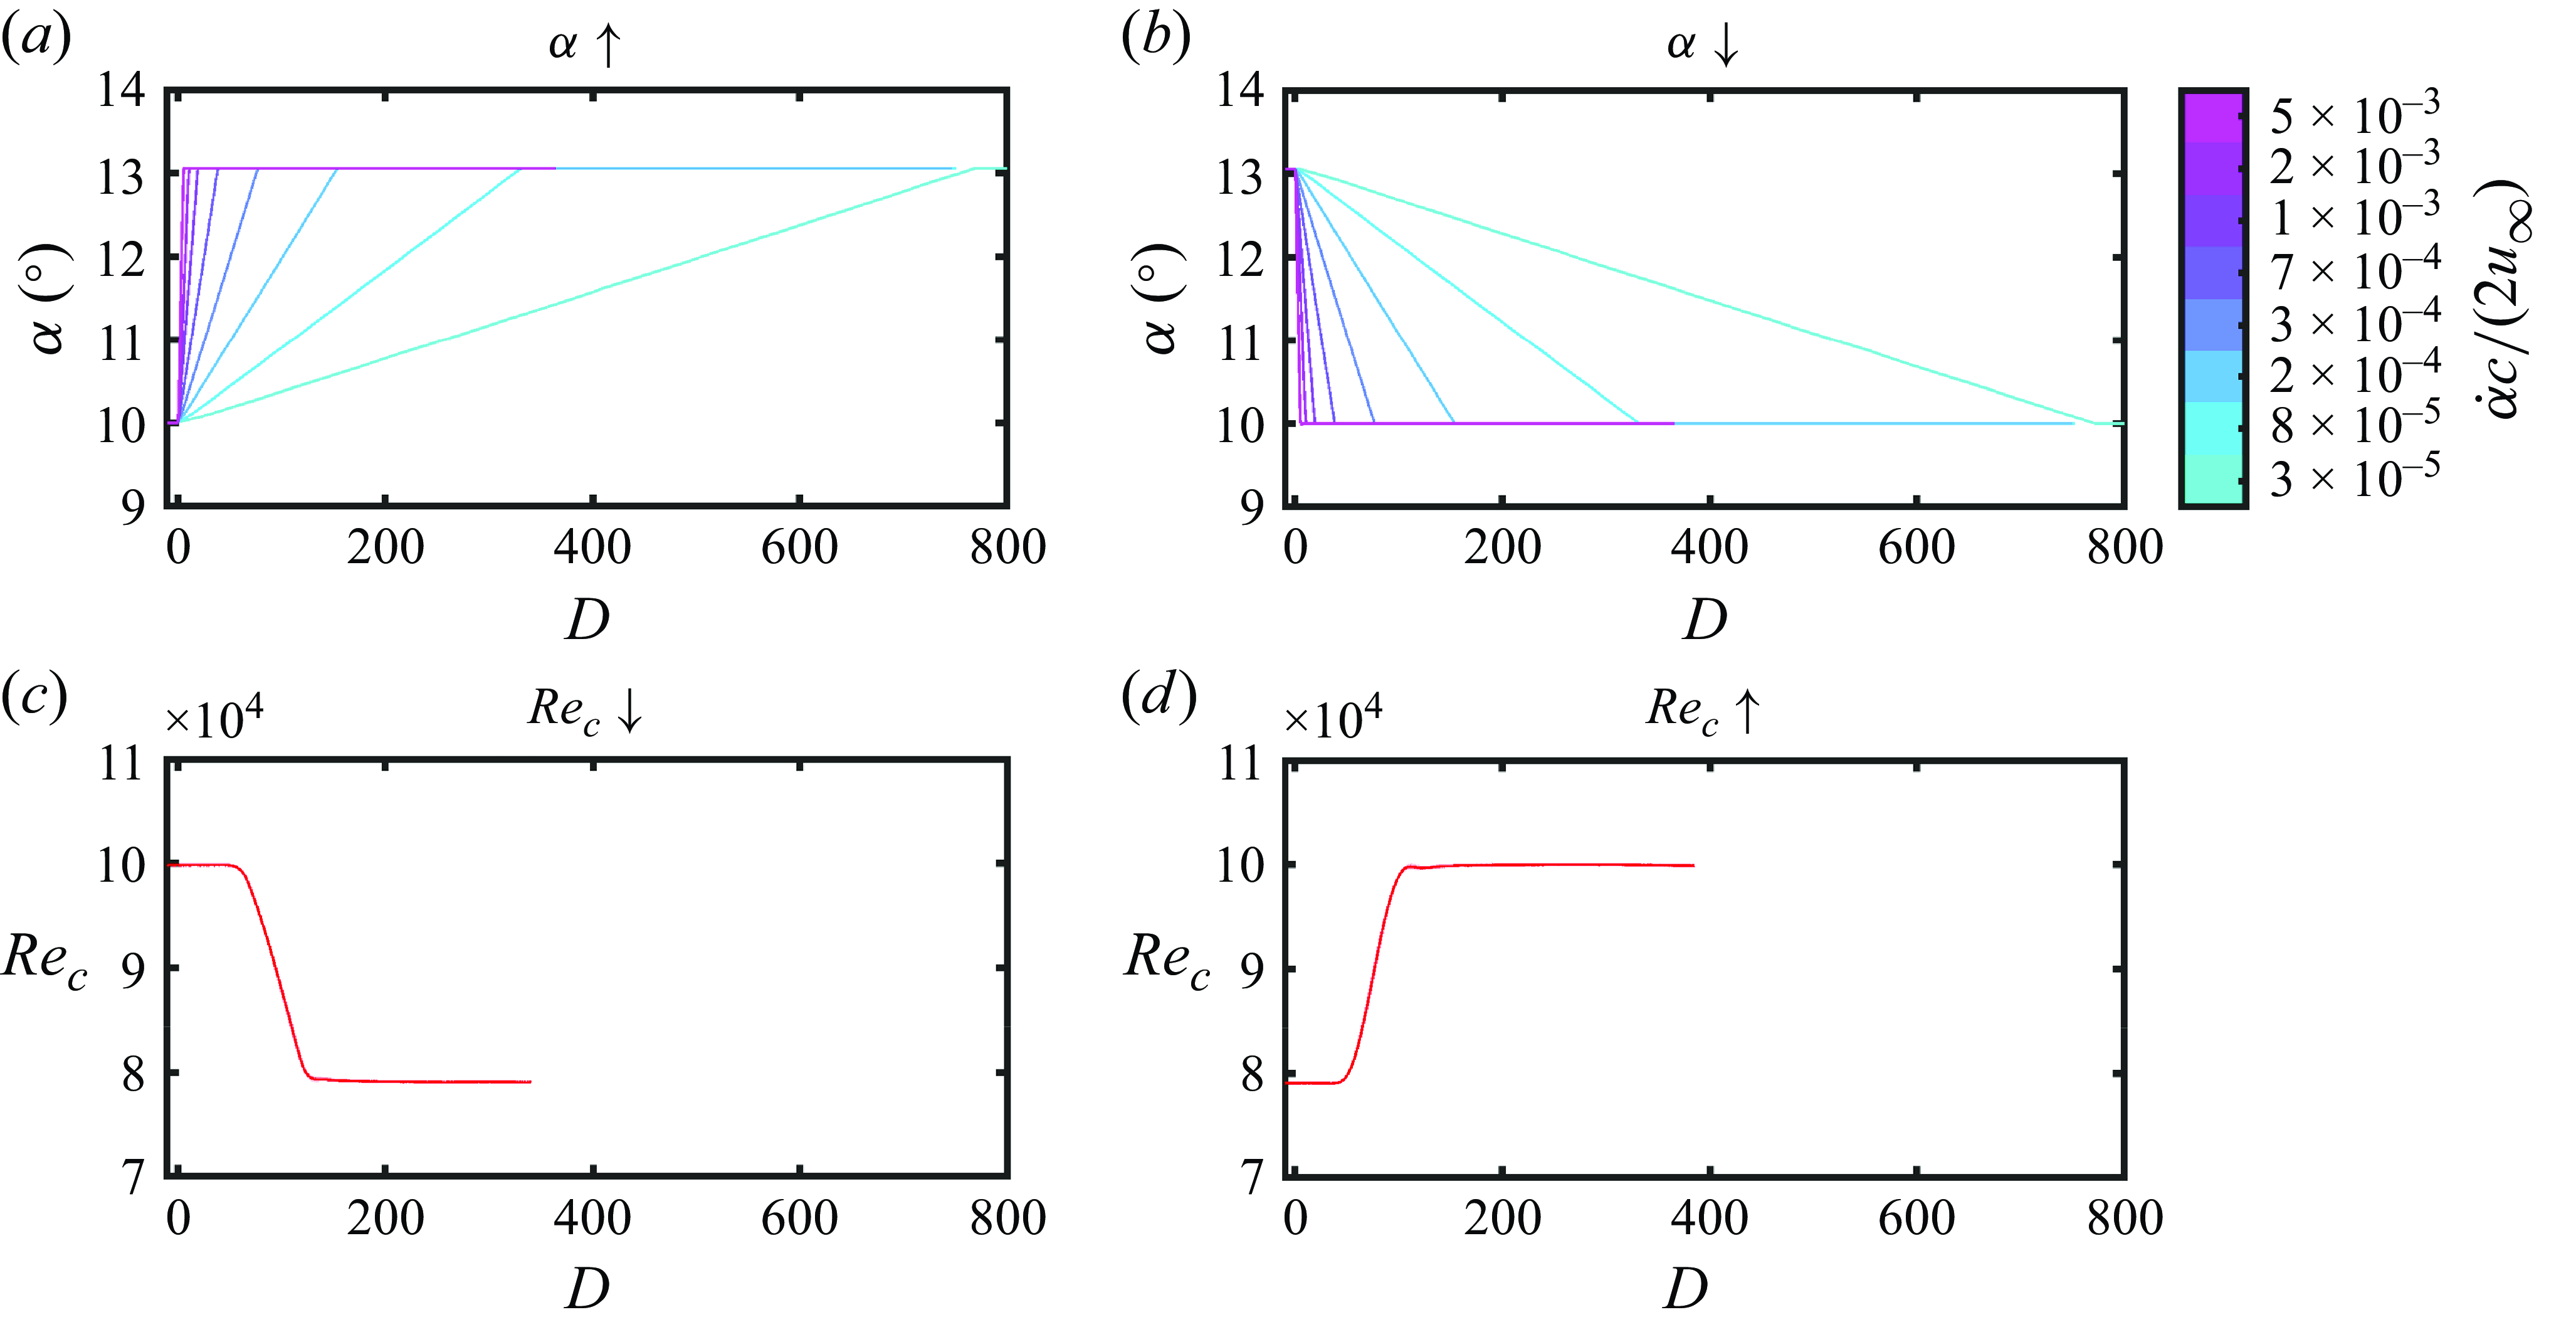
The wing and aerofoil models were subject to two types of unsteadiness: (i) changes in angle of attack at constant Reynolds number and (ii) changes in Reynolds number at constant angle of attack. The effect of the Reynolds number on the transient flow development and aerodynamic loading was considered in separate tests from the changes in angle of attack. The changes in angle of attack were performed between $10^{\circ }$
and
$10^{\circ }$
and $13^{\circ }$
at pitch rates in the range of
$13^{\circ }$
at pitch rates in the range of $3\times 10^{-5}\leqslant \vert \dot {\alpha }c/2u_\infty \vert \leqslant 5\times 10^{-3}$
. The slowest pitch rate was selected to approximate a quasi-steady change in angle of attack (Le Fouest et al. Reference Le Fouest, Deparday and Mulleners2021), whereas the fastest pitch rate was limited by the inertial forces of the model on the load cell. The time history of the angle of attack for all pitch rates tested is shown in figures 2(a) and 2(b), where the temporal data are presented in terms of the convective time
$3\times 10^{-5}\leqslant \vert \dot {\alpha }c/2u_\infty \vert \leqslant 5\times 10^{-3}$
. The slowest pitch rate was selected to approximate a quasi-steady change in angle of attack (Le Fouest et al. Reference Le Fouest, Deparday and Mulleners2021), whereas the fastest pitch rate was limited by the inertial forces of the model on the load cell. The time history of the angle of attack for all pitch rates tested is shown in figures 2(a) and 2(b), where the temporal data are presented in terms of the convective time $D=\frac {1}{c}\int _{0}^{t}u_\infty (\tau ){\rm d}\tau$
, equivalent to the number of chord lengths that the free stream has travelled at time
$D=\frac {1}{c}\int _{0}^{t}u_\infty (\tau ){\rm d}\tau$
, equivalent to the number of chord lengths that the free stream has travelled at time $t$
after the beginning of the commanded pitching motion or Reynolds number change. The Reynolds number was maintained at
$t$
after the beginning of the commanded pitching motion or Reynolds number change. The Reynolds number was maintained at $1\times 10^5\pm 1.5\times 10^3$
during the pitching motions.
$1\times 10^5\pm 1.5\times 10^3$
during the pitching motions.
Changes in Reynolds number were performed in the range of $8\times 10^4\leqslant {\text{Re}}_c\leqslant 1\times 10^5$
by changing the wind tunnel fan speed at the maximum rate allowed by the electric drive motor (figures 2
c and 2
d). The
$8\times 10^4\leqslant {\text{Re}}_c\leqslant 1\times 10^5$
by changing the wind tunnel fan speed at the maximum rate allowed by the electric drive motor (figures 2
c and 2
d). The $10\,\%-90\,\%$
rise-time for the increase in Reynolds number was
$10\,\%-90\,\%$
rise-time for the increase in Reynolds number was $39$
convective time units and the
$39$
convective time units and the $90\,\%-10\,\%$
fall-time for the decrease in Reynolds number was
$90\,\%-10\,\%$
fall-time for the decrease in Reynolds number was $49$
convective time units. The maximum non-dimensional free stream accelerations were
$49$
convective time units. The maximum non-dimensional free stream accelerations were $\vert \partial u /\partial t\vert (c/u_\infty ^2) = 0.008$
and
$\vert \partial u /\partial t\vert (c/u_\infty ^2) = 0.008$
and $0.007$
for the ramp up and down, respectively, meaning that the imposed Reynolds number changes were virtually quasi-steady. The ramp changes in Reynolds number were highly repeatable with an ensemble standard deviation accommodated by the line width in figure 2. Time
$0.007$
for the ramp up and down, respectively, meaning that the imposed Reynolds number changes were virtually quasi-steady. The ramp changes in Reynolds number were highly repeatable with an ensemble standard deviation accommodated by the line width in figure 2. Time $t=0$
is defined as the time that the rotary table or wind tunnel fan was commanded to begin changing the angle of attack or Reynolds number, respectively. The time lag between the commanded angle change and the beginning of the actual angle change measured by the encoder was negligible. However, the lag between the commanded fan speed change and measured change in Reynolds number was more substantial, yet consistent between runs. To account for this lag, § 3.2 presents results that have been shifted in time according to the response of the measured lift force. To obtain ensemble statistics, measurements were performed for each pitch rate or Reynolds number change over an ensemble of
$t=0$
is defined as the time that the rotary table or wind tunnel fan was commanded to begin changing the angle of attack or Reynolds number, respectively. The time lag between the commanded angle change and the beginning of the actual angle change measured by the encoder was negligible. However, the lag between the commanded fan speed change and measured change in Reynolds number was more substantial, yet consistent between runs. To account for this lag, § 3.2 presents results that have been shifted in time according to the response of the measured lift force. To obtain ensemble statistics, measurements were performed for each pitch rate or Reynolds number change over an ensemble of $20$
runs. Ensemble averages are denoted with a tilde (∼), and time averages are denoted with an over-bar (-). The measurements were performed as a cyclic motion, with measurements of increases in angle of attack or Reynolds number alternating with decreases in angle of attack or Reynolds number. Between each transient, the flow was allowed to stabilise for approximately
$20$
runs. Ensemble averages are denoted with a tilde (∼), and time averages are denoted with an over-bar (-). The measurements were performed as a cyclic motion, with measurements of increases in angle of attack or Reynolds number alternating with decreases in angle of attack or Reynolds number. Between each transient, the flow was allowed to stabilise for approximately $760c/u_\infty$
. For the transient cases with simultaneous force and PIV measurements, the wind tunnel fan was turned off after each transient while the particle images were downloaded from the cameras. Before each PIV measurement, the wind tunnel fan was turned on and the flow was allowed to stabilise for approximately
$760c/u_\infty$
. For the transient cases with simultaneous force and PIV measurements, the wind tunnel fan was turned off after each transient while the particle images were downloaded from the cameras. Before each PIV measurement, the wind tunnel fan was turned on and the flow was allowed to stabilise for approximately $386c/u_\infty$
. Comparison of the mean velocity fields of the initial conditions obtained after turning on the wind tunnel from rest with those obtained at the end of transient pitching motions indicated that turning off the wind tunnel between transients had negligible effect on the initial conditions.
$386c/u_\infty$
. Comparison of the mean velocity fields of the initial conditions obtained after turning on the wind tunnel from rest with those obtained at the end of transient pitching motions indicated that turning off the wind tunnel between transients had negligible effect on the initial conditions.
Two-component PIV measurements were acquired during the pitching motions at reduced pitch rates of $\dot {\alpha }c/(2u_\infty )=\pm 3\times 10^{-4}$
and
$\dot {\alpha }c/(2u_\infty )=\pm 3\times 10^{-4}$
and $\pm 5\times 10^{-3}$
, and during Reynolds number changes between
$\pm 5\times 10^{-3}$
, and during Reynolds number changes between ${{Re}}_c=8.0\times 10^4$
and
${{Re}}_c=8.0\times 10^4$
and $1.0\times 10^5$
. For all PIV measurements, the flow was seeded with water–glycol fog particles measured with a particle analyser to have a mean diameter of approximately
$1.0\times 10^5$
. For all PIV measurements, the flow was seeded with water–glycol fog particles measured with a particle analyser to have a mean diameter of approximately $0.7\,\mu \text{m}$
. The particles were illuminated with a Photonics DM20–527 Nd:YLF pulsed laser forming a light sheet with a thickness of approximately
$0.7\,\mu \text{m}$
. The particles were illuminated with a Photonics DM20–527 Nd:YLF pulsed laser forming a light sheet with a thickness of approximately $0.01c$
. Spurious light reflections in the particle images were mitigated using ensemble minimum background subtraction. All particle images were processed using the multi-pass cross-correlation algorithm with window deformation as implemented in the DaVis 10 software. Erroneous vectors were removed using universal outlier detection (Westerweel & Scarano Reference Westerweel and Scarano2005).
$0.01c$
. Spurious light reflections in the particle images were mitigated using ensemble minimum background subtraction. All particle images were processed using the multi-pass cross-correlation algorithm with window deformation as implemented in the DaVis 10 software. Erroneous vectors were removed using universal outlier detection (Westerweel & Scarano Reference Westerweel and Scarano2005).
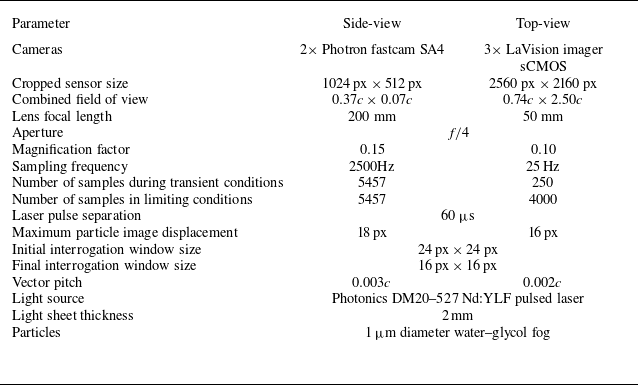
The PIV measurements were performed in two orthogonal planes (figure 1). Measurements in each plane were obtained during separate runs. The plane tangent to and offset from the suction surface is termed the top-view plane. The laser sheet for the top-view plane was positioned parallel to the model chord and the minimum distance between the model surface and the laser sheet was 3 mm. Top-view particle images were acquired using a side-by-side arrangement of three LaVision sCMOS $5.5$
megapixel cameras, operating in double-frame mode with a sampling frequency of 25 Hz and a laser pulse separation interval of
$5.5$
megapixel cameras, operating in double-frame mode with a sampling frequency of 25 Hz and a laser pulse separation interval of $80\,\mu \text{s}$
. All three cameras were equipped with Nikon 50 mm focal length lenses with the apertures set to
$80\,\mu \text{s}$
. All three cameras were equipped with Nikon 50 mm focal length lenses with the apertures set to $f/4$
. The combined field of view covered
$f/4$
. The combined field of view covered $0.03\lt X/c\lt 0.77$
in the streamwise direction and
$0.03\lt X/c\lt 0.77$
in the streamwise direction and $0\lt z/c\lt 2.5$
in the spanwise direction, and the dimensionless magnification factor was
$0\lt z/c\lt 2.5$
in the spanwise direction, and the dimensionless magnification factor was $0.10$
. The maximum particle image displacement in the top-view images was
$0.10$
. The maximum particle image displacement in the top-view images was $16$
pixels. The initial and final correlation window sizes were
$16$
pixels. The initial and final correlation window sizes were $64\,\text{px}\times 64\,\text{px}$
and
$64\,\text{px}\times 64\,\text{px}$
and $24\,\text{px}\times 24\,\text{px}$
, respectively, yielding a vector pitch of
$24\,\text{px}\times 24\,\text{px}$
, respectively, yielding a vector pitch of $0.002c$
. A total of
$0.002c$
. A total of $250$
samples were acquired during each transient pitching motion or Reynolds number change. Data from the top-view PIV plane are presented in a chord-based coordinate system, with the origin at the model root leading edge, the
$250$
samples were acquired during each transient pitching motion or Reynolds number change. Data from the top-view PIV plane are presented in a chord-based coordinate system, with the origin at the model root leading edge, the $X$
axis parallel to the chord, and the
$X$
axis parallel to the chord, and the $z$
axis parallel to the span (figure 1). The velocity components in the
$z$
axis parallel to the span (figure 1). The velocity components in the $X$
and
$X$
and $z$
directions are denoted as
$z$
directions are denoted as $u$
and
$u$
and $w$
, respectively.
$w$
, respectively.
The PIV measurement plane normal to the span of the model is termed the side-view plane. The laser sheet for the side-view plane was positioned at $z/c=1.5$
and at
$z/c=1.5$
and at $z/c=1$
for measurements on the aerofoil and wing, respectively. These locations were selected to reduce the influence of spanwise flow due to end effects on the two-component PIV measurements. Side-view particle images were acquired using two side-by-side Photron Fastcam SA4
$z/c=1$
for measurements on the aerofoil and wing, respectively. These locations were selected to reduce the influence of spanwise flow due to end effects on the two-component PIV measurements. Side-view particle images were acquired using two side-by-side Photron Fastcam SA4 $1$
-megapixel cameras operated in double-frame mode with a laser pulse separation interval of
$1$
-megapixel cameras operated in double-frame mode with a laser pulse separation interval of $60\,\mu \text{s}$
. The sampling frequency was 2500 Hz. The side-view cameras were equipped with 200 mm focal length Nikon micro lenses with the apertures set to
$60\,\mu \text{s}$
. The sampling frequency was 2500 Hz. The side-view cameras were equipped with 200 mm focal length Nikon micro lenses with the apertures set to $f/4$
. The combined field of view was
$f/4$
. The combined field of view was $0.15\lt x/c\lt 0.52$
in the streamwise direction and
$0.15\lt x/c\lt 0.52$
in the streamwise direction and $0\lt y/c\lt 0.7$
in the wall-normal direction, and the dimensionless magnification factor was
$0\lt y/c\lt 0.7$
in the wall-normal direction, and the dimensionless magnification factor was $0.15$
. The maximum particle displacement was
$0.15$
. The maximum particle displacement was $18$
pixels, and the initial and final correlation window sizes were
$18$
pixels, and the initial and final correlation window sizes were $24\,\text{px}\times 24\,\text{px}$
and
$24\,\text{px}\times 24\,\text{px}$
and $16\,\text{px}\times 16\,\text{px}$
, yielding vector pitches of
$16\,\text{px}\times 16\,\text{px}$
, yielding vector pitches of $0.003c$
. A total of
$0.003c$
. A total of $5457$
samples were acquired during each transient pitching motion or Reynolds number change and for steady-state measurements of the initial and final flow conditions. Essential PIV set-up parameters are listed in table 1. Data from the side-view PIV plane are presented in a surface-attached coordinate system, with the origin at the model root leading edge, the
$5457$
samples were acquired during each transient pitching motion or Reynolds number change and for steady-state measurements of the initial and final flow conditions. Essential PIV set-up parameters are listed in table 1. Data from the side-view PIV plane are presented in a surface-attached coordinate system, with the origin at the model root leading edge, the $x$
axis tangent to the suction surface, the
$x$
axis tangent to the suction surface, the $y$
axis normal to the suction surface and the
$y$
axis normal to the suction surface and the $z$
axis parallel to the span (figure 1). The velocity components in the
$z$
axis parallel to the span (figure 1). The velocity components in the $x$
,
$x$
, $y$
and
$y$
and $z$
directions are denoted as
$z$
directions are denoted as $u$
,
$u$
, $v$
and
$v$
and $w$
, respectively.
$w$
, respectively.
PIV parameters.
The uncertainty in each velocity vector field was estimated using the correlation statistics method (Wieneke Reference Wieneke2015). For the side-view PIV configuration, the uncertainty in the $u$
and
$u$
and $v$
velocity components in the vicinity of the separated shear layer is less than
$v$
velocity components in the vicinity of the separated shear layer is less than $0.1u_\infty$
at a confidence level of
$0.1u_\infty$
at a confidence level of $95\,\%$
. For the top-view PIV configuration, the uncertainty in the
$95\,\%$
. For the top-view PIV configuration, the uncertainty in the $u$
and
$u$
and $w$
velocity components in the vicinity of the separated shear layer is less than
$w$
velocity components in the vicinity of the separated shear layer is less than $0.13u_\infty$
at a confidence level of
$0.13u_\infty$
at a confidence level of $95\,\%$
. The higher uncertainty in the top-view measurements is attributed to the strong streamwise velocity gradient and out of plane particle motion where the separated shear layer intersects the top-view measurement plane.
$95\,\%$
. The higher uncertainty in the top-view measurements is attributed to the strong streamwise velocity gradient and out of plane particle motion where the separated shear layer intersects the top-view measurement plane.
2.1. Data processing techniques
Unfiltered and filtered lift coefficients for the aerofoil undergoing a pitch up manoeuvre at $\dot {\alpha }c/(2u_\infty )=5\times 10^{-3}$
. The forces measured in quiescent conditions have been subtracted from the forces used to calculate the unfiltered and filtered force coefficients.
$\dot {\alpha }c/(2u_\infty )=5\times 10^{-3}$
. The forces measured in quiescent conditions have been subtracted from the forces used to calculate the unfiltered and filtered force coefficients.
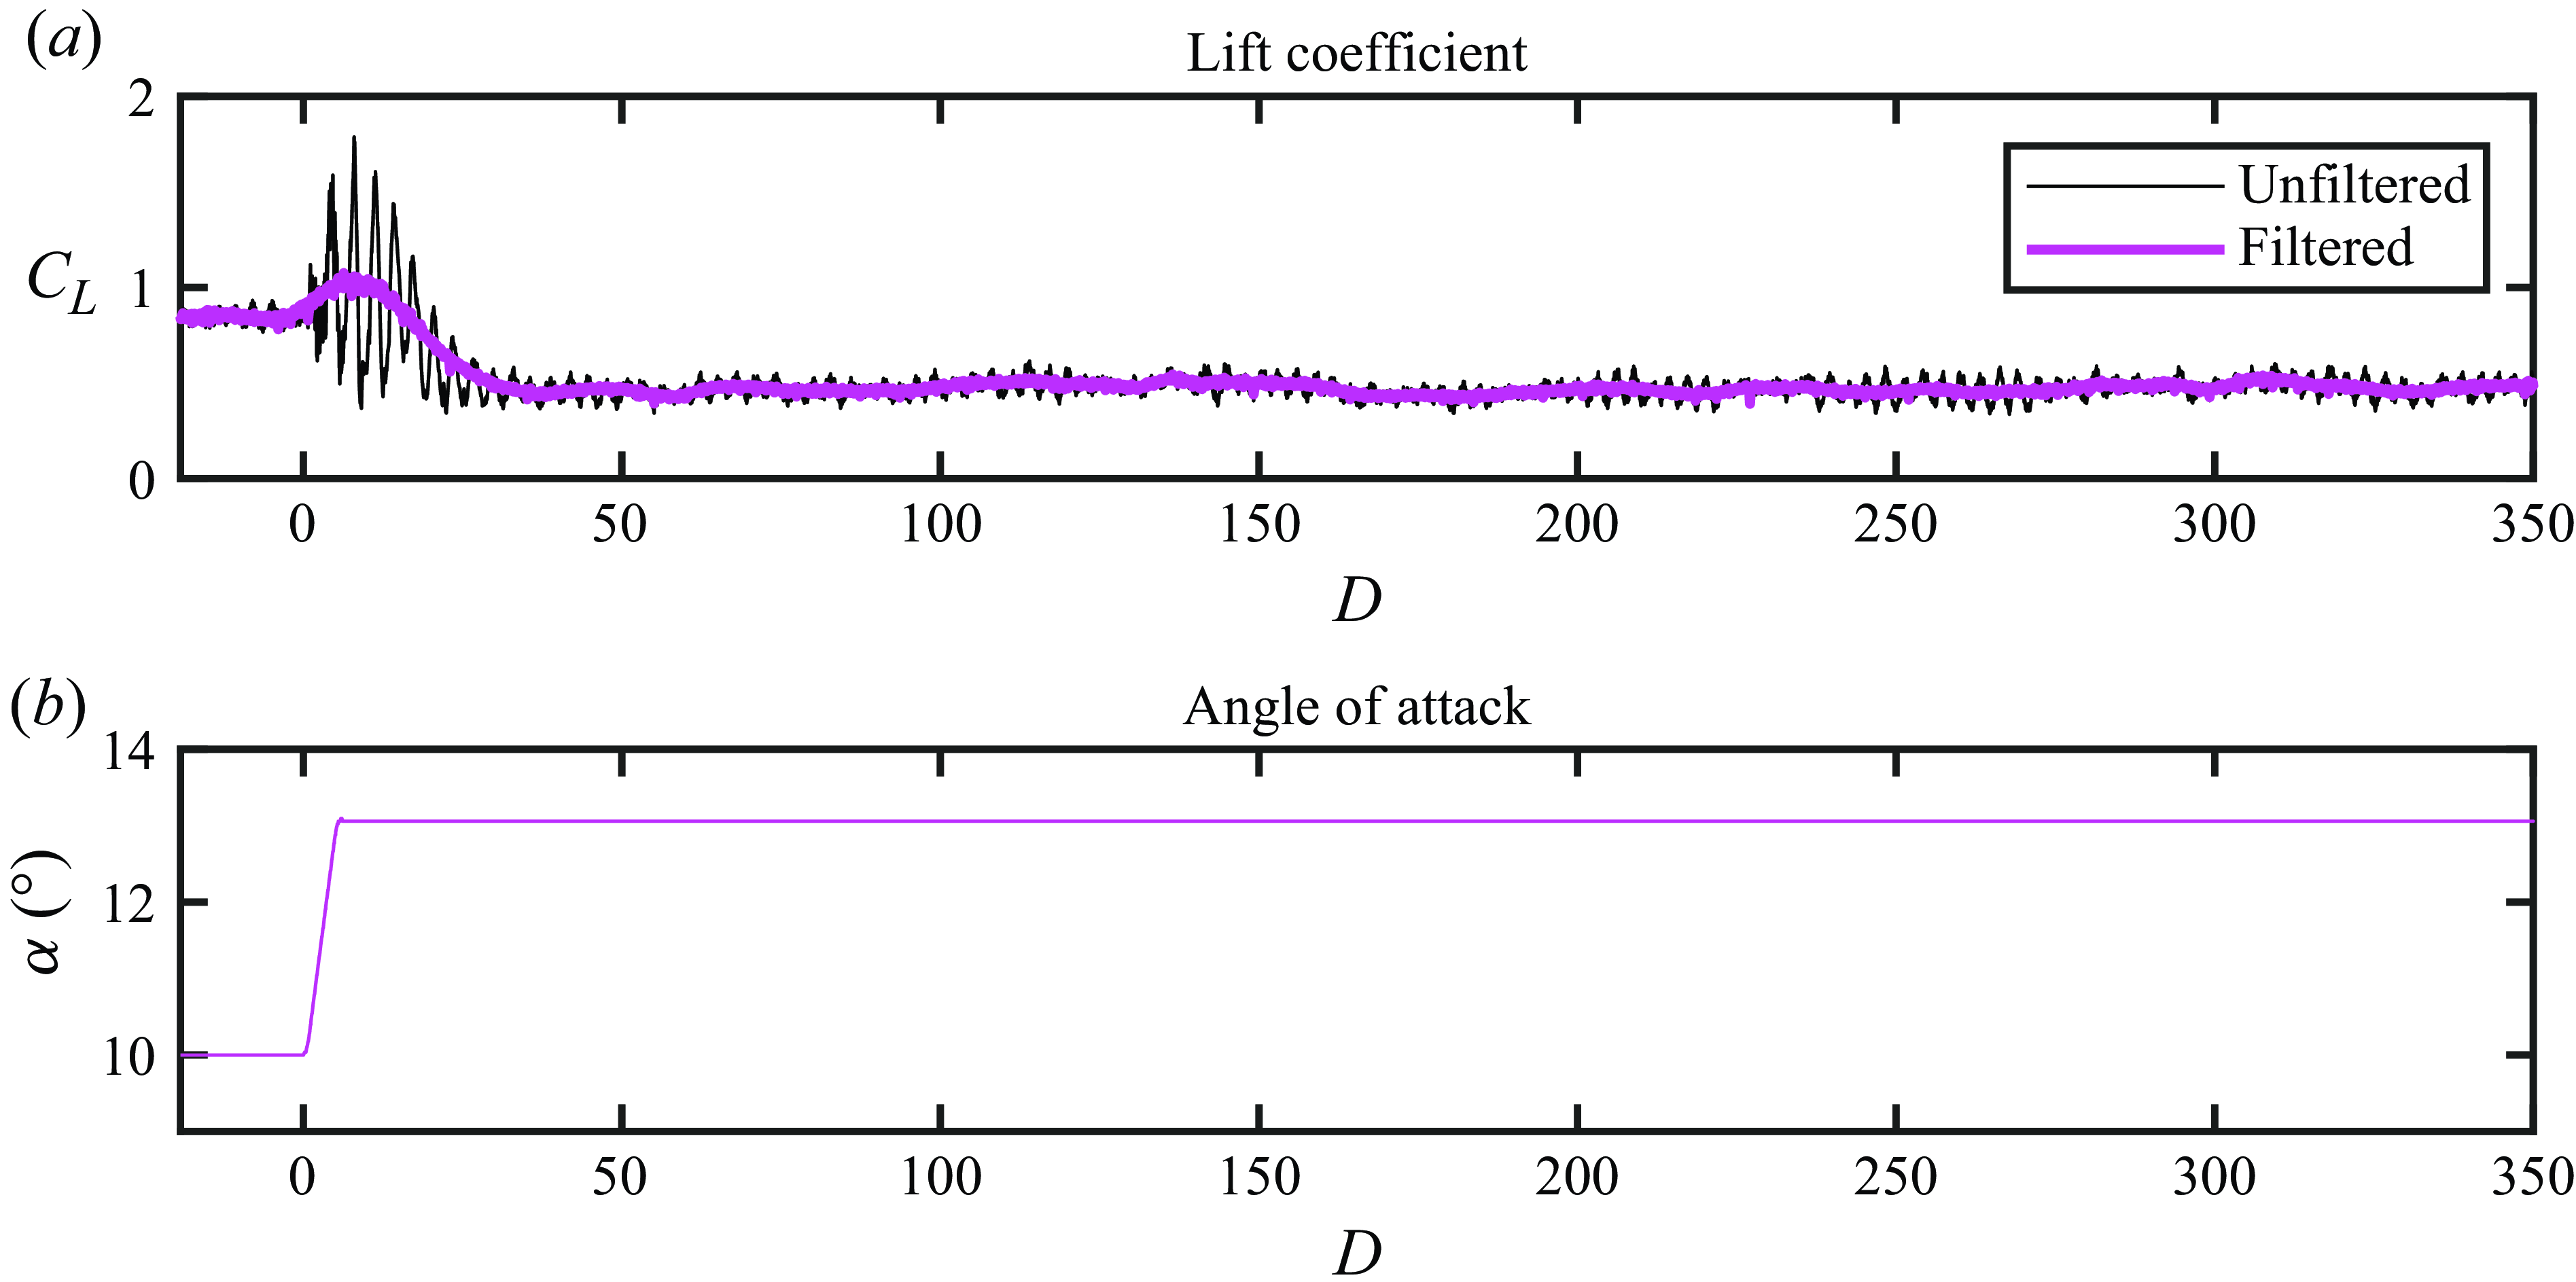
To isolate the aerodynamic loads from the inertial loads acting on the load cell during pitching motions, the lift forces measured in quiescent conditions were subtracted from the lift forces obtained during flow measurements. The structural natural frequency of both the aerofoil and wing models was measured to be approximately 12 Hz. To attenuate fluctuations in the measured force coefficients caused by random noise and structural vibrations, the lift coefficients were filtered using the empirical mode decomposition described by Huang et al. (Reference Huang, Shen, Long, Wu, Shih, Zheng, Yen, Tung and Liu1998). The filtering procedure used here involved subtracting the first six intrinsic mode functions (IMFs) from the raw force coefficient data. Cubic spline interpolation was used to compute the signal envelope. The sifting process for each IMF was stopped when the relative tolerance between consecutive sifting results ( $SD$
) was less than
$SD$
) was less than $0.15$
or at a maximum of
$0.15$
or at a maximum of $50$
sifting iterations, whichever occurred first. The relative tolerance is defined as (Huang et al. Reference Huang, Shen, Long, Wu, Shih, Zheng, Yen, Tung and Liu1998)
$50$
sifting iterations, whichever occurred first. The relative tolerance is defined as (Huang et al. Reference Huang, Shen, Long, Wu, Shih, Zheng, Yen, Tung and Liu1998)
 \begin{equation} SD = \sum _{t=0}^{T}\frac {\left (h_{k-1}(t)-h_{k}(t)\right )^2}{h_{k-1}^2(t)}, \end{equation}
where $h_{k-1}$
is the result of the previous sifting iteration,
$h_{k-1}$
is the result of the previous sifting iteration, $h_k$
is the result of the current sifting iteration and
$h_k$
is the result of the current sifting iteration and $T$
is the sampling period. A comparison of the unfiltered lift coefficient data with the quiescent load subtracted and the filtered lift coefficient with the quiescent load subtracted for the aerofoil undergoing a pitch up manoeuvre for
$T$
is the sampling period. A comparison of the unfiltered lift coefficient data with the quiescent load subtracted and the filtered lift coefficient with the quiescent load subtracted for the aerofoil undergoing a pitch up manoeuvre for $\dot {\alpha }c/(2u_\infty )=5\times 10^{-3}$
is presented in figure 3 versus the non-dimensional convective time
$\dot {\alpha }c/(2u_\infty )=5\times 10^{-3}$
is presented in figure 3 versus the non-dimensional convective time $D$
. The effective low-pass cut-off frequency of this filtering method is of the order of
$D$
. The effective low-pass cut-off frequency of this filtering method is of the order of $0.1u_\infty /c$
, corresponding to a period of approximately
$0.1u_\infty /c$
, corresponding to a period of approximately $10c/u_\infty$
. The cutoff frequency is defined as the frequency for which the ratio of the squared amplitude of the output and input signals drops below a threshold of
$10c/u_\infty$
. The cutoff frequency is defined as the frequency for which the ratio of the squared amplitude of the output and input signals drops below a threshold of $-3\,\text{dB}$
.
$-3\,\text{dB}$
.
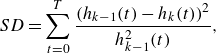
To quantitatively compare the time history of the lift coefficient between different transients, the duration of the step change in lift coefficient ( $\Delta D_{{step}}$
) and the time delay of the reaction of the lift coefficient to the change in operating conditions (
$\Delta D_{{step}}$
) and the time delay of the reaction of the lift coefficient to the change in operating conditions ( $\Delta D_{{react}}$
) were computed using a method based on that used by Le Fouest et al. (Reference Le Fouest, Deparday and Mulleners2021). In figure 4, which illustrates this method, the temporal evolution of the lift coefficients has been shifted by the time of passing the static reattachment condition (
$\Delta D_{{react}}$
) were computed using a method based on that used by Le Fouest et al. (Reference Le Fouest, Deparday and Mulleners2021). In figure 4, which illustrates this method, the temporal evolution of the lift coefficients has been shifted by the time of passing the static reattachment condition ( $D_{sr}$
, figure 4
b) and by the time of passing the static stall condition (
$D_{sr}$
, figure 4
b) and by the time of passing the static stall condition ( $D_{ss}$
figure 4
d). The static stall and reattachment angles of attack are defined as the angles of attack immediately preceding the largest magnitude rate of change of lift coefficient for increasing and decreasing angle of attack, respectively. Analogously, the static stall and reattachment Reynolds numbers are defined as the Reynolds numbers immediately following and preceding the largest magnitude rate of change of lift coefficient, respectively.
$D_{ss}$
figure 4
d). The static stall and reattachment angles of attack are defined as the angles of attack immediately preceding the largest magnitude rate of change of lift coefficient for increasing and decreasing angle of attack, respectively. Analogously, the static stall and reattachment Reynolds numbers are defined as the Reynolds numbers immediately following and preceding the largest magnitude rate of change of lift coefficient, respectively.
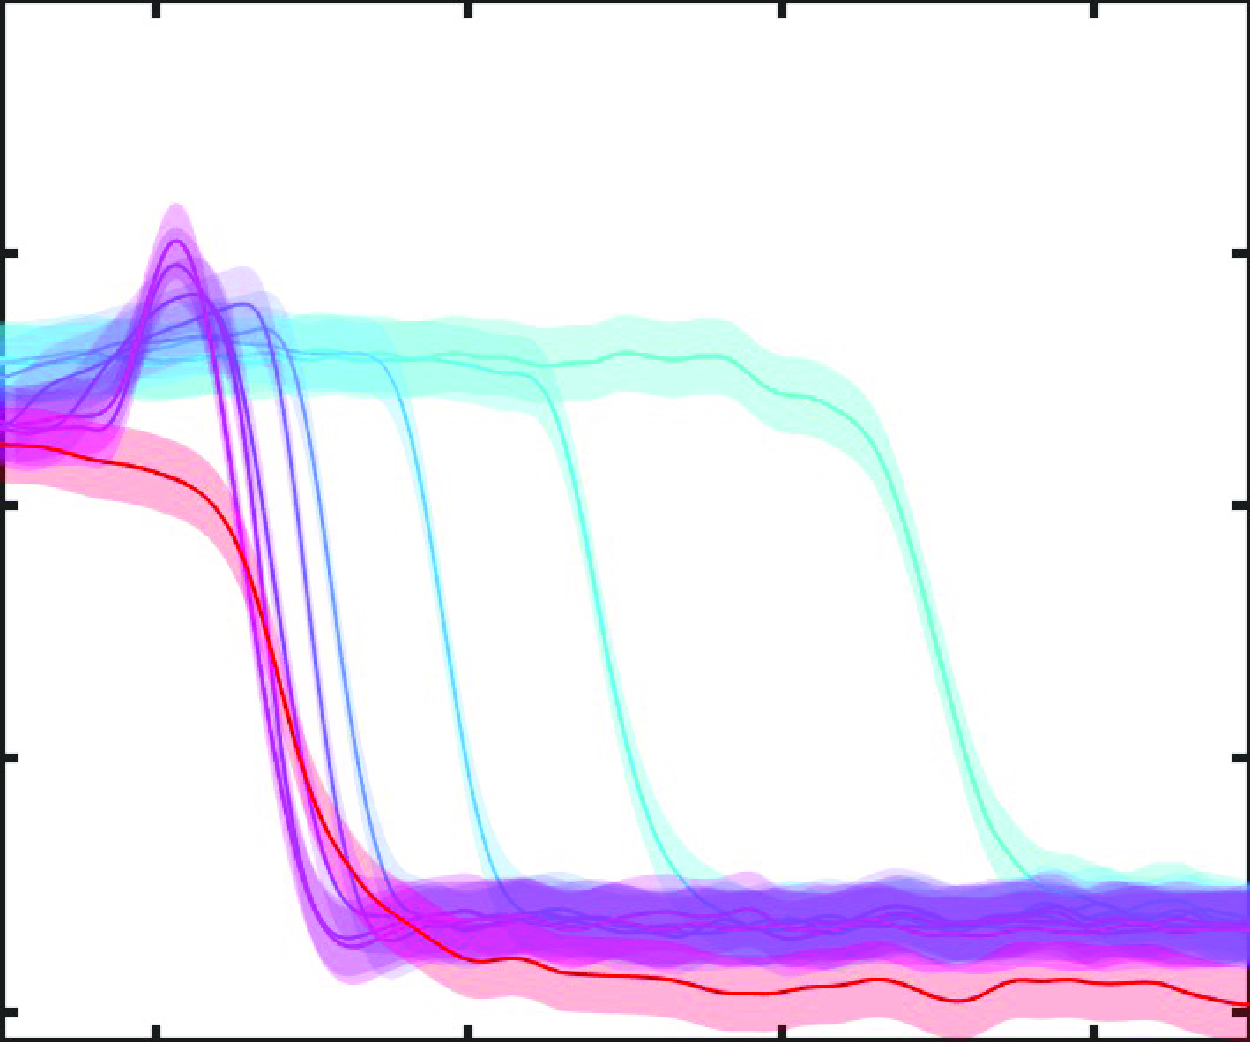
Definition of reaction and step times. Cyan line, lift coefficient during pitch down motion at $\dot {\alpha }c/(2u_\infty )=3\times 10^{-4}$
; red line, lift coefficient during decrease in
$\dot {\alpha }c/(2u_\infty )=3\times 10^{-4}$
; red line, lift coefficient during decrease in $Re_c$
; solid blue lines, pre-stall and post-stall lift coefficients; dashed blue lines, thresholds for defining
$Re_c$
; solid blue lines, pre-stall and post-stall lift coefficients; dashed blue lines, thresholds for defining $D_{{pre{-}step}}$
and
$D_{{pre{-}step}}$
and $D_{{post{-}step}}$
;
$D_{{post{-}step}}$
; $\triangle$
, quasi-steady
$\triangle$
, quasi-steady $C_L$
for increasing
$C_L$
for increasing $\alpha$
or
$\alpha$
or ${{Re}}_c$
;
${{Re}}_c$
; $\triangledown$
, quasi-steady
$\triangledown$
, quasi-steady $C_L$
for decreasing
$C_L$
for decreasing $\alpha$
or
$\alpha$
or ${{Re}}_c$
.
${{Re}}_c$
.
The step times ( $\Delta D_{{step}}$
) are defined as the difference between the post-step time (
$\Delta D_{{step}}$
) are defined as the difference between the post-step time ( $D_{{post-step}}$
) and the pre-step (
$D_{{post-step}}$
) and the pre-step ( $D_{{pre-step}}$
) time, which correspond to the end and the beginning of the step change in lift coefficient, respectively. The procedure for computing
$D_{{pre-step}}$
) time, which correspond to the end and the beginning of the step change in lift coefficient, respectively. The procedure for computing $D_{{pre-step}}$
and
$D_{{pre-step}}$
and $D_{{post-step}}$
requires the definition of pre- and post-stall lift coefficients (
$D_{{post-step}}$
requires the definition of pre- and post-stall lift coefficients ( $C_{L,{pre-stall}}$
and
$C_{L,{pre-stall}}$
and $C_{L,{post-stall}}$
). Because the quasi-steady pre-stall and post-stall lift coefficients vary with angle of attack and Reynolds number, the employed stall and reattachment thresholds for the lift coefficient are also defined as functions of the angle of attack and Reynolds number using the following procedure. In the case of pitching transients, for angles of attack below the static stall angle,
$C_{L,{post-stall}}$
). Because the quasi-steady pre-stall and post-stall lift coefficients vary with angle of attack and Reynolds number, the employed stall and reattachment thresholds for the lift coefficient are also defined as functions of the angle of attack and Reynolds number using the following procedure. In the case of pitching transients, for angles of attack below the static stall angle, $C_{L,{pre-stall}}$
is defined equal to the quasi-steady lift coefficient during quasi-steady upward pitching. For angles of attack above the static stall angle,
$C_{L,{pre-stall}}$
is defined equal to the quasi-steady lift coefficient during quasi-steady upward pitching. For angles of attack above the static stall angle, $C_{L,{pre-stall}}$
is defined equal to the lift coefficient at the static stall angle. Similarly,
$C_{L,{pre-stall}}$
is defined equal to the lift coefficient at the static stall angle. Similarly, $C_{L,{post-stall}}$
is defined as equal to the quasi-steady lift coefficient during downward pitching for angles of attack greater than the quasi-steady reattachment angle, and equal to the lift coefficient at the quasi-steady reattachment angle for angles of attack less than the quasi-steady reattachment angle. These definitions of
$C_{L,{post-stall}}$
is defined as equal to the quasi-steady lift coefficient during downward pitching for angles of attack greater than the quasi-steady reattachment angle, and equal to the lift coefficient at the quasi-steady reattachment angle for angles of attack less than the quasi-steady reattachment angle. These definitions of $C_{L,{pre-stall}}$
and
$C_{L,{pre-stall}}$
and $C_{L,{post-stall}}$
are plotted as solid blue lines in figure 4(a). The pre-stall and post-stall lift coefficients for the transient changes in Reynolds number (figure 4
c) are defined analogously.
$C_{L,{post-stall}}$
are plotted as solid blue lines in figure 4(a). The pre-stall and post-stall lift coefficients for the transient changes in Reynolds number (figure 4
c) are defined analogously.
For transients leading to stall, the start of the step change in lift coefficient ( $D_{{pre-step}}$
) is defined as the first time after the initiation of the change in operating conditions that the lift coefficient was less than
$D_{{pre-step}}$
) is defined as the first time after the initiation of the change in operating conditions that the lift coefficient was less than $C_{L,{pre-stall}}-0.1 (C_{L,{pre-stall}}-C_{L,{post-stall}} )$
, and the end of the step change in lift coefficient (
$C_{L,{pre-stall}}-0.1 (C_{L,{pre-stall}}-C_{L,{post-stall}} )$
, and the end of the step change in lift coefficient ( $D_{{post-step}}$
) is defined as the first time that the lift coefficient was less than
$D_{{post-step}}$
) is defined as the first time that the lift coefficient was less than $C_{L,{post-stall}}+0.1 (C_{L,{pre-stall}}-C_{L,{post-stall}} )$
. For the transients leading to reattachment,
$C_{L,{post-stall}}+0.1 (C_{L,{pre-stall}}-C_{L,{post-stall}} )$
. For the transients leading to reattachment, $D_{{pre-step}}$
is defined as the last time that the lift coefficient was less than
$D_{{pre-step}}$
is defined as the last time that the lift coefficient was less than $C_{L,{post-stall}}+0.1 (C_{L,{pre-stall}}-C_{L,{post-stall}} )$
and
$C_{L,{post-stall}}+0.1 (C_{L,{pre-stall}}-C_{L,{post-stall}} )$
and $D_{{post-step}}$
is defined as the first time that the lift coefficient was greater than
$D_{{post-step}}$
is defined as the first time that the lift coefficient was greater than $C_{L,{pre-stall}}-0.1 (C_{L,{pre-stall}}-C_{L,{post-stall}} )$
. These thresholds are plotted as dashed blue lines in figure 4. Representative runs for LSB formation and bursting are presented in figures 4(b) and 4(d). The reaction delay (
$C_{L,{pre-stall}}-0.1 (C_{L,{pre-stall}}-C_{L,{post-stall}} )$
. These thresholds are plotted as dashed blue lines in figure 4. Representative runs for LSB formation and bursting are presented in figures 4(b) and 4(d). The reaction delay ( $\Delta D_{{react}}$
) is defined as the time difference between
$\Delta D_{{react}}$
) is defined as the time difference between $D_{{pre-step}}$
and the passing of the static stall or reattachment condition. The definitions of the start and end of the step changes where formulated with the goal of reducing erroneous measurements of
$D_{{pre-step}}$
and the passing of the static stall or reattachment condition. The definitions of the start and end of the step changes where formulated with the goal of reducing erroneous measurements of $\Delta D_{{react}}$
caused by the relatively large random fluctuations in lift coefficient that occur in the stalled limiting state.
$\Delta D_{{react}}$
caused by the relatively large random fluctuations in lift coefficient that occur in the stalled limiting state.
In § 3.2, ensemble statistics are presented after shifting data from individual runs in time using the mid-step time ( $D_{{mid-step}}$
) so that the step change in lift coefficient occurs at the same time for each run. Here,
$D_{{mid-step}}$
) so that the step change in lift coefficient occurs at the same time for each run. Here, $D_{{mid-step}}$
is defined as the first time the lift coefficient was equal to
$D_{{mid-step}}$
is defined as the first time the lift coefficient was equal to $1/2 (C_{L,{post-stall}}+C_{L,{pre-stall}} )$
.
$1/2 (C_{L,{post-stall}}+C_{L,{pre-stall}} )$
.
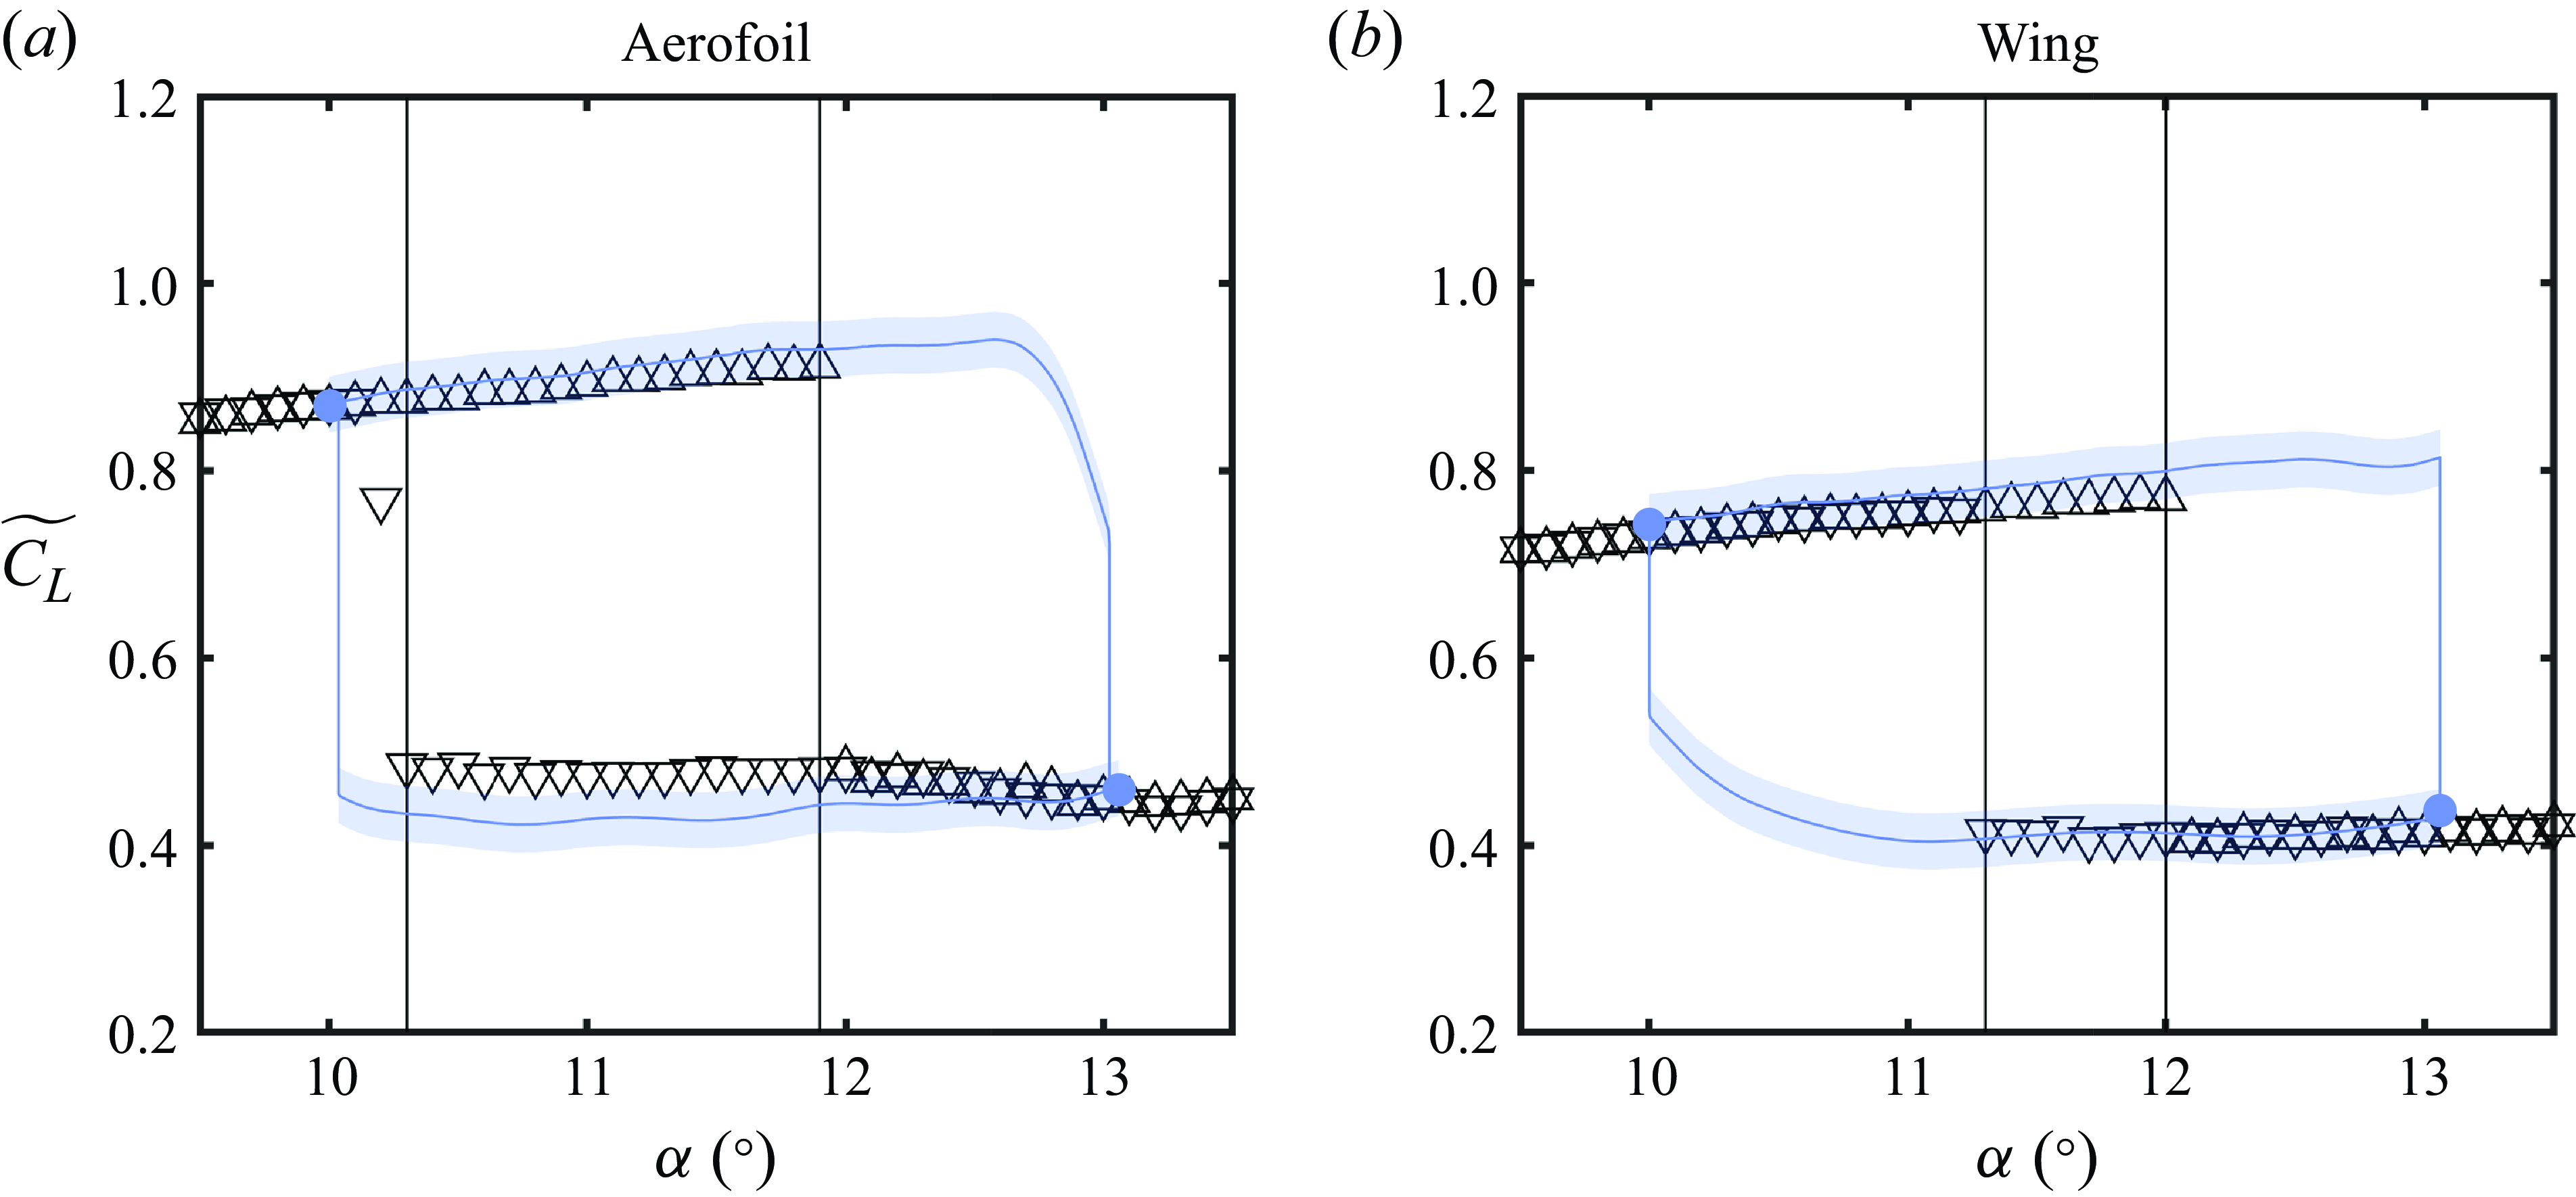
Mean streamwise velocity contours in steady conditions measured by side-view PIV configuration.

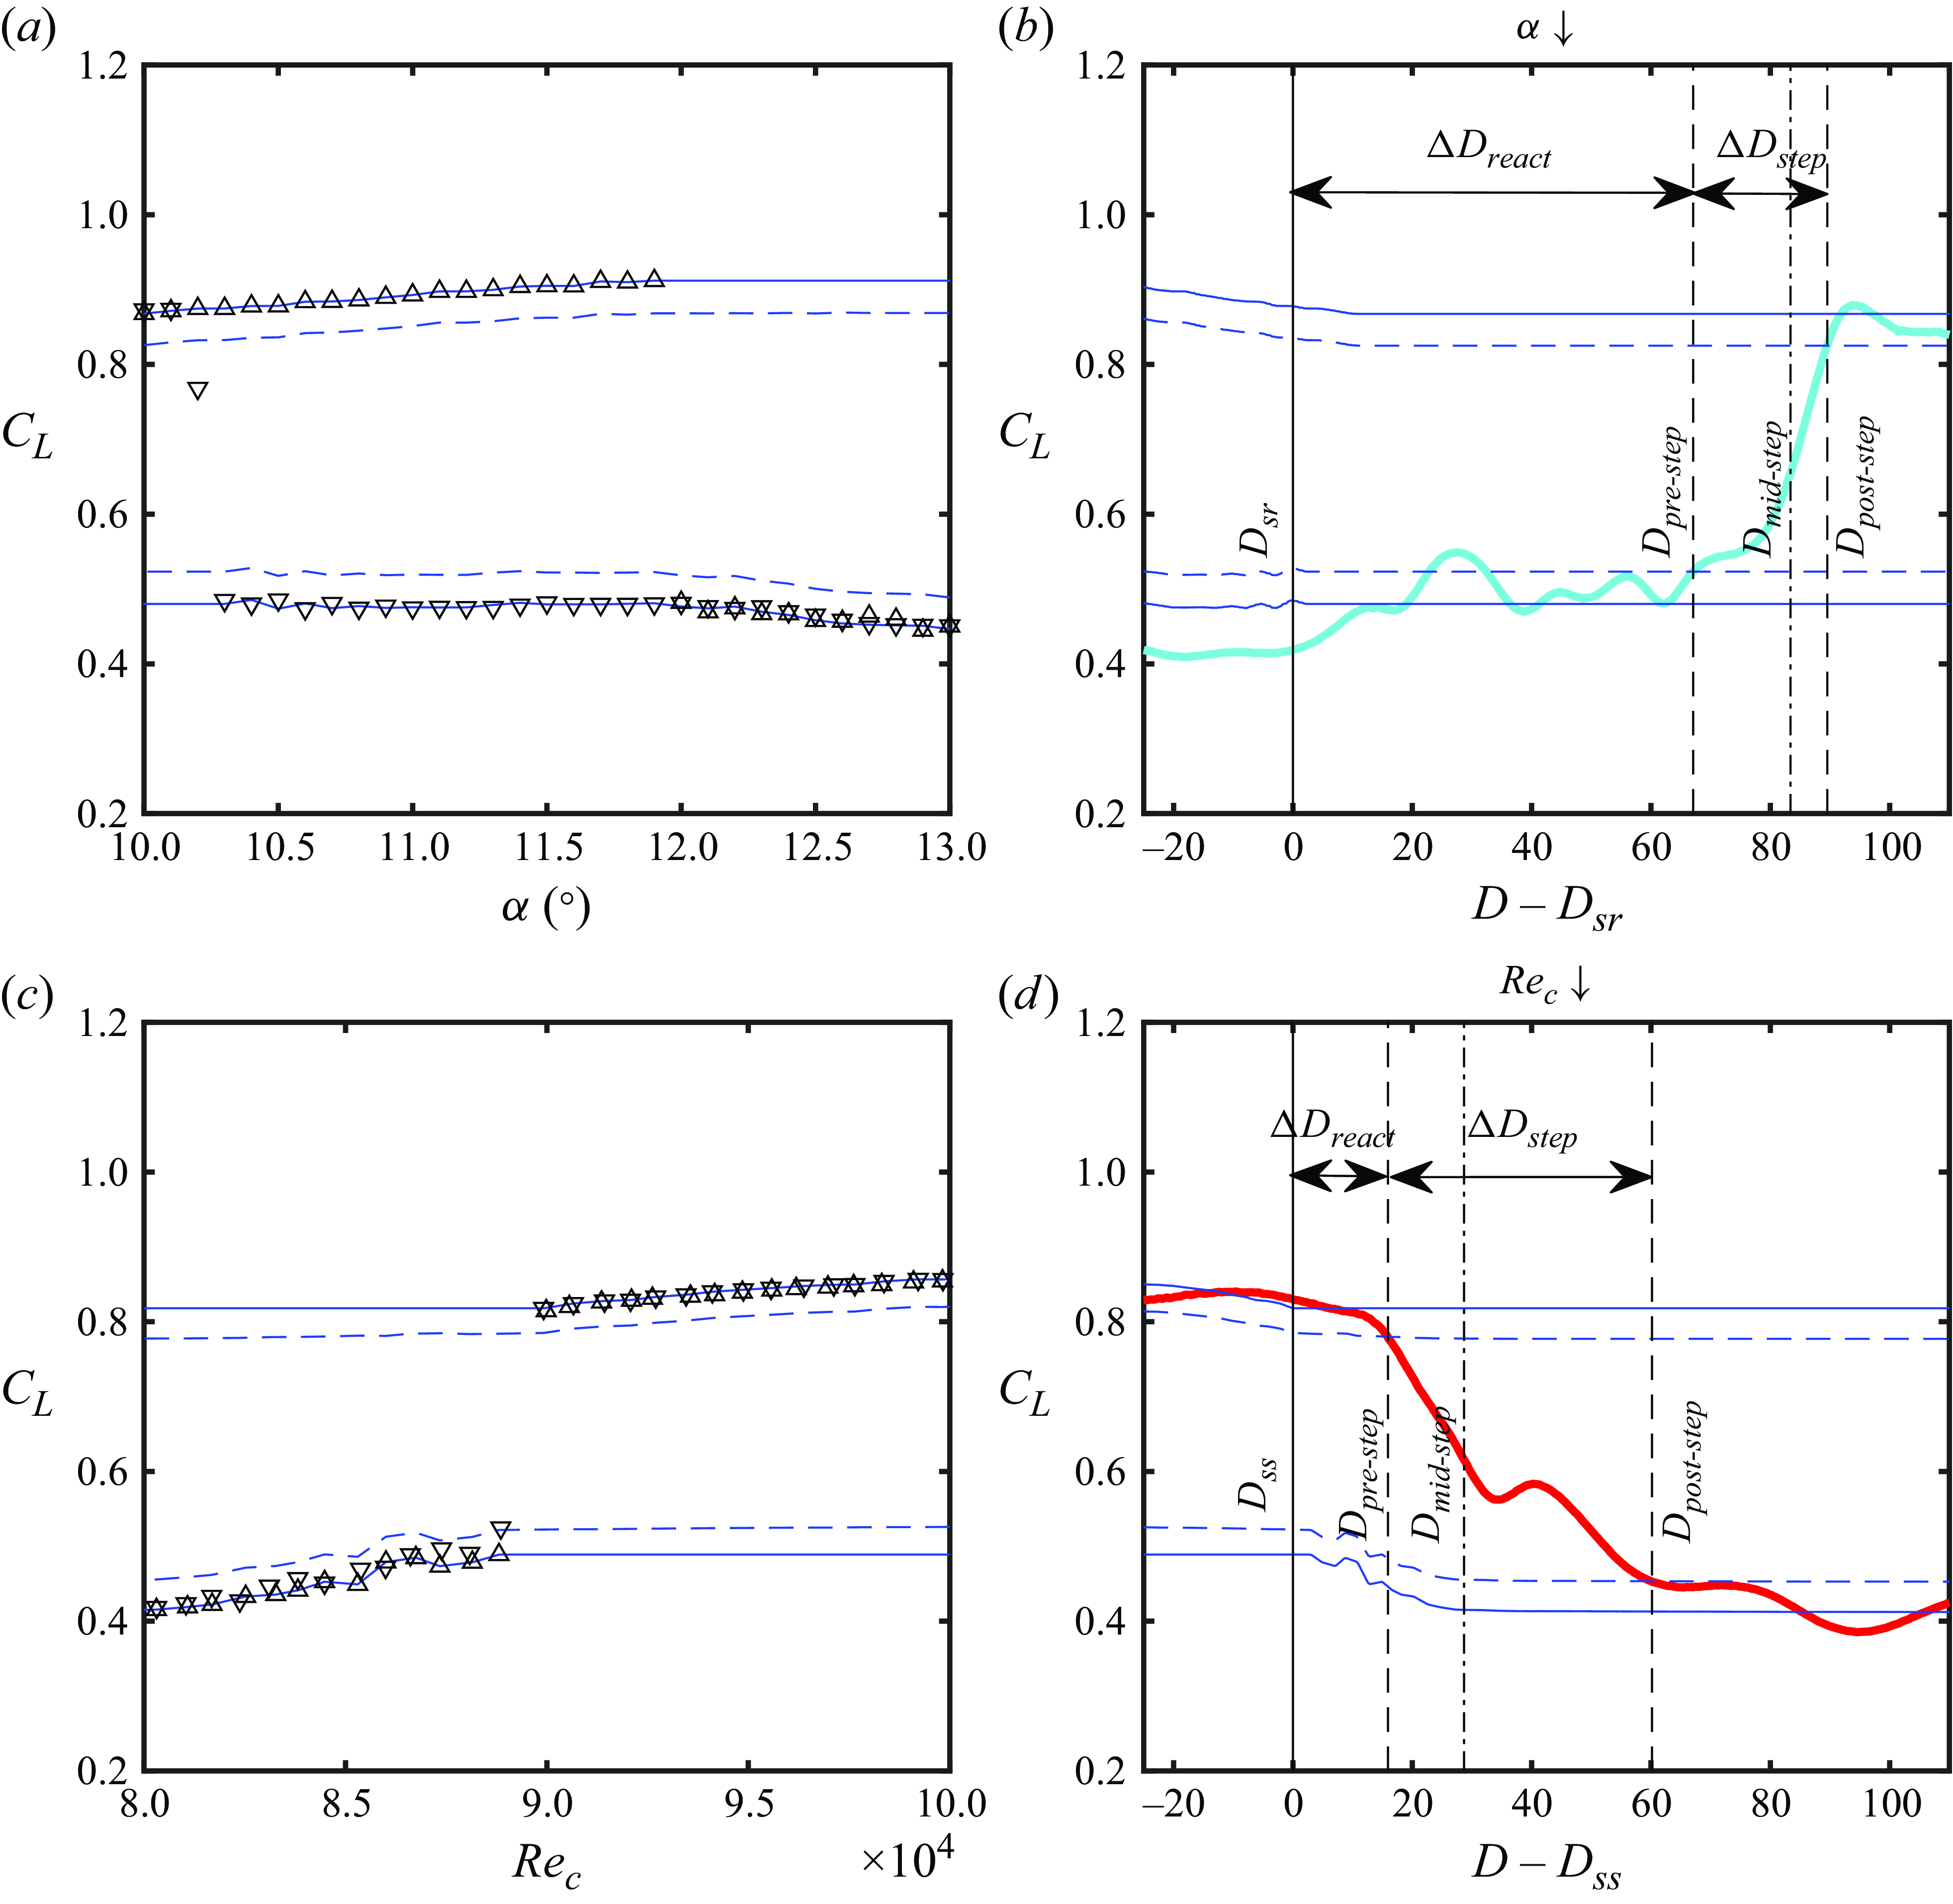
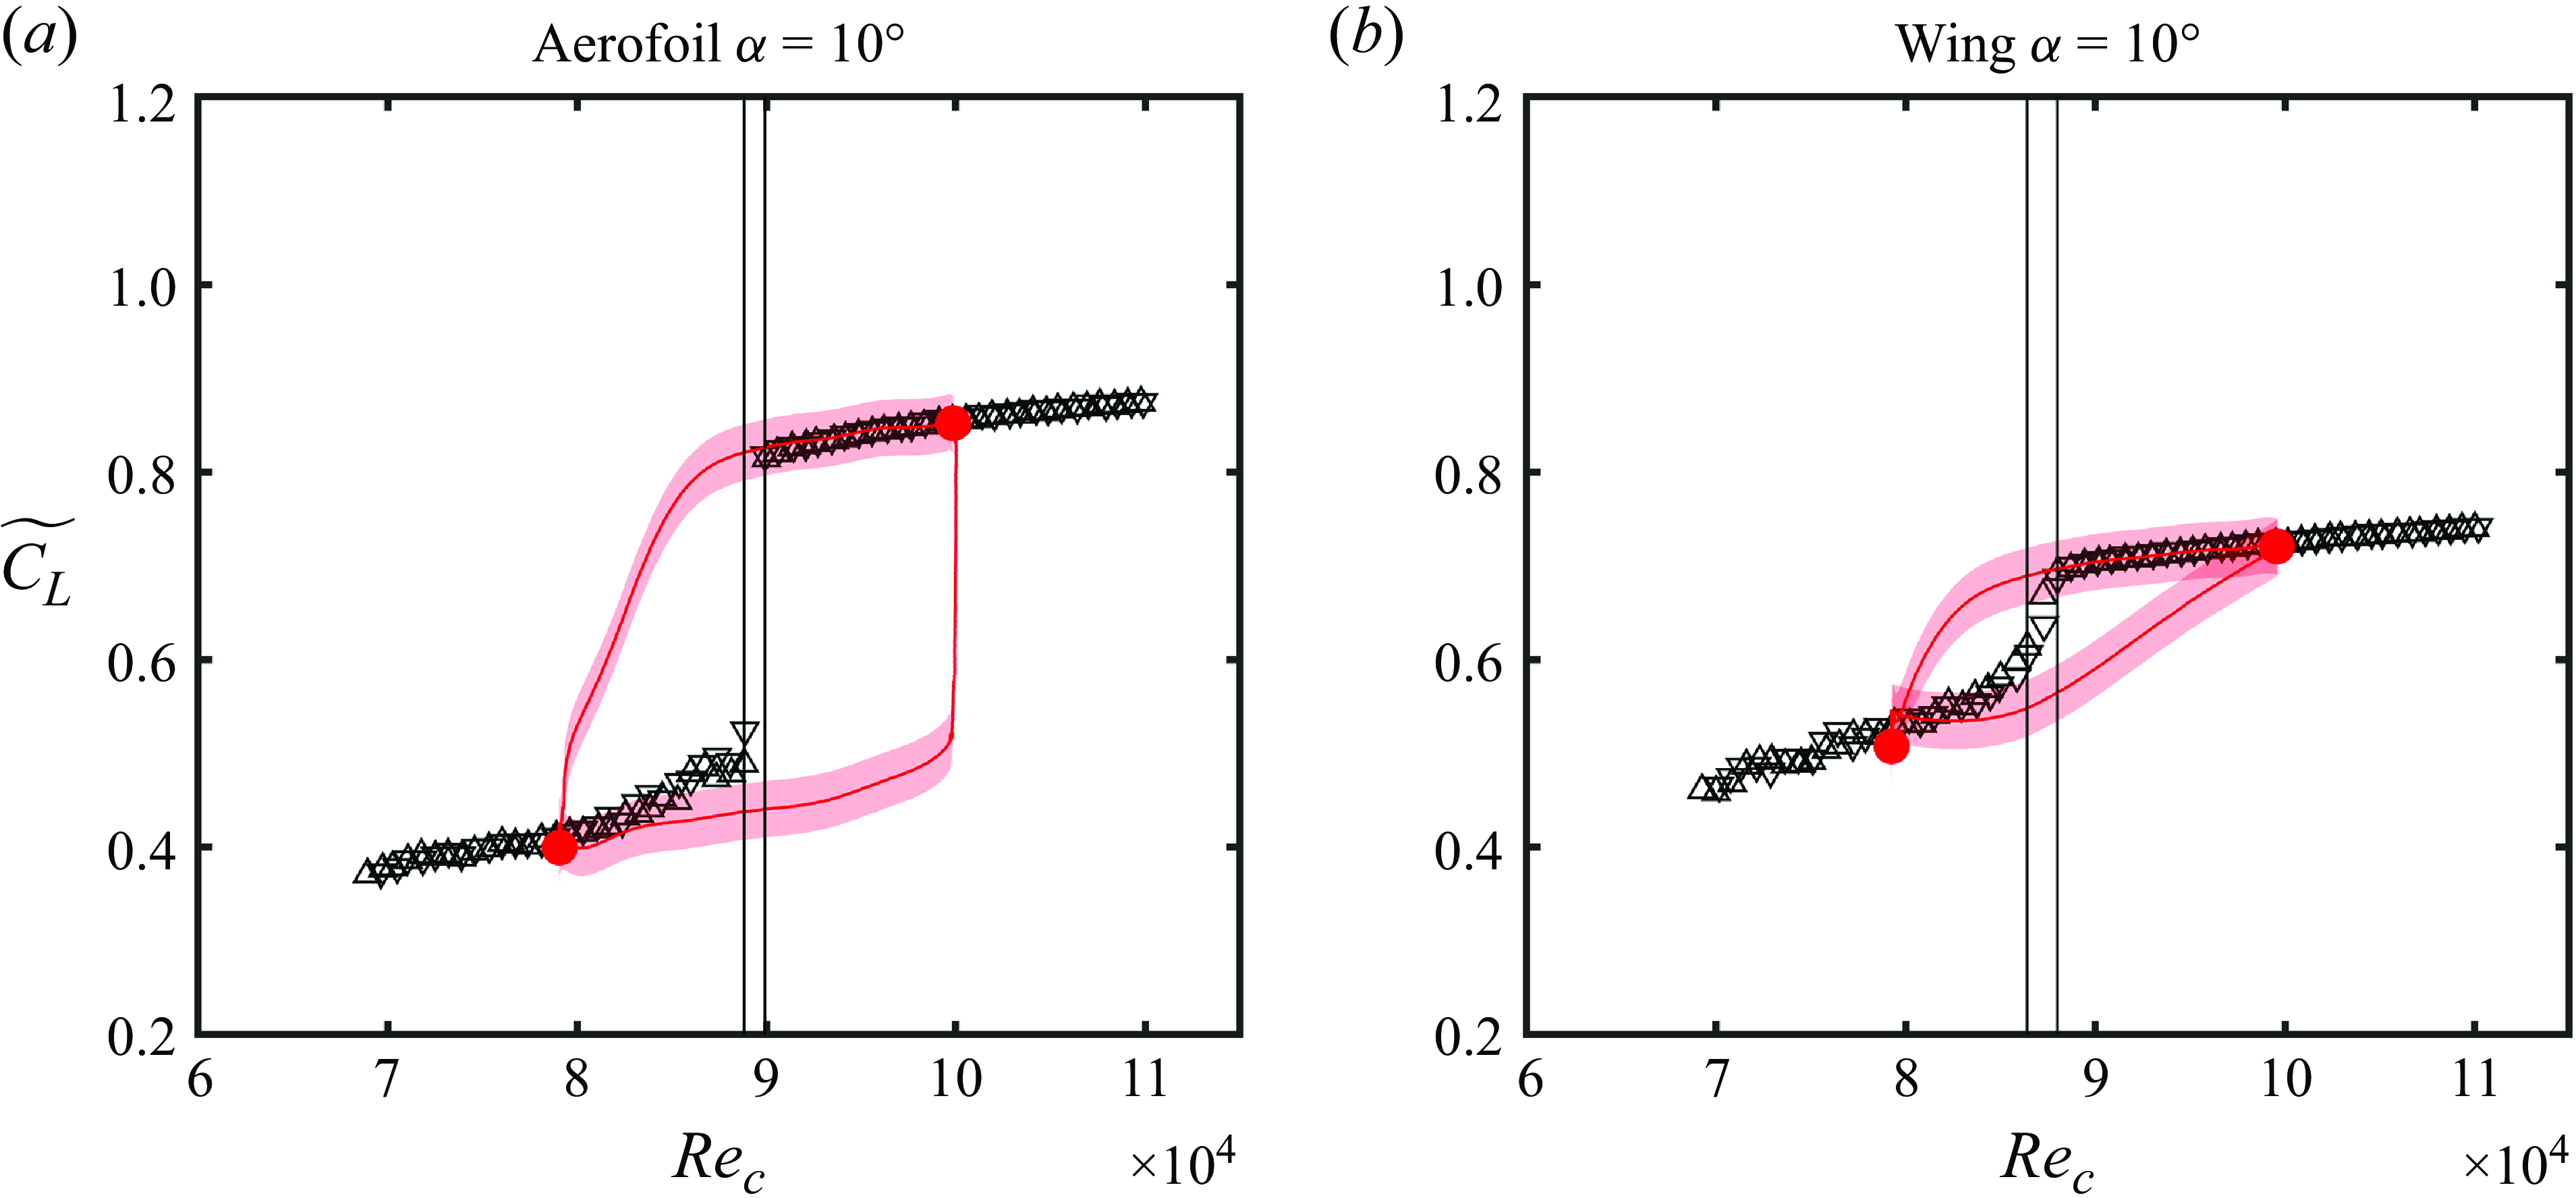
Quasi-steady (black markers) and ensemble-averaged transient (coloured lines) lift coefficients for (a) pitching aerofoil and (b) wing at ${{Re}}_c=1\times 10^5$
.
${{Re}}_c=1\times 10^5$
. $\triangle$
, increasing
$\triangle$
, increasing $\alpha$
;
$\alpha$
; $\triangledown$
, decreasing
$\triangledown$
, decreasing $\alpha$
; black lines, static reattachment stall angles; coloured markers, limiting flow states. Shaded areas denote uncertainty (
$\alpha$
; black lines, static reattachment stall angles; coloured markers, limiting flow states. Shaded areas denote uncertainty ( $95\,\%$
confidence).
$95\,\%$
confidence).
Quasi-steady (markers) and ensemble-averaged transient (red lines) lift coefficients for (a) aerofoil and (b) wing for changes in ${{Re}}_c$
.
${{Re}}_c$
. $\triangle$
, increasing
$\triangle$
, increasing ${{Re}}_c$
;
${{Re}}_c$
; $\triangledown$
, decreasing
$\triangledown$
, decreasing ${{Re}}_c$
; black lines, static reattachment and stall
${{Re}}_c$
; black lines, static reattachment and stall ${{Re}}_c$
; coloured markers, limiting flow states. Shaded areas denote uncertainty (
${{Re}}_c$
; coloured markers, limiting flow states. Shaded areas denote uncertainty ( $95\,\%$
confidence).
$95\,\%$
confidence).
3. Results and discussion
3.1. Limiting flow states
The transient changes in angle of attack and Reynolds number used to investigate LSB formation and bursting involve changes between statistically stationary limiting flow states. The wall-normal structure of the flow development on the aerofoil and wing in the limiting flow states is illustrated by the contours of mean streamwise velocity from the side-view PIV presented in figure 5. The side-view measurements were taken at $z/c=1.5$
and
$z/c=1.5$
and $z/c=1$
for the aerofoil and wing models, respectively. At
$z/c=1$
for the aerofoil and wing models, respectively. At $\alpha = 10^{\circ }$
and
$\alpha = 10^{\circ }$
and ${{Re}}_c=1.0\times 10^5$
(figures 5
a and 5
d), the laminar boundary layer separates upstream of the field of view, and reattaches in the mean sense at
${{Re}}_c=1.0\times 10^5$
(figures 5
a and 5
d), the laminar boundary layer separates upstream of the field of view, and reattaches in the mean sense at $x/c=0.32$
and
$x/c=0.32$
and $x/c=0.37$
on the aerofoil and wing models, respectively. The delay in reattachment on the wing relative to the aerofoil is attributed to the reduction in effective angle of attack on the wing model caused by the presence of the wing tip, which reduces the streamwise adverse pressure gradient and is expected to delay separation and transition (Bastedo & Mueller Reference Bastedo and Mueller1986). In the stalled limiting states (figures 5
b, 5
c, 5
e and 5
f), reattachment does not occur, and the magnitude and spatial extent of reverse flow are substantially increased. The flow field development at
$x/c=0.37$
on the aerofoil and wing models, respectively. The delay in reattachment on the wing relative to the aerofoil is attributed to the reduction in effective angle of attack on the wing model caused by the presence of the wing tip, which reduces the streamwise adverse pressure gradient and is expected to delay separation and transition (Bastedo & Mueller Reference Bastedo and Mueller1986). In the stalled limiting states (figures 5
b, 5
c, 5
e and 5
f), reattachment does not occur, and the magnitude and spatial extent of reverse flow are substantially increased. The flow field development at $\alpha = 13^\circ$
and
$\alpha = 13^\circ$
and ${{Re}}_c=1.0\times 10^5$
(figures 5
b and 5
e) is largely similar to that at
${{Re}}_c=1.0\times 10^5$
(figures 5
b and 5
e) is largely similar to that at $\alpha =10^\circ$
and
$\alpha =10^\circ$
and ${{Re}}_c=8.0\times 10^4$
(figures 5
c and 5
f), except that the separated shear layer remains closer to the model surface at the lower Reynolds number.
${{Re}}_c=8.0\times 10^4$
(figures 5
c and 5
f), except that the separated shear layer remains closer to the model surface at the lower Reynolds number.
Quasi-steady lift coefficient measurements for the wing and aerofoil models versus angle of attack and Reynolds number are presented in figures 6 and 7, respectively. The expected reduction in quasi-steady lift of the finite wing relative to the aerofoil at pre-stall angles of attack is evident from the lift polars in figure 6. The limiting flow states (coloured markers) straddle the quasi-steady stall and reattachment angles and Reynolds numbers (vertical black lines, as defined in § 2.1) for the aerofoil and wing for changes in angle of attack (figure 6) and changes in Reynolds number (figure 7). The differences between the limiting flow states measured during transients and the quasi-steady measurements are within the experimental uncertainty. The static stall angles for increasing angle of attack for the aerofoil and wing models are $11.9^{\circ }$
and
$11.9^{\circ }$
and $12.0^{\circ }$
, respectively, and the static reattachment angles for decreasing angle of attack are
$12.0^{\circ }$
, respectively, and the static reattachment angles for decreasing angle of attack are $10.3^{\circ }$
and
$10.3^{\circ }$
and $11.3^\circ$
, respectively. The static stall Reynolds numbers for decreasing Reynolds number for the aerofoil and wing are
$11.3^\circ$
, respectively. The static stall Reynolds numbers for decreasing Reynolds number for the aerofoil and wing are $9.0\times 10^4$
and
$9.0\times 10^4$
and $8.8\times 10^4$
, respectively, and the static reattachment Reynolds numbers for increasing Reynolds number are
$8.8\times 10^4$
, respectively, and the static reattachment Reynolds numbers for increasing Reynolds number are $8.9\times 10^4$
and
$8.9\times 10^4$
and $8.6\times 10^4$
, respectively. The increase in the stall and reattachment angles and decrease in the stall and reattachment Reynolds numbers of the wing relative to the aerofoil areattributed to the reduction in effective angle of attack caused by the presence of the wing tip. For both models, there is substantial hysteresis in the lift coefficient for quasi-steady changes in angle of attack. The existence of a quasi-steady hysteresis loop is characteristic of lifting surfaces operating at low Reynolds numbers (Mueller Reference Mueller1985) and suggests the presence of an LSB on both models under the conditions investigated. The area of the quasi-steady hysteresis loop of the aerofoil is 2.6 times that of the wing. In contrast to the lift coefficient hysteresis observed for quasi-steady changes in angle of attack, no significant hysteresis was observed for quasi-steady changes in Reynolds number (figure 7).
$8.6\times 10^4$
, respectively. The increase in the stall and reattachment angles and decrease in the stall and reattachment Reynolds numbers of the wing relative to the aerofoil areattributed to the reduction in effective angle of attack caused by the presence of the wing tip. For both models, there is substantial hysteresis in the lift coefficient for quasi-steady changes in angle of attack. The existence of a quasi-steady hysteresis loop is characteristic of lifting surfaces operating at low Reynolds numbers (Mueller Reference Mueller1985) and suggests the presence of an LSB on both models under the conditions investigated. The area of the quasi-steady hysteresis loop of the aerofoil is 2.6 times that of the wing. In contrast to the lift coefficient hysteresis observed for quasi-steady changes in angle of attack, no significant hysteresis was observed for quasi-steady changes in Reynolds number (figure 7).
3.2. Transient flow development
The relationship between ensemble-averaged unsteady and quasi-steady lift coefficients of the aerofoil and wing models are examined in figures 6 and 7. The pitching motion shown for comparison is that for $\dot {\alpha }c/ (2u_\infty )=\pm 3\times 10^{-4}$
, which has a duration of
$\dot {\alpha }c/ (2u_\infty )=\pm 3\times 10^{-4}$
, which has a duration of $75c/u_\infty$
that is approximately equal to the duration of the transient Reynolds number change. The ensemble-averaged lift coefficients from the transient pitching motions exhibit an enlargement of the hysteresis loop compared with the quasi-steady measurements. The area of the transient hysteresis loop of the aerofoil is 1.3 times that of the wing. Note that the uncertainty of the ensemble average (shaded area) is significantly less than the variations between individual runs because of the sample size of
$75c/u_\infty$
that is approximately equal to the duration of the transient Reynolds number change. The ensemble-averaged lift coefficients from the transient pitching motions exhibit an enlargement of the hysteresis loop compared with the quasi-steady measurements. The area of the transient hysteresis loop of the aerofoil is 1.3 times that of the wing. Note that the uncertainty of the ensemble average (shaded area) is significantly less than the variations between individual runs because of the sample size of $20$
runs. The nearly monotonic change in ensemble-averaged lift coefficient between
$20$
runs. The nearly monotonic change in ensemble-averaged lift coefficient between $\alpha = 10^\circ$
and
$\alpha = 10^\circ$
and $13^\circ$
for upward pitching of the wing (figure 6
b) indicates that stall does not occur until after the final angle of attack is reached. However, for the aerofoil, loss of lift begins prior to reaching
$13^\circ$
for upward pitching of the wing (figure 6
b) indicates that stall does not occur until after the final angle of attack is reached. However, for the aerofoil, loss of lift begins prior to reaching $\alpha = 13^\circ$
. As expected for lifting surfaces undergoing dynamic stall and reattachment, the transient pitching motions produce overshoots and undershoots relative to the quasi-steady lift coefficients (McCroskey Reference McCroskey1981; Green & Galbraith Reference Green and Galbraith1995).
$\alpha = 13^\circ$
. As expected for lifting surfaces undergoing dynamic stall and reattachment, the transient pitching motions produce overshoots and undershoots relative to the quasi-steady lift coefficients (McCroskey Reference McCroskey1981; Green & Galbraith Reference Green and Galbraith1995).
Although there is no quasi-steady hysteresis in the lift coefficient with respect to Reynolds number, transient changes in Reynolds number exhibit hysteresis for the wing and the aerofoil (figure 7). However, the reduction in effective angle of attack of the wing reduces the area of its hysteresis loop to approximately $1/4$
of the area of the aerofoil’s hysteresis loop. This suggests that the difference in lift coefficient between the upper and lower branches of the hysteresis loop with respect to Reynolds number increases with increasing effective angle of attack.
$1/4$
of the area of the aerofoil’s hysteresis loop. This suggests that the difference in lift coefficient between the upper and lower branches of the hysteresis loop with respect to Reynolds number increases with increasing effective angle of attack.
Lift coefficients from individual runs of the pitching motion with rate $\dot {\alpha }c/(2u_\infty )=3\times 10^{-5}$
and Reynolds number decrease.
$\dot {\alpha }c/(2u_\infty )=3\times 10^{-5}$
and Reynolds number decrease.
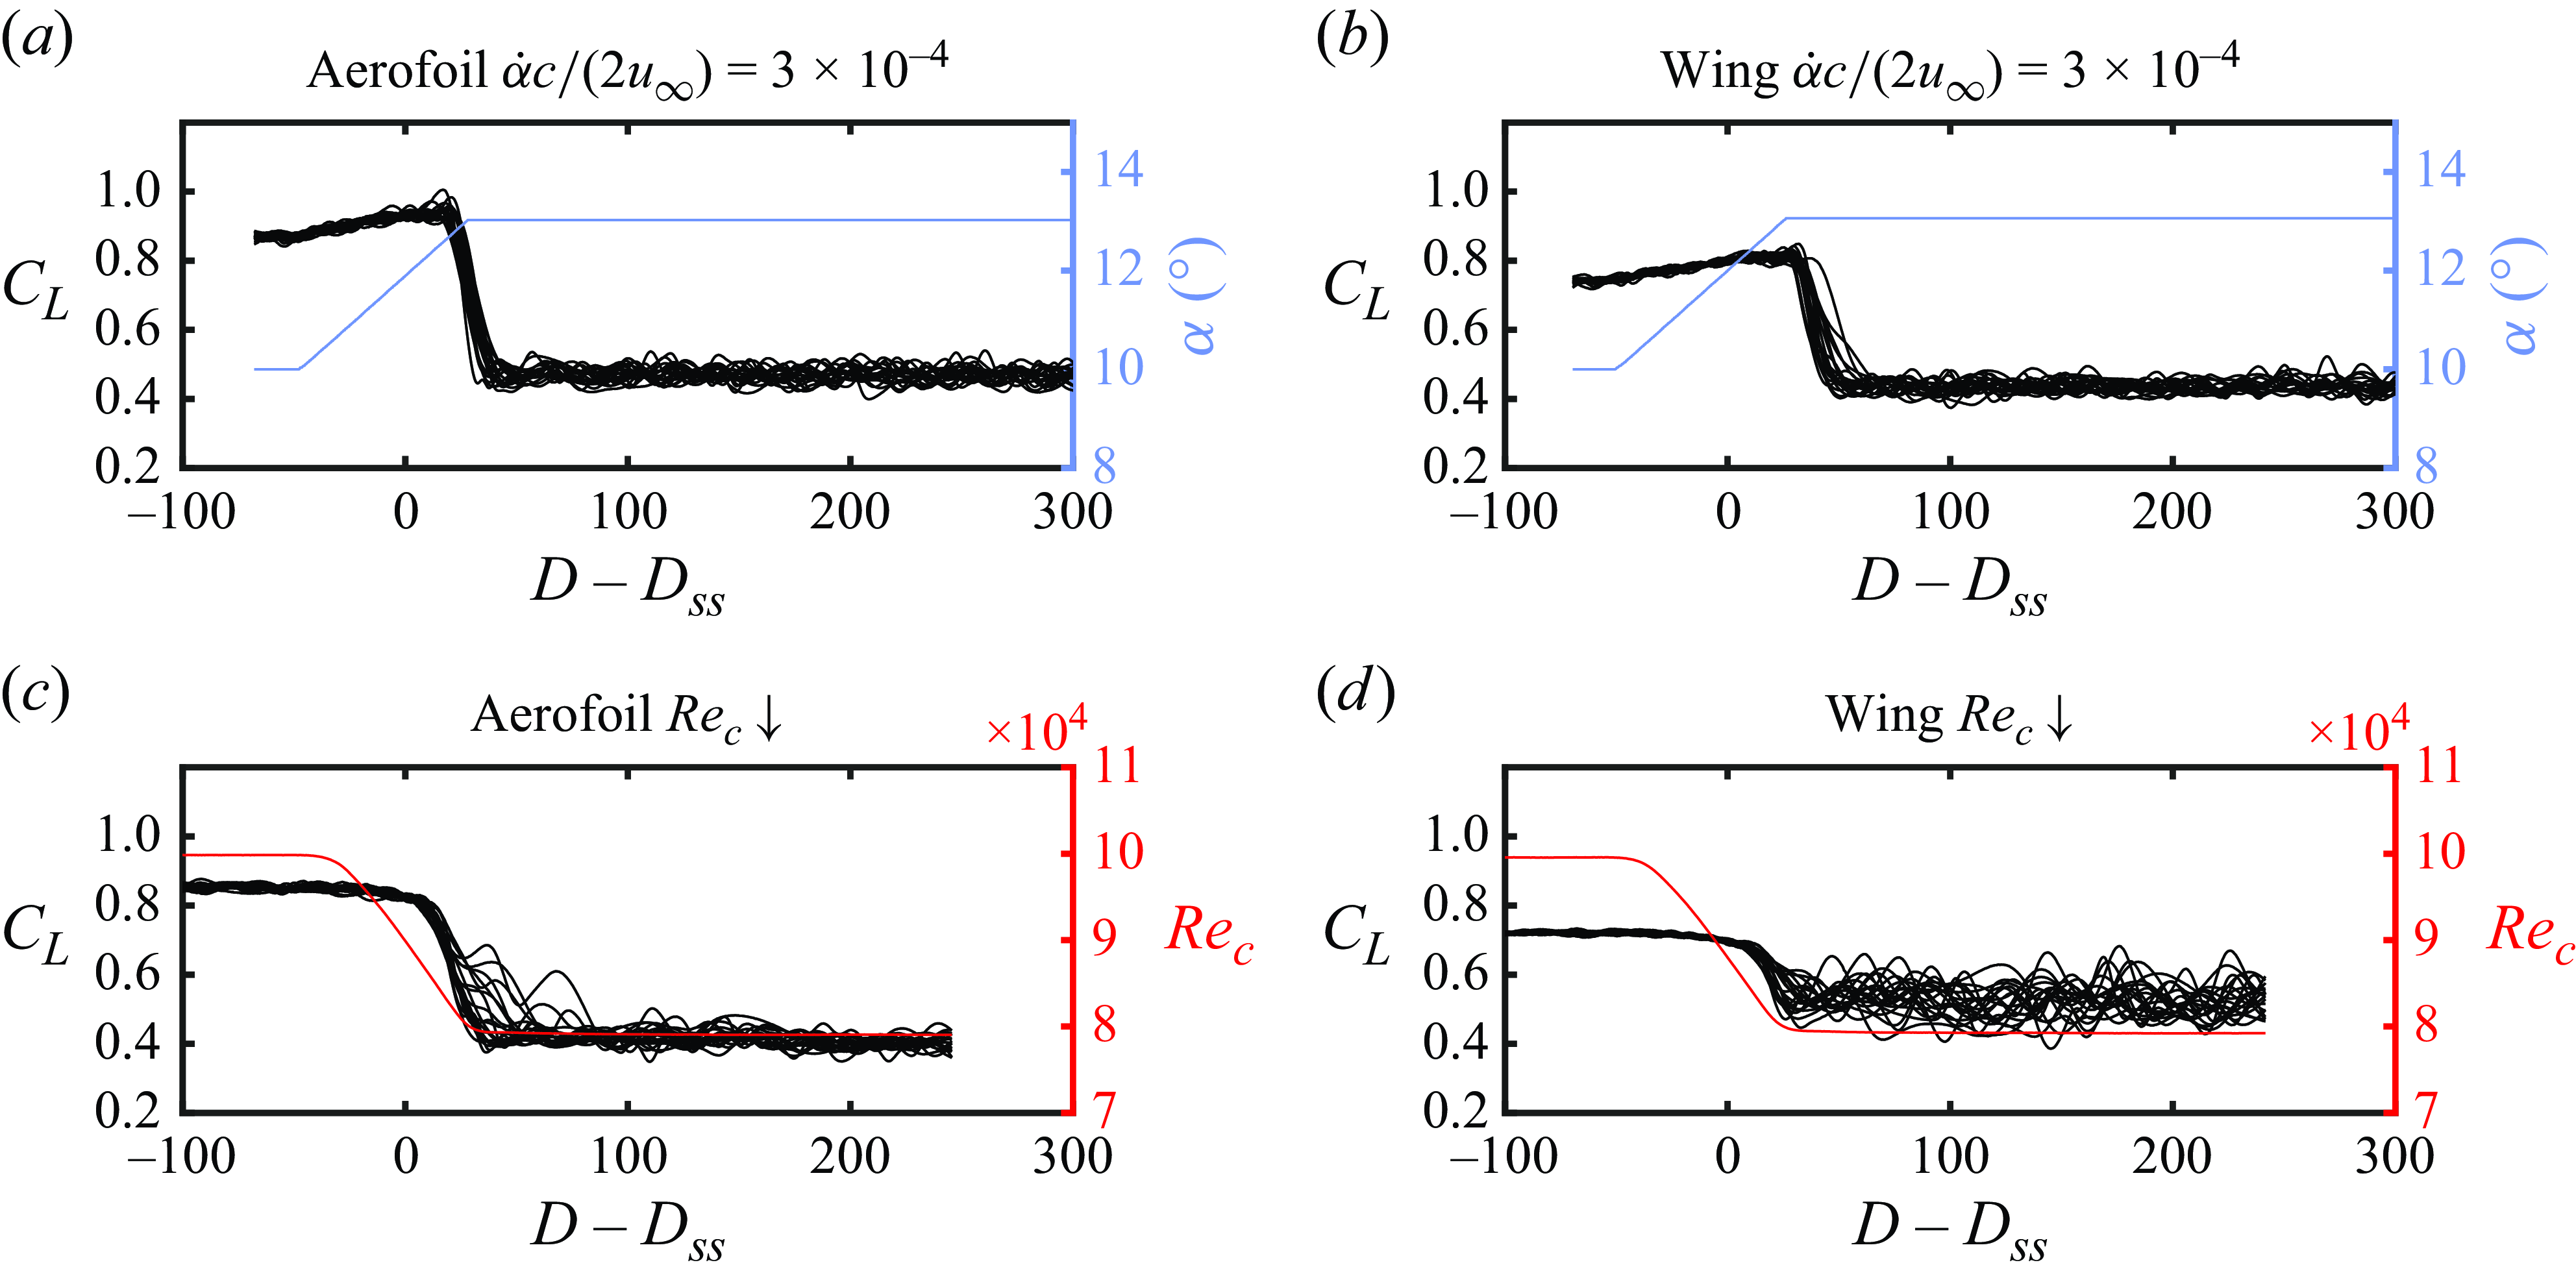
Lift coefficients from individual runs of the pitching motion with rate $\dot {\alpha }c/(2u_\infty )=-3\times 10^{-5}$
and Reynolds number increase.
$\dot {\alpha }c/(2u_\infty )=-3\times 10^{-5}$
and Reynolds number increase.
Lift coefficients obtained from individual runs for the aerofoil and wing during transients leading to stall are plotted in figure 8 versus the non-dimensional convective time. The uncertainty in instantaneous lift coefficient measurements is estimated to be less than $0.05$
. The pitching motions and Reynolds number changes in the figure have been shifted in time so that the static stall condition is passed at
$0.05$
. The pitching motions and Reynolds number changes in the figure have been shifted in time so that the static stall condition is passed at $D-D_{\textrm {ss}}=0$
for both types of changes in operating conditions. The stall process results in a step-like reduction in lift coefficient after the static stall condition is passed, with relatively small variations between runs of the moment that the rapid loss of lift initiates. In § 3.2.1 it will be shown that the step-change in lift is caused by bursting of the LSB on the suction surface. The variations in the timing of the initiation of the step-change, quantified by the standard deviations of
$D-D_{\textrm {ss}}=0$
for both types of changes in operating conditions. The stall process results in a step-like reduction in lift coefficient after the static stall condition is passed, with relatively small variations between runs of the moment that the rapid loss of lift initiates. In § 3.2.1 it will be shown that the step-change in lift is caused by bursting of the LSB on the suction surface. The variations in the timing of the initiation of the step-change, quantified by the standard deviations of $\Delta D_{{react}}$
(defined in § 2.1), are
$\Delta D_{{react}}$
(defined in § 2.1), are $2$
and
$2$
and $3$
convective time units for the pitching motions of the aerofoil and wing, respectively, for both types of changes in operating conditions.
$3$
convective time units for the pitching motions of the aerofoil and wing, respectively, for both types of changes in operating conditions.
Lift coefficients obtained from individual runs for the aerofoil and wing during transients leading to reattachment are plotted in figure 9. The measurements have been shifted in time so that the static reattachment condition is passed at $D-D_{\textrm {sr}}=0$
for both types of changes in operating conditions. The step-like increase in lift that occurs for downward pitching motions and Reynolds number increases will be shown in § 3.2.1 to be caused by reattachment of the separated turbulent shear layer and formation of an LSB on the suction surface. There is a notably greater variation in the timing of the step-like increase in lift during reattachment compared with the rapid decrease in lift during stall, and the variation is greater for the aerofoil (figures 9
a and 9
c) than for the wing (figures 9
b and 9
d). The standard deviations of
$D-D_{\textrm {sr}}=0$
for both types of changes in operating conditions. The step-like increase in lift that occurs for downward pitching motions and Reynolds number increases will be shown in § 3.2.1 to be caused by reattachment of the separated turbulent shear layer and formation of an LSB on the suction surface. There is a notably greater variation in the timing of the step-like increase in lift during reattachment compared with the rapid decrease in lift during stall, and the variation is greater for the aerofoil (figures 9
a and 9
c) than for the wing (figures 9
b and 9
d). The standard deviations of $\Delta D_{{react}}$
for the pitching motions of the aerofoil and wing are
$\Delta D_{{react}}$
for the pitching motions of the aerofoil and wing are $67$
and
$67$
and $9$
, respectively. For the increase in Reynolds number, the standard deviations of
$9$
, respectively. For the increase in Reynolds number, the standard deviations of $\Delta D_{{react}}$
for the aerofoil and wing are
$\Delta D_{{react}}$
for the aerofoil and wing are $55$
and
$55$
and $10$
, respectively. The greater variability in the onset of the lift increase for the aerofoil than the wing was hypothesised to be related to the closer proximity of the aerofoil reattachment angle of attack to the final angle of attack during downward pitching motions than for the wing (figure 6). To test this hypothesis, pitching runs were also performed between
$10$
, respectively. The greater variability in the onset of the lift increase for the aerofoil than the wing was hypothesised to be related to the closer proximity of the aerofoil reattachment angle of attack to the final angle of attack during downward pitching motions than for the wing (figure 6). To test this hypothesis, pitching runs were also performed between $\alpha = 9^\circ$
and
$\alpha = 9^\circ$
and $14^\circ$
. In those runs, discussed in more detail in § 3.4, the timing of the onset of the step changes in lift for both models was less variable, supporting this hypothesis. The variation in timing of the lift response and its relationship to pitch rate is quantified in § 3.5. Regardless of the precise timing of the lift recovery, the rate of change of the lift coefficient as the final limiting state is approached remains relatively consistent between runs. Therefore, to obtain ensemble flow-field statistics that reflect LSB formation and bursting dynamics, the ensemble statistics presented in the following section were computed after shifting the measurements from each run by
$14^\circ$
. In those runs, discussed in more detail in § 3.4, the timing of the onset of the step changes in lift for both models was less variable, supporting this hypothesis. The variation in timing of the lift response and its relationship to pitch rate is quantified in § 3.5. Regardless of the precise timing of the lift recovery, the rate of change of the lift coefficient as the final limiting state is approached remains relatively consistent between runs. Therefore, to obtain ensemble flow-field statistics that reflect LSB formation and bursting dynamics, the ensemble statistics presented in the following section were computed after shifting the measurements from each run by $D_{{mid-step}}$
(defined in § 2.1), so that the step change in lift coefficient was approximately centred in time about
$D_{{mid-step}}$
(defined in § 2.1), so that the step change in lift coefficient was approximately centred in time about $D-D_{{mid-step}}=0$
.
$D-D_{{mid-step}}=0$
.
3.2.1. Laminar separation bubble dynamics
This section focusses on the transient dynamics of the LSB on the suction surface of the aerofoil whose bursting and formation are linked to the step-changes in transient lift coefficients. The evolution of the streamwise LSB structure on the wing is similar to that of the aerofoil and is omitted for brevity. A comparison of the flow-field development leading to LSB bursting on the aerofoil for a pitching motion and Reynolds number change of duration of approximately $75c/u_\infty$
is facilitated by the streamwise velocity and instantaneous spanwise vorticity (
$75c/u_\infty$
is facilitated by the streamwise velocity and instantaneous spanwise vorticity ( $\omega_z$
) fields presented in figures 10 and 11, respectively. The presented ensemble-average streamwise velocity fields have been averaged over a sliding temporal window of one convective time unit for better statistical convergence. Flow-fields are shown for the LSB at
$\omega_z$
) fields presented in figures 10 and 11, respectively. The presented ensemble-average streamwise velocity fields have been averaged over a sliding temporal window of one convective time unit for better statistical convergence. Flow-fields are shown for the LSB at $ (D-D_{{mid-step}} )/\Delta D_{{step}}=-1$
,
$ (D-D_{{mid-step}} )/\Delta D_{{step}}=-1$
, $-0.5$
,
$-0.5$
, $0$
,
$0$
, $0.5$
and
$0.5$
and $1$
in panels (a)–(e), respectively. These times correspond to flow conditions prior to, at the beginning of, in the middle of, at the end of and after the step change in lift coefficient, respectively. The full time-series of the flow field measurements are available in supplementary movies 1 and 2, respectively, available at https://doi.org/10.1017/jfm.2025.348.
$1$
in panels (a)–(e), respectively. These times correspond to flow conditions prior to, at the beginning of, in the middle of, at the end of and after the step change in lift coefficient, respectively. The full time-series of the flow field measurements are available in supplementary movies 1 and 2, respectively, available at https://doi.org/10.1017/jfm.2025.348.
Ensemble-averaged lift coefficient and angle of attack (top panel), streamwise velocity (middle row) and instantaneous spanwise vorticity (bottom row) contours from side-view PIV for $\dot {\alpha }c/(2u_\infty ) = 3\times 10^{-4}$
. Shaded areas indicate uncertainty (95 % confidence). Full time-series available in supplementary movie 1.
$\dot {\alpha }c/(2u_\infty ) = 3\times 10^{-4}$
. Shaded areas indicate uncertainty (95 % confidence). Full time-series available in supplementary movie 1.
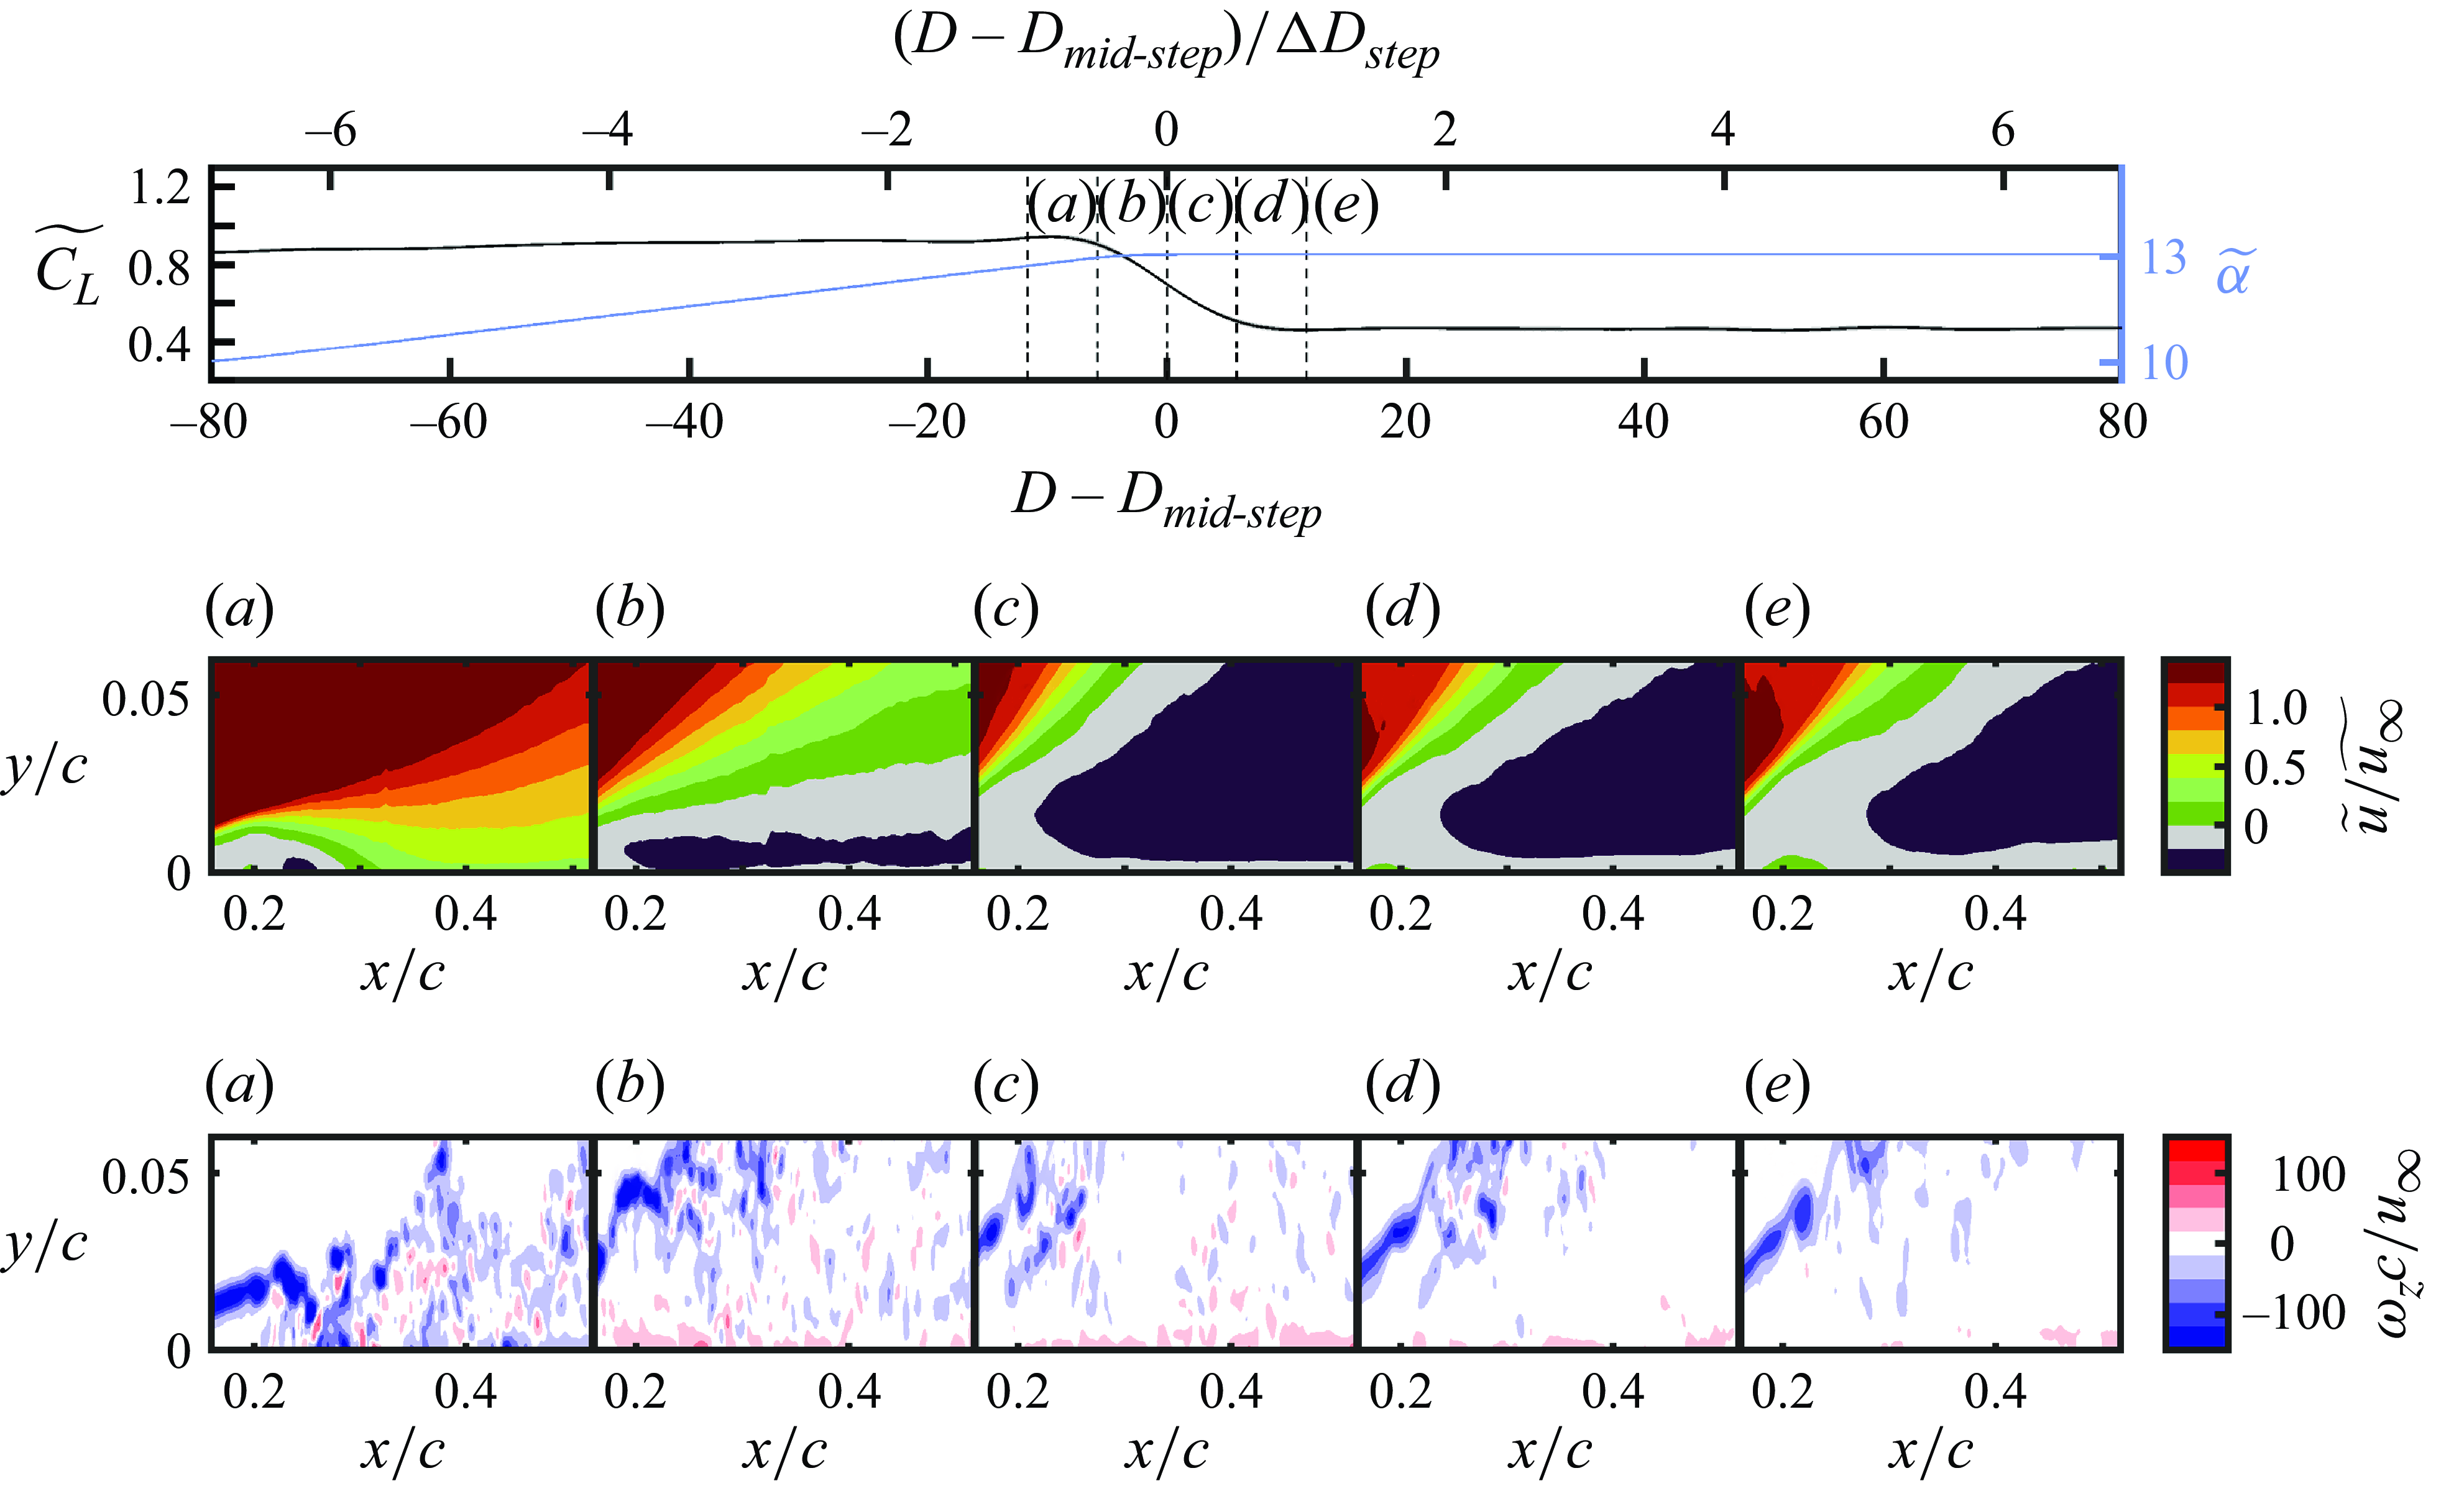
Ensemble-averaged lift coefficient and Reynolds number (top panel), streamwise velocity (middle row) and instantaneous spanwise vorticity (bottom row) contours from side-view PIV for Reynolds number decrease. Shaded areas indicate uncertainty (95 % confidence). Full time-series available in supplementary movie 2.
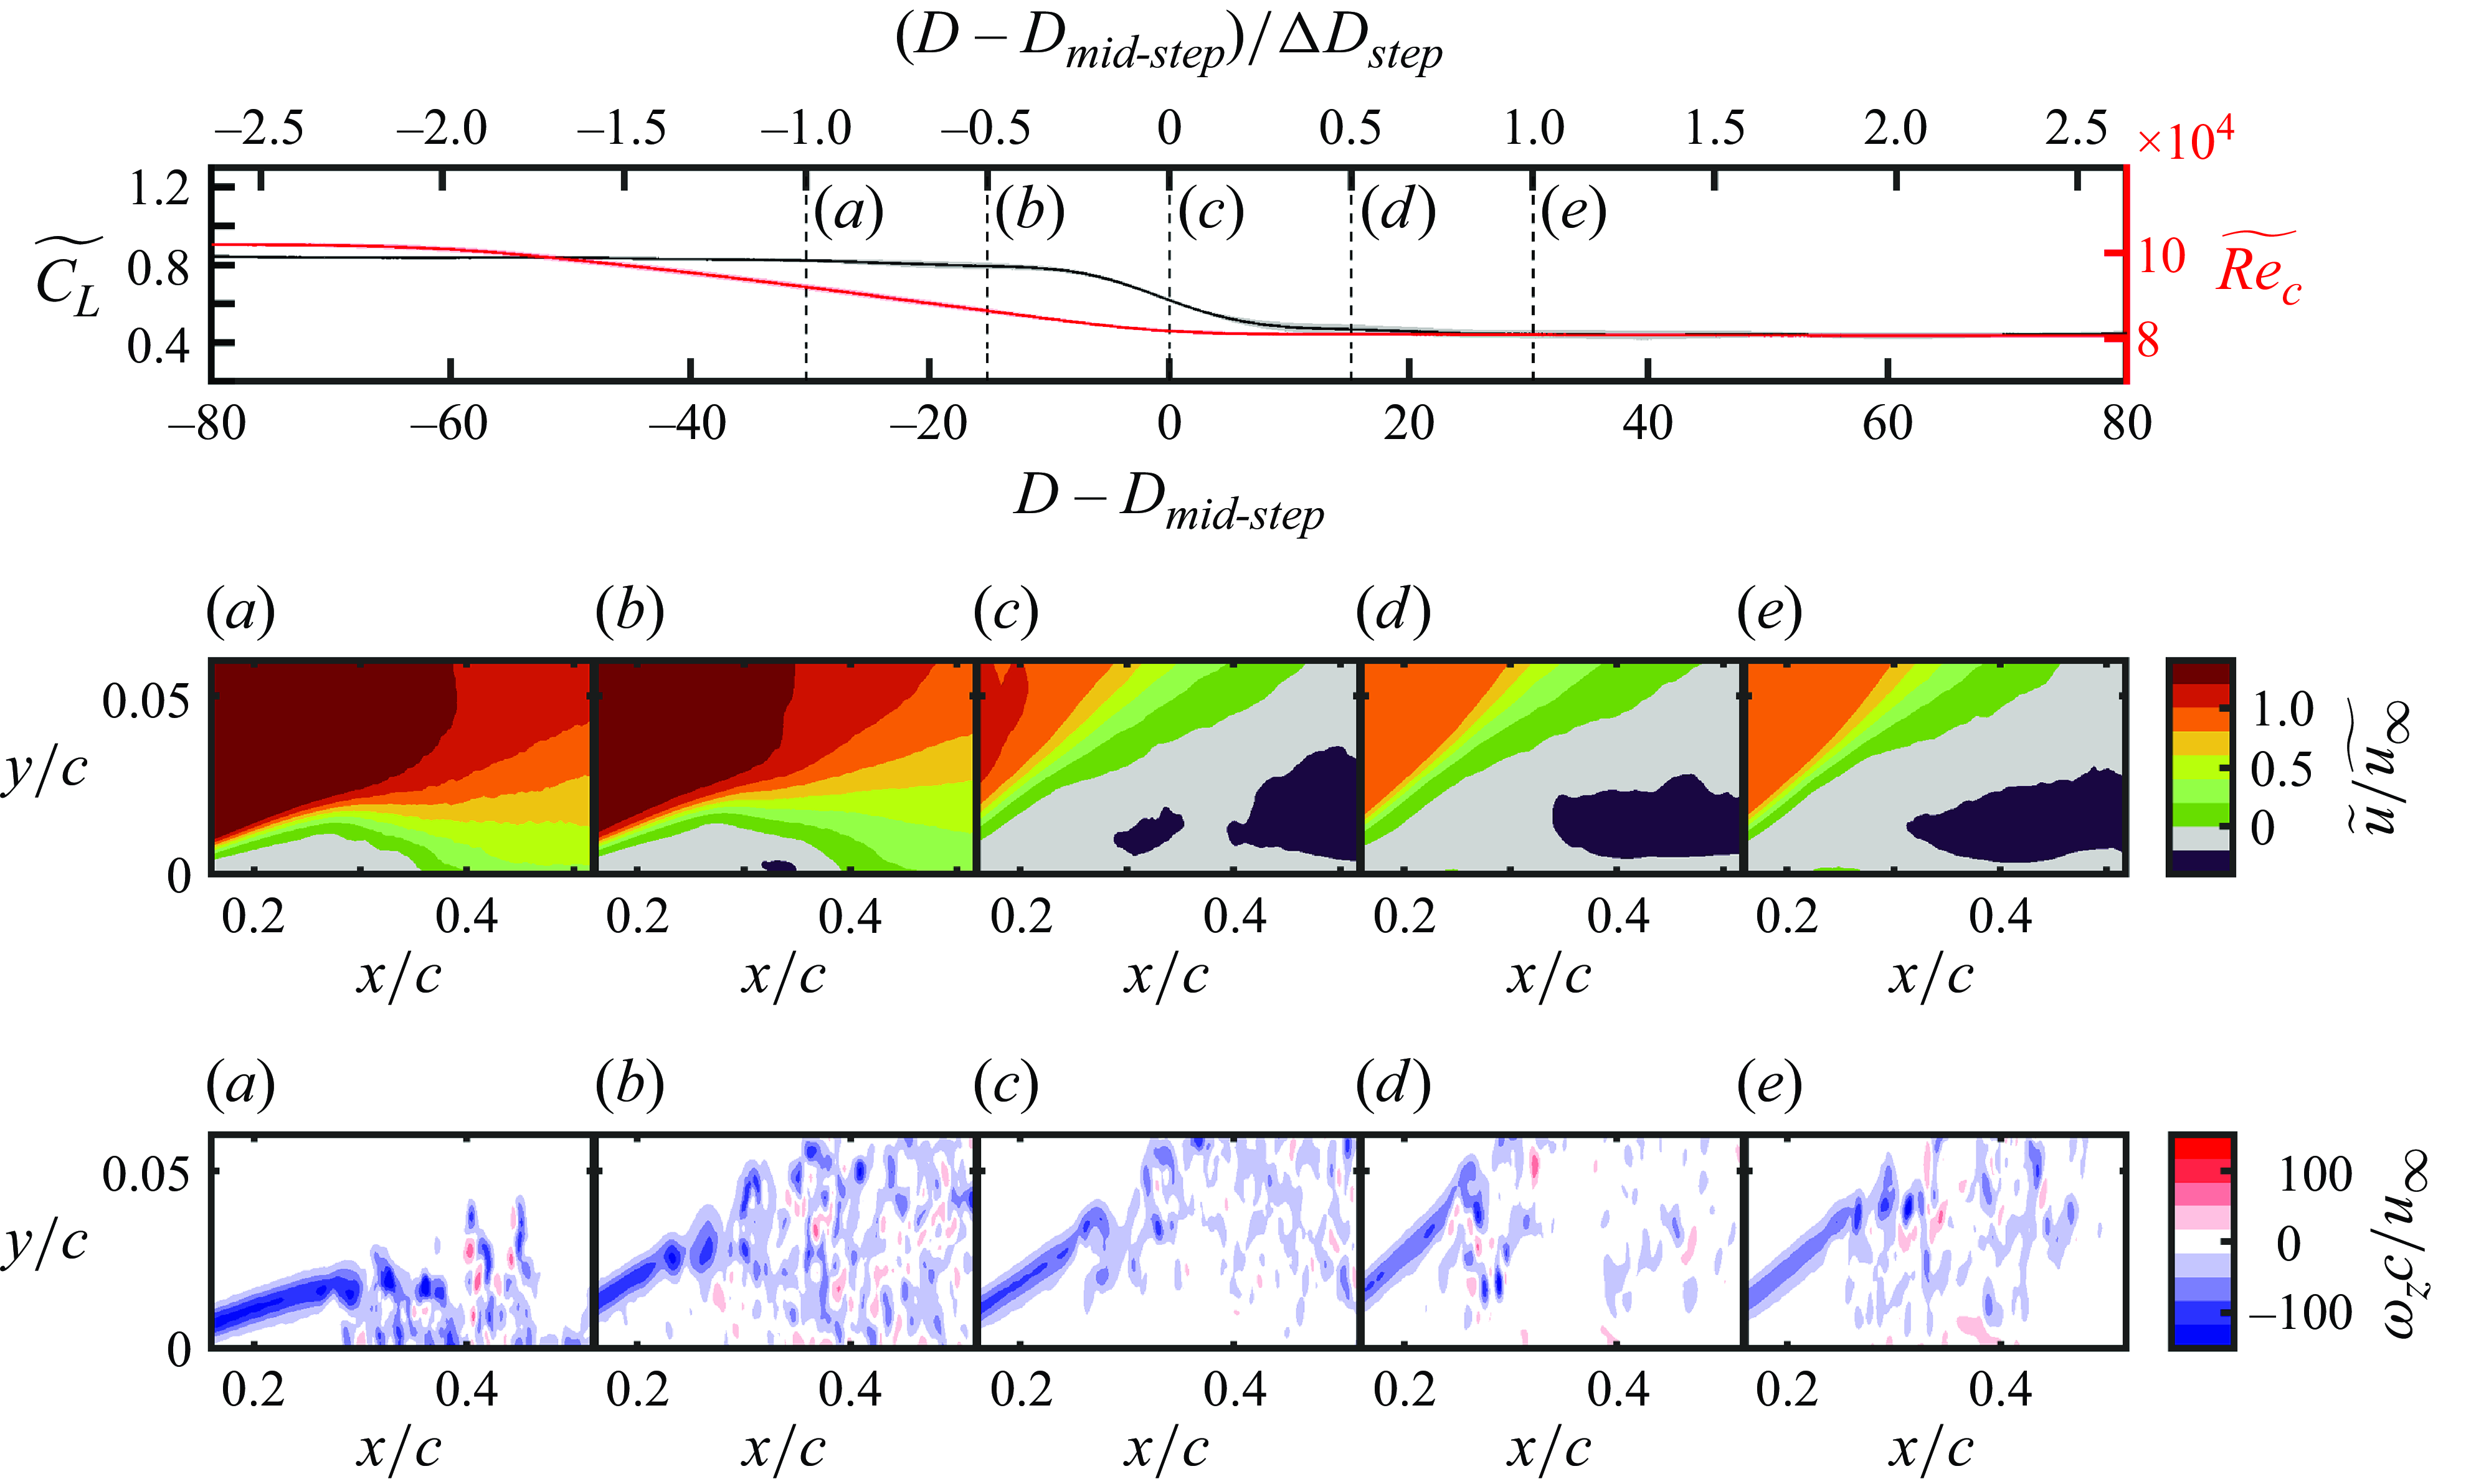
Prior to bursting during the pitching motion at $\dot {\alpha }c/(2u_\infty ) = 3\times 10^{-4}$
(figure 10
a), reattachment occurs at
$\dot {\alpha }c/(2u_\infty ) = 3\times 10^{-4}$
(figure 10
a), reattachment occurs at $x/c\approx 0.30$
, which is upstream of the reattachment location in the initial limiting LSB condition (cf. figure 5
a) because of the stronger adverse pressure gradient at the increased angle of attack. The instantaneous vorticity contours show that the separated laminar shear layer rolls up into vortices at
$x/c\approx 0.30$
, which is upstream of the reattachment location in the initial limiting LSB condition (cf. figure 5
a) because of the stronger adverse pressure gradient at the increased angle of attack. The instantaneous vorticity contours show that the separated laminar shear layer rolls up into vortices at $x/c\approx 0.2$
. When the loss of lift begins (figure 10
b), reattachment no longer occurs, leading to massive separation. The instantaneous vorticity contours indicate vortex roll-up occurring upstream of the field of view at this time. As the lift coefficient continues to decrease, the wall-normal extent of the reverse flow region increases (figure 10
c).
$x/c\approx 0.2$
. When the loss of lift begins (figure 10
b), reattachment no longer occurs, leading to massive separation. The instantaneous vorticity contours indicate vortex roll-up occurring upstream of the field of view at this time. As the lift coefficient continues to decrease, the wall-normal extent of the reverse flow region increases (figure 10
c).
In contrast to the pitching transient, the evolution of the LSB structure during the reduction in Reynolds number begins with a downstream movement of the reattachment point. When $ (D-D_{{react}} )/\Delta D_{{step}}=-1$
(figure 11
a), reattachment occurs at
$ (D-D_{{react}} )/\Delta D_{{step}}=-1$
(figure 11
a), reattachment occurs at $x/c\approxeq 0.36$
, which is downstream of its location in the initial flow because of the delay in transition at the reduced Reynolds number. Reattachment persists, and the LSB continues to increase in length and thickness as the lift coefficient begins to decrease more rapidly at
$x/c\approxeq 0.36$
, which is downstream of its location in the initial flow because of the delay in transition at the reduced Reynolds number. Reattachment persists, and the LSB continues to increase in length and thickness as the lift coefficient begins to decrease more rapidly at $ (D-D_{{mid-step}} )/\Delta D_{{step}} = -0.5$
(figure 11
b). The instantaneous vorticity field at this time shows that the shear layer roll-up location is farther from the aerofoil surface than previously. At the middle of the drop of the lift coefficient (figure 11
c), reattachment no longer occurs and there is massive separation over the suction surface of the aerofoil. For the reduction in Reynolds number, the location of shear layer roll-up in the stalled flow is farther downstream than for the increase in angle of attack, consistent with the expected reduction in the convective growth rates of disturbances at lower Reynolds numbers (Schmid & Henningson Reference Schmid and Henningson2001).
$ (D-D_{{mid-step}} )/\Delta D_{{step}} = -0.5$
(figure 11
b). The instantaneous vorticity field at this time shows that the shear layer roll-up location is farther from the aerofoil surface than previously. At the middle of the drop of the lift coefficient (figure 11
c), reattachment no longer occurs and there is massive separation over the suction surface of the aerofoil. For the reduction in Reynolds number, the location of shear layer roll-up in the stalled flow is farther downstream than for the increase in angle of attack, consistent with the expected reduction in the convective growth rates of disturbances at lower Reynolds numbers (Schmid & Henningson Reference Schmid and Henningson2001).
Ensemble-averaged lift coefficient and angle of attack (top panel), streamwise velocity (middle row) and instantaneous spanwise vorticity (bottom row) contours from side-view PIV for $\dot {\alpha }c/(2u_\infty ) = -3\times 10^{-4}$
. Shaded areas indicate uncertainty (95 % confidence). Full time-series available in supplementary movie 3.
$\dot {\alpha }c/(2u_\infty ) = -3\times 10^{-4}$
. Shaded areas indicate uncertainty (95 % confidence). Full time-series available in supplementary movie 3.
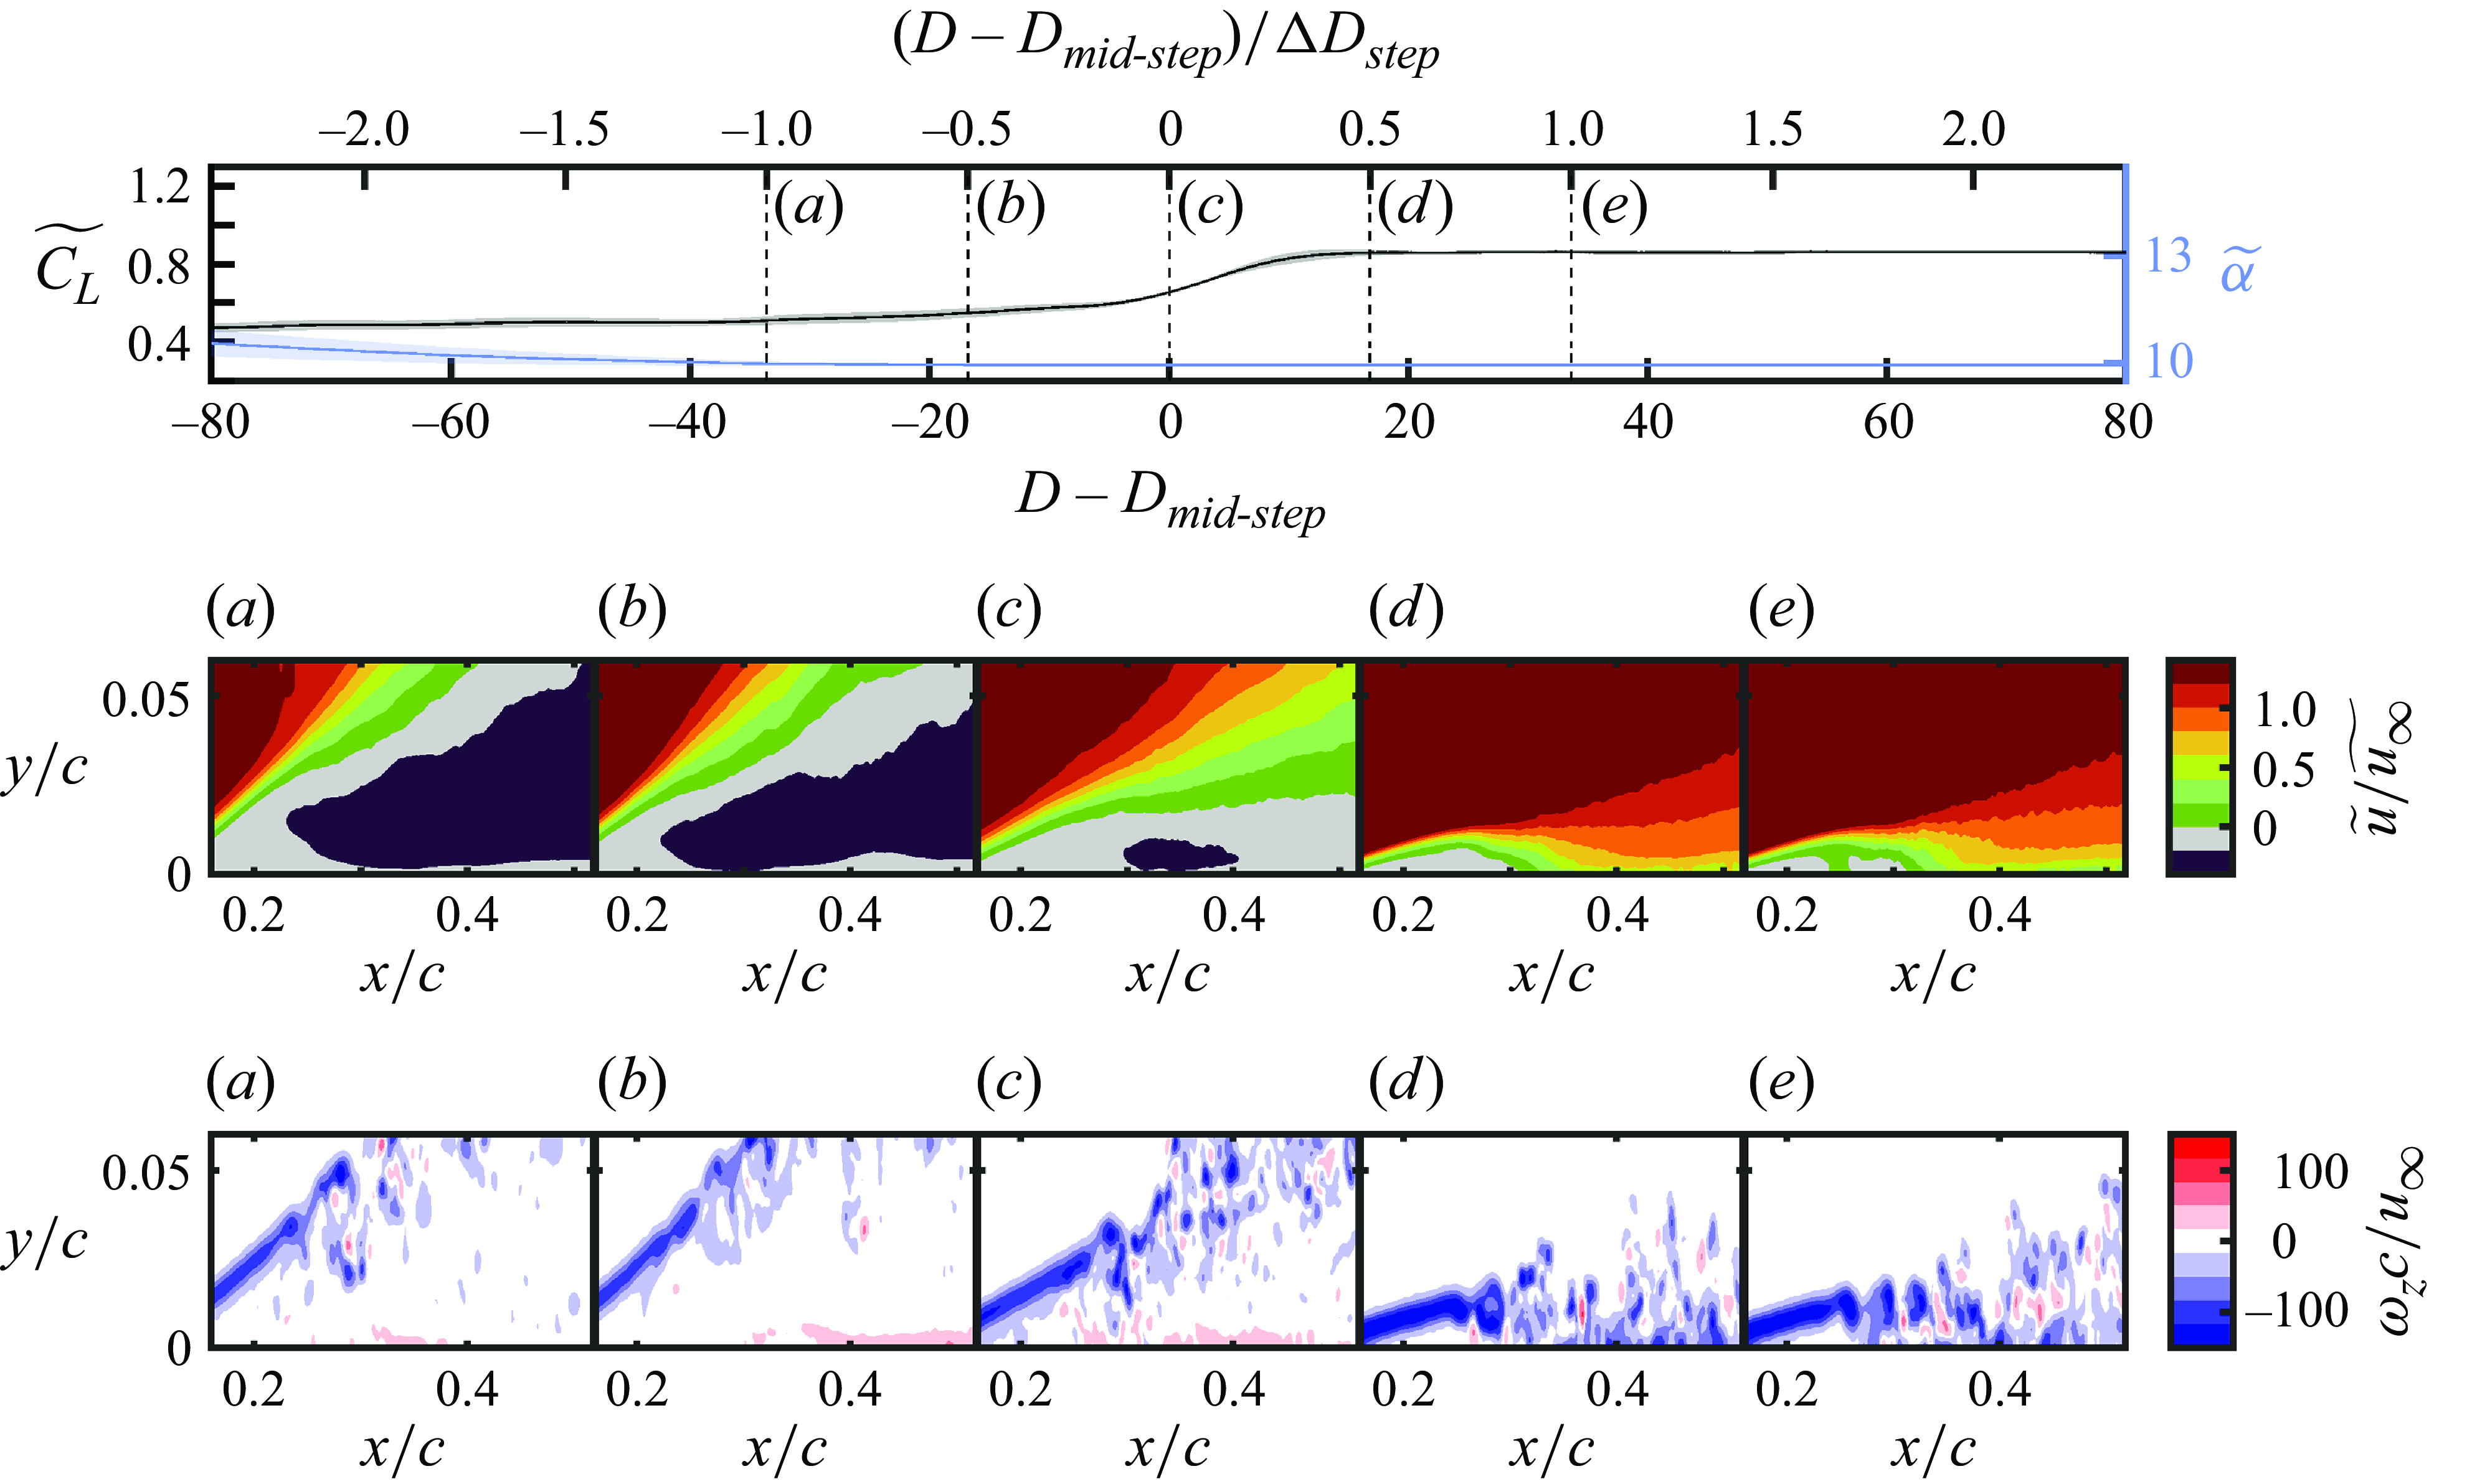
Ensemble-averaged lift coefficient and Reynolds number (top panel), streamwise velocity (middle row) and instantaneous spanwise vorticity (bottom row) contours from side-view PIV for Reynolds number increase. Shaded areas indicate uncertainty (95 % confidence). Full time-series available in supplementary movie 4.
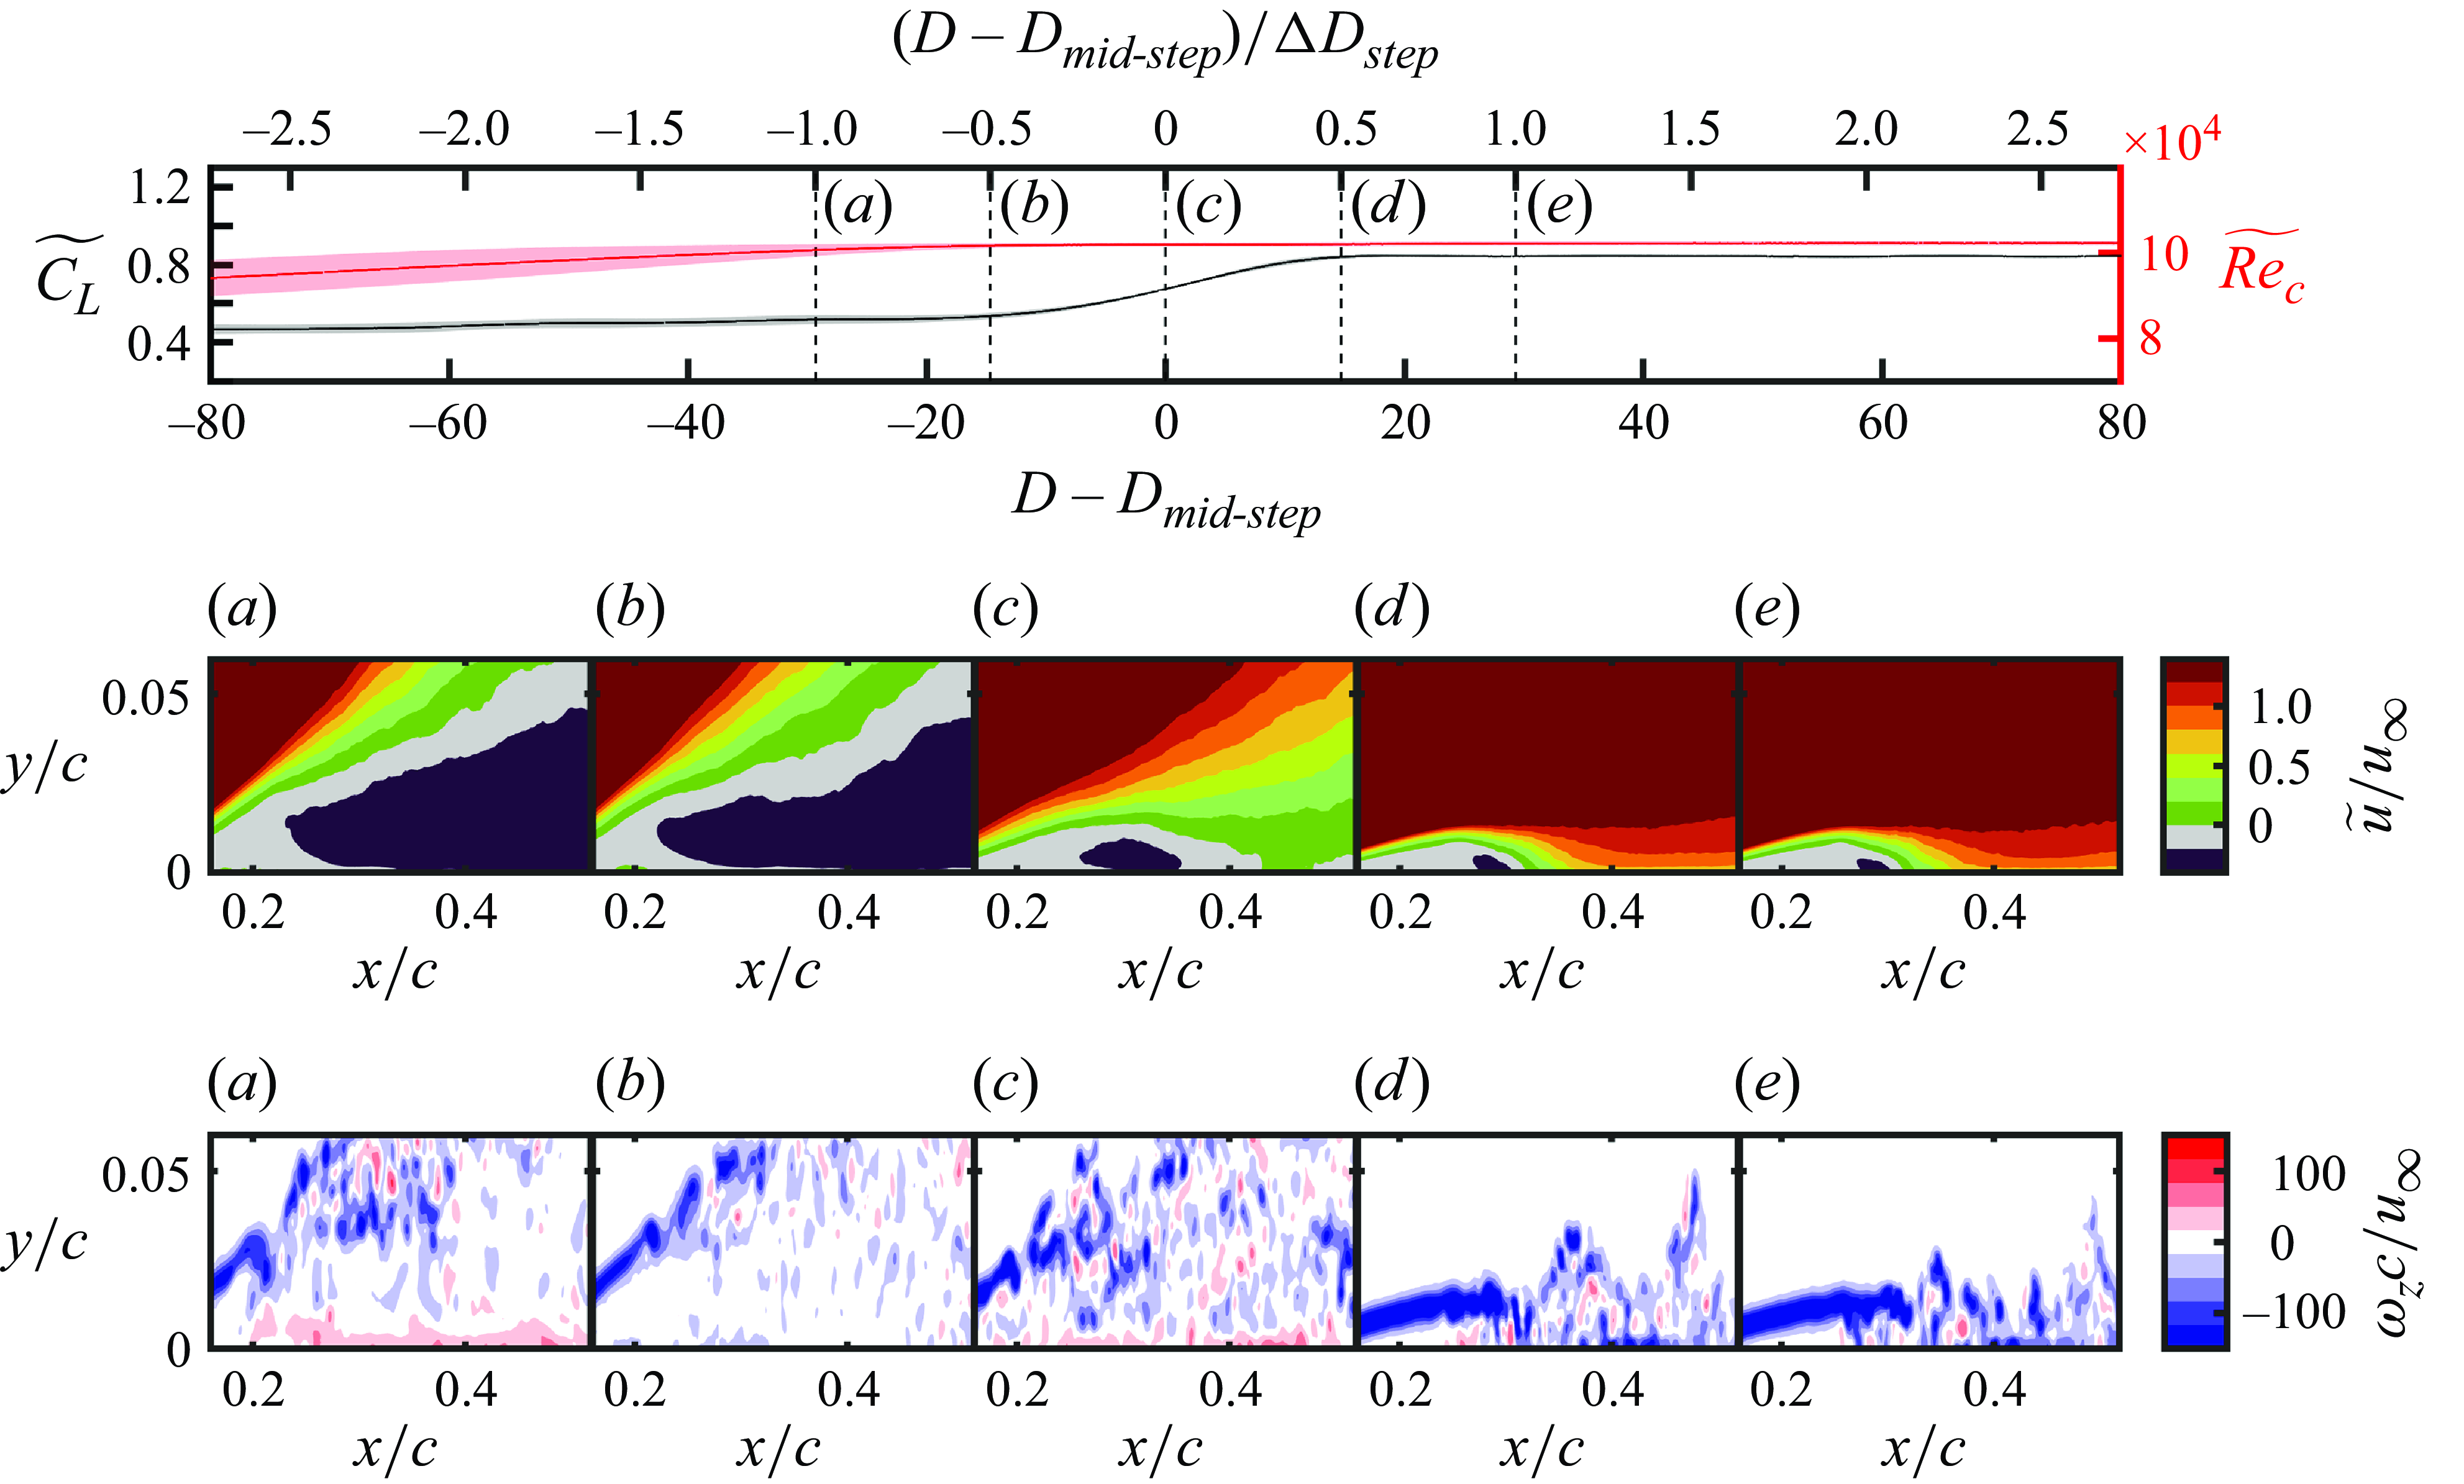
A comparison of the flow-field development leading to LSB formation for a pitch down motion and Reynolds number increase at the same rates but opposite senses as those of figures 10 and 11 is facilitated by the streamwise velocity and instantaneous spanwise vorticity ( $\omega_z$
) fields presented in figures 12 and 13, respectively. The time instants at which ensemble-averaged streamwise velocity and instantaneous vorticity are shown for both transients are defined in the same way as figures 10 and 11 using the shifted and normalised convective time (
$\omega_z$
) fields presented in figures 12 and 13, respectively. The time instants at which ensemble-averaged streamwise velocity and instantaneous vorticity are shown for both transients are defined in the same way as figures 10 and 11 using the shifted and normalised convective time ( $ (D-D_{{mid-step}} )/\Delta D_{{step}}$
). The full time series of the flow field measurements is available in supplementary movies 3 and 4, respectively.
$ (D-D_{{mid-step}} )/\Delta D_{{step}}$
). The full time series of the flow field measurements is available in supplementary movies 3 and 4, respectively.
For the pitch down motion (figure 12), the lift increase can be divided into two distinct periods: an initial slow increase in lift from $ (D-D_{{mid-step}} )/\Delta D_{{step}}=-1$
to
$ (D-D_{{mid-step}} )/\Delta D_{{step}}=-1$
to $0$
followed by a more rapid increase in lift from
$0$
followed by a more rapid increase in lift from $ (D-D_{{mid-step}} )/\Delta D_{{step}}=0$
to
$ (D-D_{{mid-step}} )/\Delta D_{{step}}=0$
to $0.5$
. A comparison of figures 12(a) and 12(b) suggests that the initial slow increase in lift is due to the relatively slow movement of the separated shear layer towards the aerofoil surface. A more rapid lift increase occurs as reattachment begins between
$0.5$
. A comparison of figures 12(a) and 12(b) suggests that the initial slow increase in lift is due to the relatively slow movement of the separated shear layer towards the aerofoil surface. A more rapid lift increase occurs as reattachment begins between $ (D-D_{{mid-step}} )/\Delta D_{{step}}=0$
and
$ (D-D_{{mid-step}} )/\Delta D_{{step}}=0$
and $0.5$
. (figures 12
c and 12
d). After the rapid increase in lift is complete, the size and location of the LSB and the trajectory of the separated shear layer remain largely unchanged (figure 12
e).
$0.5$
. (figures 12
c and 12
d). After the rapid increase in lift is complete, the size and location of the LSB and the trajectory of the separated shear layer remain largely unchanged (figure 12
e).
For the Reynolds number increase (figure 13), the rate of lift increase between $ (D-D_{{mid-step}} )/\Delta D_{{step}}=-1$
(figure 13
a) and
$ (D-D_{{mid-step}} )/\Delta D_{{step}}=-1$
(figure 13
a) and $ (D-D_{{mid-step}} )/\Delta D_{{step}}=-0.5$
(figure 13
a) is less than that for the decrease in angle of attack. However, there is still a relatively small reduction in the size of the reverse flow region during this period. As reattachment begins to occur at
$ (D-D_{{mid-step}} )/\Delta D_{{step}}=-0.5$
(figure 13
a) is less than that for the decrease in angle of attack. However, there is still a relatively small reduction in the size of the reverse flow region during this period. As reattachment begins to occur at $D-D_{{mid-step}}=0$
, the lift coefficient increases more rapidly (figure 13
c). As the flow settles to its final limiting condition, the separated shear layer continues to move towards the aerofoil surface and the reattachment point moves upstream, settling at
$D-D_{{mid-step}}=0$
, the lift coefficient increases more rapidly (figure 13
c). As the flow settles to its final limiting condition, the separated shear layer continues to move towards the aerofoil surface and the reattachment point moves upstream, settling at $x/c=0.31$
(figures 13
d and 13
e). Similar to the downward pitching motion, the LSB remains relatively unchanged after
$x/c=0.31$
(figures 13
d and 13
e). Similar to the downward pitching motion, the LSB remains relatively unchanged after $ (D-D_{{mid-step}} )/\Delta D_{{step}}=0.5$
.
$ (D-D_{{mid-step}} )/\Delta D_{{step}}=0.5$
.
Transient locations of separation, transition and reattachment during (a, c)LSB bursting and (b, d) LSB formation on aerofoil. Shaded areas denote uncertainty (95 % confidence). Markers indicate initial and final limiting conditions.
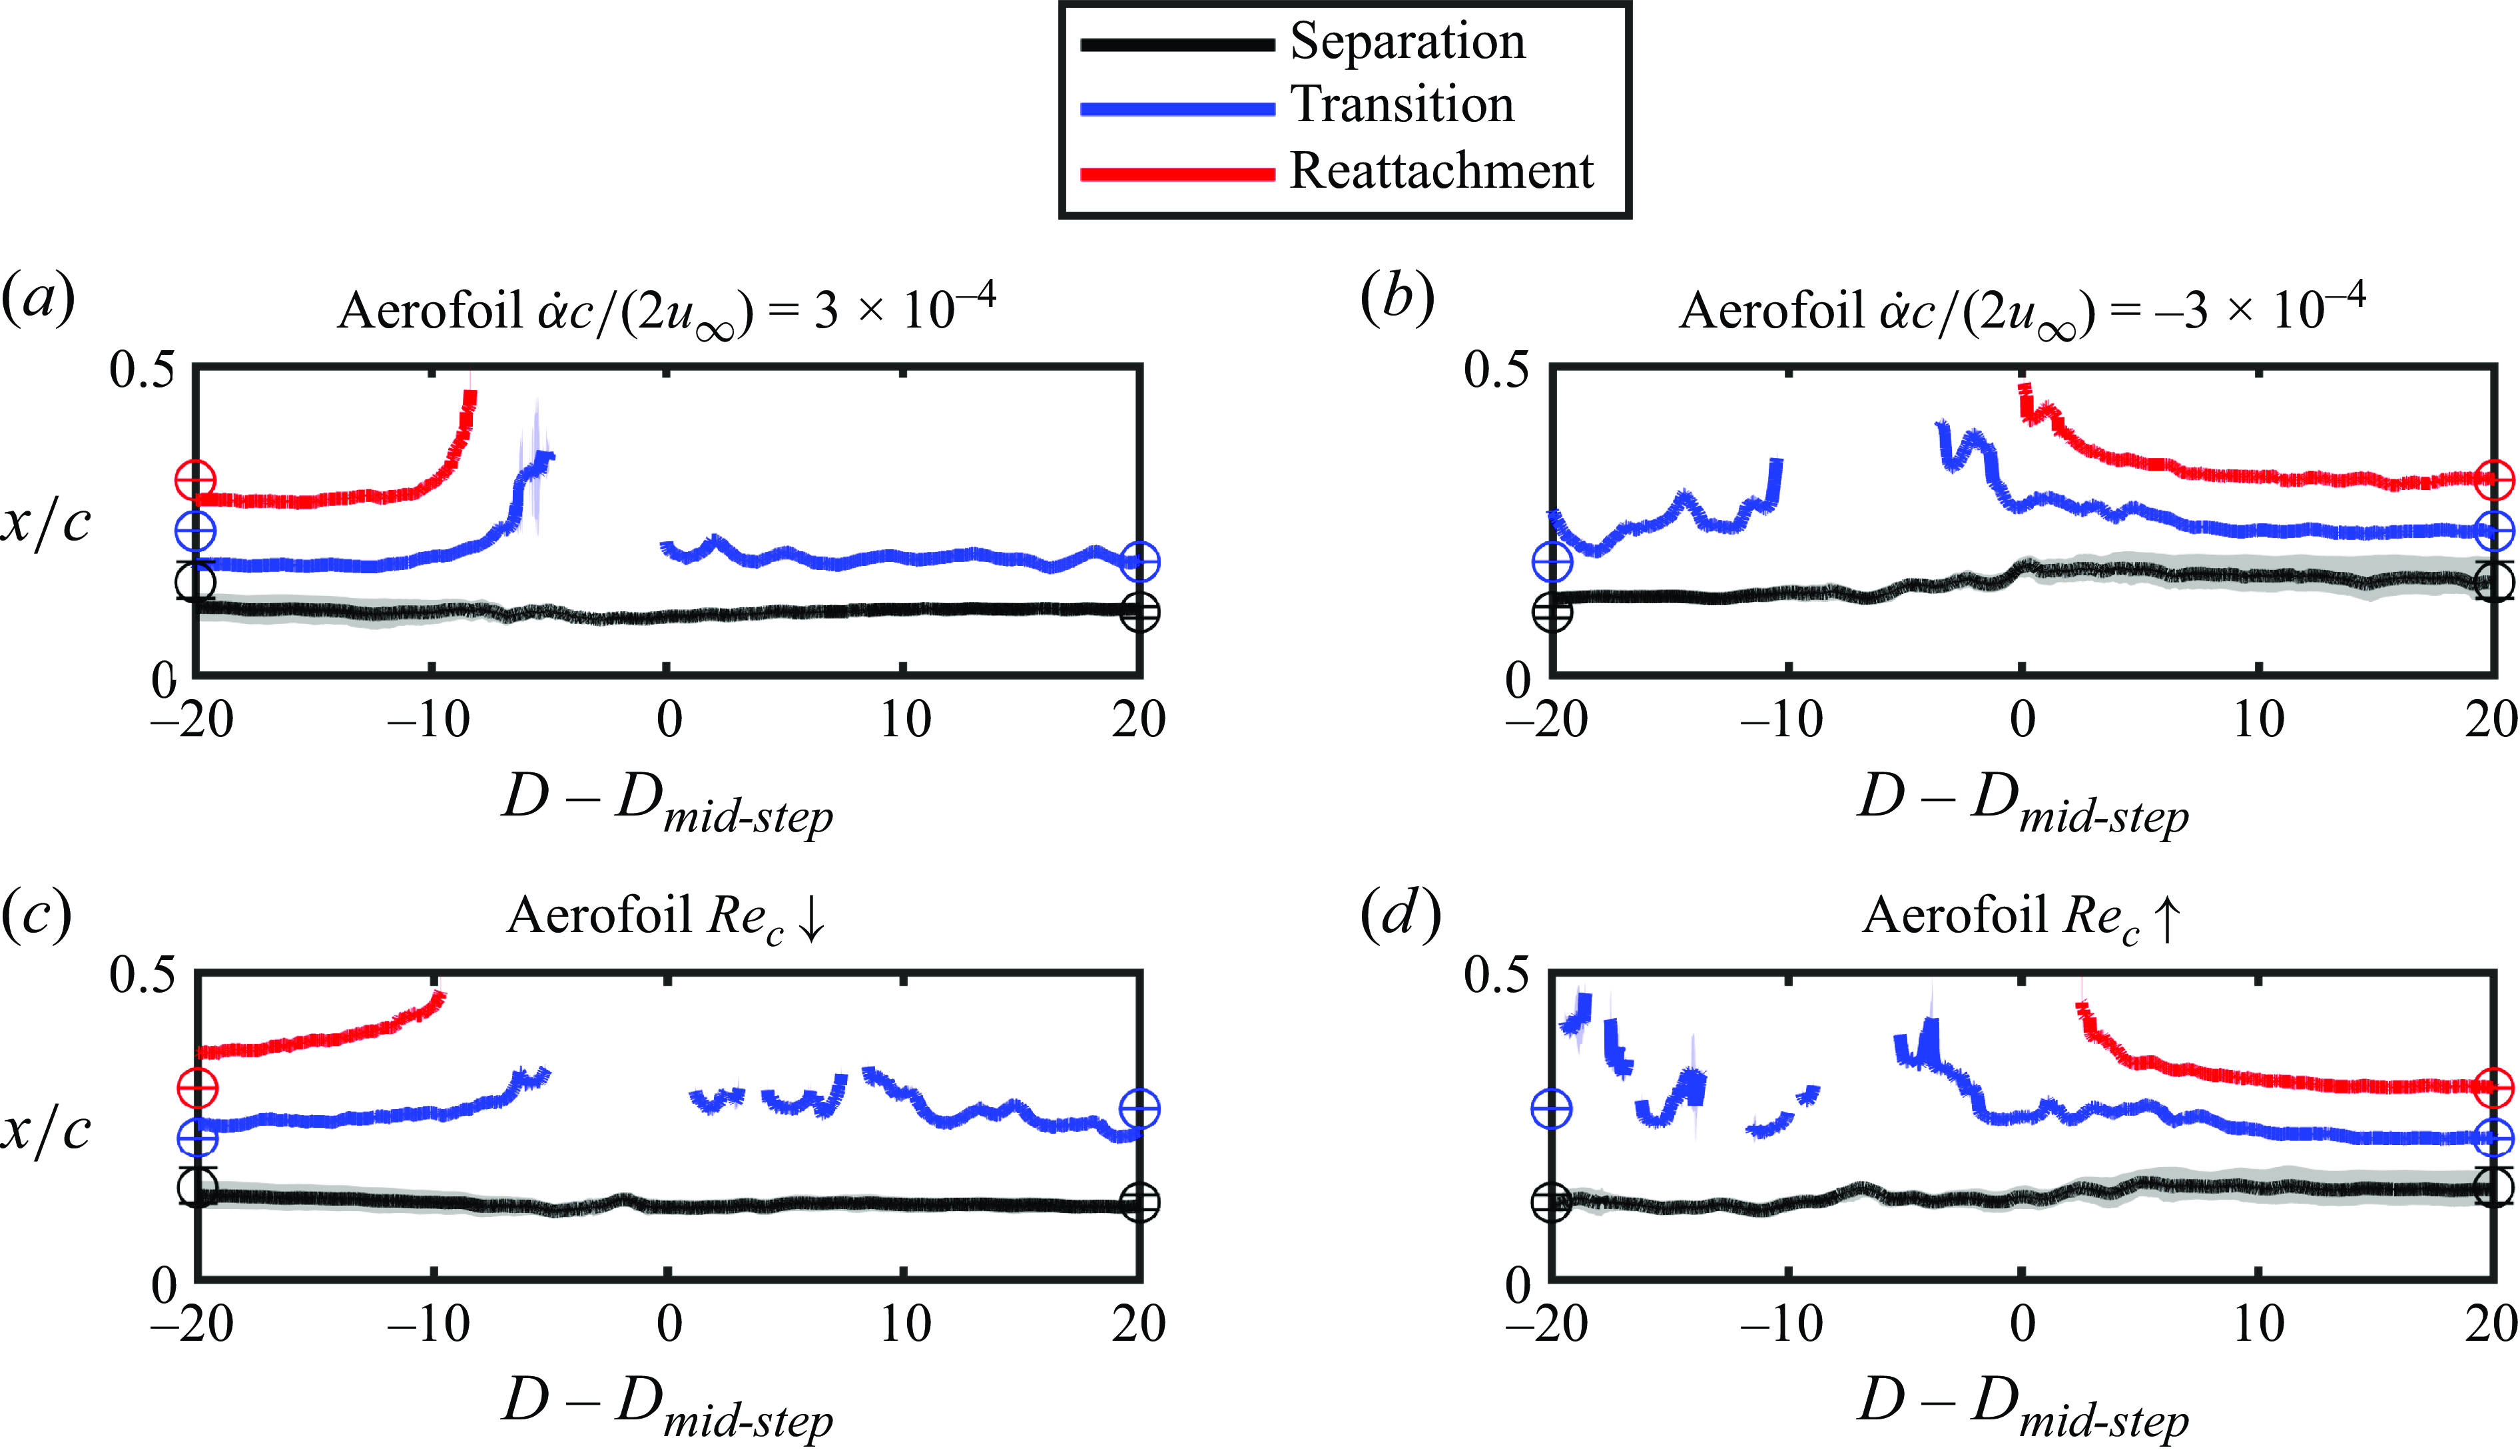
The transient streamwise evolution of the LSB structure on the aerofoil is summarised in figure 14, which presents the laminar separation, transition and turbulent reattachment locations plotted versus the non-dimensional time relative to the middle of the step change in lift coefficient ( $D_{{mid-step}}$
, defined in § 2.1) obtained from the ensemble-averaged side-view PIV measurements at the midspan of the model. The separation and reattachment locations were obtained from the locations where the zero-net-mass flux streamline intersects the aerofoil surface. The relatively large uncertainty in the location of separation is a consequence of the need to extrapolate the zero-net-mass flux line upstream of the side-view PIV field of view to obtain the separation location. Similar to the transition criterion used by Hain et al. (Reference Hain, Kähler and Radespiel2009), the transition location was defined as the location where the Reynolds shear stress at the
$D_{{mid-step}}$
, defined in § 2.1) obtained from the ensemble-averaged side-view PIV measurements at the midspan of the model. The separation and reattachment locations were obtained from the locations where the zero-net-mass flux streamline intersects the aerofoil surface. The relatively large uncertainty in the location of separation is a consequence of the need to extrapolate the zero-net-mass flux line upstream of the side-view PIV field of view to obtain the separation location. Similar to the transition criterion used by Hain et al. (Reference Hain, Kähler and Radespiel2009), the transition location was defined as the location where the Reynolds shear stress at the $y$
coordinate equal to the displacement thickness (
$y$
coordinate equal to the displacement thickness ( $y=\int _{0}^{\delta } (1-u/u_e ){\rm d}y$
, where
$y=\int _{0}^{\delta } (1-u/u_e ){\rm d}y$
, where $\delta$
is the boundary layer thickness and
$\delta$
is the boundary layer thickness and $u_e$
is the boundary layer edge velocity) first exceeds a threshold of
$u_e$
is the boundary layer edge velocity) first exceeds a threshold of $0.001u_{\textrm {e}}^2$
. Gaps in the time series of the transition location are present whenever the transition criterion is not satisfied within the PIV field of view. Because the high-speed PIV recording duration of approximately
$0.001u_{\textrm {e}}^2$
. Gaps in the time series of the transition location are present whenever the transition criterion is not satisfied within the PIV field of view. Because the high-speed PIV recording duration of approximately $80$
convective time units is shorter than the imposed changes in operating conditions, the PIV recordings do not contain the full pitching motion or Reynolds number change. Rather, the PIV recordings were triggered at different times for each type of transient to ensure that
$80$
convective time units is shorter than the imposed changes in operating conditions, the PIV recordings do not contain the full pitching motion or Reynolds number change. Rather, the PIV recordings were triggered at different times for each type of transient to ensure that $D_{{mid-step}}$
was contained in the recordings for each type of transient.
$D_{{mid-step}}$
was contained in the recordings for each type of transient.
For the changes in operating conditions leading to stall (figures 14
a and 14
c), LSB bursting is indicated by the cessation of reattachment at $D-D_{{mid-step}}=-8.4$
and
$D-D_{{mid-step}}=-8.4$
and $-9.7$
, respectively. In the reattaching limiting condition where an LSB forms on the aerofoil, reattachment occurs at
$-9.7$
, respectively. In the reattaching limiting condition where an LSB forms on the aerofoil, reattachment occurs at $x/c=0.32$
. For the pitching motion (figure 14
a), the reattachment point moves upstream of its initial steady-state location as the angle of attack increases before rapidly moving downstream as the LSB bursts. In contrast, the LSB undergoing the decrease in Reynolds number (figure 14
c) undergoes a gradual lengthening prior to bursting. The movement of the transition point during the bursting process largely follows the trend in the reattachment location for each type of change in operating conditions. This is an expected result given that reattachment depends on transition in the separated shear layer. After the rapid downstream movement of the transition location associated with the cessation of reattachment for the pitching motions, the transition location in the stalled flow re-establishes at a location similar to that prior to the rapid expansion of the LSB. The upstream movement of the transition location after LSB bursting is attributed to the reduction in stability of the separated shear layer as its trajectory moves away from the aerofoil surface (Dovgal et al. Reference Dovgal, Kozlov and Michalke1994). Relative to the movements of the transition and reattachment locations, the movement of the separation point during LSB bursting is relatively small.
$x/c=0.32$
. For the pitching motion (figure 14
a), the reattachment point moves upstream of its initial steady-state location as the angle of attack increases before rapidly moving downstream as the LSB bursts. In contrast, the LSB undergoing the decrease in Reynolds number (figure 14
c) undergoes a gradual lengthening prior to bursting. The movement of the transition point during the bursting process largely follows the trend in the reattachment location for each type of change in operating conditions. This is an expected result given that reattachment depends on transition in the separated shear layer. After the rapid downstream movement of the transition location associated with the cessation of reattachment for the pitching motions, the transition location in the stalled flow re-establishes at a location similar to that prior to the rapid expansion of the LSB. The upstream movement of the transition location after LSB bursting is attributed to the reduction in stability of the separated shear layer as its trajectory moves away from the aerofoil surface (Dovgal et al. Reference Dovgal, Kozlov and Michalke1994). Relative to the movements of the transition and reattachment locations, the movement of the separation point during LSB bursting is relatively small.
For the changes in operating conditions leading to reattachment (figures 14
b and 14
d), a similar progression of the separation, transition and reattachment locations is observed for both types of transient changes in operating conditions. The reattachment process consists of a gradual downstream movement of the separation point, and a gradual upstream movement of the transition point that begins near $D_{{mid-step}}$
and is followed by the initiation and gradual upstream movement of reattachment.
$D_{{mid-step}}$
and is followed by the initiation and gradual upstream movement of reattachment.
Contours of ensemble-averaged Reynolds shear stress during (a, c) LSB bursting and (b, d) LSB formation on aerofoil. White line, transition location.
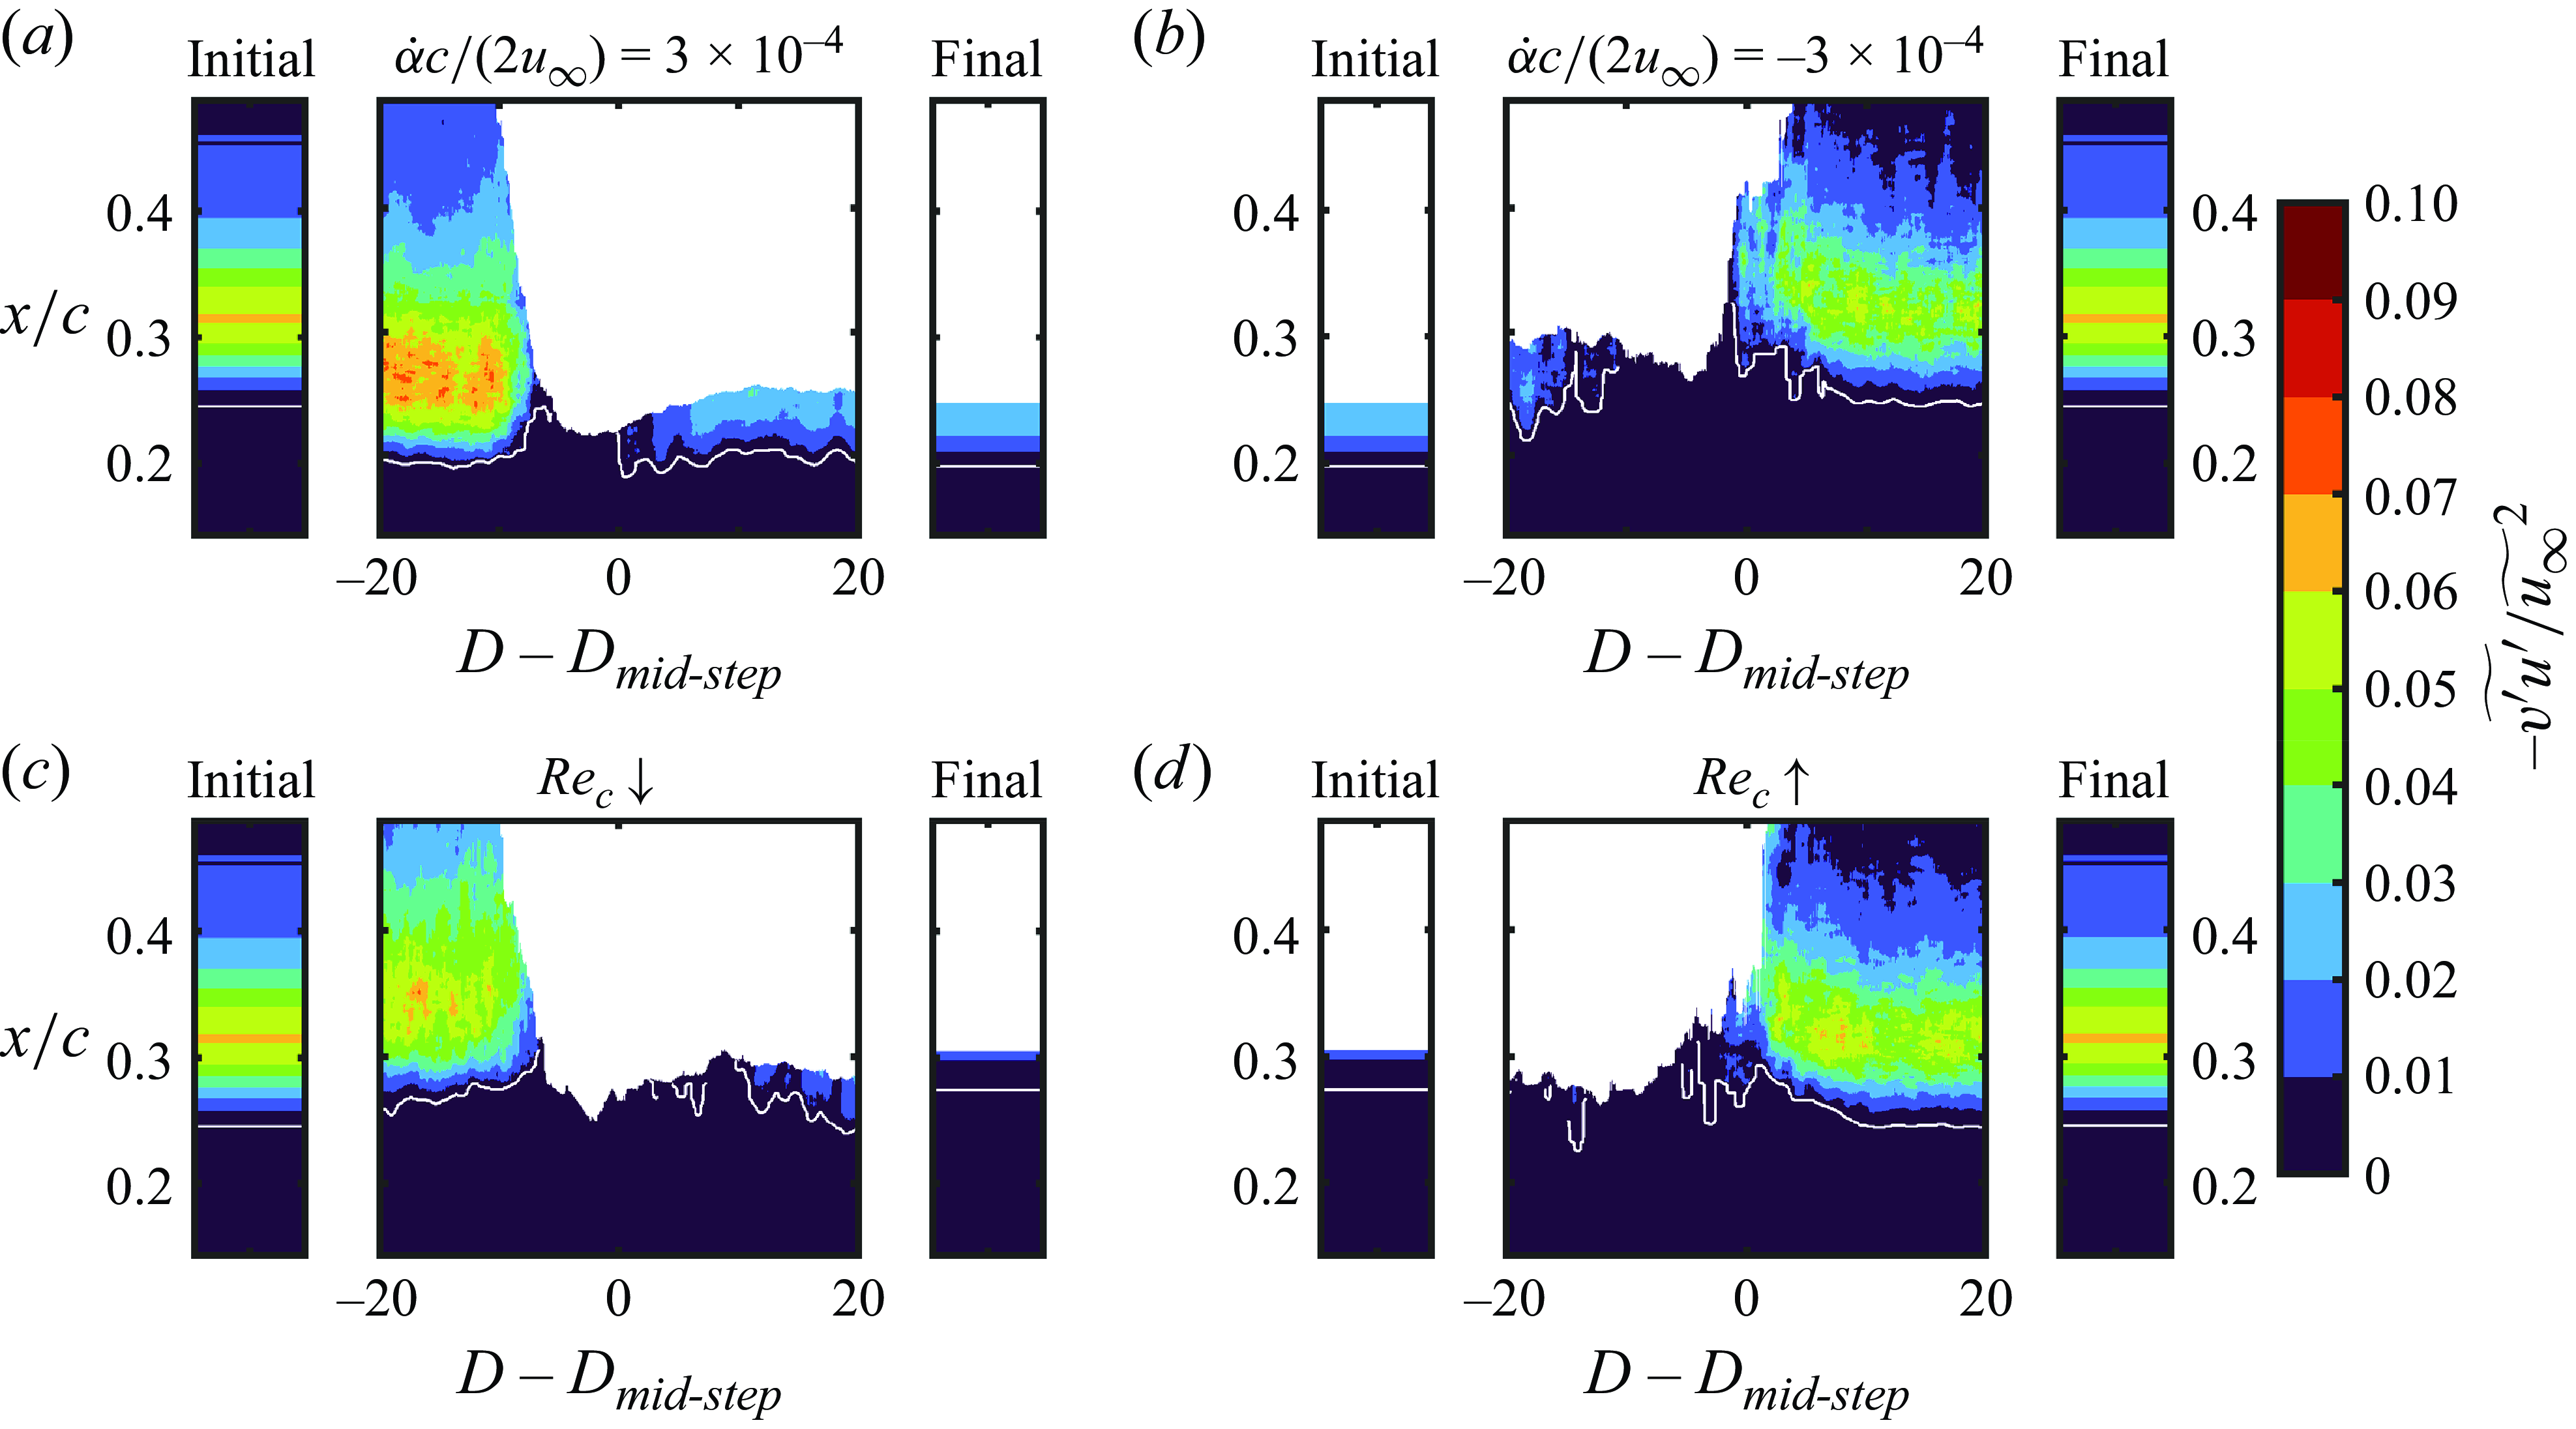
Substantial changes in the transition process are expected to accompany the bifurcation of the flow-field topology during the imposed changes in lifting surface operating conditions. The transition of the separated laminar shear layer is explored in figure 15, where the ensemble-averaged Reynolds shear stress obtained at the $y$
coordinate equal to the displacement thickness is presented for pitching motions at
$y$
coordinate equal to the displacement thickness is presented for pitching motions at $\dot {\alpha }c/(2u_\infty ) = \pm 3\times 10^{-4}$
and for changes in Reynolds number. The streamwise location of the transition criterion
$\dot {\alpha }c/(2u_\infty ) = \pm 3\times 10^{-4}$
and for changes in Reynolds number. The streamwise location of the transition criterion $-\widetilde {u'v'}/u_{\textrm {e}}^2\gt 0.001$
is also plotted for reference with the white line. The Reynolds shear stress measurements for the transients were averaged over a temporal window of one convective time unit. Prior to ensemble-averaging, the data were shifted in time by
$-\widetilde {u'v'}/u_{\textrm {e}}^2\gt 0.001$
is also plotted for reference with the white line. The Reynolds shear stress measurements for the transients were averaged over a temporal window of one convective time unit. Prior to ensemble-averaging, the data were shifted in time by $D_{{mid-step}}$
(defined in § 2.1) so that the step change in lift coefficient occurs at
$D_{{mid-step}}$
(defined in § 2.1) so that the step change in lift coefficient occurs at $D-D_{{mid-step}}=0$
. The initial and final panes in the figure illustrate the streamwise Reynolds shear stress distribution from steady state PIV measurements taken at the operating conditions preceding and following the transients, respectively. The white areas in the plots denote where the displacement thickness is greater than the
$D-D_{{mid-step}}=0$
. The initial and final panes in the figure illustrate the streamwise Reynolds shear stress distribution from steady state PIV measurements taken at the operating conditions preceding and following the transients, respectively. The white areas in the plots denote where the displacement thickness is greater than the $y$
extent of the field of view, and serve to indicate massive separation from the aerofoil. In the limiting LSB state, the largest Reynolds shear stress magnitude occurs at
$y$
extent of the field of view, and serve to indicate massive separation from the aerofoil. In the limiting LSB state, the largest Reynolds shear stress magnitude occurs at $x/c=0.31$
, which corresponds to the location of reattachment (figure 14).
$x/c=0.31$
, which corresponds to the location of reattachment (figure 14).
For the pitching motion leading to LSB bursting (figure 15
a), the upstream movement of transition during the increase in angle of attack is associated with an upstream movement of the location of maximum Reynolds shear stress magnitude. After the LSB moves upstream and contracts, the location of the maximum Reynolds shear stress magnitude remains at a relatively consistent streamwise location prior to LSB bursting. In contrast, during the decrease in Reynolds number (figure 15
c), there is a gradual downstream movement of the location of maximum Reynolds shear stress magnitude prior to cessation of reattachment. For both types of transients leading to LSB bursting, only after the onset of massive separation is there a substantial decrease in the maximum Reynolds shear stress magnitude measured within the PIV field of view. For the transients leading to LSB formation (figures 15
b and 15
d), a substantial increase in the maximum magnitude of Reynolds shear stress coincides with the upstream movement of the reattachment point after $D-D_{{mid-step}}=0$
. The subsequent upstream movement of the location of maximum Reynolds shear stress magnitude is consistent with the upstream movement of the transition point.
$D-D_{{mid-step}}=0$
. The subsequent upstream movement of the location of maximum Reynolds shear stress magnitude is consistent with the upstream movement of the transition point.
The transient Reynolds shear stress contours show that, for an increase in angle of attack, the transition process temporarily settles upstream at an unsustainable location prior to LSB bursting, whereas during a Reynolds number decrease, there is a more gradual downstream movement of the production of turbulent stresses. Although the type of imposed change in operating conditions affects the transition process during LSB bursting, similar trends in the location of maximum Reynolds shear stress magnitude are observed for both types of LSB formation transients investigated.
Contours of ensemble-averaged wavelet amplitude during(a, c) LSB bursting and (b, d) LSB formation on aerofoil.

The transition to turbulence indicated by the production of Reynolds shear stress is fundamentally a consequence of the amplification of disturbances in the separated shear layer. To investigate how the temporal evolution of the frequency band of amplified disturbances in the separated shear layer is affected by the type of imposed transient, a wavelet analysis was performed on velocity fluctuations sampled at the $y$
coordinate equal to the displacement thickness, which approximates the trajectory of the separated shear layer (Boutilier & Yarusevych Reference Boutilier and Yarusevych2012). The wall-normal velocity fluctuations were used for the analysis because they are associated with the convection of roll-up vortices while being less sensitive to shear layer flapping. The wavelet magnitude (
$y$
coordinate equal to the displacement thickness, which approximates the trajectory of the separated shear layer (Boutilier & Yarusevych Reference Boutilier and Yarusevych2012). The wall-normal velocity fluctuations were used for the analysis because they are associated with the convection of roll-up vortices while being less sensitive to shear layer flapping. The wavelet magnitude ( $\widetilde {\Psi _{v'}}$
) scalograms presented in figure 16 are averaged over the ensemble of PIV measurements,
$\widetilde {\Psi _{v'}}$
) scalograms presented in figure 16 are averaged over the ensemble of PIV measurements, $0.14\lt x/c\lt 0.38$
, and a sliding temporal window of one convective time unit. Prior to ensemble-averaging, the data were shifted in time by
$0.14\lt x/c\lt 0.38$
, and a sliding temporal window of one convective time unit. Prior to ensemble-averaging, the data were shifted in time by $D_{{mid-step}}$
(defined in § 2.1) so that the step change in lift coefficient occurs at
$D_{{mid-step}}$
(defined in § 2.1) so that the step change in lift coefficient occurs at $D-D_{{mid-step}}=0$
. The mother wavelet used for the continuous wavelet transform was the Morse wavelet with a symmetry parameter of
$D-D_{{mid-step}}=0$
. The mother wavelet used for the continuous wavelet transform was the Morse wavelet with a symmetry parameter of $3$
and a duration of
$3$
and a duration of $11$
(Lilly & Olhede Reference Lilly and Olhede2012). In the same format as figure 15, the time-average wavelet magnitude scalograms of the initial and final steady-state conditions are also plotted in figure 16. In the LSB limiting state at
$11$
(Lilly & Olhede Reference Lilly and Olhede2012). In the same format as figure 15, the time-average wavelet magnitude scalograms of the initial and final steady-state conditions are also plotted in figure 16. In the LSB limiting state at ${{Re}}_c=1.0\times 10^5$
and
${{Re}}_c=1.0\times 10^5$
and $\alpha = 10^\circ$
, the most amplified frequency is approximately
$\alpha = 10^\circ$
, the most amplified frequency is approximately $fc/u_\infty = 23$
. In the stalled limiting state at
$fc/u_\infty = 23$
. In the stalled limiting state at ${{Re}}_c=1.0\times 10^5$
and
${{Re}}_c=1.0\times 10^5$
and $\alpha = 13^\circ$
, the most amplified frequency decreases to approximately
$\alpha = 13^\circ$
, the most amplified frequency decreases to approximately $fc/u_\infty = 12$
, and in the stalled limiting state at
$fc/u_\infty = 12$
, and in the stalled limiting state at ${{Re}}_c=8.0\times 10^4$
and
${{Re}}_c=8.0\times 10^4$
and $\alpha =10^\circ$
, the most amplified frequency is approximately
$\alpha =10^\circ$
, the most amplified frequency is approximately $fc/u_\infty = 10$
. When non-dimensionalised by the aerofoil projected chord, these frequencies correspond to approximately
$fc/u_\infty = 10$
. When non-dimensionalised by the aerofoil projected chord, these frequencies correspond to approximately $fc\sin \alpha /u_\infty = 4$
,
$fc\sin \alpha /u_\infty = 4$
, $3$
and
$3$
and $2$
, respectively.
$2$
, respectively.
For the pitching motion leading to LSB bursting, there is an increase in the most amplified frequency and a broadening of the band of amplified frequencies prior to the cessation of reattachment. After cessation of reattachment, there is a relatively rapid reduction in disturbance amplitudes and a decrease in the most amplified frequency. In contrast, the band of amplified frequencies remains relatively narrow prior to cessation of reattachment during the Reynolds number decrease. For the transients leading to LSB formation (figures 16 b and 16 d), there is relatively gradual increase in the frequency of the most amplified disturbances prior to initiation of reattachment. Consistent with the foregoing results, the wavelet analysis of wall-normal velocity fluctuations in the separated shear layer demonstrates that the dynamics of LSB bursting depends on the type of imposed change in operating conditions to a greater extent than those of LSB formation.
3.3. Spanwise flow development
The spanwise flow development in each of the limiting flow states for the aerofoil and wing models is illustrated by the instantaneous contours of streamwise velocity in figure 17. Note that the aerofoil model extends across the entire test section to $z/c = 3$
. For the aerofoil and wing models at
$z/c = 3$
. For the aerofoil and wing models at $\alpha = 10^\circ$
and
$\alpha = 10^\circ$
and ${{Re}}_c=1.0\times 10^5$
(figures 17
a and 17
d), the top-view measurement plane is located above the core of the separated shear layer, and spanwise bands of increased streamwise velocity are present in the range of
${{Re}}_c=1.0\times 10^5$
(figures 17
a and 17
d), the top-view measurement plane is located above the core of the separated shear layer, and spanwise bands of increased streamwise velocity are present in the range of $0.2\lesssim X/c\lesssim 0.5$
over the central portion of the models. These bands, which occur when the measurement plane intersects the top halves of vortices shed from the separated laminar shear layer (Istvan et al. Reference Istvan, Kurelek and Yarusevych2018), are evidence of coherent spanwise vortex shedding that is expected to occur when LSBs form on the models (Häggmark et al. Reference Häggmark, Bakchinov and Alfredsson2000). Downstream of
$0.2\lesssim X/c\lesssim 0.5$
over the central portion of the models. These bands, which occur when the measurement plane intersects the top halves of vortices shed from the separated laminar shear layer (Istvan et al. Reference Istvan, Kurelek and Yarusevych2018), are evidence of coherent spanwise vortex shedding that is expected to occur when LSBs form on the models (Häggmark et al. Reference Häggmark, Bakchinov and Alfredsson2000). Downstream of $X/c=0.4$
, these vortices undergo three-dimensional breakdown in the reattached turbulent boundary layer. For
$X/c=0.4$
, these vortices undergo three-dimensional breakdown in the reattached turbulent boundary layer. For $z/c\lesssim 0.4$
, spanwise vortex shedding is suppressed by the three-dimensional flow at the junction between the models and the test section wall. On the wing (figure 17
d), vortex shedding and transition are also suppressed due to downwash from the wing tip vortex for
$z/c\lesssim 0.4$
, spanwise vortex shedding is suppressed by the three-dimensional flow at the junction between the models and the test section wall. On the wing (figure 17
d), vortex shedding and transition are also suppressed due to downwash from the wing tip vortex for $z/c\gt rsim 2.0$
.
$z/c\gt rsim 2.0$
.
Streamwise velocity contours in steady conditions measured by top-view PIV configuration.
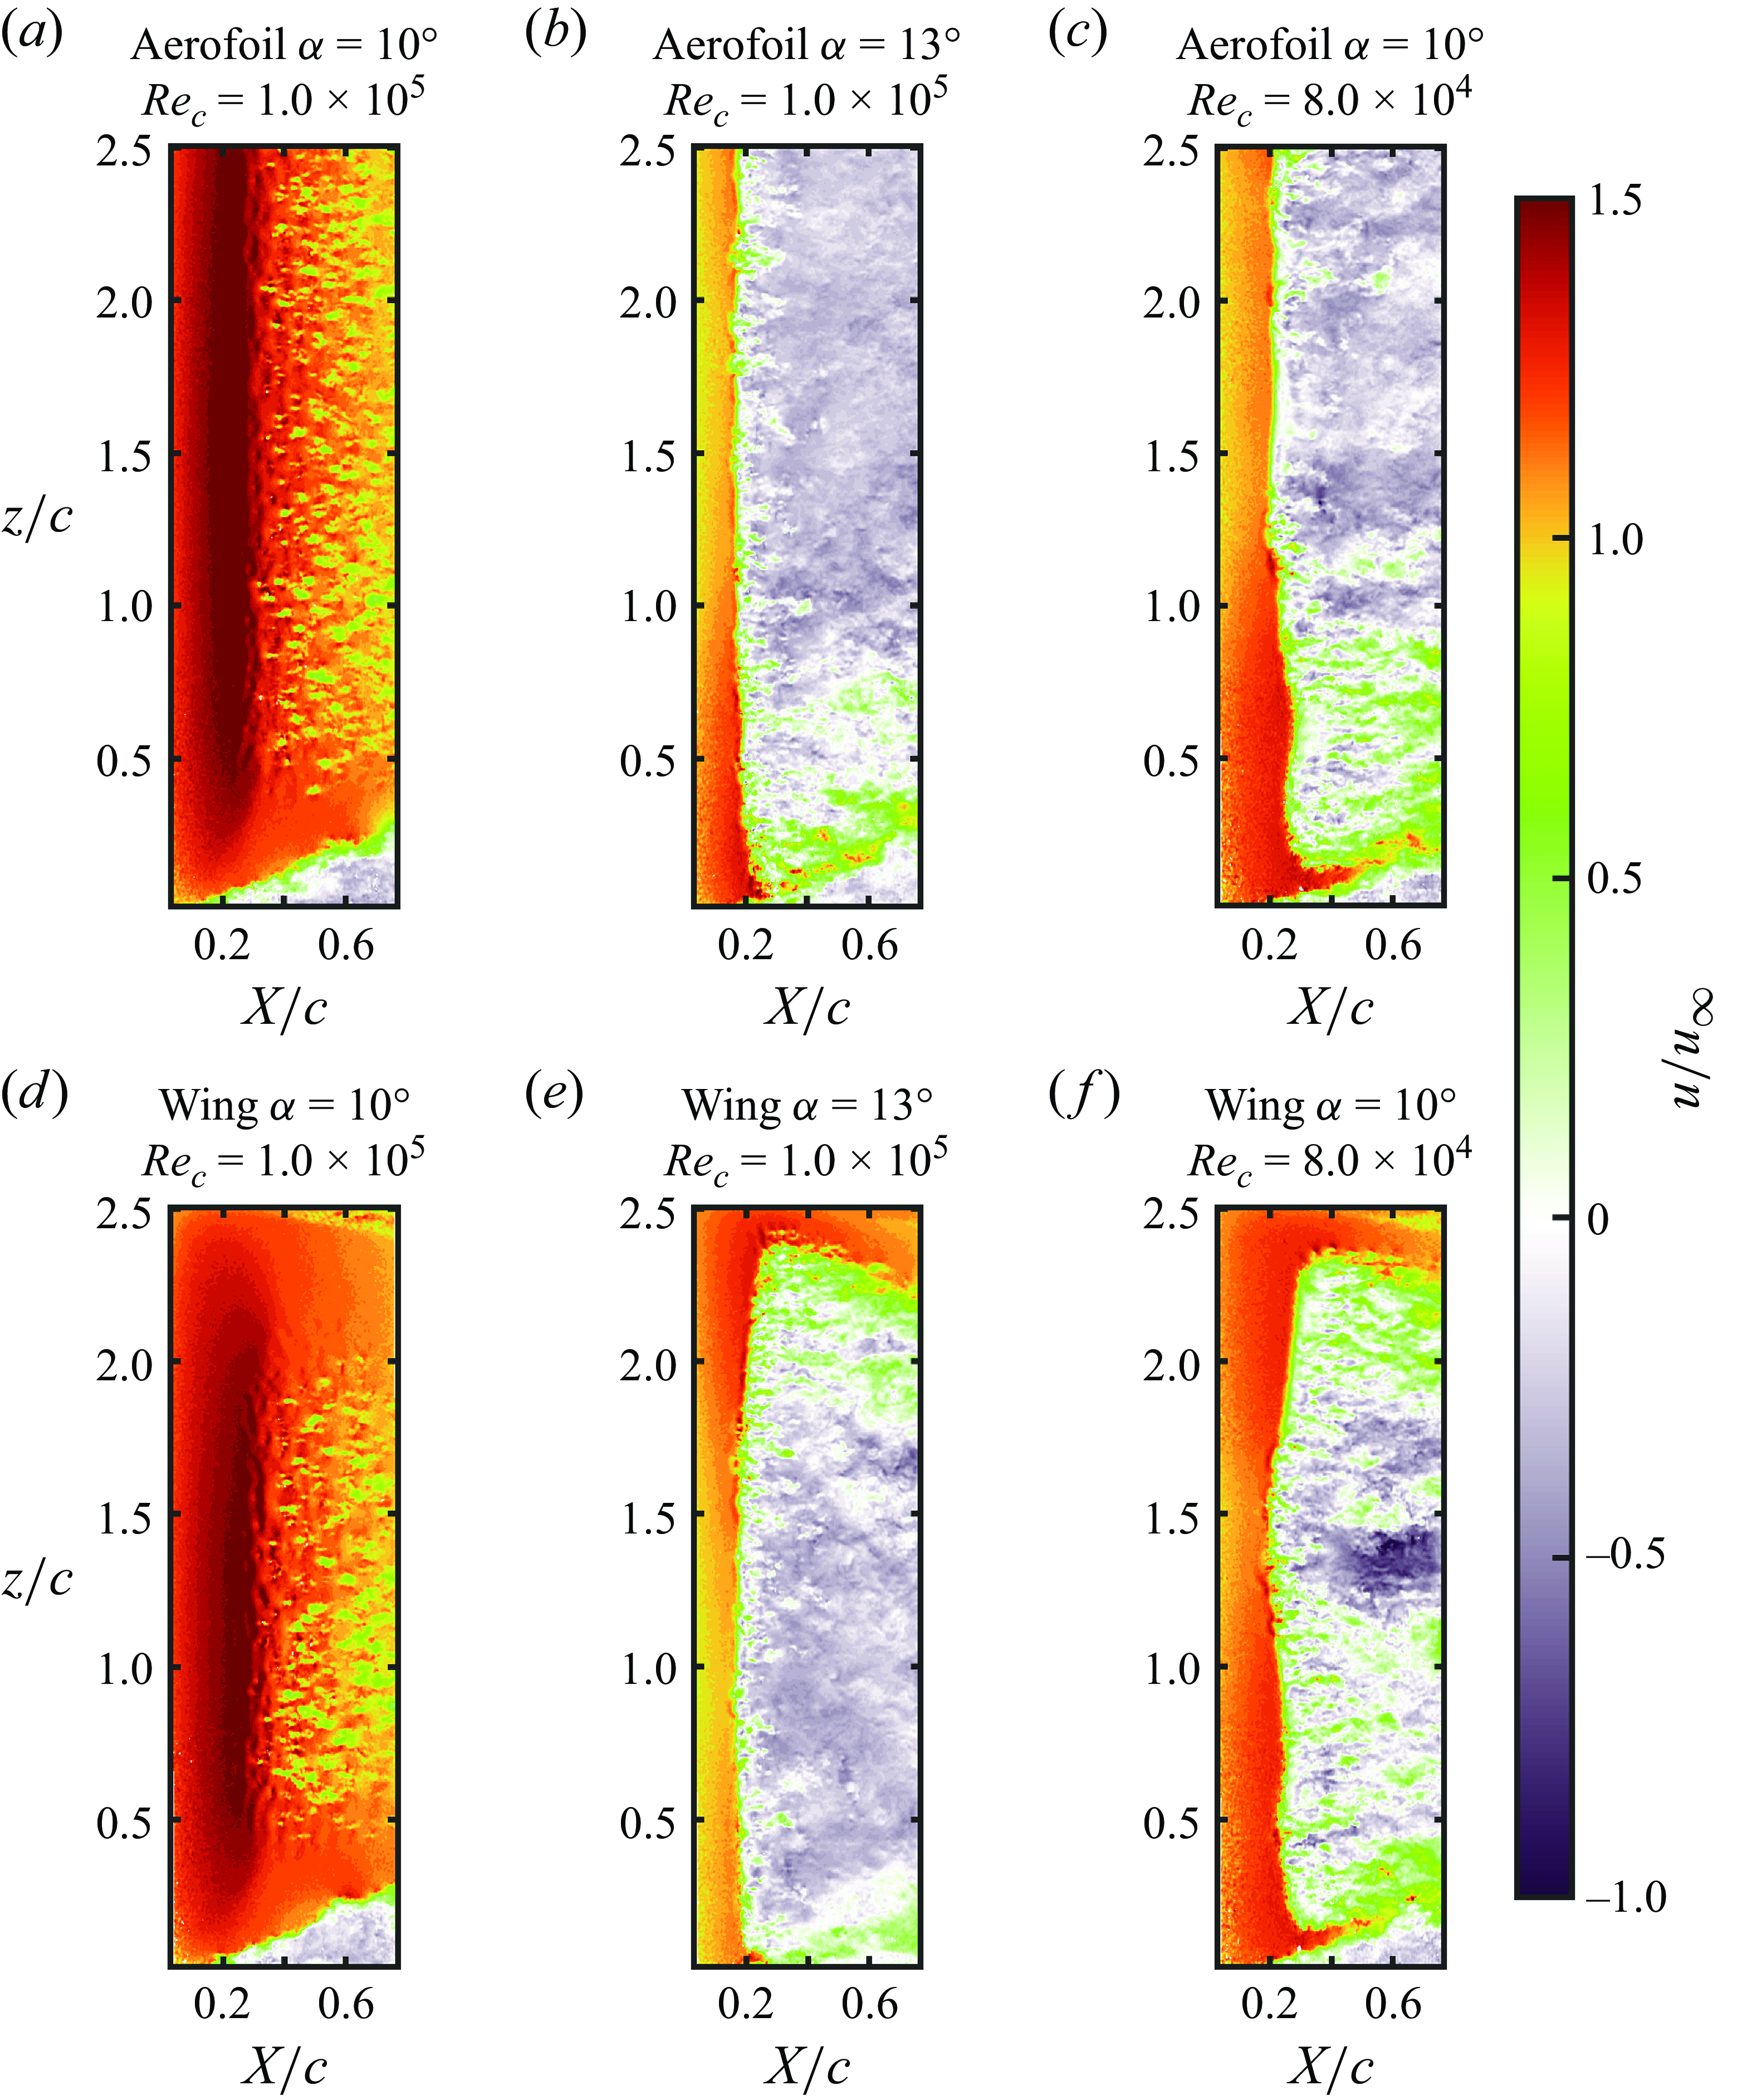
At the higher angle of attack of $\alpha =13^\circ$
(figures 17
b and 17
e), a large region of turbulent reverse flow is observed in the top-view measurements, indicating massive separation from the suction surface of the aerofoil and wing. The stark change in streamwise velocity at
$\alpha =13^\circ$
(figures 17
b and 17
e), a large region of turbulent reverse flow is observed in the top-view measurements, indicating massive separation from the suction surface of the aerofoil and wing. The stark change in streamwise velocity at $X/c\approxeq 0.2$
denotes the location where the core of the separated shear layer intersects the top-view measurement plane. On the wing (figure 17
e), separation is suppressed in the vicinity of the wing tip. The flow development at the lower Reynolds number of
$X/c\approxeq 0.2$
denotes the location where the core of the separated shear layer intersects the top-view measurement plane. On the wing (figure 17
e), separation is suppressed in the vicinity of the wing tip. The flow development at the lower Reynolds number of ${{Re}}_c=8.0\times 10^4$
(figures 17
c and 17
f) is similar to that observed at the higher Reynolds number and angle of attack, except that the velocities in the turbulent separated region are relatively higher, suggesting that the trajectory of the separated shear layer remains closer to the model surface under this condition. For all of the limiting stalled states of the aerofoil and wing, there is an oblique region of higher velocity near the test section wall junction, indicating possible reattachment because of spanwise flow between the corner separation and the central region of massive separation.
${{Re}}_c=8.0\times 10^4$
(figures 17
c and 17
f) is similar to that observed at the higher Reynolds number and angle of attack, except that the velocities in the turbulent separated region are relatively higher, suggesting that the trajectory of the separated shear layer remains closer to the model surface under this condition. For all of the limiting stalled states of the aerofoil and wing, there is an oblique region of higher velocity near the test section wall junction, indicating possible reattachment because of spanwise flow between the corner separation and the central region of massive separation.
Contours of minimum ensemble-averaged streamwise velocity during LSB bursting. Corresponding instantaneous streamwise velocity fields from single runs are available in supplementary movie 5.
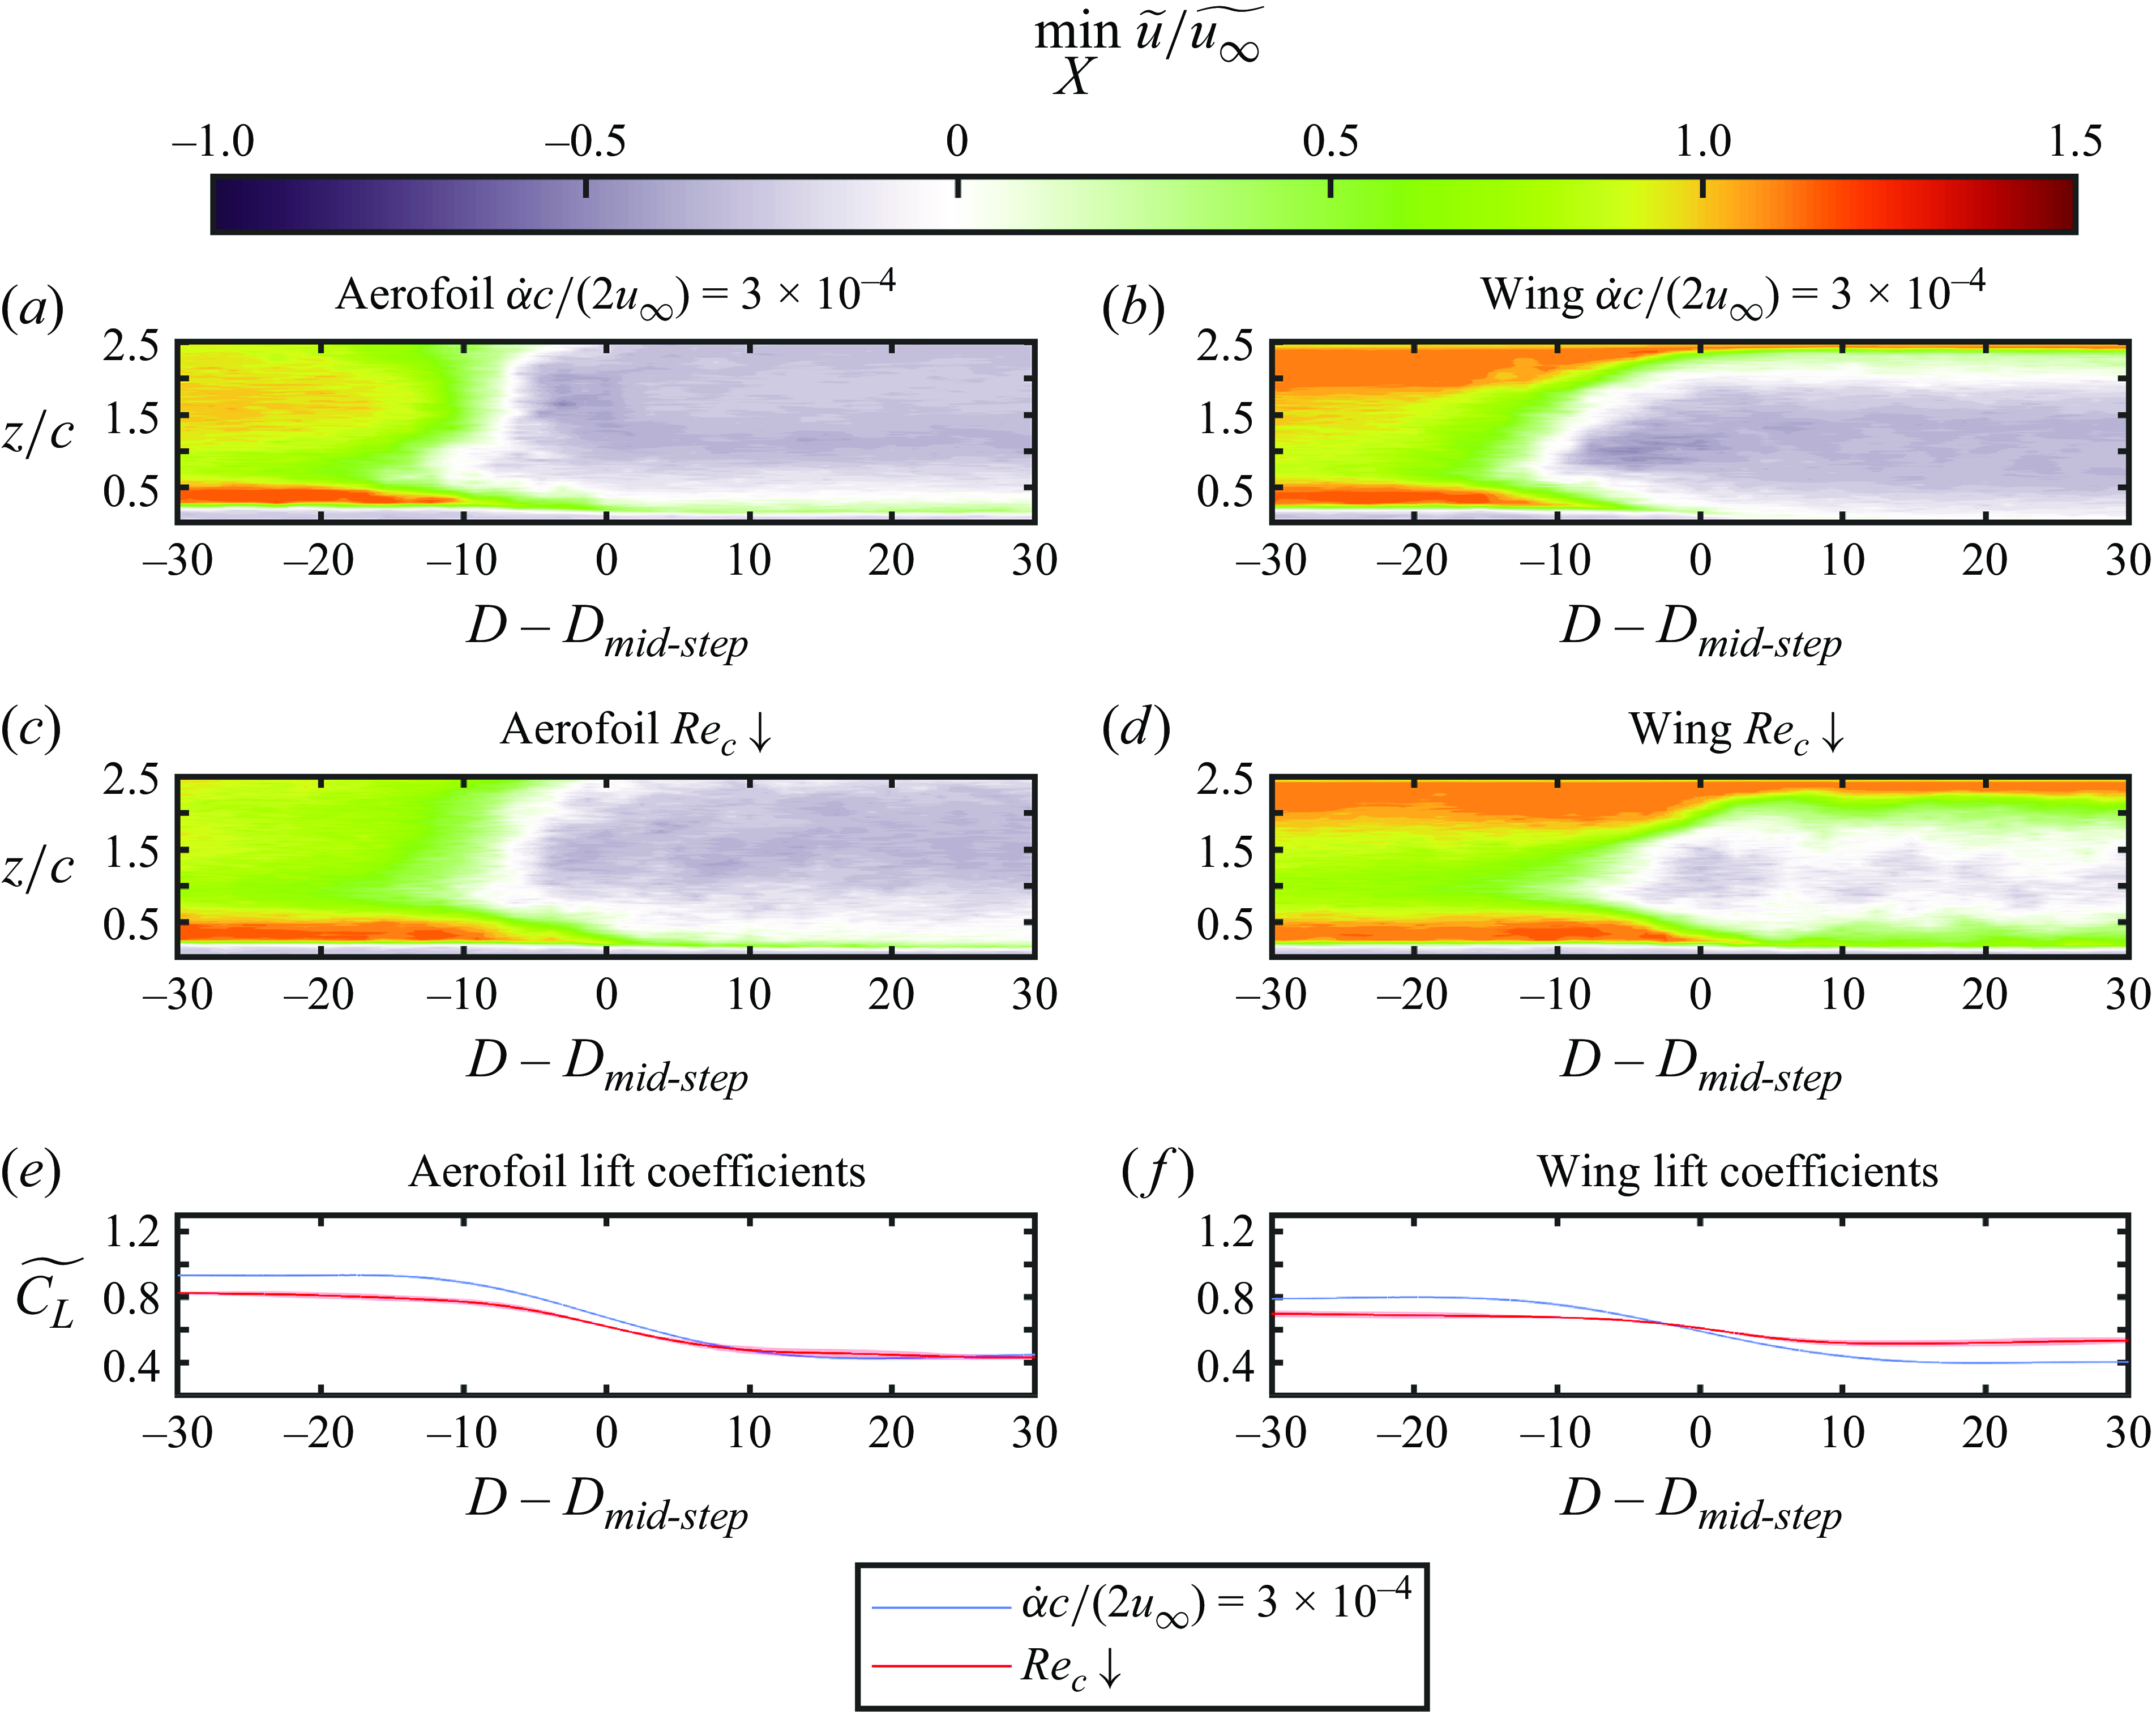
The spanwise development of the separated flow on the wing and aerofoil models during transients leading to LSB bursting is illustrated in figure 18, where contours of the minimum streamwise velocity from the ensemble average of the top view PIV measurements are plotted against spanwise position and time. The ensemble average was taken after shifting each of the individual runs in time by $D_{{mid-step}}$
(defined in § 2.1) so that the step change in lift coefficient occurs at the same time (
$D_{{mid-step}}$
(defined in § 2.1) so that the step change in lift coefficient occurs at the same time ( $D-D_{{mid-step}}=0$
) for each run. In figure 18, the minimum is taken over the streamwise (X) extent of the field of view so that the spanwise position of regions of reverse flow can be identified at a given time instant. The complete time series of instantaneous streamwise velocity fields from a single run for each of the cases in figure 18 is available in supplementary movie 5. The spanwise progression of LSB formation and bursting was found to be insensitive to pitch rate. Therefore, only measurements for a pitch rate of
$D-D_{{mid-step}}=0$
) for each run. In figure 18, the minimum is taken over the streamwise (X) extent of the field of view so that the spanwise position of regions of reverse flow can be identified at a given time instant. The complete time series of instantaneous streamwise velocity fields from a single run for each of the cases in figure 18 is available in supplementary movie 5. The spanwise progression of LSB formation and bursting was found to be insensitive to pitch rate. Therefore, only measurements for a pitch rate of $\dot {\alpha }c/ (2u_\infty )=\pm 3\times 10^{-4}$
are presented here.
$\dot {\alpha }c/ (2u_\infty )=\pm 3\times 10^{-4}$
are presented here.
For both the aerofoil and the wing, the initial reduction in the minimum streamwise velocity occurs at $z/c\approx 0.75$
. The fact that the LSB bursts first at this location on both models is likely due to minute variations in the uniformity of the oncoming flow and/or the model surface that remain consistent for both model configurations. The main difference between the spanwise progression of the region of massive separation on the aerofoil and wing during pitching motions is that the flow separates relatively abruptly across the span of the aerofoil (figure 18
a), whereas on the wing (figure 18
b), there is a gradual expansion of the region of massive separation towards the wing tip and separation is suppressed entirely in proximity of the wing tip. During the reduction in Reynolds number leading to LSB bursting, the region of massive separation on the aerofoil spreads more gradually towards the walls of the test section than for the pitching motions. On the wing, during the reduction in Reynolds number, the initial location of LSB bursting and the initial progression of the region of massive separation towards the wing tip is similar to those of the pitching motions. However, the final spanwise extent of the region of massive separation after the reduction in Reynolds number is smaller than that after the increase in angle of attack because of the different limiting conditions for the two types of transients. Thus, the type of imposed transient does not substantially affect the initial spanwise progression of LSB bursting when the presence of the wing tip creates a preferential direction for the progression of stall across the span. For both models, the appearance of the region of massive separation coincides with the beginning of a rapid loss of lift (figures 18
e and 18
f).
$z/c\approx 0.75$
. The fact that the LSB bursts first at this location on both models is likely due to minute variations in the uniformity of the oncoming flow and/or the model surface that remain consistent for both model configurations. The main difference between the spanwise progression of the region of massive separation on the aerofoil and wing during pitching motions is that the flow separates relatively abruptly across the span of the aerofoil (figure 18
a), whereas on the wing (figure 18
b), there is a gradual expansion of the region of massive separation towards the wing tip and separation is suppressed entirely in proximity of the wing tip. During the reduction in Reynolds number leading to LSB bursting, the region of massive separation on the aerofoil spreads more gradually towards the walls of the test section than for the pitching motions. On the wing, during the reduction in Reynolds number, the initial location of LSB bursting and the initial progression of the region of massive separation towards the wing tip is similar to those of the pitching motions. However, the final spanwise extent of the region of massive separation after the reduction in Reynolds number is smaller than that after the increase in angle of attack because of the different limiting conditions for the two types of transients. Thus, the type of imposed transient does not substantially affect the initial spanwise progression of LSB bursting when the presence of the wing tip creates a preferential direction for the progression of stall across the span. For both models, the appearance of the region of massive separation coincides with the beginning of a rapid loss of lift (figures 18
e and 18
f).
Contours of minimum ensemble-averaged streamwise velocity during LSB formation. Corresponding instantaneous streamwise velocity fields from single runs are available in supplementary movie 6.
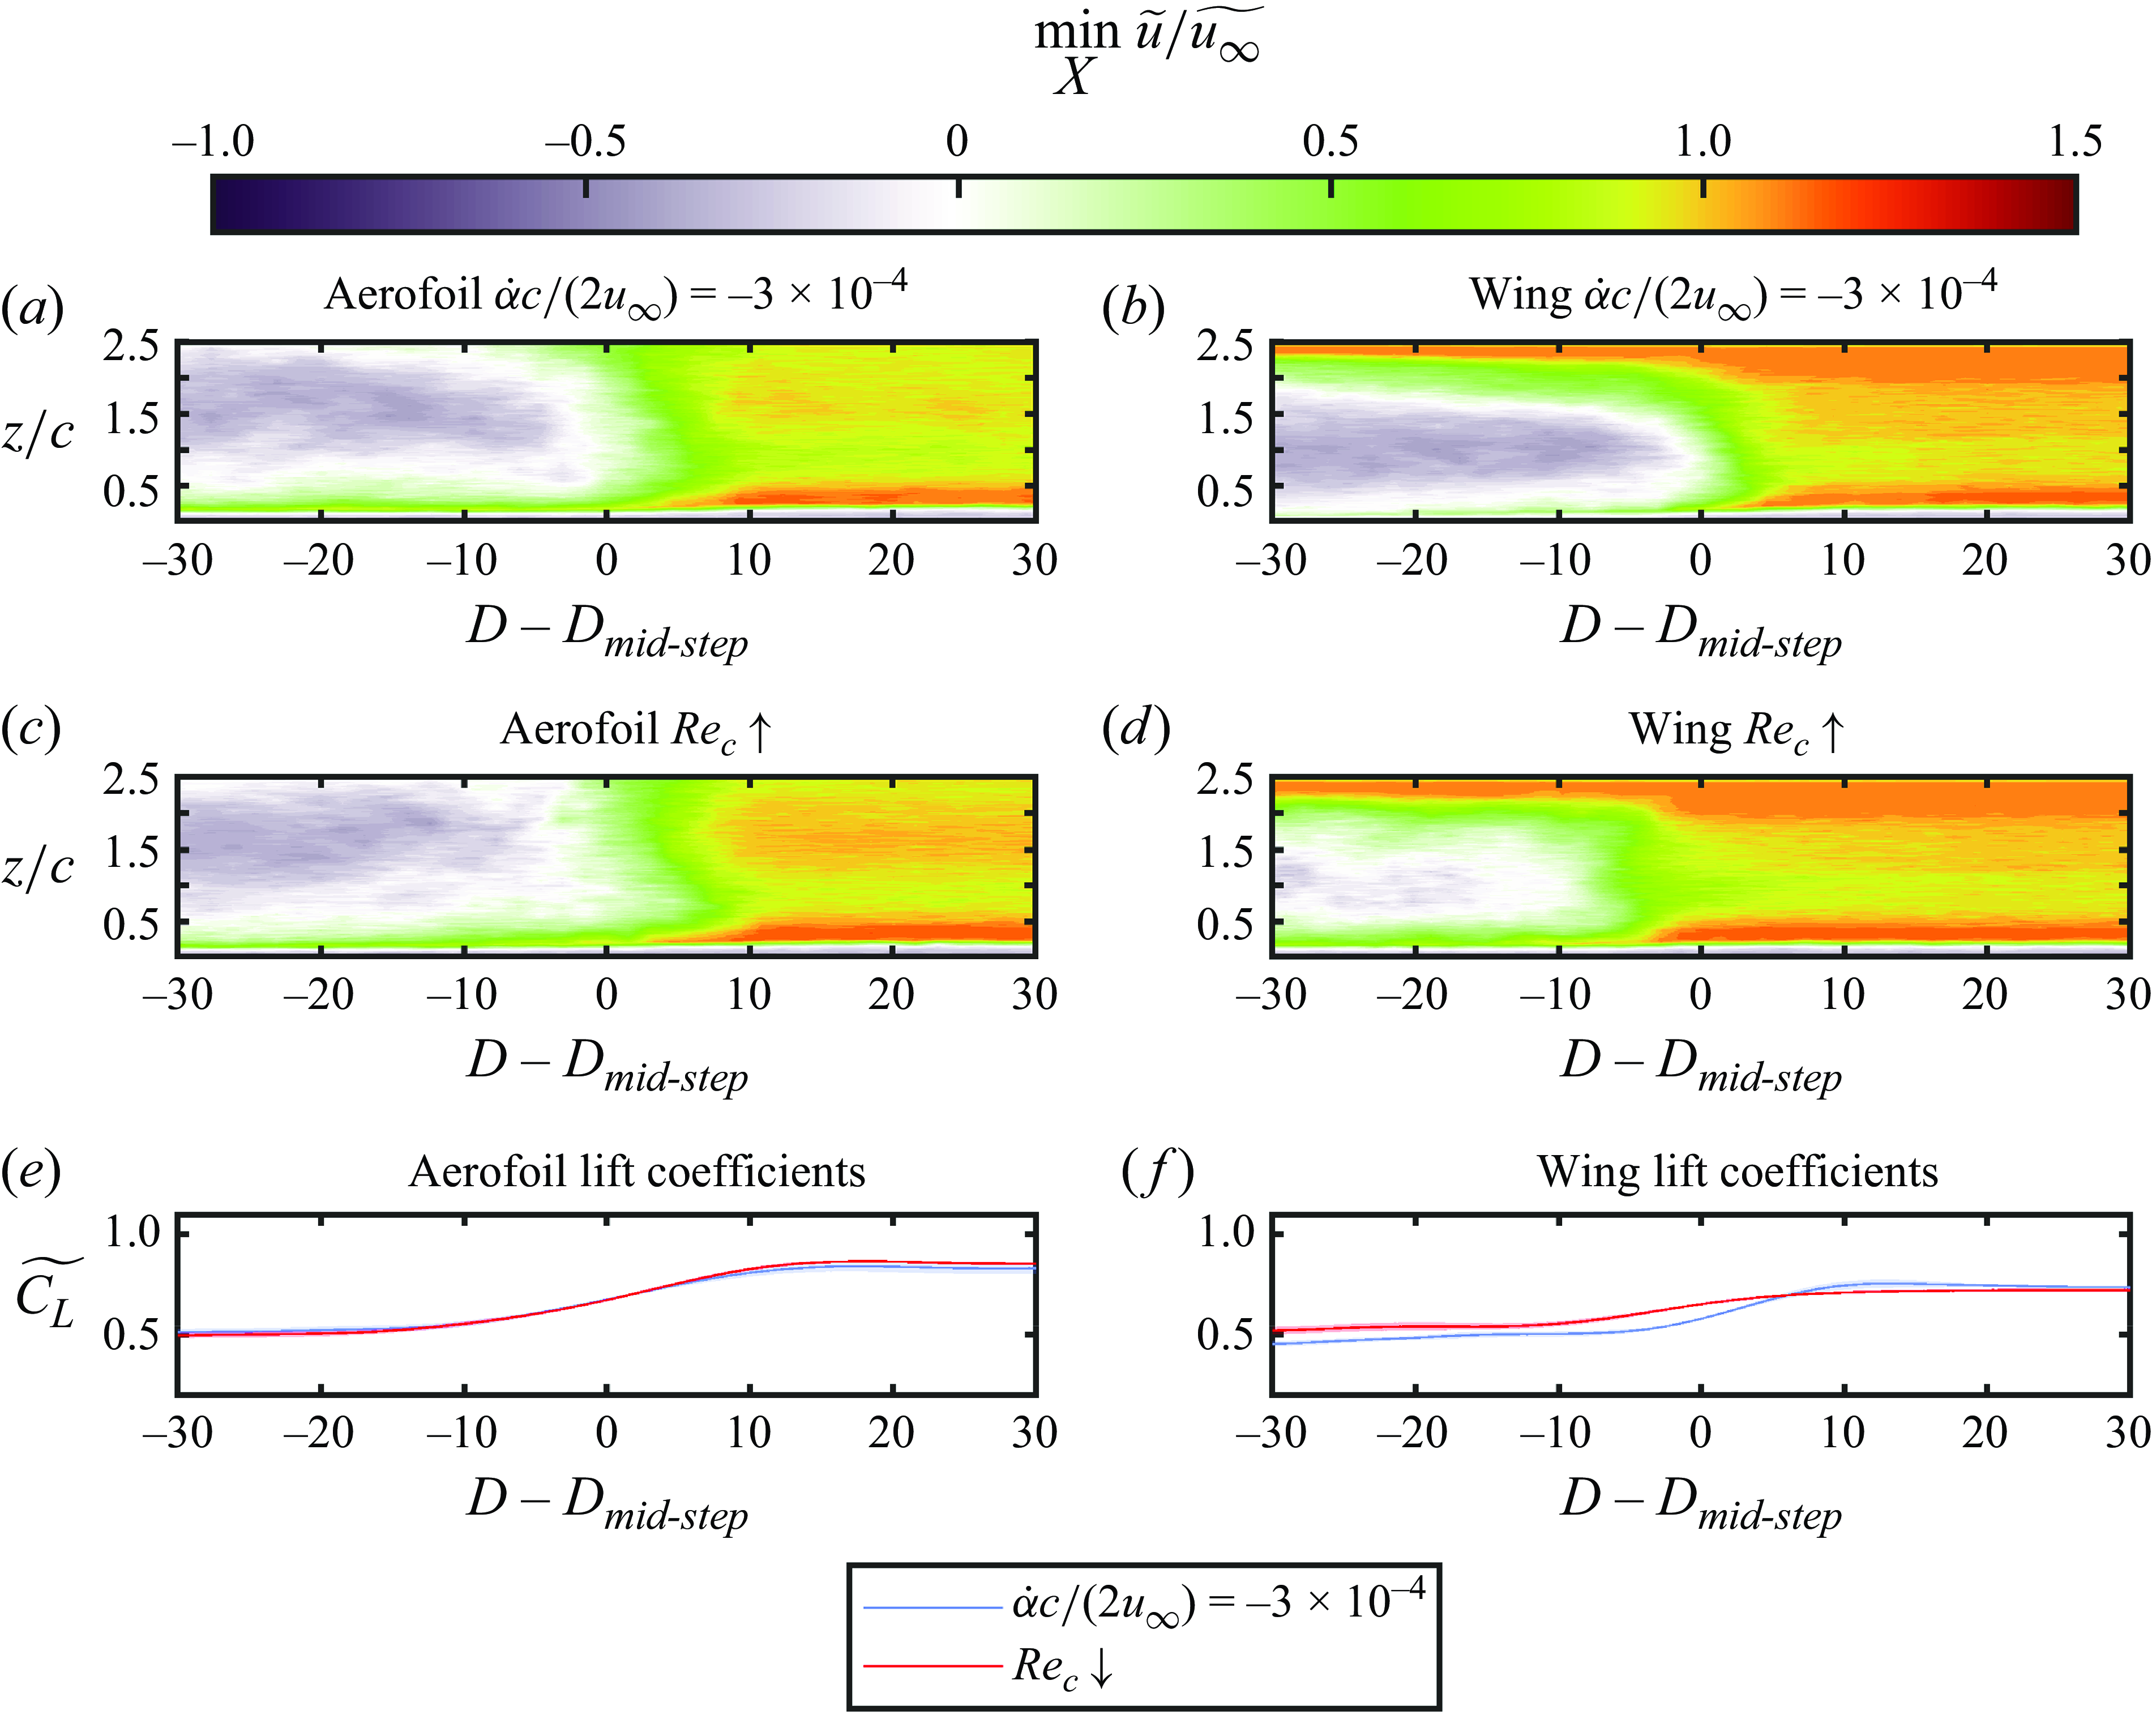
In figure 19, contours of the minimum streamwise velocity from the ensemble average of the top view PIV measurements are presented for transients leading to LSB formation. As in figure 18, the minimum in figure 19 is computed over the streamwise extent of the field of view. The complete time series of instantaneous streamwise velocity fields from a single run for each of the cases in figure 19 is available in supplementary movie 6. For each of the transients of the aerofoil (figures 19
a and 19
c), the region of massive separation contracts in its spanwise extent prior to cessation of reverse flow at the midspan. The cessation of reverse flow in the top view PIV measurements at the midspan of the aerofoil coincides with a rapid increase in lift (figure 19
e). The continued lift increase after the cessation of reverse flow in the top view measurements is attributed to the gradual reduction in extent of reverse flow closer to the model surface. The spanwise contraction of the region of massive separation prior to the cessation of reverse flow observed on the wing (figures 19
b and 19
d) is similar to that on the aerofoil, although the region of massive separation is displaced towards the wing root, consistent with the increased effective angle of attack on this part of the wing. For each of the tested cases, the cessation of reverse flow on the wing precedes that on the aerofoil. The differences in the time of cessation of reverse flow between the aerofoil and wing are approximately $2$
and
$2$
and $10$
convective time units for the pitching motion at
$10$
convective time units for the pitching motion at $\dot {\alpha }c/(2u_\infty ) = 3\times 10^{-4}$
and for increasing
$\dot {\alpha }c/(2u_\infty ) = 3\times 10^{-4}$
and for increasing ${{Re}}_c$
, respectively. The expedited cessation of reverse flow in the top view measurements on the wing is attributed to downwash from the wing tip vortex which causes the separated shear layer to remain closer to the surface of the wing.
${{Re}}_c$
, respectively. The expedited cessation of reverse flow in the top view measurements on the wing is attributed to downwash from the wing tip vortex which causes the separated shear layer to remain closer to the surface of the wing.
Overall, the ensemble-averaged top-view PIV measurements indicate that both changes in angle of attack and Reynolds number cause spanwise expansion and contraction of the region of massive separation during LSB bursting and formation, respectively. The presence of the wing tip has the effect of shifting the region of massive separation towards the root of the wing model.
3.4. Influence of limiting flow conditions
To investigate the influence of the particular limiting flow conditions of the present study on the transient aerodynamic loading, additional force measurements were performed for the aerofoil during pitching motions between $\alpha = 9^\circ$
and
$\alpha = 9^\circ$
and $14^\circ$
at a pitch rate of
$14^\circ$
at a pitch rate of $\dot {\alpha }c/(2u_\infty )=\pm 3\times 10^{-4}$
. The lift coefficients measured for individual runs of this wider angle change are plotted in figure 20. The data are shifted in time such that the static stall or reattachment condition is passed at
$\dot {\alpha }c/(2u_\infty )=\pm 3\times 10^{-4}$
. The lift coefficients measured for individual runs of this wider angle change are plotted in figure 20. The data are shifted in time such that the static stall or reattachment condition is passed at $D-D_{\textrm {ss}}=0$
or
$D-D_{\textrm {ss}}=0$
or $D-D_{\textrm {sr}}=0$
, respectively. Lift coefficients from individual runs between
$D-D_{\textrm {sr}}=0$
, respectively. Lift coefficients from individual runs between $\alpha =10^\circ$
and
$\alpha =10^\circ$
and $13^{\circ }$
at the same pitch rate are reproduced in figure 20 for comparison.
$13^{\circ }$
at the same pitch rate are reproduced in figure 20 for comparison.
For the downward pitching transient leading to reattachment (figure 20
b), the larger separation between the quasi-steady reattachment condition and the limiting LSB flow state decreases the variance the timing of the rapid increase in lift. For the wider angle change, the lift recovery consistently occurs within $50c/u_\infty$
of the passing of the static reattachment condition, similar to the fastest increases in lift for the narrower angle range. For the upward pitching transient leading to stall (figure 20
a), the timing of the rapid loss of lift is relatively unchanged between the two angle ranges, which is attributed to the greater separation of the static stall condition and the stalled limiting state (figure 6
a). For the stall and reattachment transients, the minimum time at which the step change in lift coefficient occurs remains largely unchanged for the two angle ranges. This observation suggests that once the limiting states are sufficiently separated from the static stall or reattachment conditions, increasing the separation of the limiting states has a negligible effect on LSB formation and bursting and the consequent timing of the step changes in lift coefficient.
$50c/u_\infty$
of the passing of the static reattachment condition, similar to the fastest increases in lift for the narrower angle range. For the upward pitching transient leading to stall (figure 20
a), the timing of the rapid loss of lift is relatively unchanged between the two angle ranges, which is attributed to the greater separation of the static stall condition and the stalled limiting state (figure 6
a). For the stall and reattachment transients, the minimum time at which the step change in lift coefficient occurs remains largely unchanged for the two angle ranges. This observation suggests that once the limiting states are sufficiently separated from the static stall or reattachment conditions, increasing the separation of the limiting states has a negligible effect on LSB formation and bursting and the consequent timing of the step changes in lift coefficient.
Comparison of transient lift coefficients of individual runs for pitching motions over narrow and wide angle ranges.
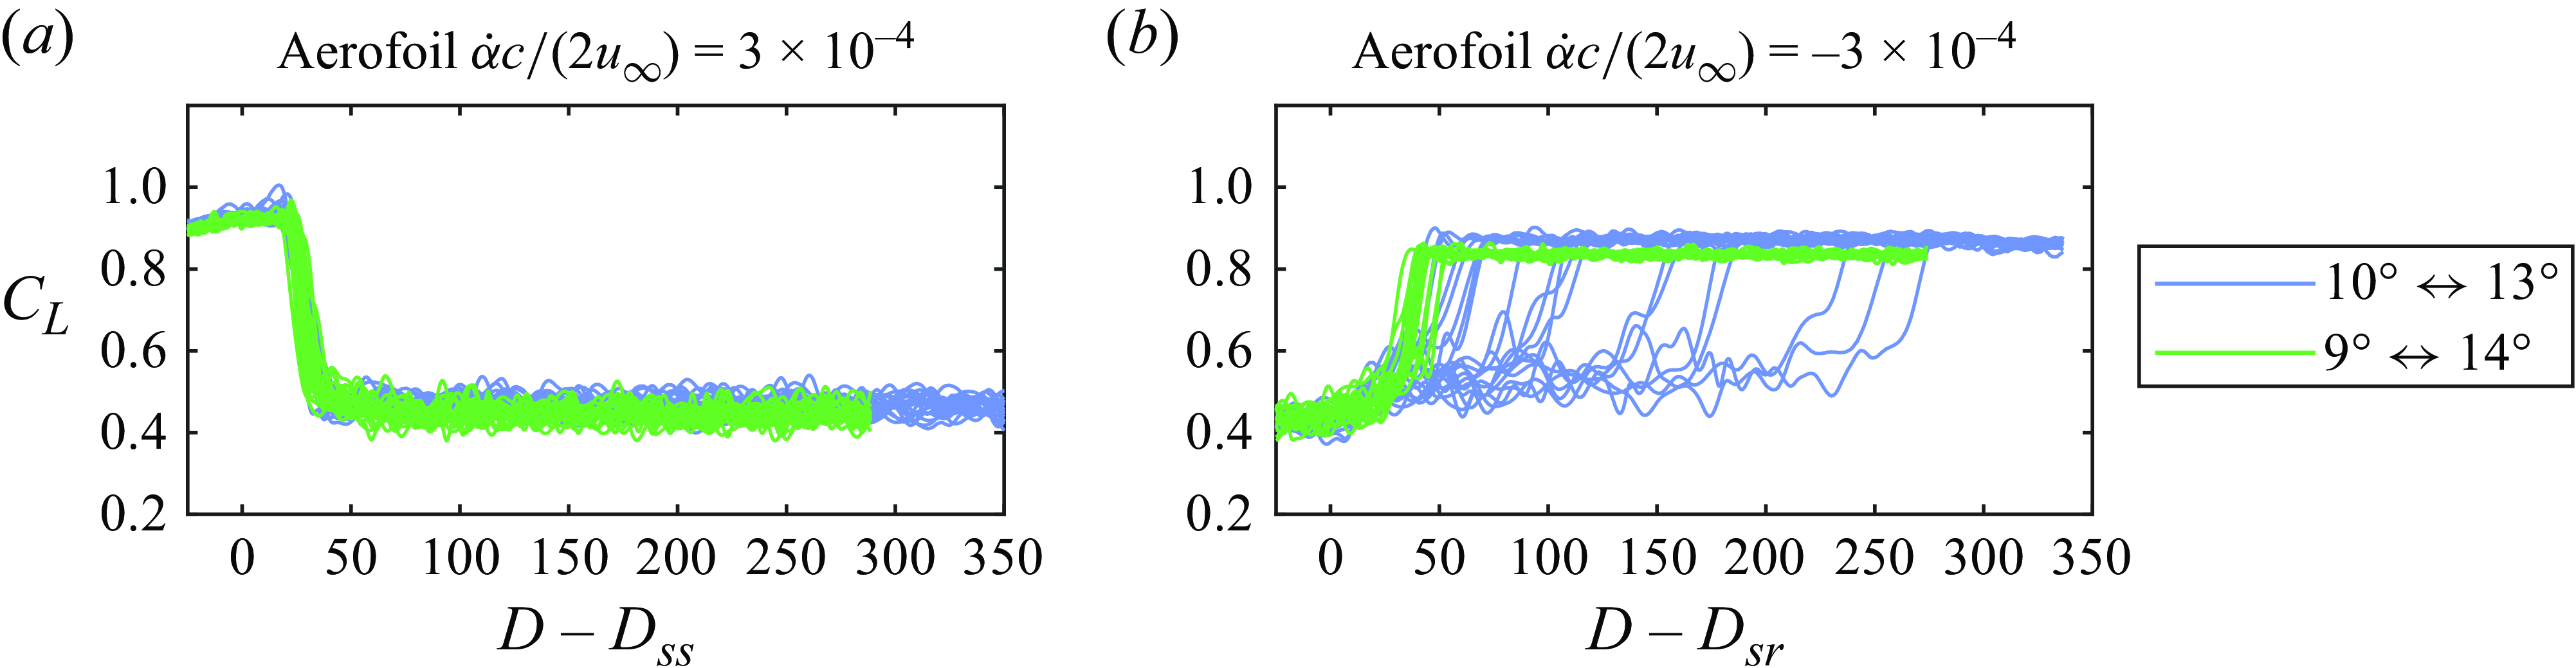
The influence of Reynolds number on the evolution of the lift coefficient is investigated by comparing the lift coefficient measurements for pitching between $\alpha =10^\circ$
and
$\alpha =10^\circ$
and $13^\circ$
of the present study with those obtained by Kiefer et al. (Reference Kiefer, Brunner, Hansen and Hultmark2022) for transient pitch up motions from
$13^\circ$
of the present study with those obtained by Kiefer et al. (Reference Kiefer, Brunner, Hansen and Hultmark2022) for transient pitch up motions from $\alpha = 19^\circ$
to
$\alpha = 19^\circ$
to $29^\circ$
of a NACA 0021 aerofoil at
$29^\circ$
of a NACA 0021 aerofoil at ${{Re}}_c=3.0\times 10^6$
. At that Reynolds number, Kiefer et al. (Reference Kiefer, Brunner, Hansen and Hultmark2022) reported that an LSB did not form in the pre-stall condition. The data selected for comparison in figure 21 are those pitching motions with durations of
${{Re}}_c=3.0\times 10^6$
. At that Reynolds number, Kiefer et al. (Reference Kiefer, Brunner, Hansen and Hultmark2022) reported that an LSB did not form in the pre-stall condition. The data selected for comparison in figure 21 are those pitching motions with durations of $5$
and
$5$
and $79$
convective time units, which are similar to those of the present study for
$79$
convective time units, which are similar to those of the present study for $\dot {\alpha }c/(2u_\infty )=3\times 10^{-4}$
and
$\dot {\alpha }c/(2u_\infty )=3\times 10^{-4}$
and $5\times 10^{-3}$
of
$5\times 10^{-3}$
of $6$
and
$6$
and $77$
convective time units, respectively. Note that because Kiefer et al. (Reference Kiefer, Brunner, Hansen and Hultmark2022) used a sinusoidal motion profile instead of the linear ramp used in the present study, the maximum pitch rates from their study were higher for the same overall duration of the transient pitching motion. Although the data of Kiefer et al. (Reference Kiefer, Brunner, Hansen and Hultmark2022) were obtained at a higher Reynolds number at which the lift coefficients and stall angle are substantially higher, the maximum lift overshoot and subsequent rapid loss of lift occur at similar times as the fastest pitch rate in the present study. This similarity supports the conclusion made by Mulleners & Raffel (Reference Mulleners and Raffel2013) and Le Fouest et al. (Reference Le Fouest, Deparday and Mulleners2021) that the loading during the fastest pitching motions is initially governed by the time required for DSV formation, which is largely insensitive to Reynolds number and aerofoil kinematics. For the longer duration transients, the onset of stall in the present study is substantially delayed when compared with the measurements of Kiefer et al. (Reference Kiefer, Brunner, Hansen and Hultmark2022) at a higher Reynolds number. This suggests that Reynolds number effects are more significant for slower pitching motions, where the influence of the aerofoil kinematics on unsteady lift development is weaker. For both pitch rates, the lift decrease is more rapid after the onset of stall for the data of Kiefer et al. (Reference Kiefer, Brunner, Hansen and Hultmark2022) at the higher Reynolds number than for the present study. This suggests that the later stages of dynamic stall may be relatively more sensitive to the Reynolds number and aerofoil kinematics.
$77$
convective time units, respectively. Note that because Kiefer et al. (Reference Kiefer, Brunner, Hansen and Hultmark2022) used a sinusoidal motion profile instead of the linear ramp used in the present study, the maximum pitch rates from their study were higher for the same overall duration of the transient pitching motion. Although the data of Kiefer et al. (Reference Kiefer, Brunner, Hansen and Hultmark2022) were obtained at a higher Reynolds number at which the lift coefficients and stall angle are substantially higher, the maximum lift overshoot and subsequent rapid loss of lift occur at similar times as the fastest pitch rate in the present study. This similarity supports the conclusion made by Mulleners & Raffel (Reference Mulleners and Raffel2013) and Le Fouest et al. (Reference Le Fouest, Deparday and Mulleners2021) that the loading during the fastest pitching motions is initially governed by the time required for DSV formation, which is largely insensitive to Reynolds number and aerofoil kinematics. For the longer duration transients, the onset of stall in the present study is substantially delayed when compared with the measurements of Kiefer et al. (Reference Kiefer, Brunner, Hansen and Hultmark2022) at a higher Reynolds number. This suggests that Reynolds number effects are more significant for slower pitching motions, where the influence of the aerofoil kinematics on unsteady lift development is weaker. For both pitch rates, the lift decrease is more rapid after the onset of stall for the data of Kiefer et al. (Reference Kiefer, Brunner, Hansen and Hultmark2022) at the higher Reynolds number than for the present study. This suggests that the later stages of dynamic stall may be relatively more sensitive to the Reynolds number and aerofoil kinematics.
Comparison of pitching transients leading to stall with data from Kiefer et al. (Reference Kiefer, Brunner, Hansen and Hultmark2022). Shaded areas indicate uncertainty ( $95\,\%$
confidence).
$95\,\%$
confidence).
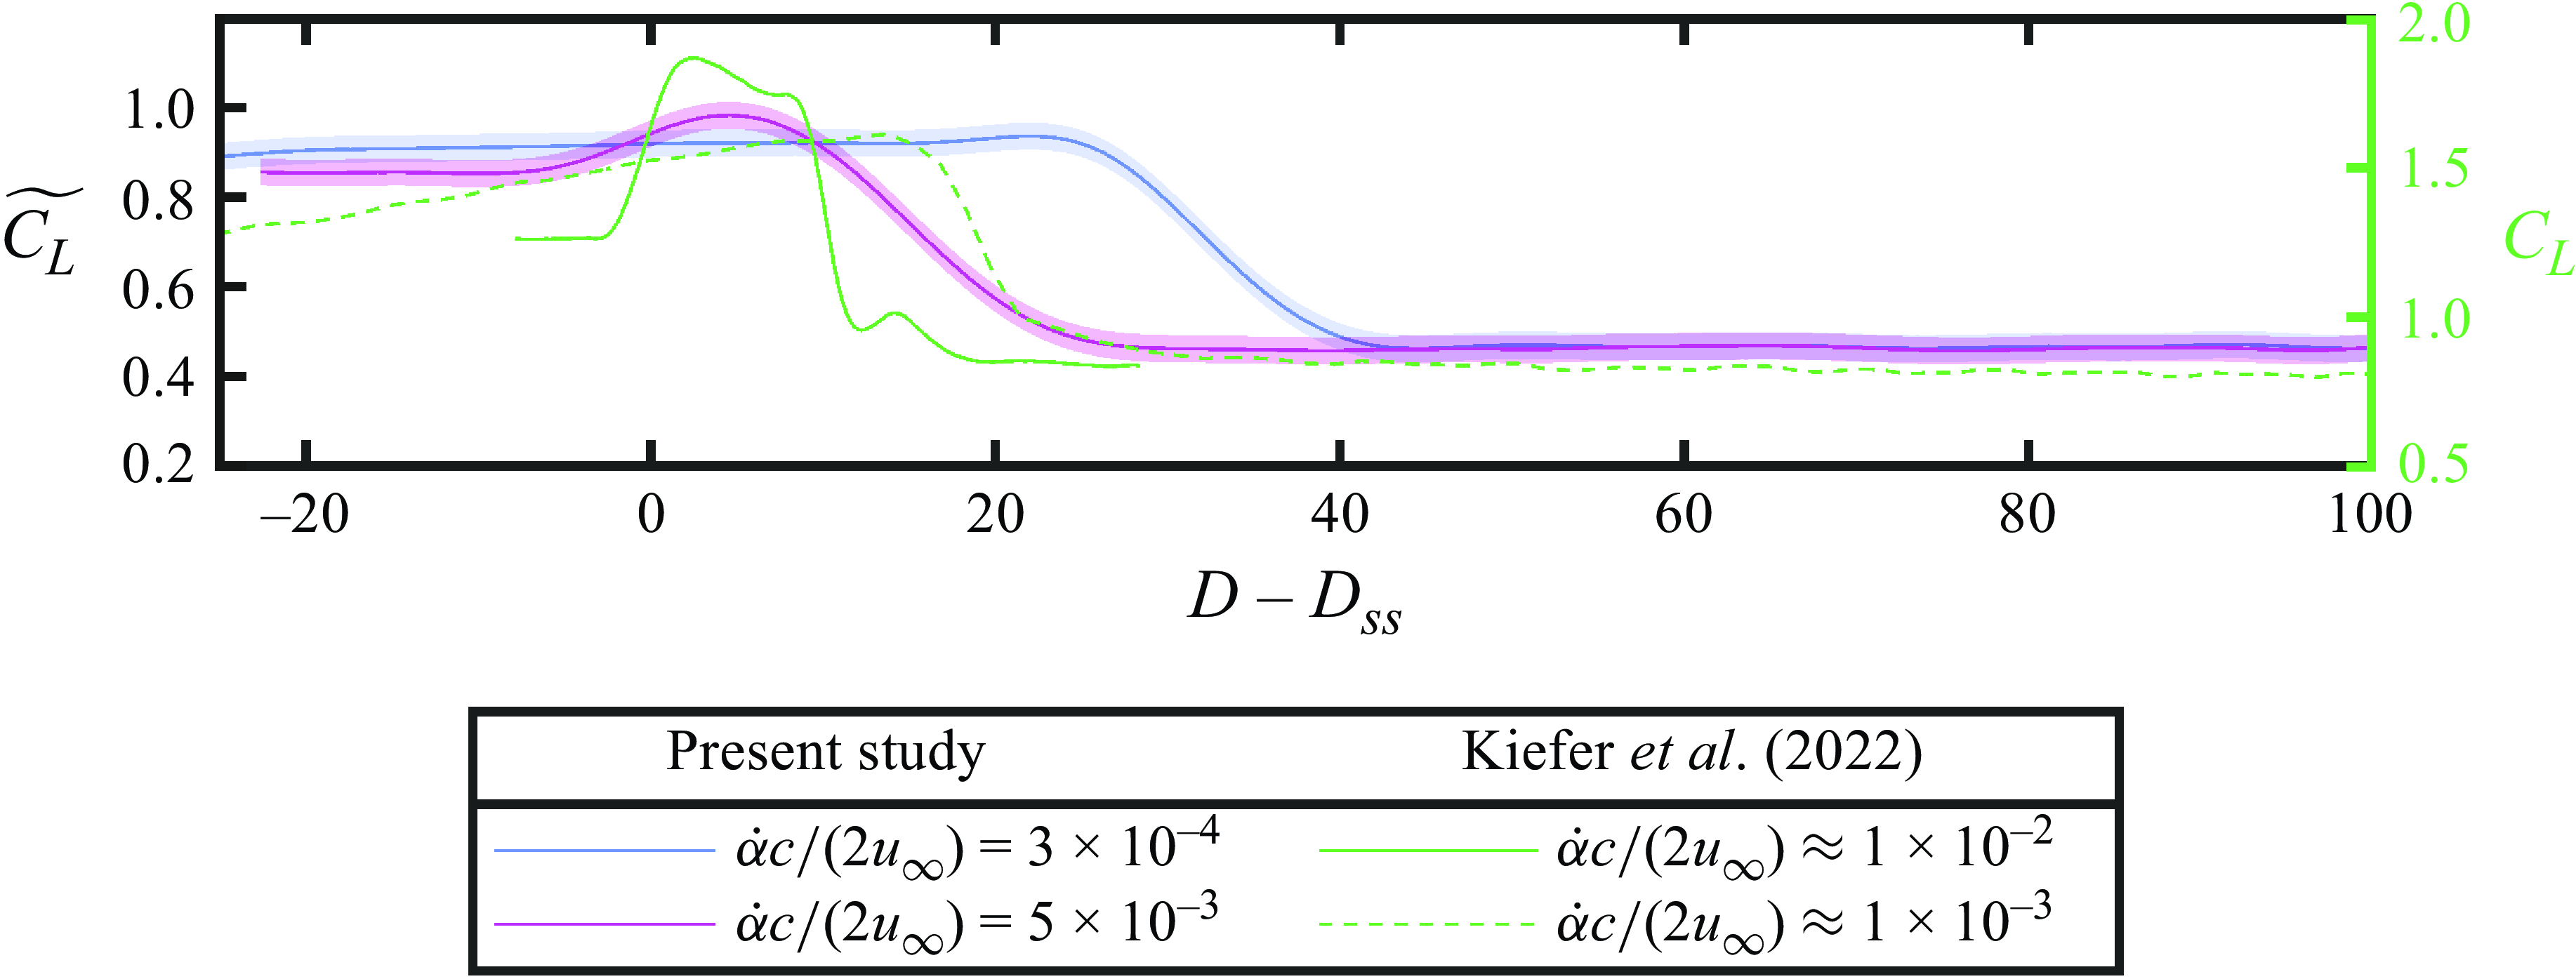
The foregoing results demonstrate that the difference between the static stall or reattachment conditions and the initial and final flow states affect the timing of the decrease or increase in lift coefficient during transients leading to LSB bursting or formation, respectively. However, for a given type of imposed change in operating conditions, qualitative similarity in the initial time history of the lift response exists across different Reynolds numbers and angles of attack. Although the timings of LSB bursting and reattachment vary depending on the operating conditions, the PIV measurements taken for a limited set of imposed transients are expected to be representative of the LSB bursting and formation processes that govern the onset of stall and reattachment.
3.5. Influence of pitch rate
Ensemble-averaged lift coefficient time history during pitching motion for (a, c) aerofoil and(b, d) wing. Shaded areas indicate uncertainty ( $95\,\%$
confidence).
$95\,\%$
confidence).
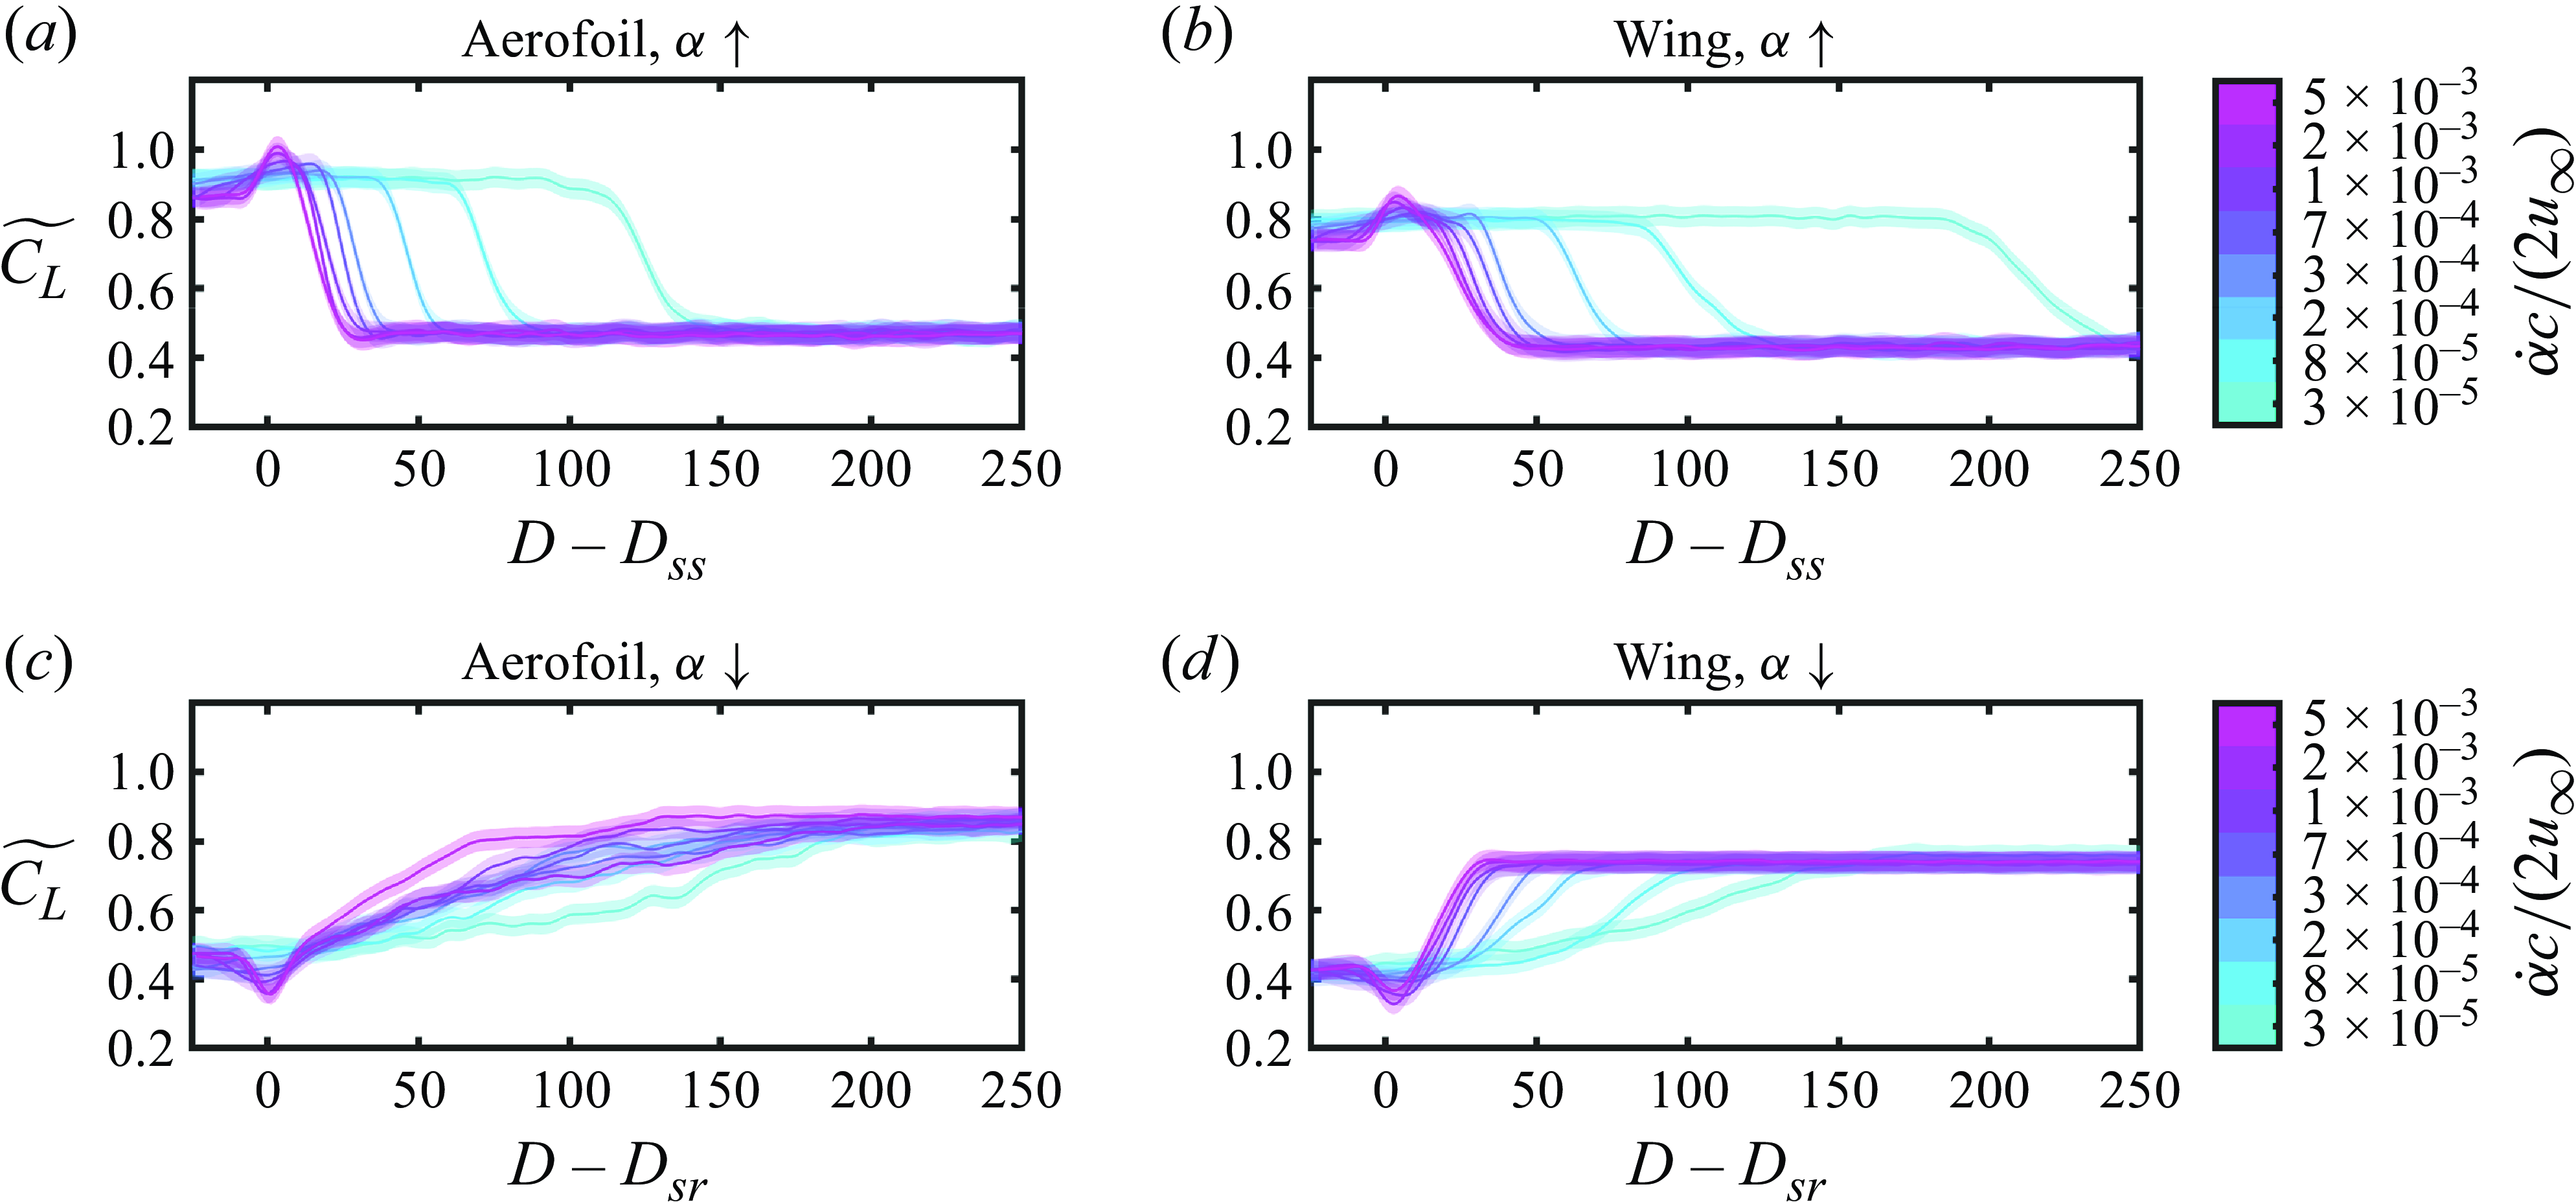
The time evolution of the ensemble-averaged lift coefficients during transient pitching motions is illustrated in figure 22. Because the duration of the transient pitching motions depends on pitch rate (figure 2), the passing of the static stall angle occurs at later times for slower pitch rates. To facilitate the comparison of lift coefficients between different cases, the data in figure 22 are shifted in time such that the static stall or reattachment condition is passed at $D-D_{ss}=0$
or
$D-D_{ss}=0$
or $D-D_{sr}=0$
, respectively. As the pitch rate is increased, stall occurs with a shorter delay after the passing of the static stall condition for the aerofoil and wing (figures 22
a and 22
b), consistent with the results of Ayancik & Mulleners (Reference Ayancik and Mulleners2022) and Kiefer et al. (Reference Kiefer, Brunner, Hansen and Hultmark2022). For the fastest pitch rates, substantial over- and undershoots in the lift coefficients are observed during stall and reattachment on both models, consistent with the dynamic stall and reattachment processes observed at higher Reynolds numbers (Green & Galbraith Reference Green and Galbraith1995; Kiefer et al. Reference Kiefer, Brunner, Hansen and Hultmark2022) and discussed in § 3.4.
$D-D_{sr}=0$
, respectively. As the pitch rate is increased, stall occurs with a shorter delay after the passing of the static stall condition for the aerofoil and wing (figures 22
a and 22
b), consistent with the results of Ayancik & Mulleners (Reference Ayancik and Mulleners2022) and Kiefer et al. (Reference Kiefer, Brunner, Hansen and Hultmark2022). For the fastest pitch rates, substantial over- and undershoots in the lift coefficients are observed during stall and reattachment on both models, consistent with the dynamic stall and reattachment processes observed at higher Reynolds numbers (Green & Galbraith Reference Green and Galbraith1995; Kiefer et al. Reference Kiefer, Brunner, Hansen and Hultmark2022) and discussed in § 3.4.
The ensemble-averaged lift coefficients during transients leading to LSB formation in figures 22(c) and 22(d) indicate that reattachment occurs more quickly after the static reattachment condition is passed as the pitch rate is increased for both the aerofoil and wing. The slower rate of change of the ensemble-averaged lift coefficients for slower pitch rates is a consequence of greater variability in the time at which the step increase in lift occurs in the individual runs at slower pitch rates (e.g. Figure 9
a). This variability is greater for the aerofoil than the wing because of the closer proximity of the limiting LSB state for the aerofoil to the static reattachment angle of the aerofoil. The undershoot in lift coefficient for faster pitch rates resembles that measured by Green & Galbraith (Reference Green and Galbraith1995) for the normal force coefficient during a continuous decrease of the angle of attack through $\alpha =0^\circ$
at
$\alpha =0^\circ$
at ${{Re}}_c=1.5\times 10^6$
. The undershoot in lift at faster pitch rates likely contributes to making the timing of the lift recovery more consistent, acting as an effective increase in the difference between the initial and static reattachment conditions.
${{Re}}_c=1.5\times 10^6$
. The undershoot in lift at faster pitch rates likely contributes to making the timing of the lift recovery more consistent, acting as an effective increase in the difference between the initial and static reattachment conditions.
To quantitatively compare the delay between the passing of the static stall or reattachment conditions and the start of the step change in lift coefficient for different pitch rates, the ensemble-average reaction delays ( $\Delta D_{{react}}$
defined in § 2.1), are presented in figure 23 for all pitch rates tested. As the pitch rate is increased, the reaction delays for stall of the aerofoil and stall and reattachment of the wing decrease asymptotically, converging towards the trend reported by Ayancik & Mulleners (Reference Ayancik and Mulleners2022) for ramp-up and sinusoidal pitching motions at Reynolds numbers in the range of
$\Delta D_{{react}}$
defined in § 2.1), are presented in figure 23 for all pitch rates tested. As the pitch rate is increased, the reaction delays for stall of the aerofoil and stall and reattachment of the wing decrease asymptotically, converging towards the trend reported by Ayancik & Mulleners (Reference Ayancik and Mulleners2022) for ramp-up and sinusoidal pitching motions at Reynolds numbers in the range of $7.5\times 10^4\leqslant {{Re}}_c\leqslant 9.2\times 10^5$
for various aerofoil profiles and motion kinematics. The asymptotic decrease in reaction delay suggests that the time-evolution of the lift force is governed by the DSV formation process (Ayancik & Mulleners Reference Ayancik and Mulleners2022), with the details of transition having a relatively minor influence. At the highest pitch rate tested (
$7.5\times 10^4\leqslant {{Re}}_c\leqslant 9.2\times 10^5$
for various aerofoil profiles and motion kinematics. The asymptotic decrease in reaction delay suggests that the time-evolution of the lift force is governed by the DSV formation process (Ayancik & Mulleners Reference Ayancik and Mulleners2022), with the details of transition having a relatively minor influence. At the highest pitch rate tested ( $\dot {\alpha }c/(2u_\infty )=5\times 10^{-3}$
), the aerofoil stall reaction delay is
$\dot {\alpha }c/(2u_\infty )=5\times 10^{-3}$
), the aerofoil stall reaction delay is $\Delta D_{{react}}=11$
and that of the wing is
$\Delta D_{{react}}=11$
and that of the wing is $\Delta D_{{react}}=19$
. At each pitch rate, the reaction delay for stall of the wing is longer than that for the aerofoil, indicating that the presence of end effects increases the reaction delay during stall. The reaction delays at the highest pitch rate are still significantly longer than the minimum stall reaction delay of approximately
$\Delta D_{{react}}=19$
. At each pitch rate, the reaction delay for stall of the wing is longer than that for the aerofoil, indicating that the presence of end effects increases the reaction delay during stall. The reaction delays at the highest pitch rate are still significantly longer than the minimum stall reaction delay of approximately $\Delta D_{{react}}=3$
observed by Le Fouest et al. (Reference Le Fouest, Deparday and Mulleners2021) for a NACA0018 aerofoil at
$\Delta D_{{react}}=3$
observed by Le Fouest et al. (Reference Le Fouest, Deparday and Mulleners2021) for a NACA0018 aerofoil at ${{Re}}_c=7.5\times 10^5$
and a reduced pitch rate of
${{Re}}_c=7.5\times 10^5$
and a reduced pitch rate of $\dot {\alpha }c/(2u_\infty )=0.14$
. This discrepancy is attributed to the relatively low effective cutoff frequency of the filtering procedure used to attenuate structural vibrations at the natural frequency of the model (figure 3).
$\dot {\alpha }c/(2u_\infty )=0.14$
. This discrepancy is attributed to the relatively low effective cutoff frequency of the filtering procedure used to attenuate structural vibrations at the natural frequency of the model (figure 3).
Similar to the reaction delays for stall of the wing, the reaction delays for reattachment on the wing also show a decrease with increasing pitch rate before plateauing at a delay of approximately $10$
convective time units because of the limited frequency response of the force measurement system. In contrast, the reaction delays for reattachment on the aerofoil are notably longer and more variable for pitching between
$10$
convective time units because of the limited frequency response of the force measurement system. In contrast, the reaction delays for reattachment on the aerofoil are notably longer and more variable for pitching between $\alpha = 10^\circ$
and
$\alpha = 10^\circ$
and $13^\circ$
. This result is attributed to the proximity of the limiting LSB condition to the static reattachment angle (figure 6
a). In sucha case, the initiation of reattachment is likely to have a higher sensitivity to random minute perturbations of the flow in the test section. The substantially longer reaction delays for reattachment on the aerofoil observed in the present study are a consequence of the particular limiting conditions investigated, and this is confirmed by the reaction delays for pitching motions of the aerofoil between
$13^\circ$
. This result is attributed to the proximity of the limiting LSB condition to the static reattachment angle (figure 6
a). In sucha case, the initiation of reattachment is likely to have a higher sensitivity to random minute perturbations of the flow in the test section. The substantially longer reaction delays for reattachment on the aerofoil observed in the present study are a consequence of the particular limiting conditions investigated, and this is confirmed by the reaction delays for pitching motions of the aerofoil between $\alpha =9^\circ$
and
$\alpha =9^\circ$
and $14^\circ$
(filled symbols), which are less variable and closer to those of the wing. Regardless of the limiting conditions, there is still an overall trend towards shorter reaction delays for reattachment on the aerofoil as the pitch rate increases.
$14^\circ$
(filled symbols), which are less variable and closer to those of the wing. Regardless of the limiting conditions, there is still an overall trend towards shorter reaction delays for reattachment on the aerofoil as the pitch rate increases.
Reaction delay versus pitch rate for pitching between $10^{\circ }$
and
$10^{\circ }$
and $13^\circ$
. Filled symbols denote pitching between
$13^\circ$
. Filled symbols denote pitching between $9^{\circ }$
and
$9^{\circ }$
and $14^{\circ }$
and are offset in the horizontal direction for clarity. Error bars denote standard deviation.
$14^{\circ }$
and are offset in the horizontal direction for clarity. Error bars denote standard deviation.
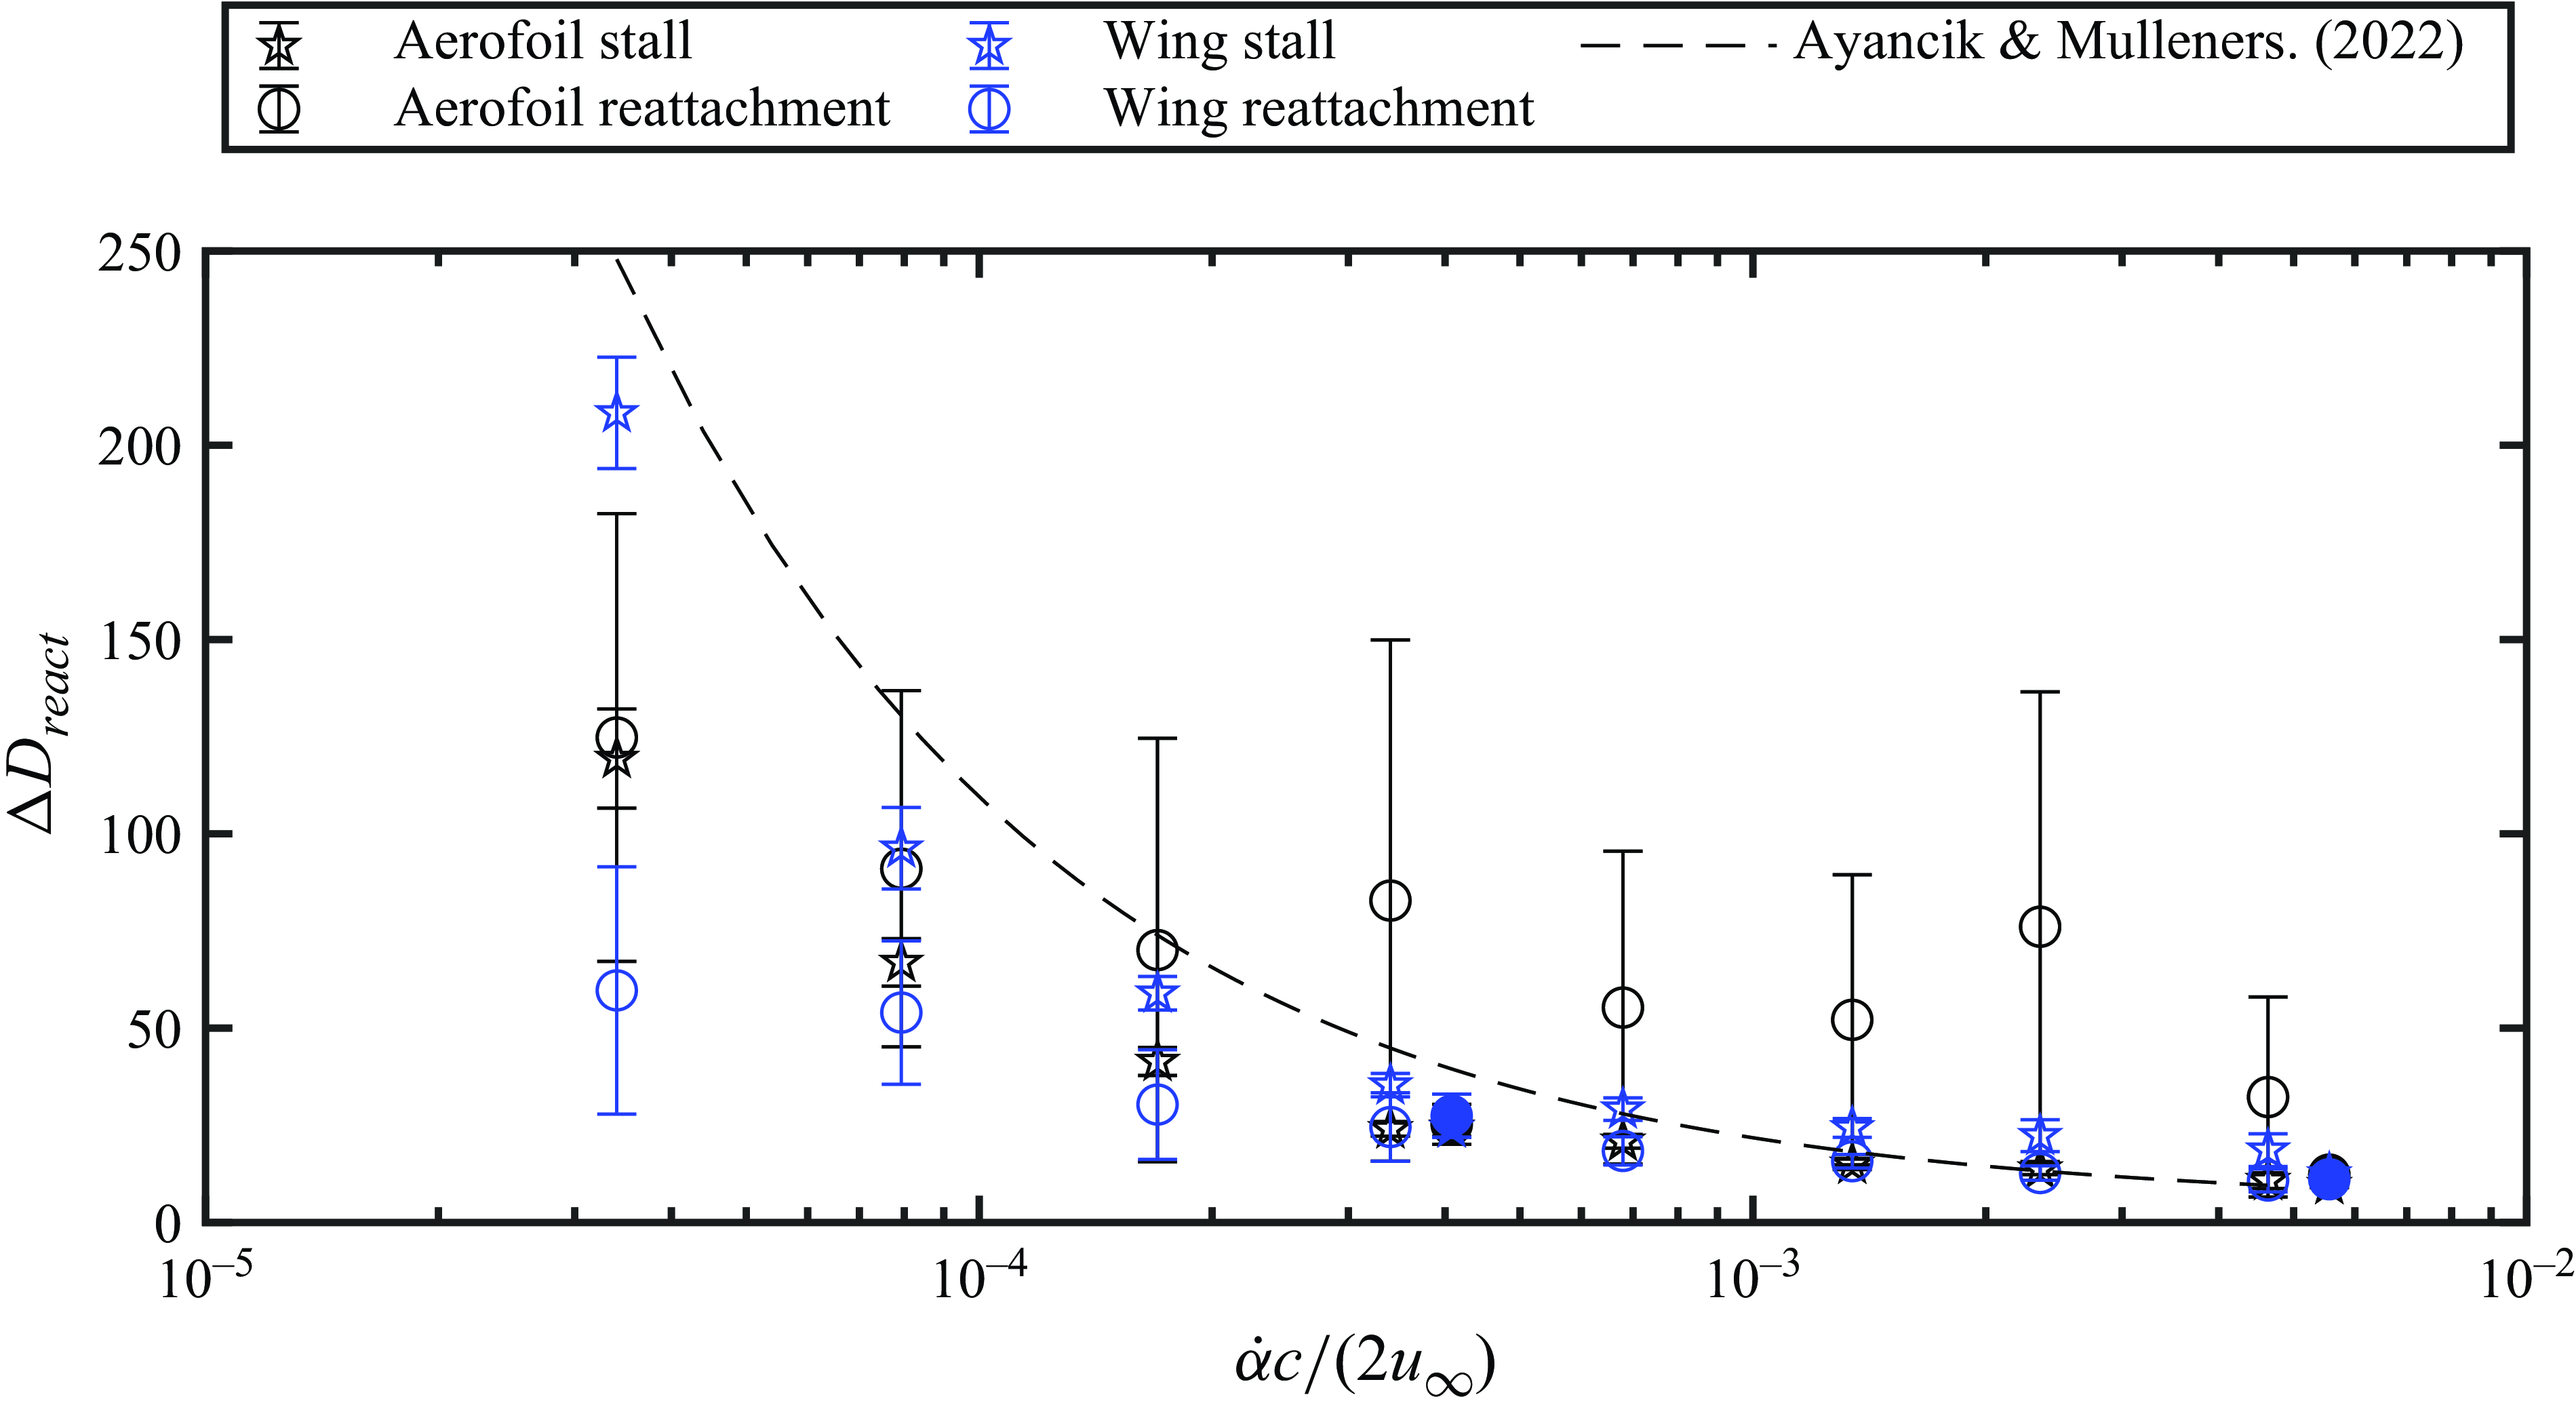
Step time versus pitch rate for pitching between $10^{\circ }$
and
$10^{\circ }$
and $13^{\circ }$
. Filled symbols denote pitching between
$13^{\circ }$
. Filled symbols denote pitching between $9^{\circ }$
and
$9^{\circ }$
and $14^{\circ }$
and are offset in the horizontal direction for clarity. Error bars denote standard deviation.
$14^{\circ }$
and are offset in the horizontal direction for clarity. Error bars denote standard deviation.
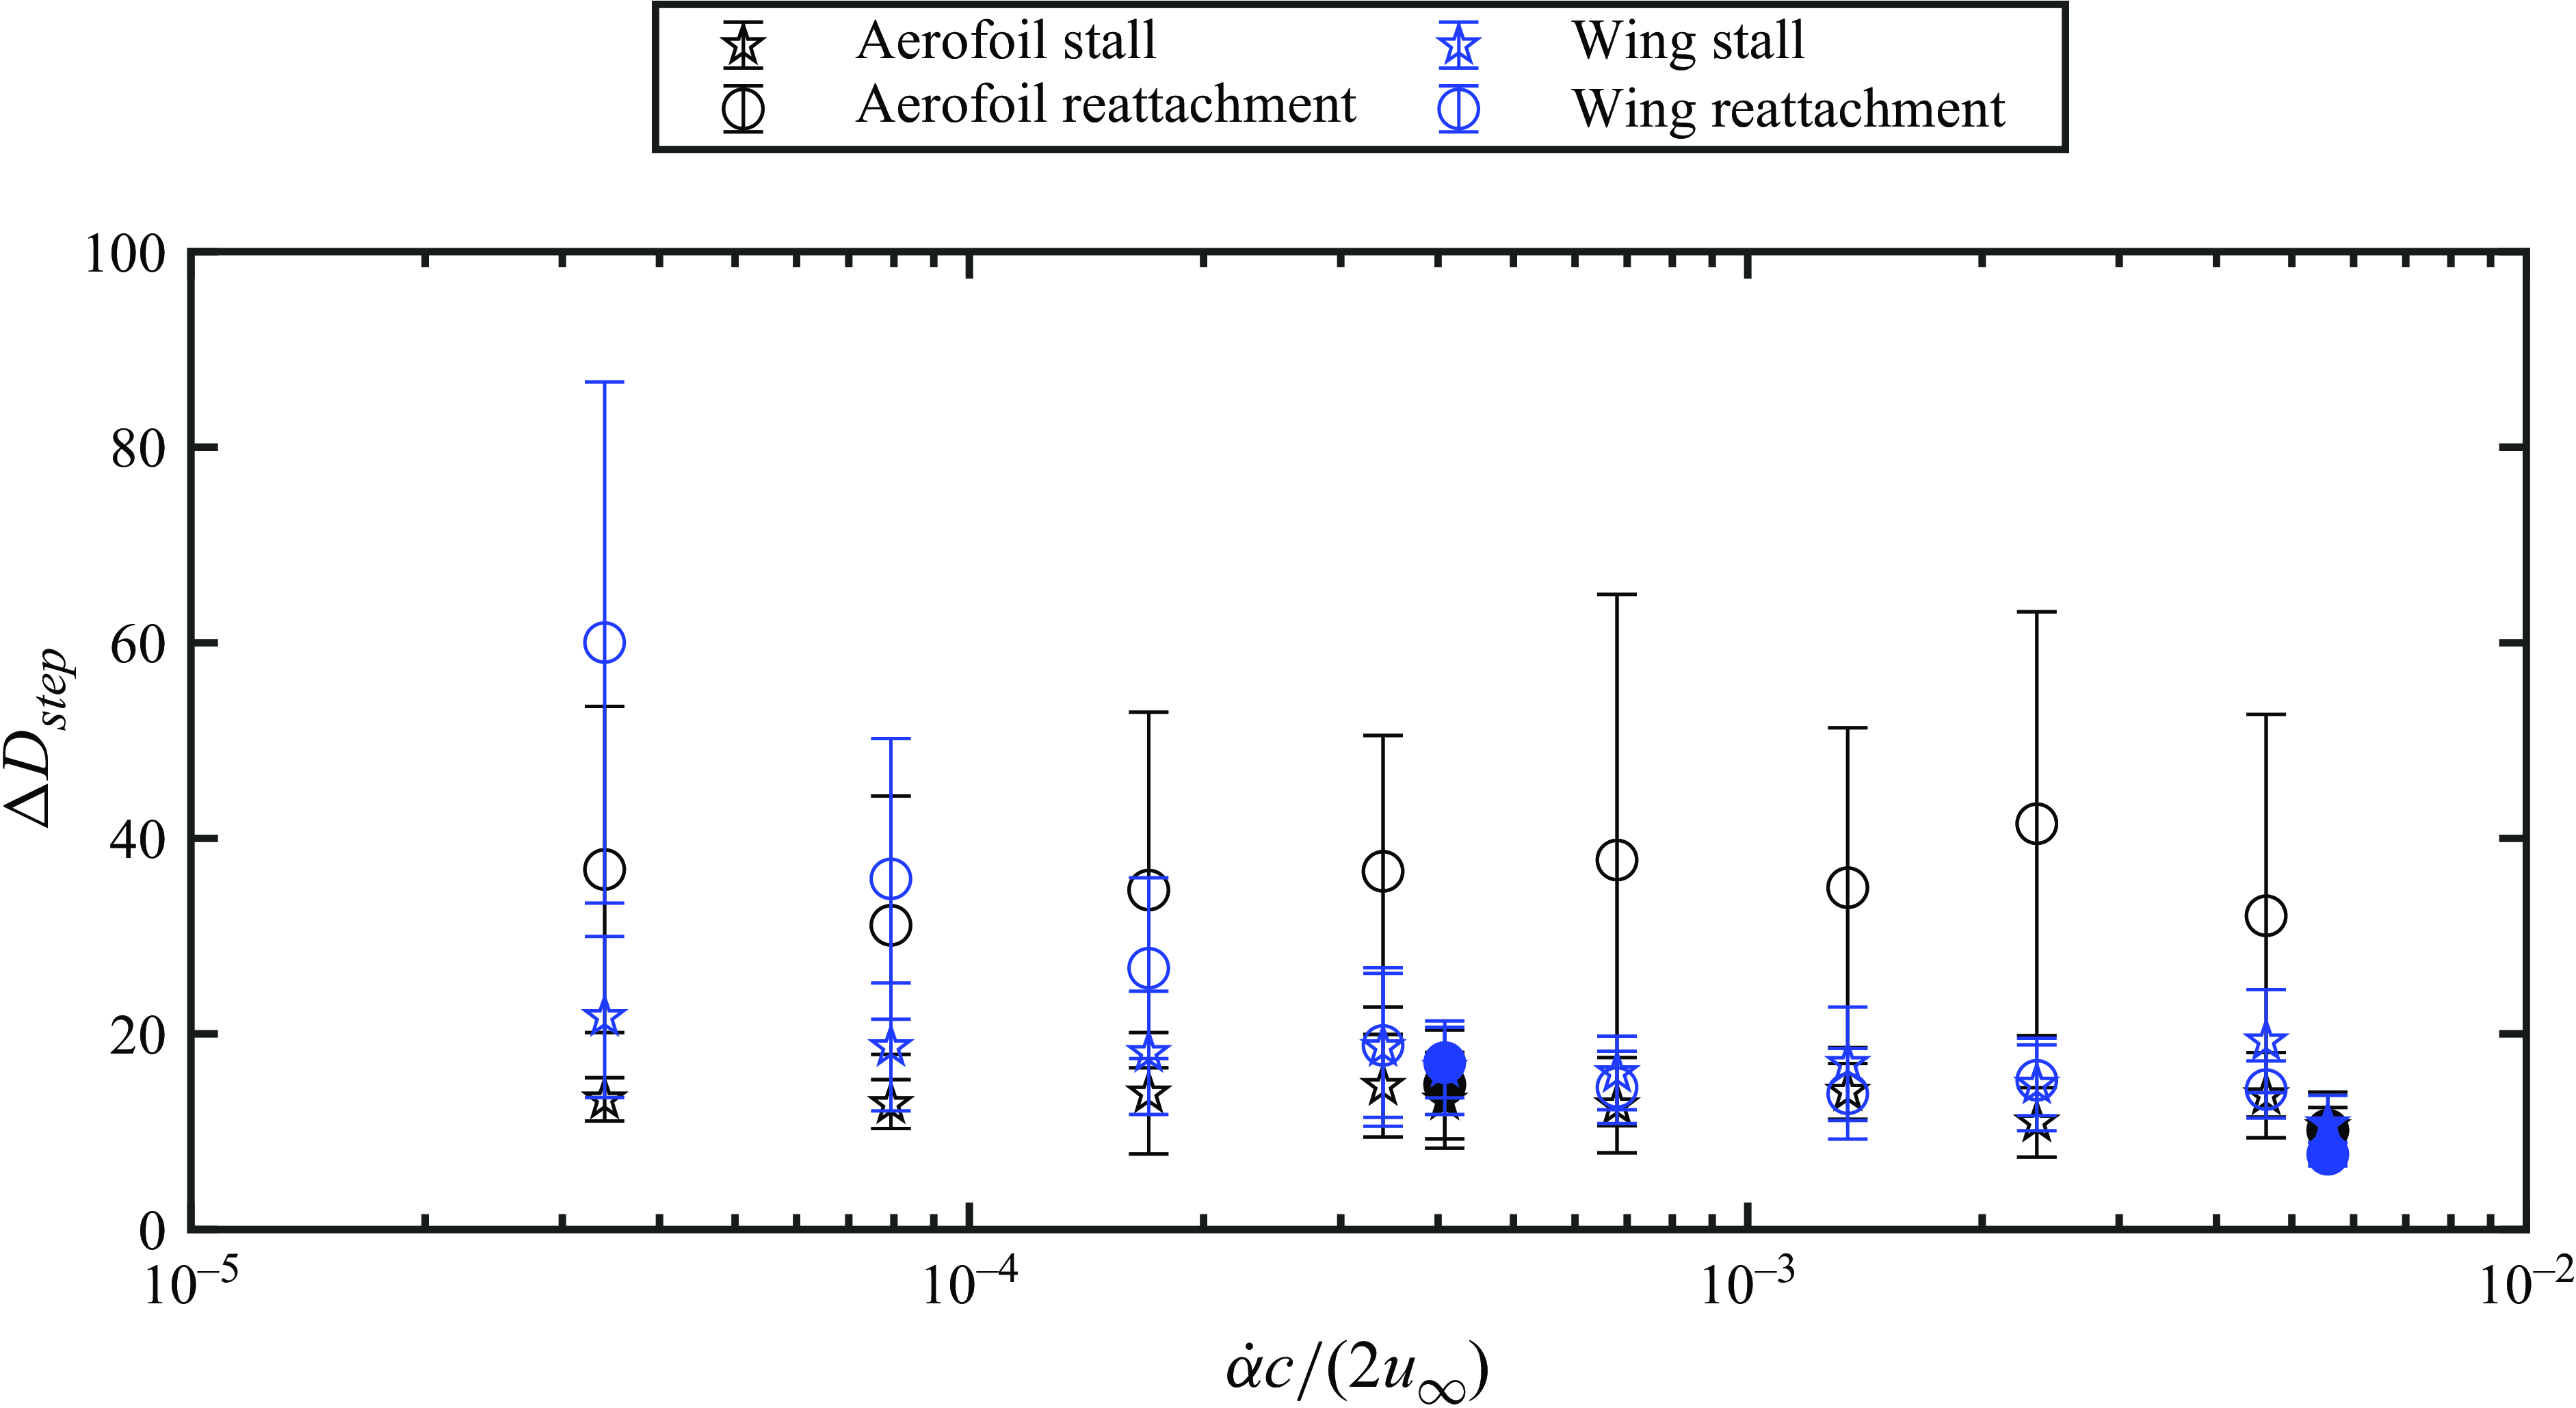
The ensemble-average step times ( $\Delta D_{{step}}$
defined in § 2.1), which describe the duration of the step change in lift coefficient, are presented in figure 24 for the pitching motions. The stall step times are largely insensitive to pitch rate, and are of the order of
$\Delta D_{{step}}$
defined in § 2.1), which describe the duration of the step change in lift coefficient, are presented in figure 24 for the pitching motions. The stall step times are largely insensitive to pitch rate, and are of the order of $10$
convective time units. This is of the order of the shortest step times that can be expected to be resolved by the force measurement system. However, the present measurements of the step time are close to the mean drop time of
$10$
convective time units. This is of the order of the shortest step times that can be expected to be resolved by the force measurement system. However, the present measurements of the step time are close to the mean drop time of $8$
convective time units reported by Le Fouest et al. (Reference Le Fouest, Deparday and Mulleners2021) for quasi-steady increases in angle of attack. The relatively short duration of the stall step times means that near the instant in time when the flow bifurcates between reattaching and stalled topologies, there are substantial unsteady effects in the flow’s response, even if the change in operating conditions is quasi-steady.
$8$
convective time units reported by Le Fouest et al. (Reference Le Fouest, Deparday and Mulleners2021) for quasi-steady increases in angle of attack. The relatively short duration of the stall step times means that near the instant in time when the flow bifurcates between reattaching and stalled topologies, there are substantial unsteady effects in the flow’s response, even if the change in operating conditions is quasi-steady.
For reattachment on the wing, there is a reduction in step time with increasing pitch rate for $\dot {\alpha }c/(2u_\infty )\lt 3\times 10^{-4}$
. This is attributed to the reduction in effective angle of attack near the wing tip enabling reattachment to progress more gradually in the spanwise direction (figures 19
b and 19
d). For the aerofoil, the ensemble-average and standard deviation of the reattachment step times are greater than those of stall across all of the pitch rates tested. Again, this is attributed to the proximity of the static reattachment condition to the final limiting flow state, since the step times for the wider angle change (filled symbols) are consistent with those of the wing.
$\dot {\alpha }c/(2u_\infty )\lt 3\times 10^{-4}$
. This is attributed to the reduction in effective angle of attack near the wing tip enabling reattachment to progress more gradually in the spanwise direction (figures 19
b and 19
d). For the aerofoil, the ensemble-average and standard deviation of the reattachment step times are greater than those of stall across all of the pitch rates tested. Again, this is attributed to the proximity of the static reattachment condition to the final limiting flow state, since the step times for the wider angle change (filled symbols) are consistent with those of the wing.
4. Concluding remarks
Experiments were performed on an aerofoil and wing model undergoing transient changes in operating conditions at aerodynamically low Reynolds numbers. Lift force and PIV measurements were performed during transient changes in angle of attack and Reynolds number to investigate the relationship between LSB bursting and formation, and transient aerodynamic loads.
For the wing and aerofoil models, the lift coefficients exhibited hysteresis with respect to angle of attack for quasi-steady and transient pitching motions. Even though the quasi-steady lift coefficients did not exhibit significant hysteresis for Reynolds number changes, significant transient hysteresis of the lift coefficients with respect to Reynolds number was identified for both models.
LSB bursting and formation transients caused by a change in angle of attack at constant Reynolds number and a change in Reynolds number at constant angle of attack were compared in detail. The comparison was made for imposed changes in operating conditions with durations of approximately $75$
convective time units. During an increase in angle of attack leading to LSB bursting, the transition location initially moves upstream, enabling the temporary formation of an LSB that is unsustainable against the stronger adverse pressure gradient and an overshoot in the lift coefficient. LSB bursting was subsequently initiated with a rapid downstream movement of the reattachment location, with a majority of the downstream movement occurring over a time period of the order of a single convective time unit. The bursting process was accompanied by a rapid loss of lift. In contrast, during a decrease in Reynolds number, there is a downstream movement in the transition location that results in continuous LSB lengthening before the rapid decrease in lift coefficient. For both types of transients leading to LSB bursting, the cessation of reattachment coincided with a decrease in the maximum magnitude of Reynolds shear stress and a decrease in vortex shedding frequency. For the transients leading to LSB formation, namely a decrease in angle of attack or an increase in Reynolds number, the initiation of reattachment coincided with an increase in the rate of change of the lift coefficient, and was accompanied by a gradual increase in the roll-up vortex shedding frequency. The nature of the imposed change in operating conditions leading to LSB formation did not substantially affect the trends for the streamwise movement of the transition and reattachment points, which settled to their final limiting locations within approximately
$75$
convective time units. During an increase in angle of attack leading to LSB bursting, the transition location initially moves upstream, enabling the temporary formation of an LSB that is unsustainable against the stronger adverse pressure gradient and an overshoot in the lift coefficient. LSB bursting was subsequently initiated with a rapid downstream movement of the reattachment location, with a majority of the downstream movement occurring over a time period of the order of a single convective time unit. The bursting process was accompanied by a rapid loss of lift. In contrast, during a decrease in Reynolds number, there is a downstream movement in the transition location that results in continuous LSB lengthening before the rapid decrease in lift coefficient. For both types of transients leading to LSB bursting, the cessation of reattachment coincided with a decrease in the maximum magnitude of Reynolds shear stress and a decrease in vortex shedding frequency. For the transients leading to LSB formation, namely a decrease in angle of attack or an increase in Reynolds number, the initiation of reattachment coincided with an increase in the rate of change of the lift coefficient, and was accompanied by a gradual increase in the roll-up vortex shedding frequency. The nature of the imposed change in operating conditions leading to LSB formation did not substantially affect the trends for the streamwise movement of the transition and reattachment points, which settled to their final limiting locations within approximately $15$
convective time units from the onset of reattachment. The downstream movement of the separation point during LSB formation was more gradual than that of the transition and reattachment points. Whenever reattachment was present, the trends in the movement of the transition location were similar to those of the reattachment location for all transients. In conclusion, the type of change in lifting surface operating conditions has a greater influence on the transient lift forces and streamwise LSB development during LSB bursting than during LSB formation.
$15$
convective time units from the onset of reattachment. The downstream movement of the separation point during LSB formation was more gradual than that of the transition and reattachment points. Whenever reattachment was present, the trends in the movement of the transition location were similar to those of the reattachment location for all transients. In conclusion, the type of change in lifting surface operating conditions has a greater influence on the transient lift forces and streamwise LSB development during LSB bursting than during LSB formation.
Using the top-view PIV configuration, the transient spanwise flow development was investigated on the aerofoil and wing models for pitching motions and Reynolds number changes. On both the aerofoil and wing models, LSB bursting resulted in a spanwise expansion of the region of massively separated flow from the midspan towards the ends of both models. On the aerofoil, the onset of massive separation was more uniform across the span than on the wing, where stall initiated closer to the wing root and progressed towards the wing tip. During the transients leading to LSB formation, there was a spanwise contraction of the region of massive separation from the ends of the models towards the midspan. No significant differences in spanwise flow development were observed for different pitch rates. The spanwise flow development for Reynolds number changes was similar to that observed for pitching motions, except that the onset of massive separation during the Reynolds number decrease for the aerofoil spread along the span more slowly than for the pitching motions.
The stall reaction delays of the aerofoil and wing for pitching motions follow the asymptotic behaviour observed by Ayancik & Mulleners (Reference Ayancik and Mulleners2022), and are similar to those observed in experiments at higher Reynolds numbers (Kiefer et al. Reference Kiefer, Brunner, Hansen and Hultmark2022). This suggests that the initial stages of dynamic stall for both types of lifting surfaces are largely governed by the formation and downstream convection of the DSV in a manner that is relatively Reynolds number insensitive, in agreement with previous studies. However, the degree to which the static stall or reattachment conditions were exceeded affected the timing of the lift force response to transient pitching motions, with a notable reduction in the variance of the reaction delay for reattachment on the aerofoil for pitching motions with larger angular displacements. The relatively large variance in reaction delay for reattachment on the aerofoil for the smaller angular displacement highlights the sensitivity of the transition process to aerofoil kinematics and random external perturbations in unsteady conditions at low Reynolds numbers.
Supplementary movies
Supplementary movies are available at https://doi.org/10.1017/jfm.2025.348.
Funding
The authors gratefully acknowledge the Natural Sciences and Engineering Research Council of Canada for funding this work.
Declaration of interests
The authors report no conflict of interest.
Data availability
The data that support the findings of this study are available from the corresponding author upon reasonable request.
Author contributions
Connor Toppings: Conceptualisation, Methodology, Software, Formal analysis, Investigation, Data curation, Writing – original draft, Writing – review & editing, Visualisation. Serhiy Yarusevych: Conceptualisation, Methodology, Formal analysis, Resources, Data curation, Writing – review & editing, Visualisation, Supervision, Project administration, Funding acquisition.


 Open access