

“It’s a great day for democracy in the Tar Heel State.”
—Dennis Blair, chair of No Labels Party of North Carolina
(Ingram Reference Ingram2023)If there was any state well positioned for the No Labels Party to grow, it was North Carolina. The battleground state has seen a rise in the number of voters who avoid registering with a political party and instead register as “Unaffiliated.” In September 2017, the number of Unaffiliated voters surpassed the number of Republican voters in the state. Five years later, Unaffiliated surpassed Democrats to become the largest group of registered voters in North Carolina (Bitzer et al. Reference Bitzer, Cooper, Manzo and Roberts2022; Cooper Reference Cooper2024). Clearly, North Carolina voters were signaling some form of dissatisfaction with the two major parties. Further, the national cochair of the No Labels Party was former Charlotte mayor and North Carolina Governor Pat McCrory (Harrison Reference Harrison2023), providing a potential home-state advantage for the fledgling party.
Sensing that voters were ready for change, the No Labels Party gathered signatures throughout the state in the summer of 2023. On August 13, 2023, the North Carolina State Board of Elections (NCSBE) recognized No Labels as a political party in a 4–1 vote. No Labels eventually gained ballot access in 21 states, but on April 4, 2024, it ended its 2024 election hopes because it did not want to act as a spoiler in the presidential election (Mueller and Trudo Reference Mueller and Trudo2024). On June 24, 2025, the NCSBE announced that all North Carolinians who registered with No Labels would be moved to Unaffiliated registration because the party had not achieved the threshold needed to remain an official party.
Even before it was named an official political party, No Labels was shrouded in controversy. Many questioned its funding (Corn and Choma Reference Corn and Choma2023), whereas others worried that one of the other major political parties would benefit from its entrance into races (Kurtzleben Reference Kurtzleben2023). Others still questioned the name: Would voters be aware of the difference between No Labels and Unaffiliated (Campbell Reference Campbell2023b)? Lastly, there was the question of viability. Third parties in American politics have had a hard time staying on the ballot. Would No Labels represent a new sustainable party, or would it join the Reform Party, the Bull Moose Party, and any number of other third parties as a temporary fad?
THIRD PARTIES IN AMERICAN POLITICS
Americans have long bemoaned the two-party system and argued for a third option (Collet Reference Collet1996). A sizable proportion of Americans hold negative attitudes toward the two major parties, and many see them as too ideological (Klar and Krupnikov Reference Klar and Krupnikov2016). Antipathy toward the two major parties and the two-party system has been felt by North Carolinians as well. The Meredith Poll, which has polled about polarization in the state since 2018, has consistently found that more than half (between 55% to 63%) of North Carolinians report wanting a third party.
Third parties in American politics may have small pockets of opportunity where they gain ballot access and sometimes even win elections, but empirical evidence is clear that their odds of long-term success are slim. Institutional barriers to entry mean that third parties must do additional work simply to gain ballot access. States with stringent signature requirements have fewer candidates running for governor (Dowling and Lem Reference Dowling and Lem2009) and the US Senate than do states with less burdensome requirements (Burden Reference Burden2007). Given these barriers it is perhaps not surprising that third parties often do not attract high-profile candidates (Rosenstone, Behr, and Lazarus Reference Rosenstone, Behr and Lazarus1984).
Even if they are successful in gaining ballot access, third-party candidates lose a disproportionate amount, even when compared to candidates without a party label (Hood and McKee Reference Hood and McKee2022). Although third-party candidates’ polling numbers might indicate a potentially positive trajectory early in the campaign, their popularity inevitably declines as election day draws closer (Burden Reference Burden2005). As a result, analyses of third parties in American politics often take the form of case studies of particular movements or candidates, whether they be Ross Perot (Owen and Dennis Reference Owen and Dennis1996), Jesse “the Body” Ventura (Lentz Reference Lentz2002), or George Wallace (Gillespie Reference Gillespie1993).
In addition to ballot access and electoral success, some researchers have studied the potential for vote-stealing effects of third parties. Third parties may both increase turnout (because some people will be inspired to vote for the third party who would otherwise have stayed home) and take votes away from one of the two major parties (because votes that would have gone to a major party go instead to the third party). Evidence from Ross Perot’s presidential run is particularly compelling (Lacy and Burden Reference Lacy and Burden1999), as are data from Ralph Nader’s 2000 campaign for the White House (Herron and Lewis Reference Herron and Lewis2007).
Although this literature is rich and helpful in understanding third-party barriers to ballot access and electoral success (Schraufnagel Reference Schraufnagel2011), we know remarkably little about the role of voters and citizens in the process of third-party creation. Who are the early adopters of a third-party movement? Do they come from one of the major parties, or are they new voters? And what does the public think about a third party as it emerges?
THE CASE OF NO LABELS IN NORTH CAROLINA
The No Labels Party was founded in 2010 with the stated goal of reducing partisan dysfunction in Washington, DC. Over the next several years, it hosted informal meetings at the Capitol with both Democrats and Republicans to try to foster bipartisanship, and in 2017 it succeeded in helping establish the congressional Problem Solvers caucus. The movement gained nationwide attention in 2023 when it announced that it would create a 2024 “Unity” presidential ticket made up of one Democrat and one Republican.
Despite the small blip in popularity, by April 2024 No Labels’ momentum had fizzled. Its cofounder and chief candidate recruiter, former Senator Joe Lieberman, had passed away unexpectedly in March, and the other cochair, North Carolina’s Pat McCrory, stepped down soon thereafter (Harrison Reference Harrison2024). Perhaps as a result, they could not find any candidate with name recognition to run under the No Labels banner. The party had repeatedly said that it did not intend to serve as spoiler in the presidential election, so once the leadership determined that they could not nominate someone with “a credible path to winning the White House,” they stopped campaigning altogether (Hillyard, Koretski, and Ruhle Reference Hillyard, Koretski and Ruhle2024).
For this analysis, we use North Carolina as a case study. No Labels began systematically gathering signatures in North Carolina in 2023, eventually gathering 14,837 signatures across all congressional districts—just enough to clear the state’s requirement of 13,865 signatures. The NCSBE delayed its first vote on certification because of concerns that signees of the petition were not properly informed about what they were signing but eventually certified the party to appear on the 2024 ballot in August 2023 (Campbell Reference Campbell2023a). The party had not yet reached its second birthday in North Carolina when the NCSBE removed No Labels from its official party list in June 2025.
North Carolina’s experience is, of course, not generalizable to every state across the country, but single case studies can be valuable, particularly when they have institutional features that can inform larger theoretical questions (Nicholson-Crotty and Meier Reference Nicholson-Crotty and Meier2002). North Carolina has several attributes that make it an ideal place to address questions surrounding third-party emergence and persistence.
North Carolina’s status as a battleground state has been noted over several election cycles (Cooper Reference Cooper2024), with the margins of victories for statewide contests on the knife’s edge. For a long time it has been a state where voters split their ballots (DeVries Reference DeVries, Beyle and Black1975), and that pattern continues. In the 2020 election, for example, Republican presidential incumbent Donald Trump won the state by 1.3 percentage points, while Democratic gubernatorial incumbent Roy Cooper secured reelection with a 4.5 percentage point margin. The 2024 election yielded even more split-ticket outcomes when the majority of the state’s voters opted for Donald Trump for president but elected Democrats to 5 of the state’s 10 statewide races, including governor, lieutenant governor, and attorney general (Bitzer Reference Bitzer, Bullock and Rozell2025).
North Carolina is also a semi-closed primary state, meaning that Unaffiliated voters can choose which party primary they wish to vote in, but registered members of each political party can only vote in their respective party primaries (Bitzer et al. Reference Bitzer, Cooper, Manzo and Roberts2022). This type of party primary is associated with an increasing tendency of voters to register as Unaffiliated (Hood et al. Reference Hood, McKee, Shino and Smith2025). It may also affect who might register with No Labels, because changing one’s registration from Unaffiliated to a party limits primary voting options.
North Carolina mirrors many national trends and dynamics in American politics, from demographic and political variables to the intensity of partisan competition for statewide offices and the urban–rural division within its political geography (Cooper Reference Cooper2024). North Carolina also has publicly available voter registration and voter history data through the NCSBE, which scholars have used to examine several important questions about American politics (Cooper, Haspel, and Knotts Reference Cooper, Haspel and Knotts2009).
REGISTRATION TRENDS
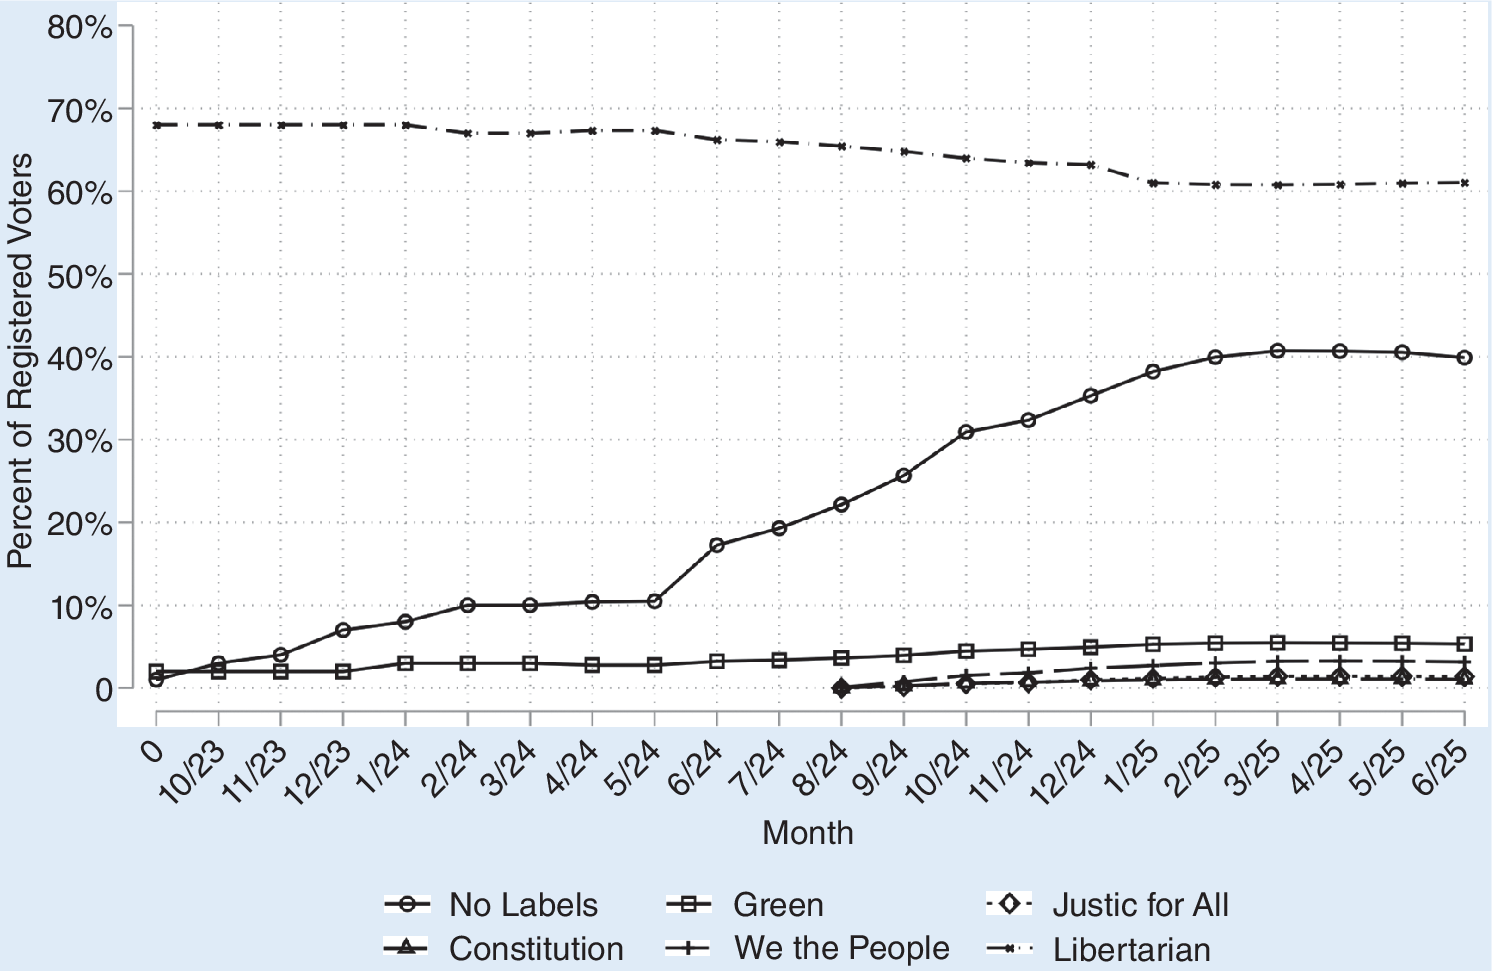
We begin with a descriptive look at third-party registration by month in North Carolina from September 1, 2023 (the first month that No Labels was an option in party registration) through June 24, 2025, when the party was officially removed from the state’s list of registered political parties. In addition to No Labels, the Justice for All, We the People, and Constitution Parties were also created and disbanded in this period. The percentage of North Carolina’s registered voter pool in each third party is shown in figure 1.
Third Party Share of NC Registered Voters, September 2023 to June, 2025
Data from NCSBE; graph and analysis by authors. All but the Libertarian and Green Party registrants were converted to Unaffiliated on June 24, 2025.
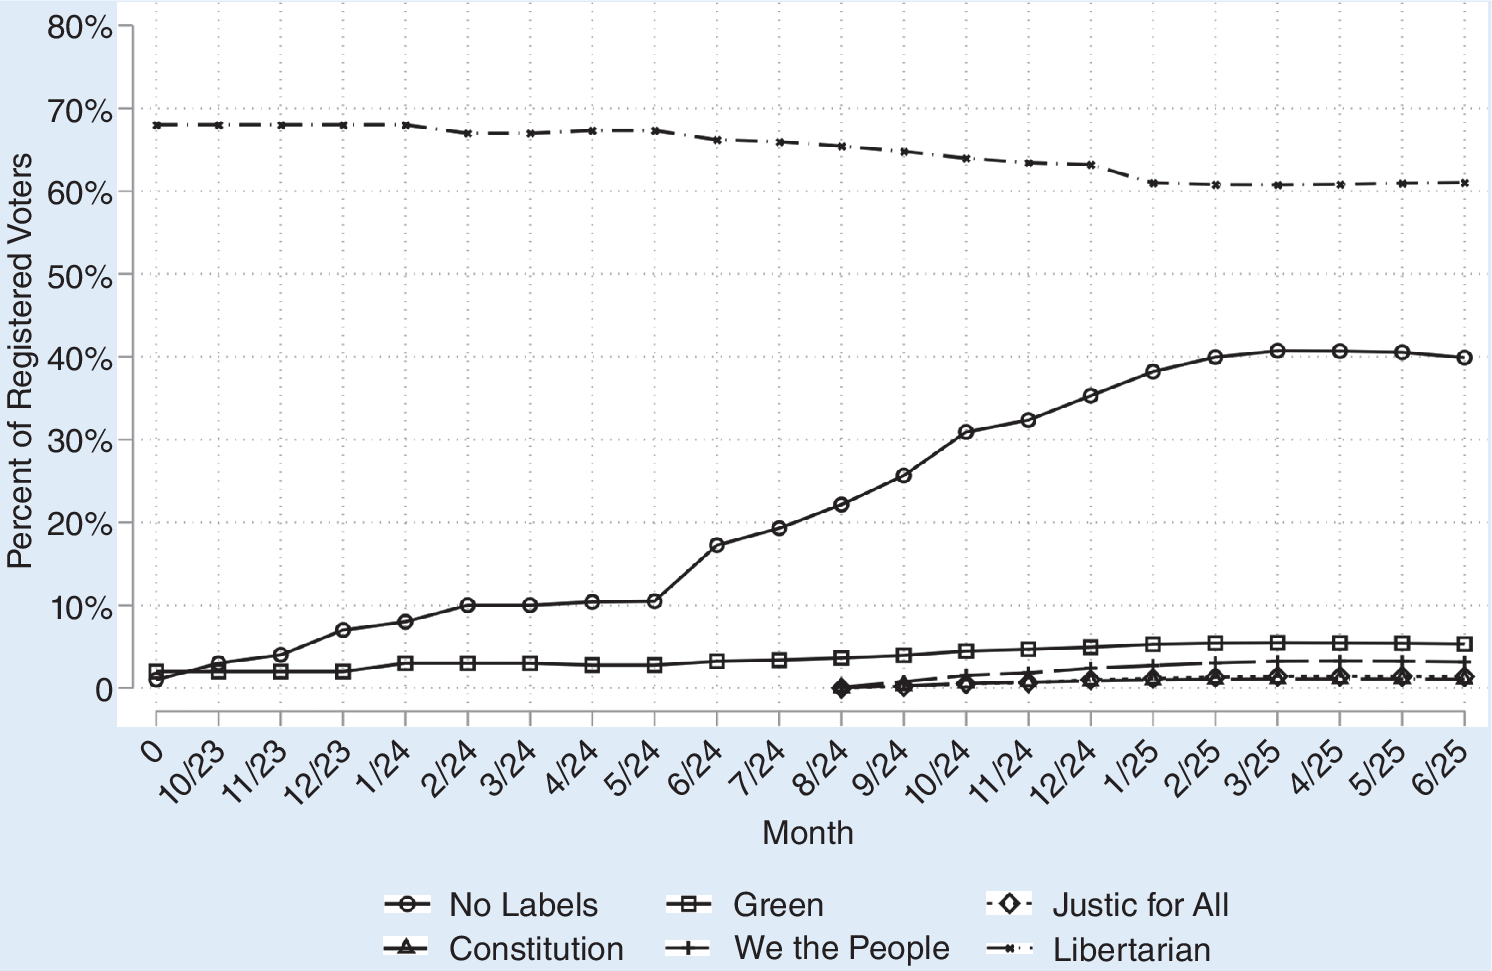
Figure 1 Long description
The Y-axis is labeled Percent of Registered Voters ranging from 0 to 80 percent in 10 percent increments. The X-axis is labeled Month, spanning from 0 (September 2023) to 6 forward slash 25 (June 2025).
* Libertarian: Represented by a dashed line with x-markers. It begins at approximately 68 percent, remains relatively stable with a slight decline, and ends at roughly 61 percent.
* No Labels: Represented by a solid line with circle markers. It starts near 1 percent, shows a significant upward trend beginning in 5 forward slash 24, peaking at 41 percent in 3 forward slash 25, and ending at 40 percent.
* Green: Represented by a solid line with square markers. It maintains a steady, very slight increase from 2 percent to approximately 5 percent.
* We the People: Represented by a solid line with plus markers starting in 8 forward slash 24. It rises from 0 to approximately 3 percent.
* Constitution: Represented by a solid line with triangle markers starting in 8 forward slash 24. It rises from 0 to approximately 1 percent.
* Justice for All: Represented by a dotted line with diamond markers starting in 8 forward slash 24. It remains just above 0 percent through June 2025.
As figure 1 illustrates, the No Labels Party almost immediately surpassed the Green Party membership in North Carolina and continued to creep up over time. Membership in the Libertarian Party (the longest active third party in North Carolina) dropped slightly when No Labels was recognized and again when other third parties came on the ballot. Although figure 1 demonstrates that No Labels did grow over the course of its life, it never surpassed even half of 1% of the overall registered voter pool in North Carolina and always had fewer members than the Libertarian Party.
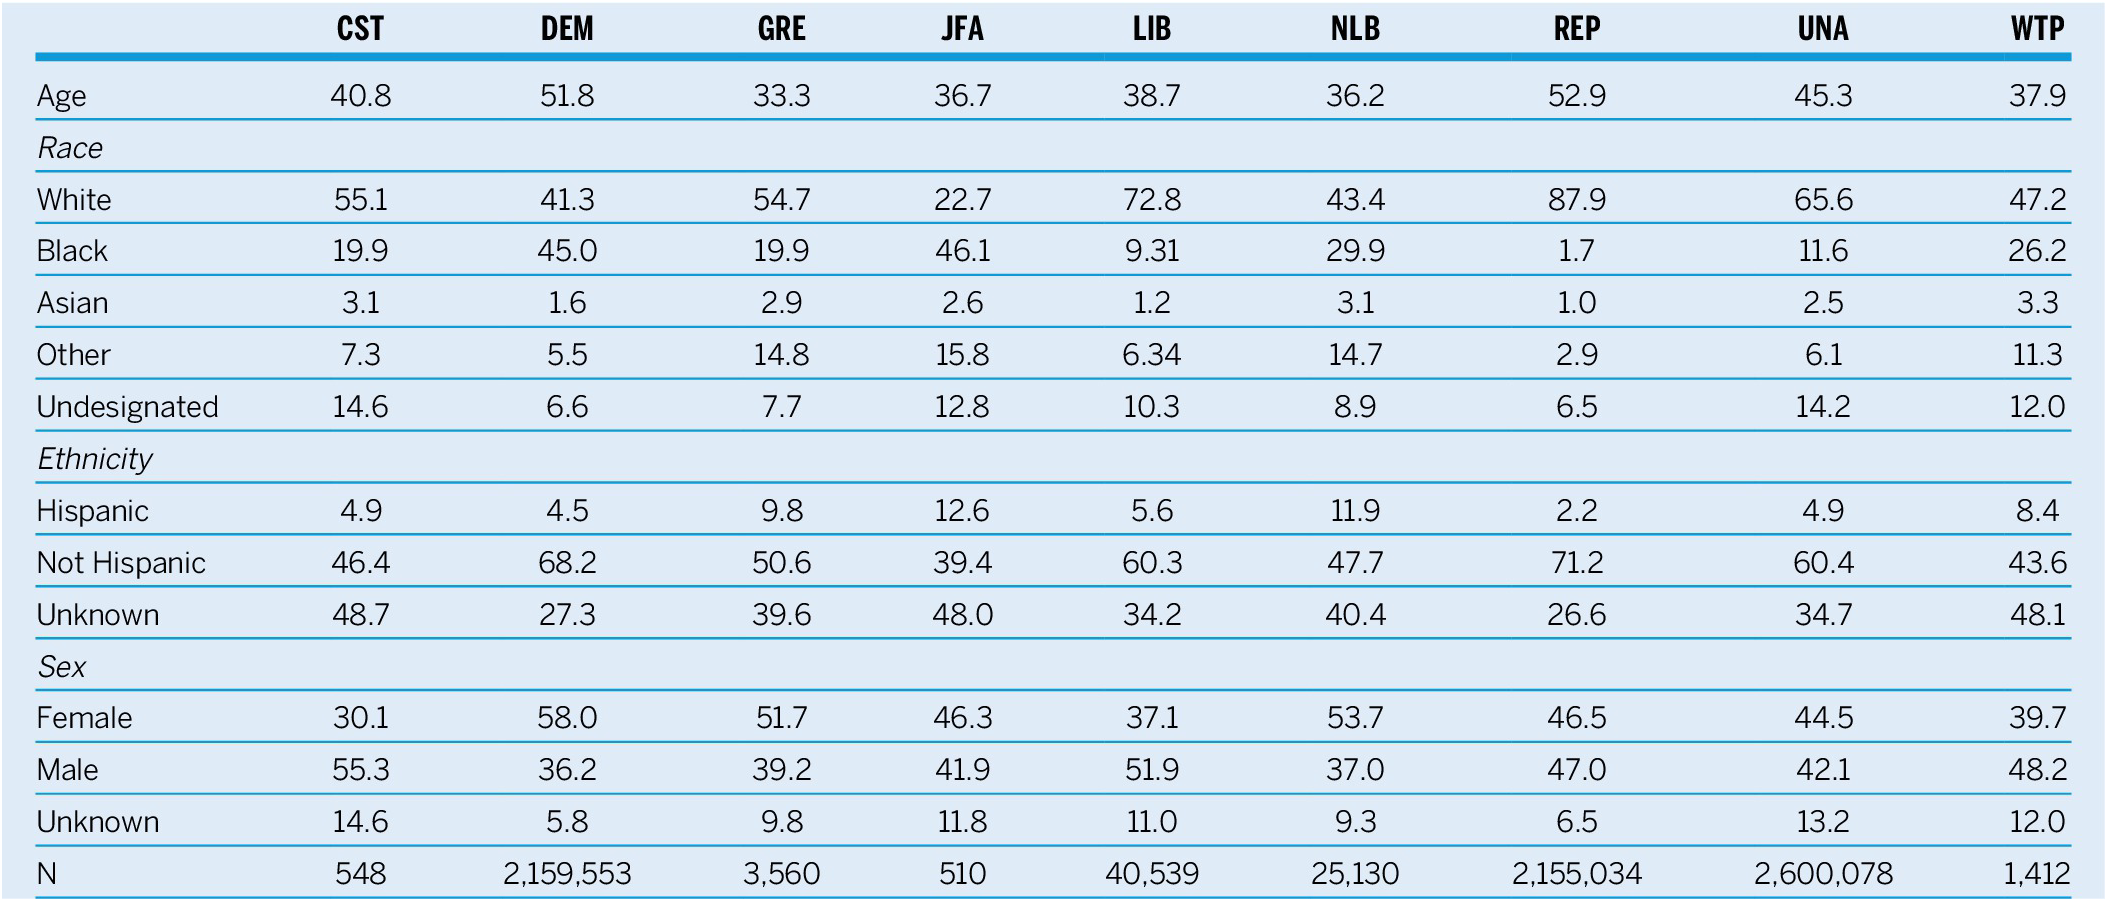
Next, we examine the nature of the No Labels registrants in comparison to the other seven recognized political parties in North Carolina that were active at the time, as well as the Unaffiliated. Table 1 shows the demographic breakdown of each group of registrants in terms of age, race, ethnicity, and gender. The average No Labels registrant was younger (mean = 38 years old) than members of the two major political parties (mean = 52 and 53 years old) and Unaffiliated registrants (mean = 45 years old) and was comparable in age to members of the other third parties.
Comparing Demographics by Political Party
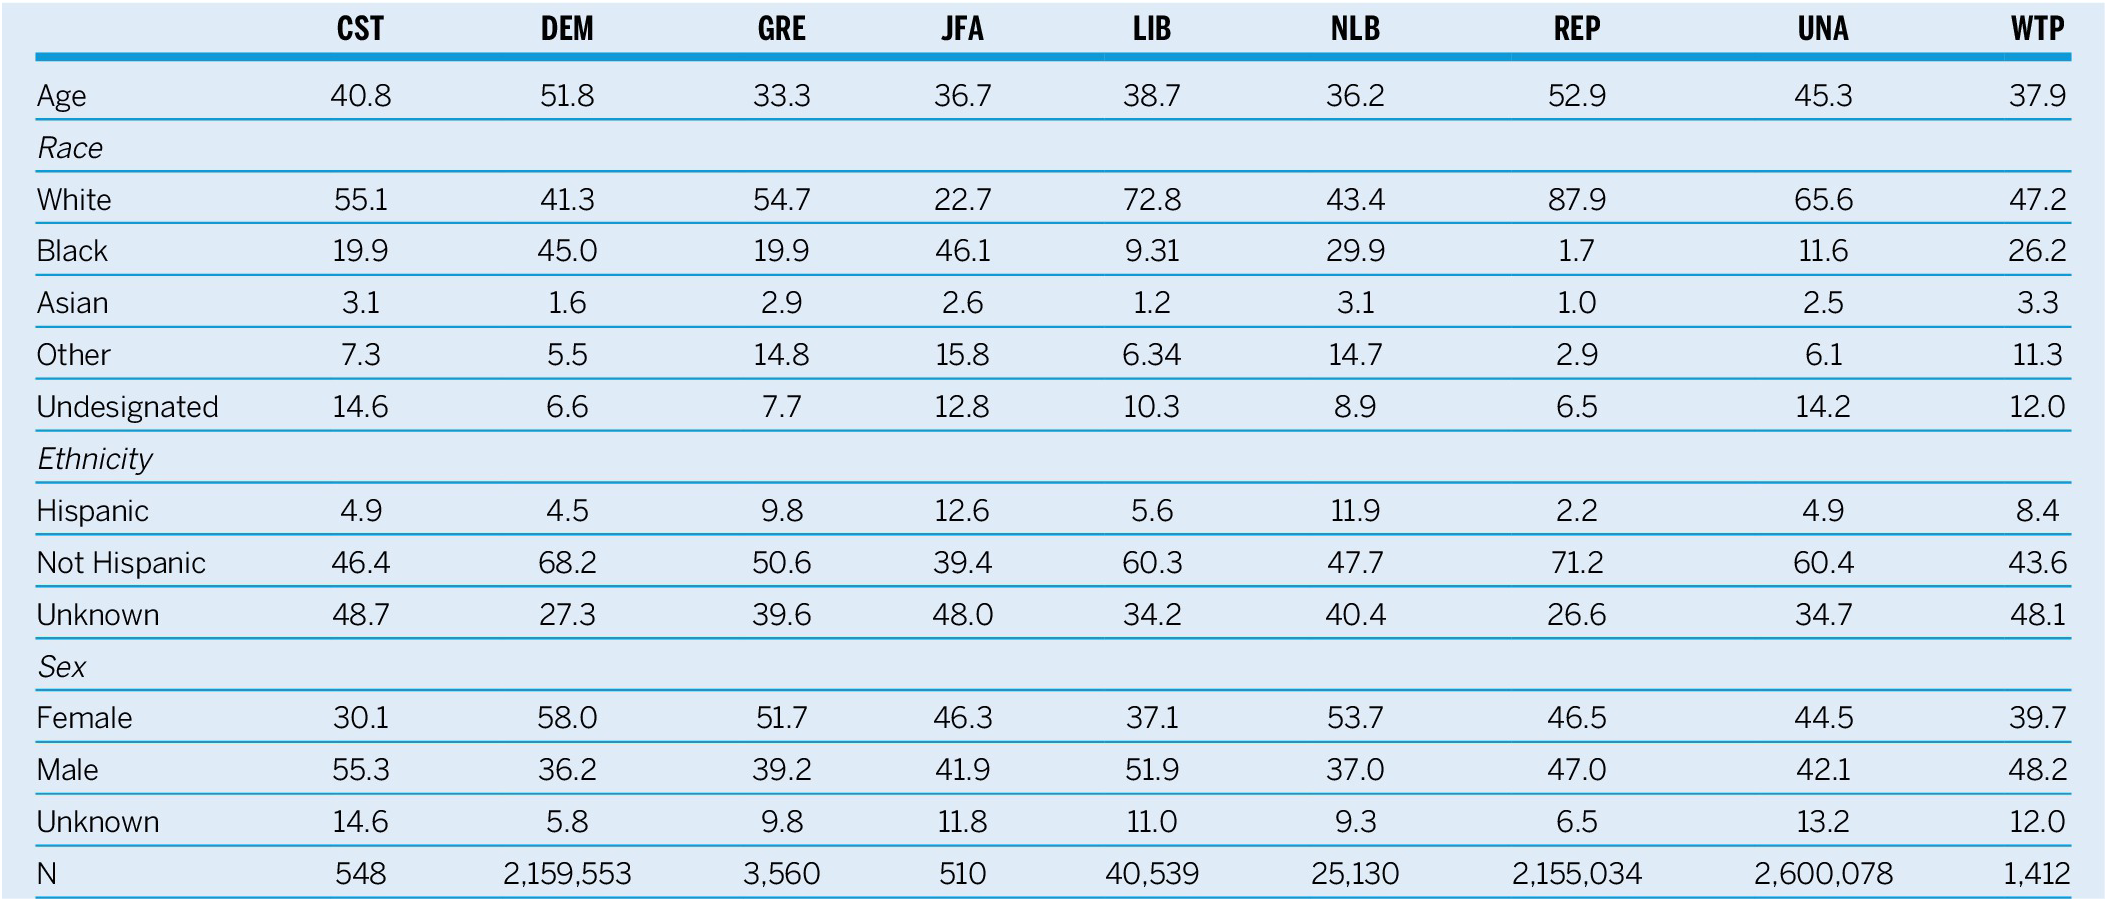
Table 1 Long description
The table columns represent nine political groups: C S T, D E M, G R E, J F A, L I B, N L B, R E P, U N A, and W T P.
Age: Ranging from a low of 33.3 for G R E to a high of 52.9 for R E P.
Race:
- White: Highest in R E P at 87.9 and L I B at 72.8; lowest in J F A at 22.7.
- Black: Highest in J F A at 46.1 and D E M at 45.0; lowest in R E P at 1.7.
- Asian: Consistently low across all parties, ranging from 1.0 to 3.3.
- Other: Highest in J F A at 15.8 and G R E at 14.8.
- Undesignated: Ranges from 6.5 to 14.6.
Ethnicity:
- Hispanic: Highest in J F A at 12.6 and N L B at 11.9.
- Not Hispanic: Highest in R E P at 71.2 and D E M at 68.2.
- Unknown: Ranges from 26.6 to 48.7.
Sex:
- Female: Highest in D E M at 58.0 and N L B at 53.7.
- Male: Highest in C S T at 55.3 and L I B at 51.9.
- Unknown: Ranges from 5.8 to 14.6.
Total Sample Size N: The largest groups are U N A at 2,600,078, D E M at 2,159,553, and R E P at 2,155,034. The smallest is J F A at 510.
Notes. Data from NCSBE Voter Registration file and include Active and Inactive voters only. CST=Constitution Party; Dem=Democratic Party; GRE=Green Party; JFA=Justice for All Party; LIB=Libertarian Party; NLB=No Labels Party; REP=Republican Party; UNA=Unaffiliated; WTP= We the People Party. “Other” race includes those coded “other,” as well as those who identified as “Indian American,” Native Hawaiian,” or “two or more races.” All analysis was performed on the November 5, 2024, voter registration file snapshot, maintained by the North Carolina State Board of Elections.
No Labels registrants were also more diverse in terms of race than all other party groups, except for Democrats and Justice for all; it was more diverse in terms of ethnicity than other party groups except for Justice for All. No Labels joined Greens and Democrats as the only parties in which a majority of registrants identify as female. It is important to note that an increasing number of registrants from all groups, including No Labels, are leaving demographic questions blank, leading to a large number of unknowns in table 1 (Cooper and Bitzer Reference Cooper and Bitzer2025).
PARTY-SWITCHING TRENDS
There are two possible ways to become a party registrant—either the individual registers with a party when completing their initial voter registration in the state, or they switch from one party to another. Party switching has been examined among officeholders (e.g., Yoshinaka and McKee Reference Yoshinaka and McKee2019), but we are not aware of any extant work that examines the degree to which third-party registrants switched their parties to attain that status.
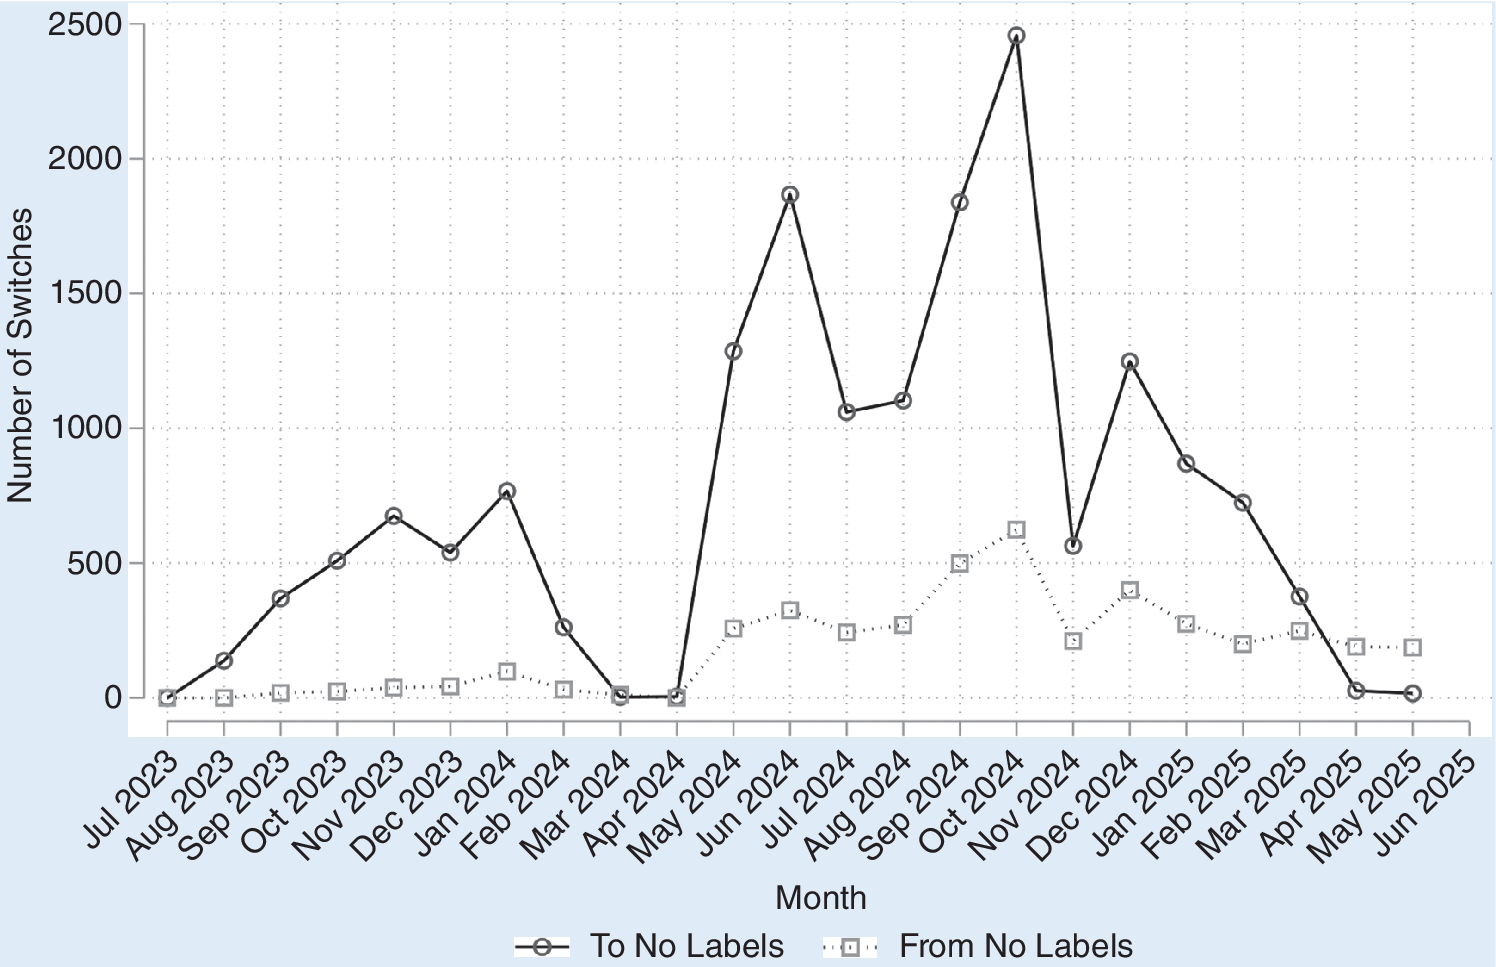
Figure 2 shows the number of switches to and from the No Labels by month, spanning the life of the party. As it demonstrates, many No Labels registrants did join the party by changing their political party affiliation.
Number of Party Switches to and from the No Labels Party by Month
Data from NCSBE; graph and analysis by authors. Party switching was frozen in March and April 2024 because of the North Carolina primary elections.
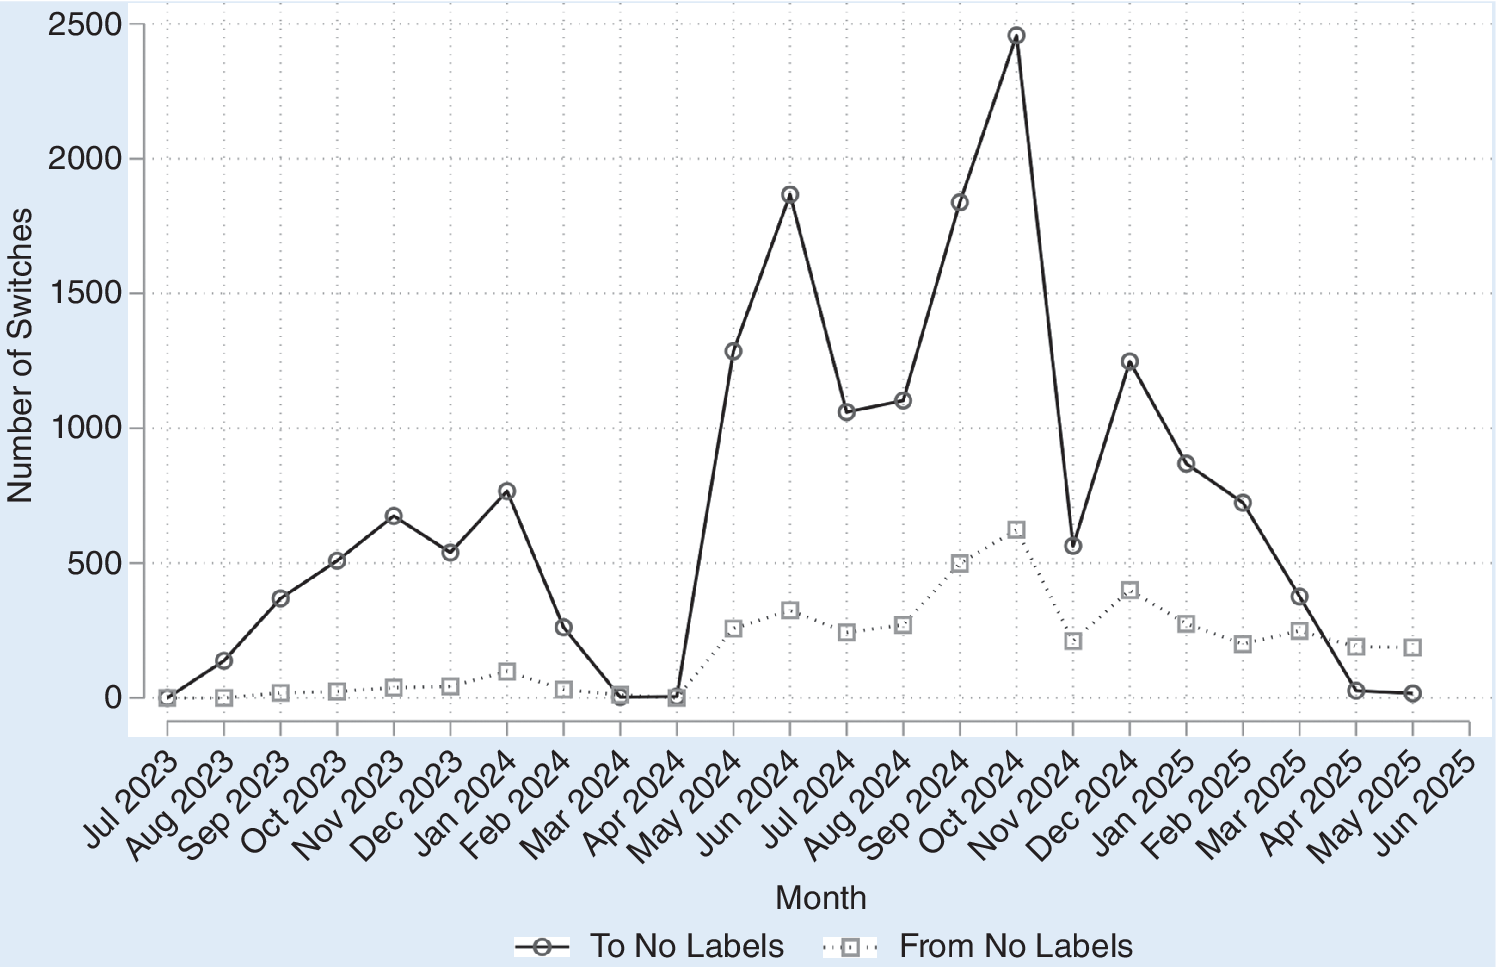
Figure 2 Long description
The X-axis represents the Month from July 2023 to June 2025. The Y-axis represents the Number of Switches from 0 to 2500. Two lines are plotted.
* The ‘To No Labels’ series (solid black line with circles) starts at 0 in July 2023, rises to a peak of approximately 750 in January 2024, then drops to 0 in March and April 2024. It surges to a major peak of nearly 2500 in October 2024 before declining sharply to near 0 by April 2025.
* The ‘From No Labels’ series (dotted gray line with squares) remains very low (near 0) until May 2024. It reaches a peak of approximately 600 in October 2024, mirroring the timing of the primary peak but at a much lower volume, before tapering off toward June 2025.
Both series show a complete flatline at zero during March and April 2024.
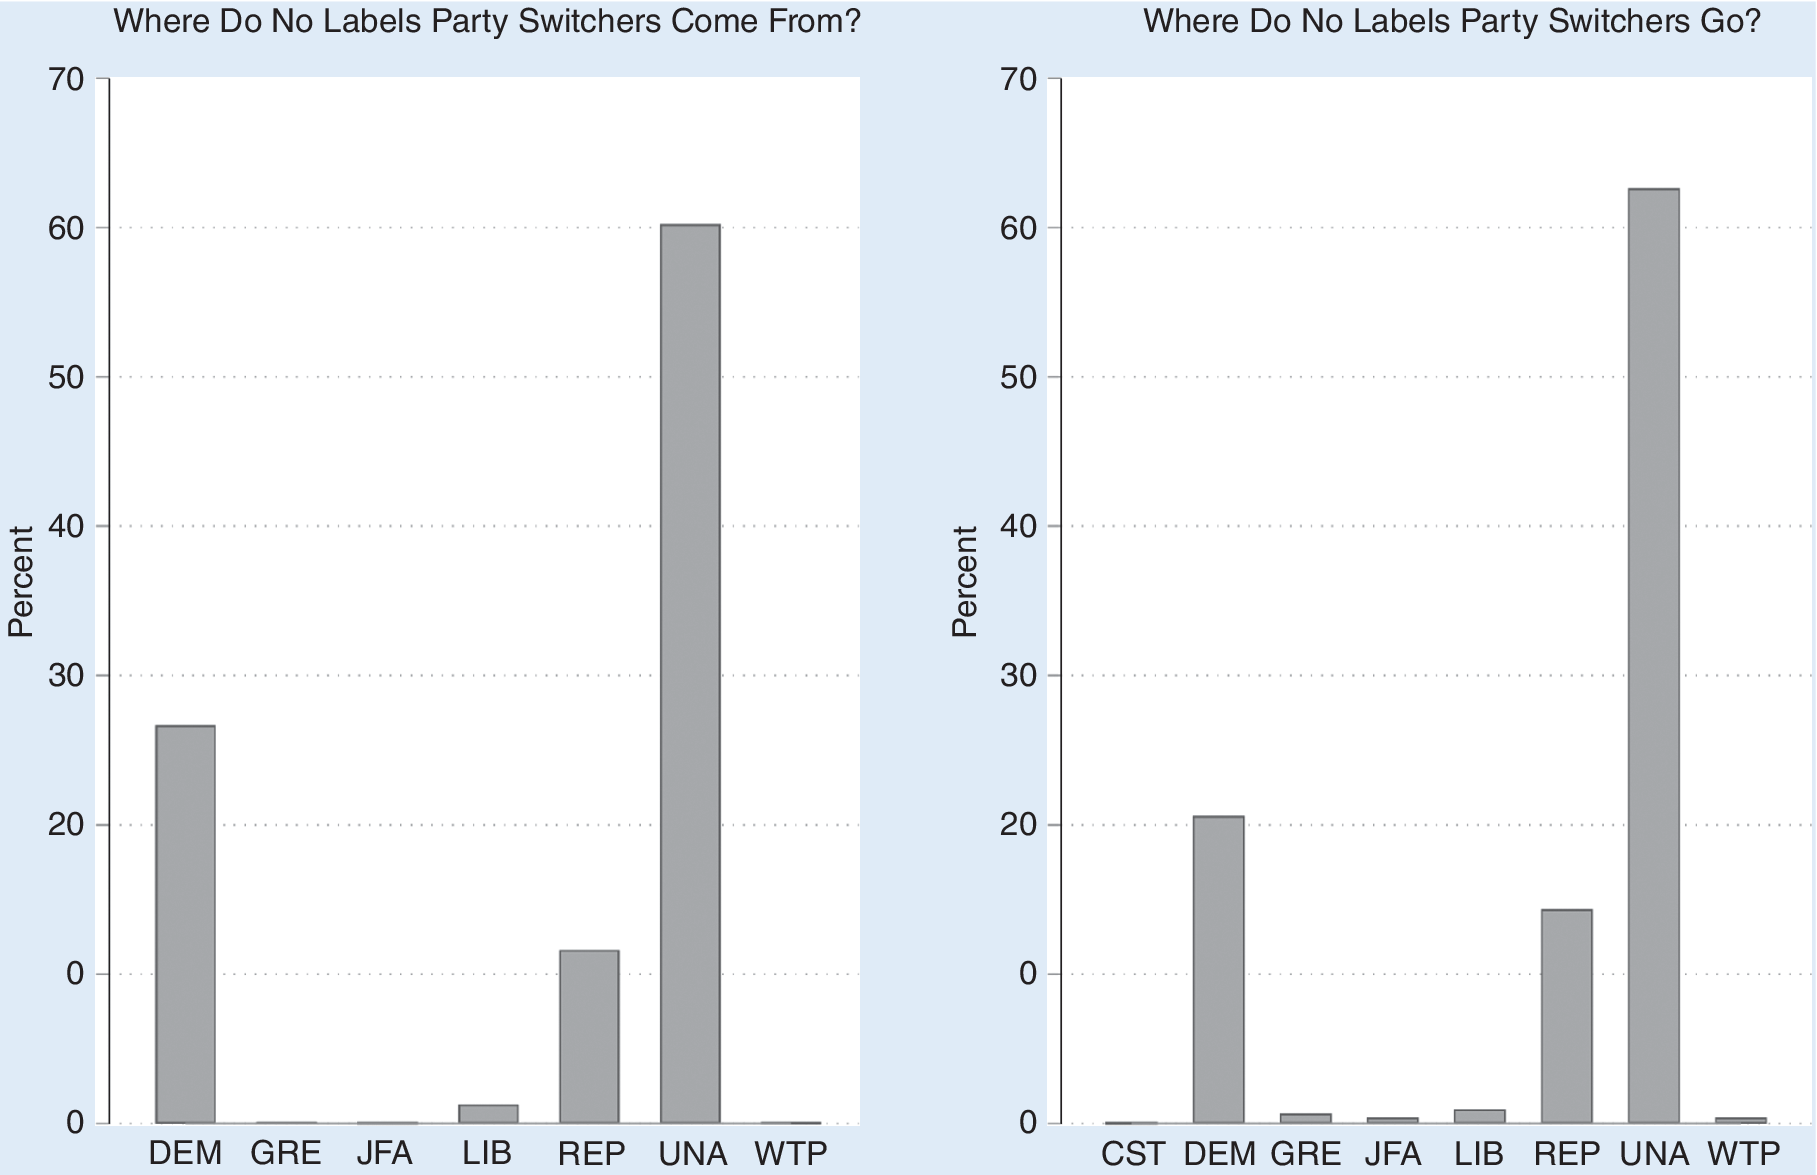
Next, we focus on the specifics of the No Labels switches. Figure 3 shows the previous party affiliation of people who switched to No Labels (on the left pane) and the new affiliation of people who left the No Labels Party (on the right). Unaffiliated switches dominate both panes of the graph. The plurality of No Labels Party switchers came from Unaffiliated registration, followed by Democrats and then Republicans. When people left No Labels, they tended to switch to Unaffiliated rather than to one of the two major parties. As a whole, the presence of the No Labels Party did not appear to cause a large number of registrants to abandon any of the previously existing political parties. It was, at least in terms of party switching, not a threat to preexisting patterns of partisanship.
As a whole, the presence of the No Labels Party did not appear to cause a large number of registrants to abandon any of the previously existing political parties. It was, at least in terms of party switching, not a threat to preexisting patterns of partisanship.
Party-Switching Patterns of No Labels Registrants
Data from NCSBE; graph and analysis by authors.
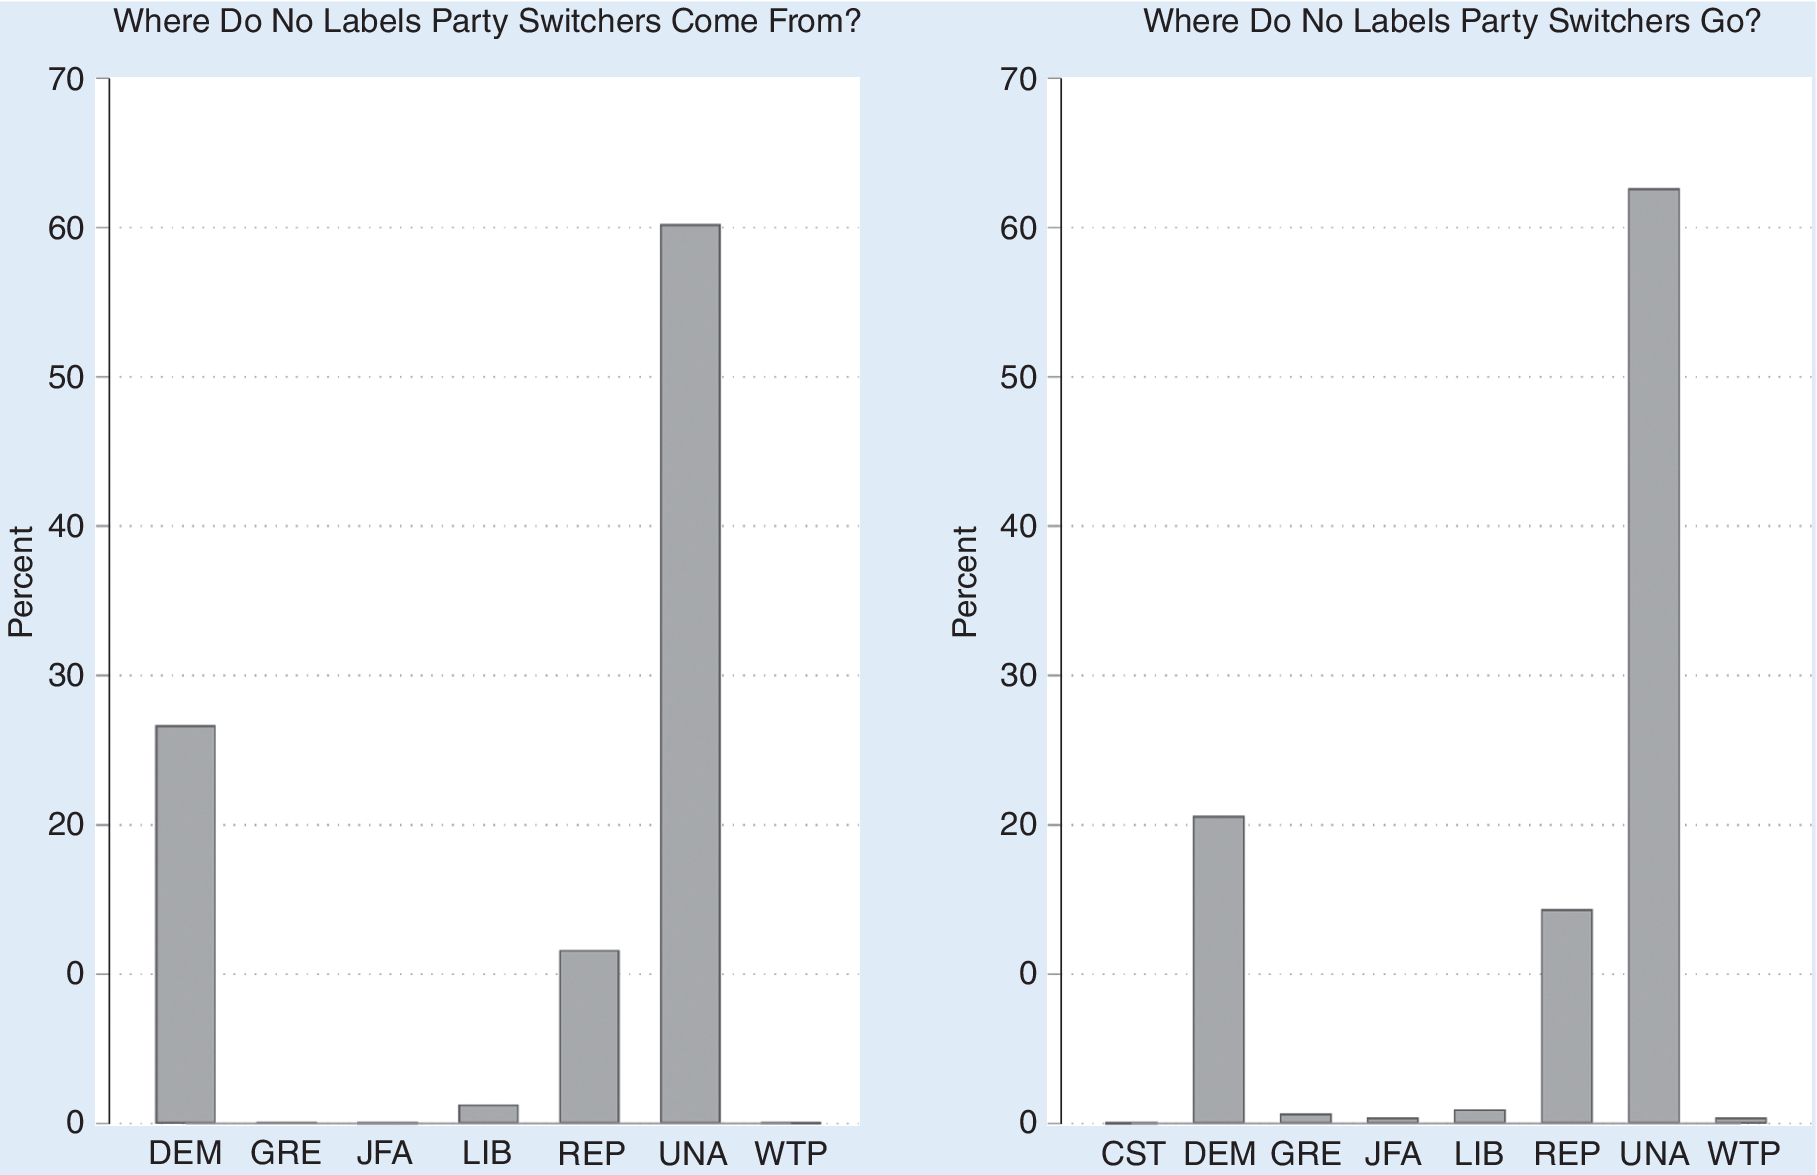
Figure 3 Long description
A two-panel figure with vertical bar charts. Both charts use a y-axis labeled Percent ranging from 0 to 70 with horizontal grid lines every 10 units.
Left Panel: Titled Where Do No Labels Party Switchers Come From? The x-axis lists previous party affiliations.
* D E M: approximately 27 percent.
* G R E: near 0 percent.
* J F A: near 0 percent.
* L I B: approximately 1 percent.
* R E P: approximately 12 percent.
* U N A: approximately 60 percent.
* W T P: near 0 percent.
Right Panel: Titled Where Do No Labels Party Switchers Go? The x-axis lists subsequent party affiliations.
* C S T: near 0 percent.
* D E M: approximately 21 percent.
* G R E: approximately 1 percent.
* J F A: near 0 percent.
* L I B: approximately 1 percent.
* R E P: approximately 14 percent.
* U N A: approximately 63 percent.
* W T P: near 0 percent.
Although these data are valuable in telling us how people responded to the presence of a new political party with party registration behavior, they do not tell us much, if anything, about what people thought and believed about No Labels. Were North Carolinians aware of the party? Might they vote for a No Labels candidate? What did they believe about the potential influence of No Labels? In the next section we examine these questions by using original survey data.
PUBLIC OPINION OF THE NO LABELS PARTY
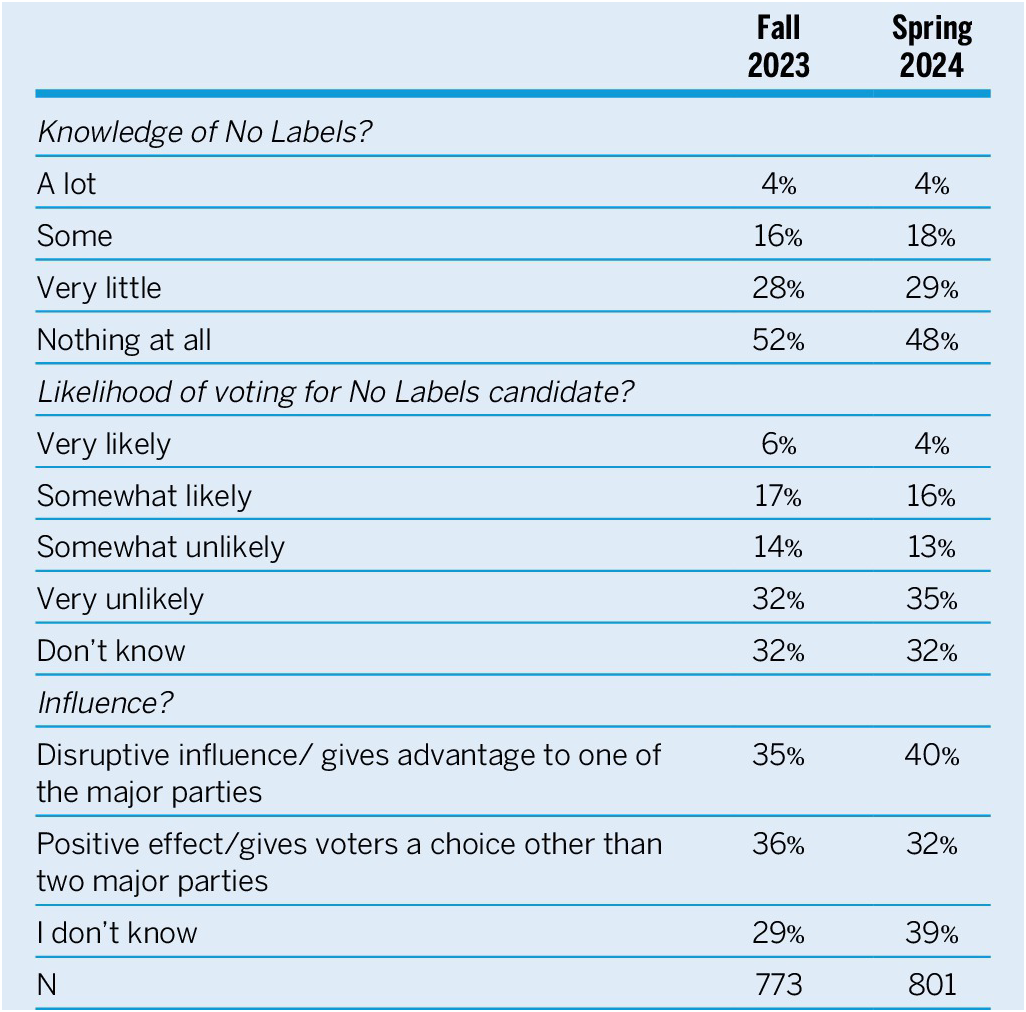
To better understand how North Carolinians viewed the No Labels Party and whether they might vote for it, we analyzed original Meredith Poll data from both Fall 2023 and Spring 2024, which allows us to understand and compare attitudes about the No Labels Party at two distinct time periods. Results are in table 2, and question wording and other poll information can be found in the supplemental appendix.
Opinions on No Labels Party in Fall 2023 and Spring 2024
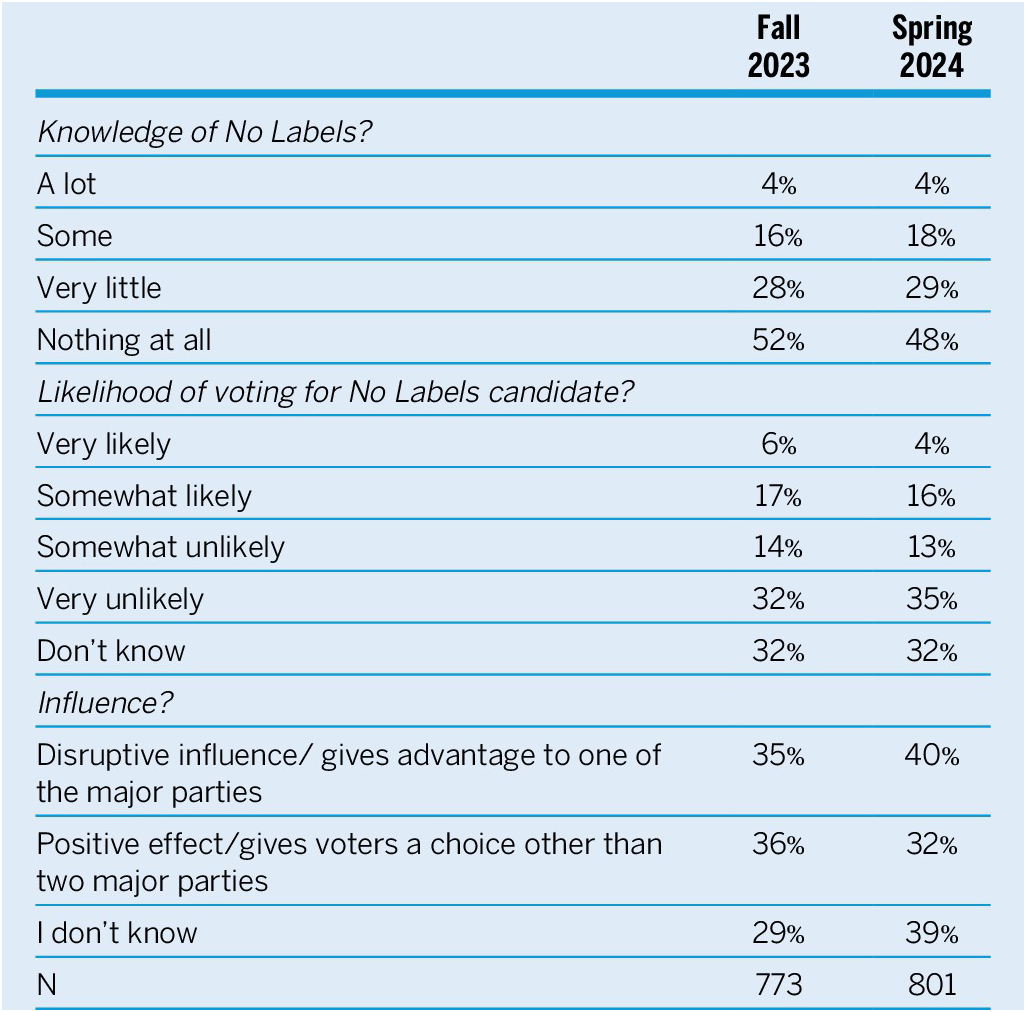
Table 2 Long description
The table compares survey results from Fall 2023 (N = 773) and Spring 2024 (N = 801).
Knowledge of No Labels:
- A lot: 4% in both periods.
- Some: 16% in Fall 2023, 18% in Spring 2024.
- Very little: 28% in Fall 2023, 29% in Spring 2024.
- Nothing at all: 52% in Fall 2023, 48% in Spring 2024.
Likelihood of voting for No Labels candidate:
- Very likely: 6% in Fall 2023, 4% in Spring 2024.
- Somewhat likely: 17% in Fall 2023, 16% in Spring 2024.
- Somewhat unlikely: 14% in Fall 2023, 13% in Spring 2024.
- Very unlikely: 32% in Fall 2023, 35% in Spring 2024.
- Don't know: 32% in both periods.
Influence:
- Disruptive influence or gives advantage to one of the major parties: 35% in Fall 2023, 40% in Spring 2024.
- Positive effect or gives voters a choice other than two major parties: 36% in Fall 2023, 32% in Spring 2024.
- I don't know: 29% in Fall 2023, 39% in Spring 2024.
Notes. Data from Meredith Poll.
The first question asked whether respondents were knowledgeable about the No Labels Party. Fully 52% said they knew “nothing at all” about it in the fall of 2023. By the following spring, well into the 2024 election season, that number had dipped only slightly (to 48%). Regardless of polling period, North Carolinians knew very little about the No Labels Party—a fact which certainly contributed to its lack of long-term viability.
The second question asked whether the respondent would consider voting for a candidate from the No Labels Party. Overall, 23% of respondents were very or somewhat likely to consider it in fall 2023; that support declined slightly to 20% in spring 2024.
Finally, we asked about respondents’ perceptions of the influence of No Labels Party. Specifically, did the respondent believe the party would be more of a positive influence, because it would give voters more options, or more of a disruptive influence, because it would preference one of the two major parties over the other (either Democratic or Republican)? The first time the question was asked, respondents were evenly divided—35% thought it would be disruptive, 36% thought it would be positive, and 29% said they did not know. By spring 2024, opinion had turned slightly more negative. It is also notable that the percentage of respondents who answered “I don’t know” to that question rose from 29% to 39% of those surveyed, suggesting that understanding of No Labels’ messaging decreased over time.
Overall, these descriptive data demonstrate that North Carolina voters did not know much about the No Labels Party, nor did they particularly care. They were relatively uninformed on the existence of the party, generally agnostic on whether they would support the party or not, and confused on whether the party would be a positive or disruptive influence.
Overall, these descriptive data demonstrate that North Carolina voters did not know much about the No Labels Party, nor did they particularly care.
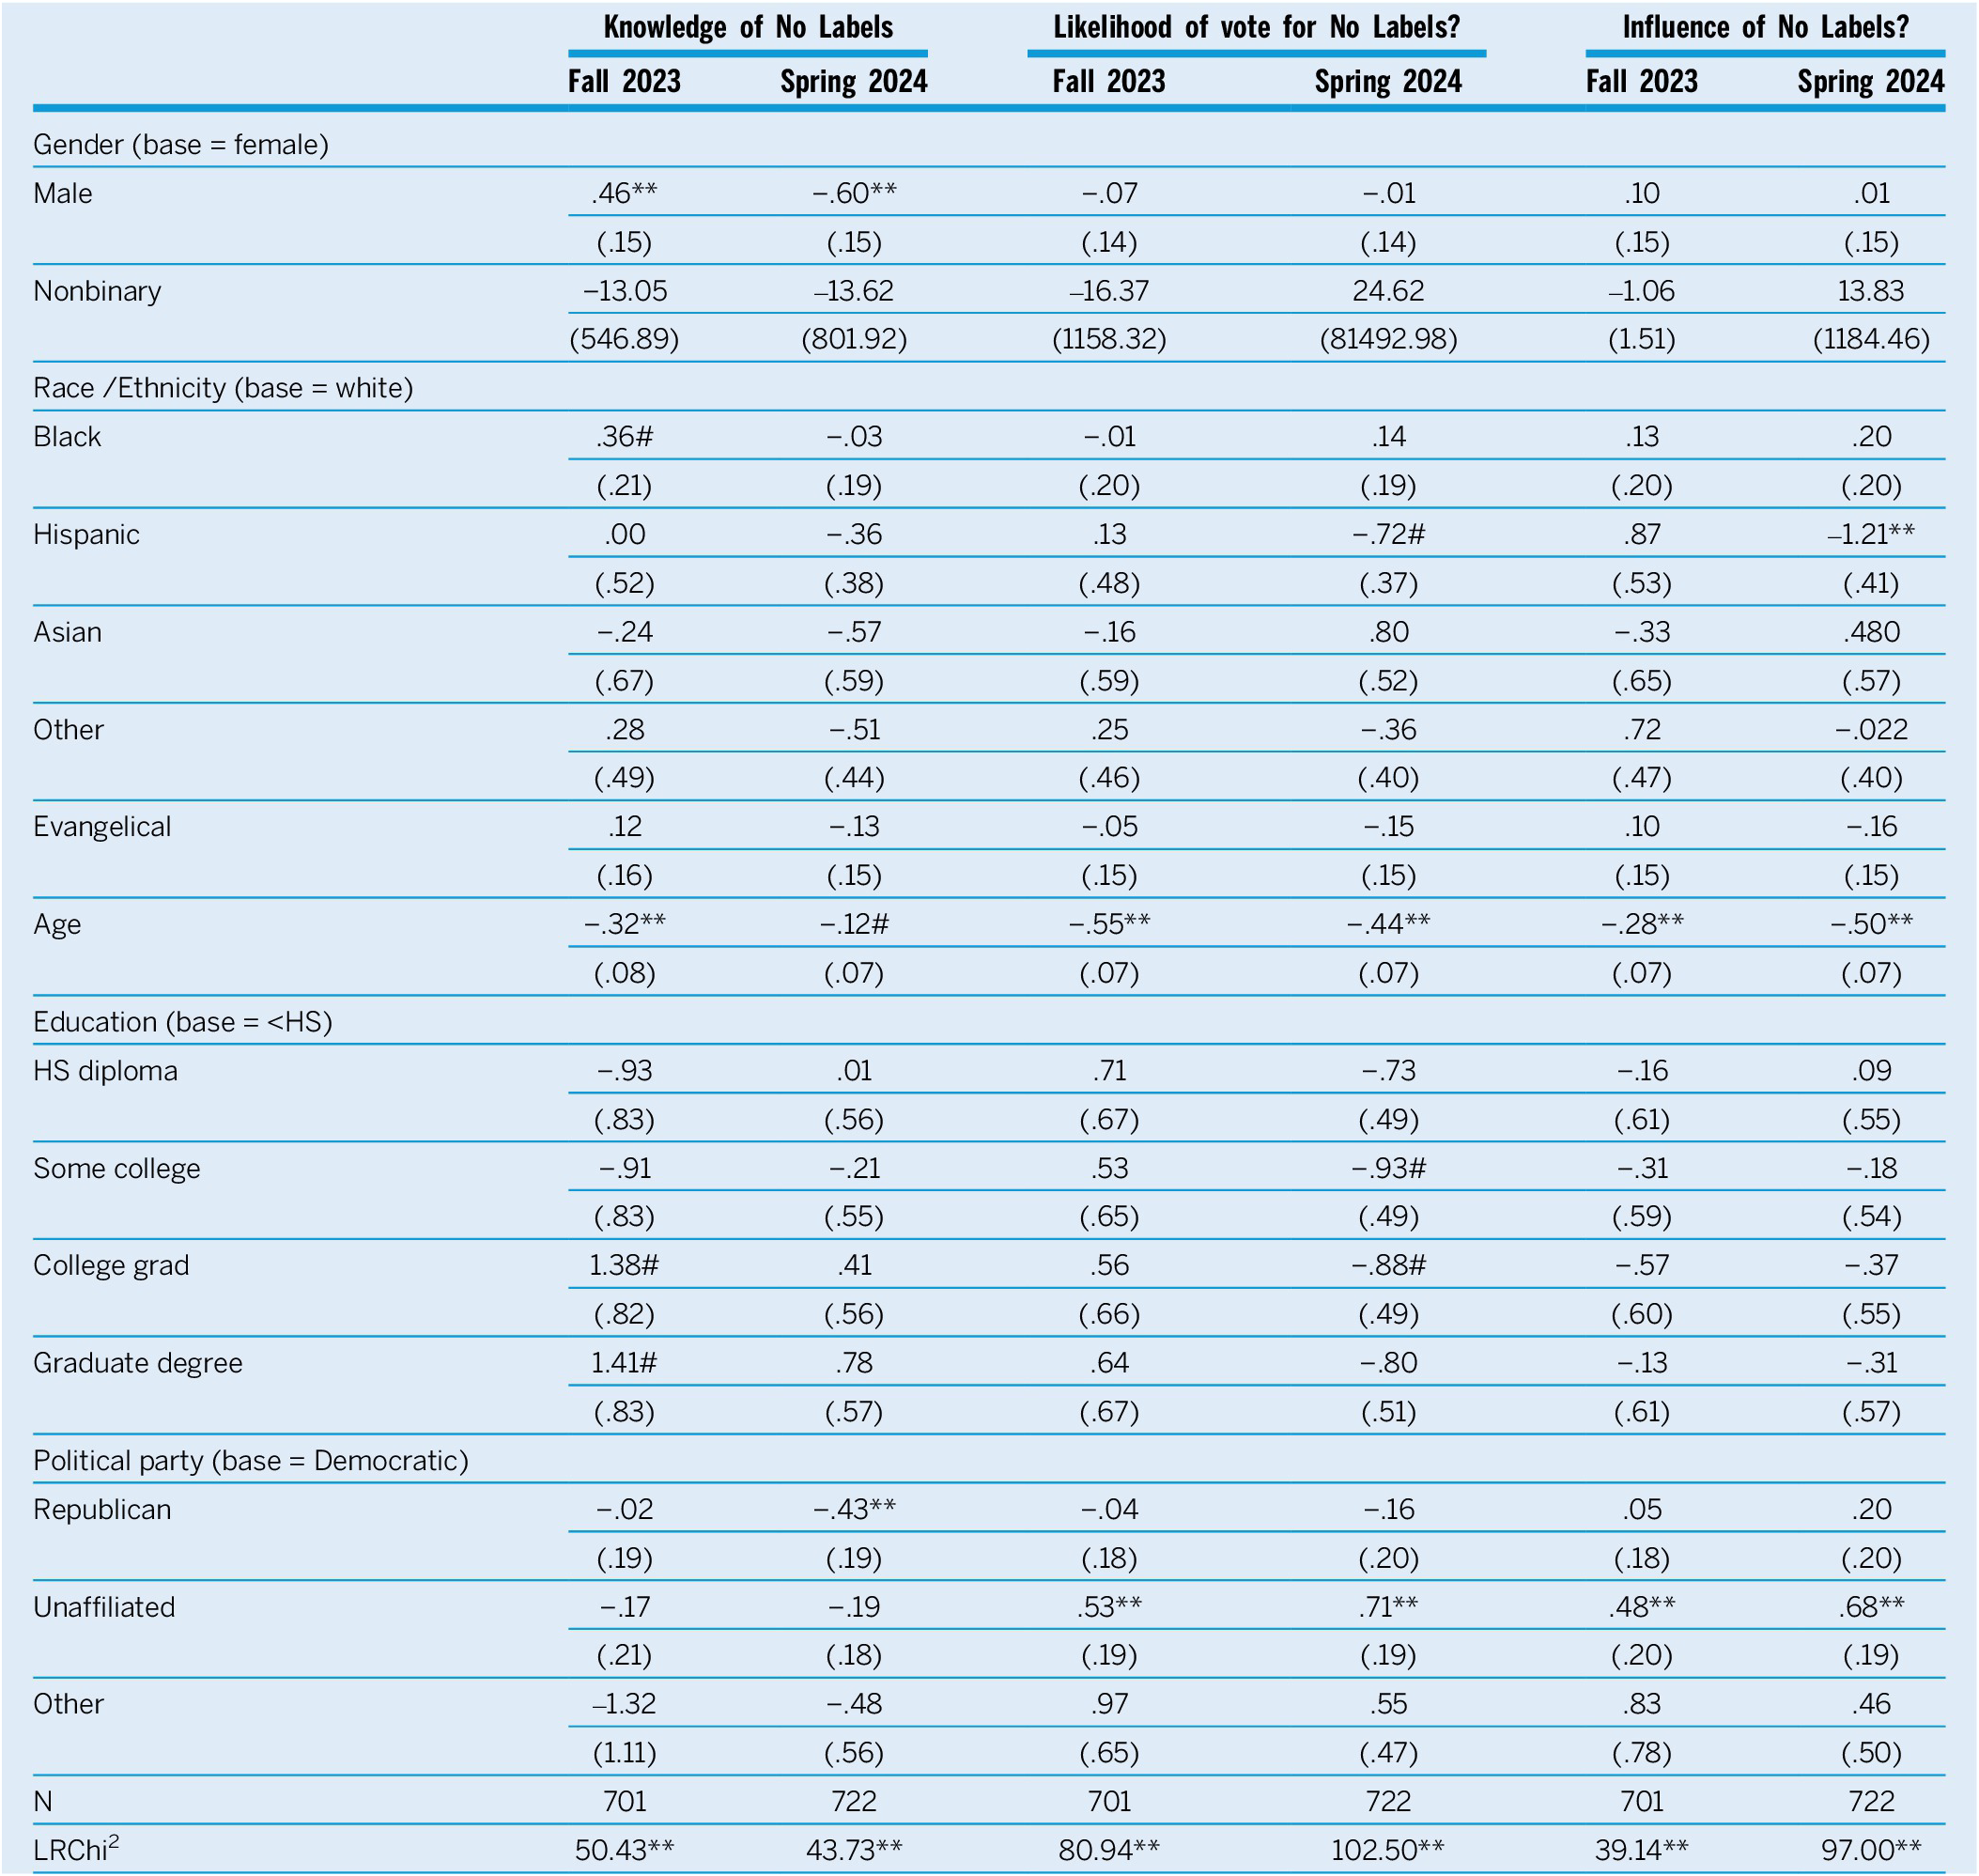
To learn more about the correlates of attitudes towards No Labels, table 3 presents the results of ordered logistic regression models where the dependent variables for knowledge, likelihood of vote, and influence mirror those described in table 2. All six models include independent variables for age, race and ethnicity, evangelical identification, education, and political party affiliation.
Ordinal Logistic Regression on Knowledge of No Labels, Likelihood of Voting for No Labels, and Position on No Labels’ Influence
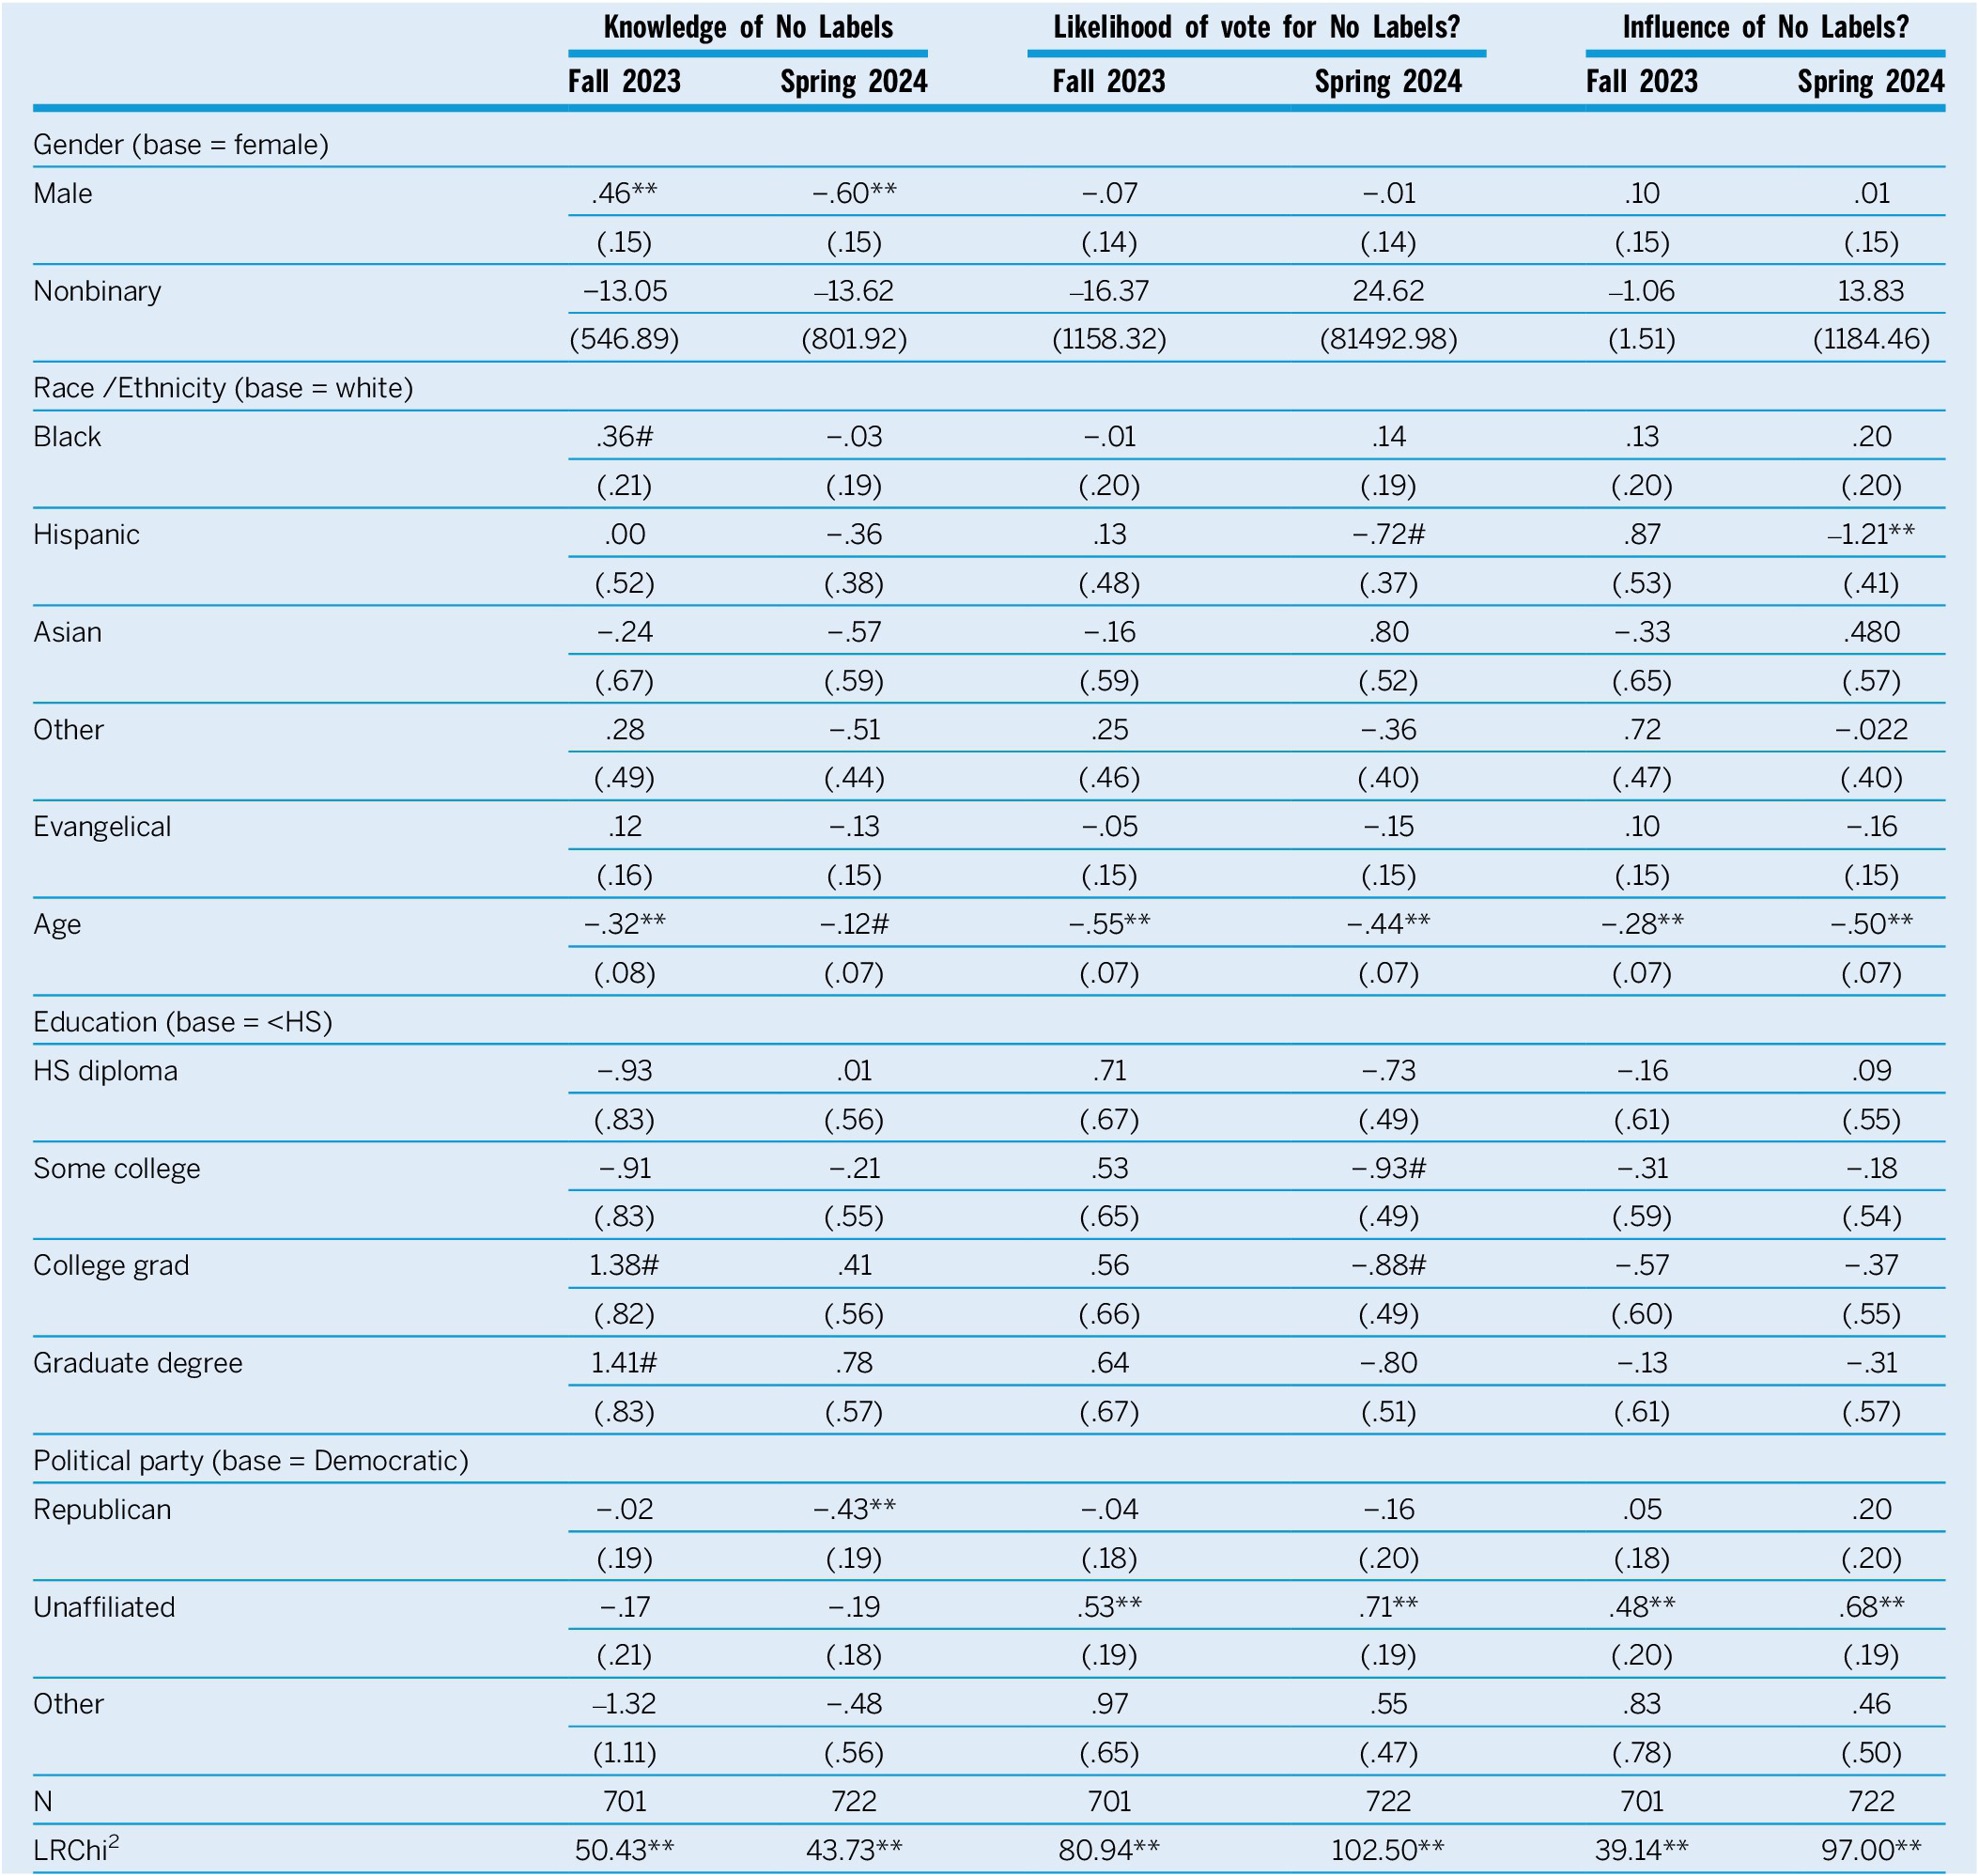
Table 3 Long description
The table presents ordinal logistic regression coefficients with standard errors in parentheses. The three main dependent variables are Knowledge of No Labels, Likelihood of vote for No Labels?, and Influence of No Labels?, each split into Fall 2023 and Spring 2024 columns.
Key findings include:
* Gender: Males had a positive coefficient for Knowledge in Fall 2023 (.46**) but a negative one in Spring 2024 (-.60**).
* Race/Ethnicity: Hispanic respondents showed a significant negative coefficient for Influence in Spring 2024 (-1.21**).
* Age: Consistently negative and significant across all categories and timeframes, ranging from -.12# to -.55**.
* Education: Higher education levels (College grad and Graduate degree) showed marginal positive significance for Knowledge in Fall 2023 (1.38# and 1.41#) but marginal negative significance for Voting Likelihood in Spring 2024 (-.88# and -.93#).
* Political Party: Unaffiliated voters showed consistently positive and significant coefficients for Voting Likelihood (.53** and .71**) and Influence (.48** and .68**) in both periods. Republicans showed a significant negative coefficient for Knowledge in Spring 2024 (-.43**).
* Model Statistics: N equals 701 for Fall 2023 and 722 for Spring 2024. L R Chi super 2 values are all significant at the p < .01 level, ranging from 39.14 to 102.50.
Significance levels are indicated by # p < .1, * p < .05, and ** p < .01.
Notes. #p<.1; *p<.05; **p<.01. All two-tailed test. Data from the Meredith Poll.
Table 3 shows that age was a consistent predictor of attitudes across all six models. Younger people generally knew more about No Labels, were more likely to consider voting for No Labels, and were more likely to believe that it would have a positive influence. For example, an 18- to 25-year-old in fall 2023 had a .49 probability of believing No Labels would have a positive impact v. a probability of about .30 for people in the oldest age category. The probability of voting for a No Labels candidate also dropped from .08 to around .03 across the lifespan. Gender was only significant in terms of knowledge of No Labels, with self-identified males claiming more knowledge in fall 2023 and less knowledge in spring 2024. The remaining control variables exerted no statistically significant influence on any of the three dependent variables.
Table 3 shows that political party identification had an important impact on some of the questions. Unaffiliated registrants were no more likely to know about No Labels, but they were more likely to say they would consider voting for No Labels and that No Labels would have a positive influence on the political system. Translating these estimates into predicted probabilities, we learn that, holding all other factors constant, Democrats had a .17 probability of saying they would consider voting for a No Labels candidate versus .25 for the Unaffiliated. In 2024, both probabilities had increased, but Unaffiliated were still more likely to say they would consider such a vote (.42 versus .31 for Democrats). Predicted probabilities for the influence models showed similar results. In 2023, the probability of a Democrat believing that No Labels had a strong influence was .15, compared to .32 for Unaffiliated. By 2024, those probabilities had increased to .33 and .46, respectively.
CONCLUSION
The No Labels Party entered North Carolina with claims of changing the party structure and giving voters an additional option. Proponents believed that the overwhelming number of Unaffiliated voters and positive public opinion polling on a third-party option indicated that the state was ripe for a change. Perhaps a new party could take advantage of this political apathy and build a third path?
Employing a host of data—both behavioral and attitudinal—we find that the birth, life and death of the No Labels Party failed to change the party ecosystem in North Carolina in any significant way. Leading into the first major primary election following their birth, fewer than 8,000 people registered with No Labels. At no time in the party’s existence did it achieve even one-half of one percent of the overall registered voter pool in North Carolina. Further, party switching data indicate that No Labels pulled not from the two major parties, but rather from Unaffiliated. Attitudinal data from the survey also reveal that the majority of support for the No Labels Party came from Unaffiliated voters. Despite claims of a “great day for democracy in the Tar Heel State” at its inception, the party system remained unchanged.
Employing a host of data—both behavioral and attitudinal—we find that the birth, life and death of the No Labels Party failed to change the party ecosystem in North Carolina in any significant way.
Part of the reason for this lack of any change is contained in the attitudinal data. North Carolinians never knew much about the No Labels Party and as such were unlikely to vote for one of their candidates. North Carolinians were also divided as to whether the party would be more positive or disruptive in the political ecosystem of the state. Given that the Meredith Poll has consistently found that North Carolinians want a third-party option, which means the state should be fertile ground for a new political party, this suggests strongly that No Labels suffered from both a name recognition problem (few had heard of them) and a branding problem (few knew what they were about). In addition, in an electorate that is increasingly partisan and calcified (Sides, Tausanovitch, and Vavreck Reference Sides, Tausanovitch and Vavreck2022), the No Labels Party faced an uphill battle. It was always a party that was clear what it was against (extremism) but less clear about what it was for. As a result, they depended on peripheral, low information rationality voters (Popkin Reference Popkin1991)—the exact types of voters who are less likely to be exposed to political messaging and less likely to turnout.
In all, this investigation into the No Labels Party reinforces the strength of the American two-party system, even in an environment where there are strong signs that voters might prefer additional options.
SUPPLEMENTARY MATERIAL
To view supplementary material for this article, please visit http://doi.org/10.1017/S1049096526101930.
ACKNOWLEDGMENTS
An earlier version of this paper was presented at the 2024 meeting of the North Carolina Political Science Association. We thank Tess Wise and the conference attendees for helpful comments.
DATA AVAILABILITY STATEMENT
Research documentation and data that support the findings of this study are openly available at the Harvard Dataverse at https://doi.org/10.7910/DVN/GLCVJU.
CONFLICTS OF INTEREST
The authors declare no ethical issues or conflicts of interest in this research.