


Introduction
Alexithymia is a multifaceted, dimensional trait characterized by challenges in processing and regulating emotions [Reference Taylor, Porcelli and Bagby1–Reference Vorst and Bermond3]. Originating in psychosomatic medicine, it is now recognized as a transdiagnostic trait associated with a wide range of mental and physical health conditions, especially including depression, anxiety disorders, autism spectrum disorder (ASD), post-traumatic stress disorder, cardiovascular diseases, and all-cause mortality [Reference Taylor, Porcelli and Bagby1, Reference Nemiah4–Reference Putica, Van Dam, Felmingham, Lawrence-Wood, McFarlane and O’Donnell14]. It represents a negative prognostic factor for psychotherapeutic treatments and affects about 10% of the general population, with substantially higher prevalence in clinical populations, including ASD (up to 49.9%) and depression (31.1%) [Reference Leweke, Leichsenring, Kruse and Hermes11, Reference Grabe, Frommer, Ankerhold, Ulrich, Gröger and Franke15–Reference Honkalampi, Hintikka, Tanskanen, Lehtonen and Viinamäki22].
Theoretical and evidence-based models have been proposed to capture the facets of alexithymia. Despite differences in scope, they commonly emphasize difficulty identifying feelings (DIF), difficulty describing feelings (DDF), and externally oriented thinking (EOT) [Reference Taylor, Porcelli and Bagby1–Reference Vorst and Bermond3], often assessed with the Toronto-Alexithymia-Scale (TAS-20) [Reference Bach, Bach, de Zwaan, Serim and Böhmer23–Reference Bagby, Taylor and Parker25]. The proposed fourth dimension of the Toronto Alexithymia Model, difficulty fantasizing [Reference Sifneos26], and the Amsterdam Model’s proposed dimension, difficulty emotionalizing [Reference Bermond, Vorst, Vingerhoets and Gerritsen27], are less consistently addressed. Moreover, the Amsterdam Model extends alexithymic deficits across cognitive and affective dimensions [Reference Vorst and Bermond3, Reference Bermond, Vorst, Vingerhoets and Gerritsen27], whereas the Attention-Appraisal Model incorporates the valence dimension and a mechanistic perspective [Reference Preece and Gross2, Reference Preece, Becerra, Robinson, Dandy and Allan28].
Elevated levels of alexithymia and the three core dimensions affect emotional perception, differentiation, and expression, ranging from reduced interoceptive and emotional awareness to misinterpreted body signals (e.g., anger interpreted as nausea or physical fatigue) [Reference Brewer, Cook and Bird29–Reference Murphy, Catmur and Bird32], which can result in maladaptive responses to physiological and emotional needs. Additionally, alexithymia can interfere with social functioning by impairing the identification of internal emotional states and external social cues (e.g., facial reactions, tone of voice), hampering socially appropriate reactions, and contributing to relationship difficulties (e.g., through reduced empathy) [Reference Garfinkel and Critchley33, Reference Terasawa, Shibata, Moriguchi and Umeda34]. Moreover, high alexithymia is associated with maladaptive strategies such as suppression and avoidance of emotions, which impair negative affect regulation, reduce stress resilience, and exacerbate psychological distress [Reference Preece, Becerra, Allan, Robinson and Dandy35–Reference Preece, Mehta, Becerra, Chen, Allan and Robinson37]. Over time, alexithymia may adversely affect the autonomic nervous system (ANS), as it is associated with autonomic dysregulation, hypothalamic–pituitary–adrenal axis alterations, and hormonal disturbances [Reference Lischke, Pahnke, Mau-Moeller, Behrens, Grabe and Freyberger38–Reference Goerlich and Votinov40]. Together with poorer health behaviors, like reduced medical help-seeking, these factors may exacerbate mental and physical health problems, particularly affective disorders [Reference Di Tella, Benfante, Airale, Castelli and Milan5–Reference Putica, Van Dam, Felmingham, Lawrence-Wood, McFarlane and O’Donnell14, Reference Carta, Sancassiani, Pippia, Bhat, Sardu and Meloni41–Reference Thorberg, Young, Sullivan and Lyvers51]. Consistently, alexithymia is highly prevalent in depressive disorders, potentially due to its detrimental impact on emotion regulation [Reference Preece, Mehta, Becerra, Chen, Allan and Robinson37, Reference Li, Zhang, Guo and Zhang52].
Neuroimaging started to elucidate the neuronal circuits underlying these alterations in alexithymia, identifying the anterior cingulate cortex (ACC), the insula, the amygdala, and prefrontal regions – key nodes of emotional awareness and interoception [Reference Van Der Velde, Servaas, Goerlich, Bruggeman, Horton and Costafreda53–Reference Terock, Frenzel, Wittfeld, Klinger-König, Janowitz and Bülow59]. However, ongoing debates over the dimensions of alexithymia and the limited number of functional network studies leave the neurobiological mechanisms underresearched. Resting-state fMRI (rsfMRI) offers a promising approach to investigating stable, trait-level functional network alterations in alexithymia. Thus, functional connectivity (FC) within the default mode network (DMN) – essential for self-referential processing and emotional awareness – was found to be lower in individuals with alexithymia [Reference Liemburg, Swart, Bruggeman, Kortekaas, Knegtering and Ćurčić-Blake60]. In combination with higher DMN coupling to sensory and emotion-regulatory regions, including sensorimotor, occipital, and frontal cortices, this may reflect a tonic shift from emotional awareness to exteroceptive or action-oriented processing [Reference Liemburg, Swart, Bruggeman, Kortekaas, Knegtering and Ćurčić-Blake60]. Accordingly, other rsfMRI-studies reported altered amygdala-frontal connectivity, including the dorsolateral prefrontal cortex, ACC, precuneus, and precentral gyrus [Reference Han, Li, Mei and Sun61–Reference Li, Peng, Qin, Luo, Ren and Wang63]. Additionally, lower insula-ventromedial prefrontal cortex connectivity has been shown to mediate the link between alexithymia and tobacco craving [Reference Sutherland, Carroll, Salmeron, Ross and Stein64], suggesting reduced emotional and interoceptive awareness. However, these rsfMRI-studies relied on small, subgroup-specific samples (mostly N < 85; one with N = 297) and primarily used predefined regions of interest (ROI), limiting generalizability. To the best of our knowledge, no prior study has examined the impact of alexithymia on functional networks in the general population. Therefore, we investigated this in a population-based sample, hypothesizing that alexithymia – rather than frequently co-occurring depressive symptoms [Reference Li, Zhang, Guo and Zhang52] – is associated with functional alterations specifically in the DMN, salience network (SN), and networks involved in cognitive control, attention, and sensory processing (frontoparietal network (FPN), dorsal attention network (DAN), sensorimotor network (SMN)). Previous studies have only studied alexithymia-related FC alterations in a subset of these networks [Reference Liemburg, Swart, Bruggeman, Kortekaas, Knegtering and Ćurčić-Blake60–Reference Sutherland, Carroll, Salmeron, Ross and Stein64]. However, large-scale networks are simultaneously active and measurable at rest, contributing to intrinsic brain activity and body regulation [Reference Shokri-Kojori, Tomasi and Volkow65–Reference Deco, Jirsa and McIntosh67]. Therefore, we extended our analyses to all major whole-brain networks (cerebellar, language, and visual), broadening current knowledge.
Methods
Study population
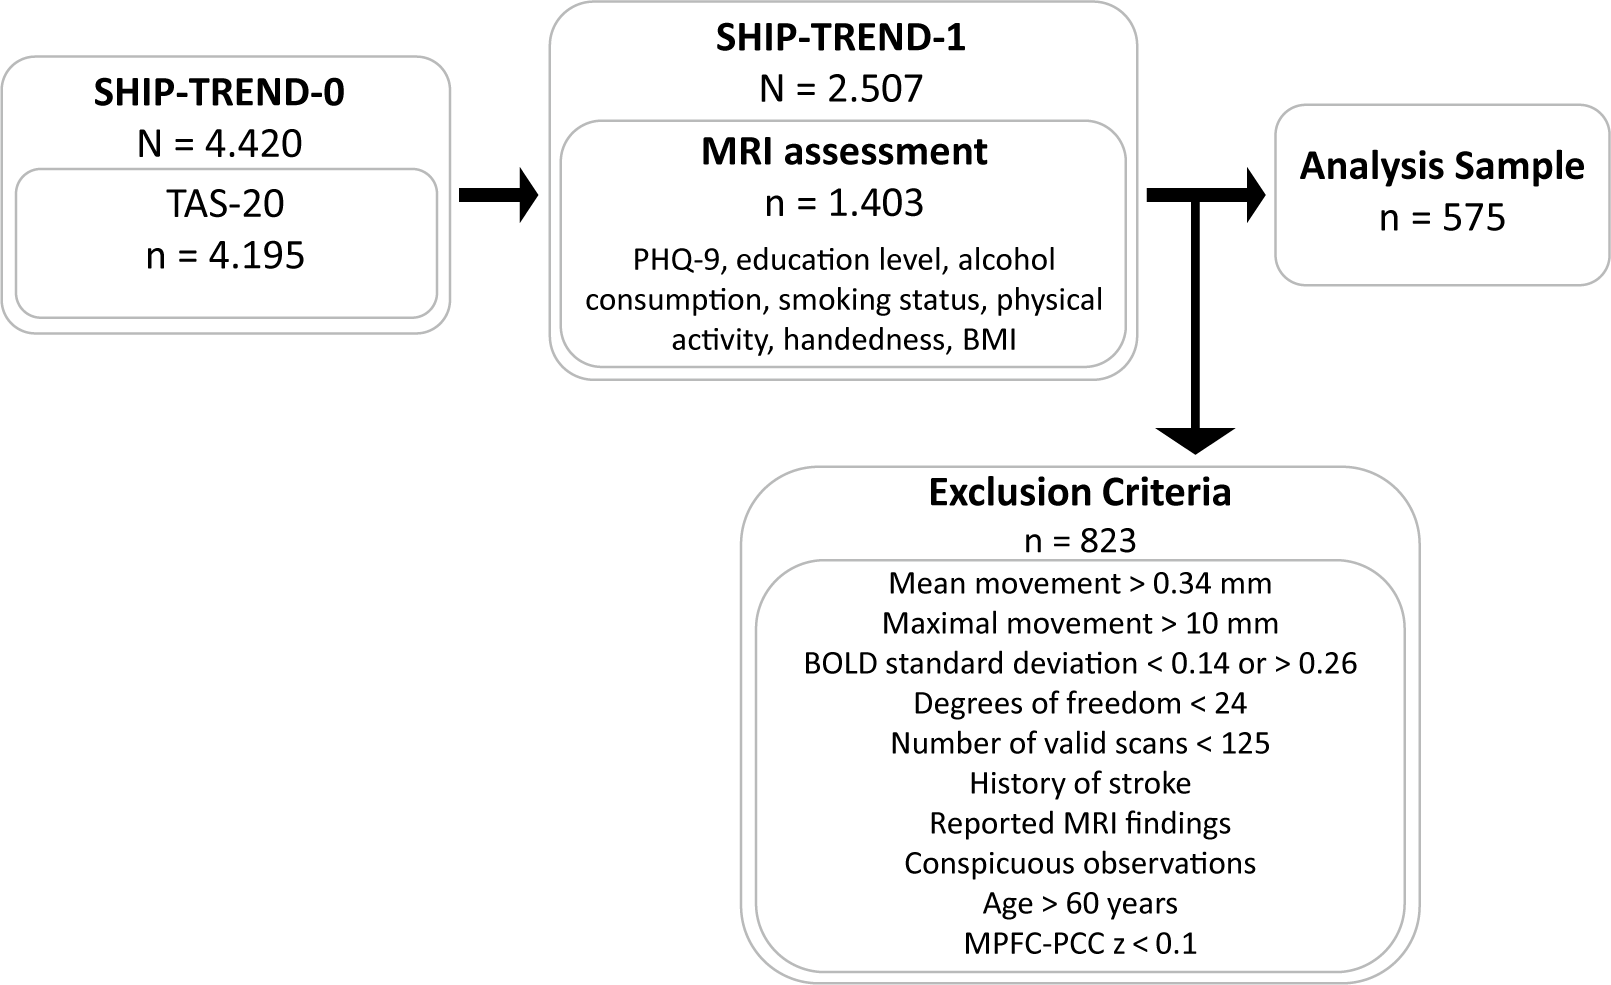
Using a cross-sectional design, we analyzed data from the population-based SHIP-TREND cohort in north-eastern Germany. Participants were randomly selected from local registries and are representative of the regional population [Reference Völzke, Schössow, Schmidt, Jürgens, Richter and Werner68]. At baseline (SHIP-TREND-0: 2008–2012; N = 4,420; age M[SD] = 51.96[15.5]; 2,275 females [51.5%]), the TAS-20 [Reference Bach, Bach, de Zwaan, Serim and Böhmer23–Reference Bagby, Taylor and Parker25] was completed by 4,195 participants (94,9%). Of these, 2,507 participated in the first follow-up (SHIP-TREND-1: 2016–2019; age M[SD] = 57.09[13.89]; 1,293 females [51.6%]), including 1,403 participants who underwent MRI scanning, including rsfMRI (age M[SD] = 56.18[13.05]; 721 females [51.5%]) [Reference Hosten, Bülow, Völzke, Domin, Schmidt and Teumer69]. See Supplementary Figure S1 for sex-stratified age distributions. We used SHIP-TREND-1 data and included only baseline TAS-20 scores, as TAS-20 was not assessed in SHIP-TREND-1.
Assessments were performed by trained personnel in accordance with the Declaration of Helsinki, with written informed consent from all participants and approval granted by the review board of the University of Greifswald, Germany.
Data assessment
Sociodemographic, lifestyle, and medical data were collected via standardized computer-assisted interviews, followed by physical examinations including anthropometry. Socioeconomic factors included educational level (highest school and vocational training qualifications; levels: 1–8) [Reference Jöckel, Babitsch and Bellach70, Reference Mielck71], and partnership status (yes/no). Lifestyle factors encompassed smoking status (never, former, current), regular physical activity ≥1 h/week (yes/no), and average alcohol consumption (g/d) during the last 30 days. Current depressive symptoms were assessed using the PHQ-9 questionnaire [Reference Gräfe, Zipfel, Herzog and Löwe72, Reference Kroenke, Spitzer and Williams73] (see Supplement).
Assessment of alexithymia
Alexithymia was assessed using the validated German version of the TAS-20 [Reference Bach, Bach, de Zwaan, Serim and Böhmer23–Reference Bagby, Taylor and Parker25]. Each item is rated on a 5-point scale (1 = “never applies”; 5 = “applies always”), measuring one of three factors: Difficulties Identifying Feelings, Difficulties Describing Feelings, and Externally Oriented Thinking. Subscale scores yield a total score (range 20–100), with higher values indicating greater alexithymia. In the analysis sample, internal consistency was within previously reported ranges [Reference Taylor, Bagby and Parker74] (TAS-20 total: α = 0.80; DIF: α = 0.83; DDF: α = 0.70; EOT: α = 0.51).
The construct of alexithymia has demonstrated high relative stability [Reference Bagby, Parker and Taylor75, Reference De Gucht, Fontaine and Fischler76]. The TAS-20 total score showed only minor mean-level changes (−0.05) over 11 years, along a high test–retest correlation (r = 0.70) [Reference Hiirola, Pirkola, Karukivi, Markkula, Bagby and Joukamaa77]. Consistently, alexithymia has been reported to vary only slightly over the lifespan [Reference Luminet, Bagby and Taylor78–Reference Rufer, Ziegler, Alsleben, Fricke, Ortmann and Brückner80], supporting the understanding of alexithymia as a stable, long-term personality trait [Reference Bagby, Parker and Taylor75, Reference Taylor, Bagby, Parker and Grotstein81].
Acquisition of MRI-data
Following the standard SHIP-TREND-1 protocol [Reference Hosten, Bülow, Völzke, Domin, Schmidt and Teumer69, Reference Hegenscheid, Kühn, Völzke, Biffar, Hosten and Puls82], participants without contraindications underwent whole-body MRI on a 1.5 Tesla scanner (Magnetom Avanto, Siemens Healthcare, Erlangen, Germany) operated by trained technicians.
One structural T1-weighted and 200 functional brain images (repetition time (TR) = 2,860 ms, duration = 9:32 min) were acquired approximately 30–45 minutes after scan onset (see Supplement for details). During functional imaging, participants fixated on a cross with eyes open.
Data preparation of MRI data
MRI data were preprocessed using fMRIPrep (24.1.1) [Reference Esteban, Markiewicz, Blair, Moodie, Isik and Erramuzpe83]. Structural and functional images were coregistered, motion-corrected, and normalized to MNI152NLin2009cAsym space. Five nuisance regressors were derived from white matter and cerebrospinal fluid using CompCor. Functional images were subsequently coregistered to MNI152-space, spatially smoothed (8 mm), and denoised using the CONN toolbox (v22.v2407) [Reference Nieto-Castanon84, Reference Nieto-Castanon and Whitfield-Gabrieli85], including regression of CompCor components (10), motion parameters and derivatives (12), outlier scans, resting-state task effects, and linear trends. BOLD timeseries were band-pass filtered at 0.01–0.1 Hz.
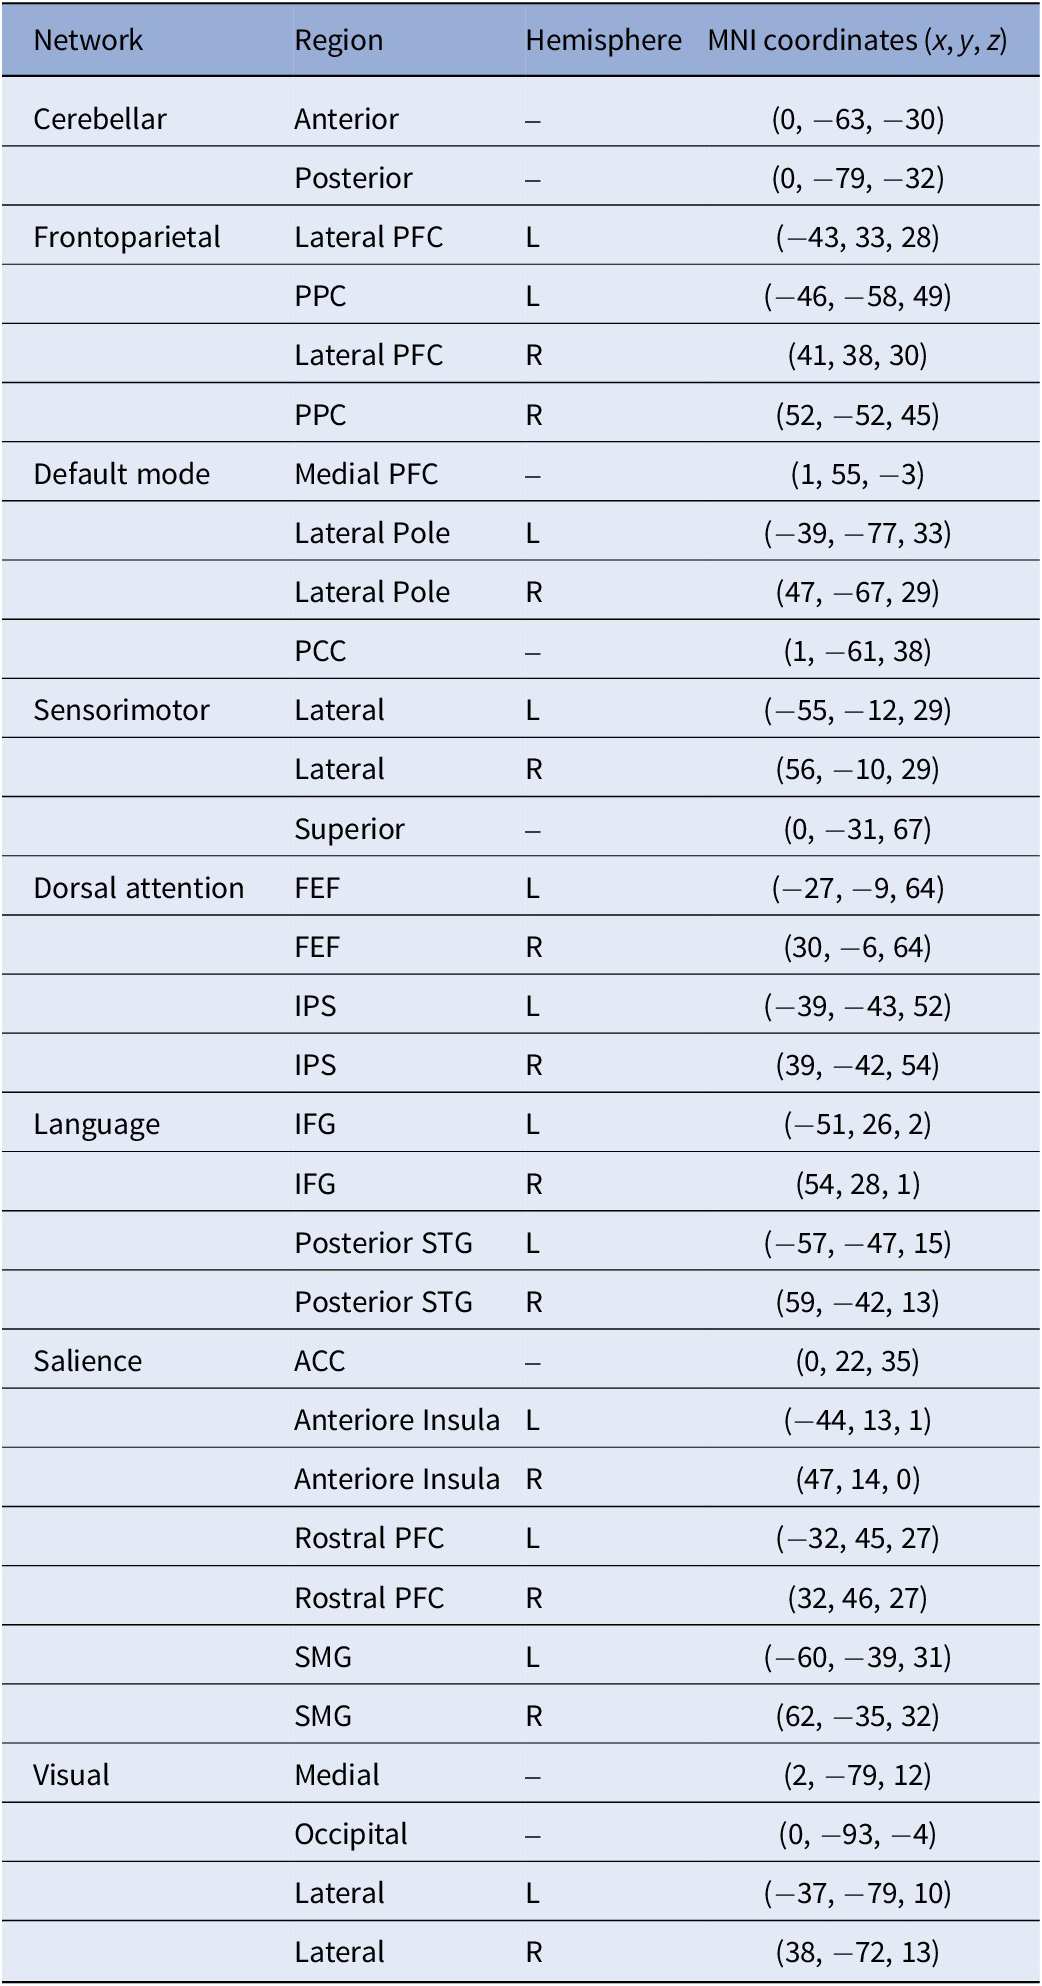
FC strength was calculated by extracting the BOLD-timeseries from 32 predefined network ROIs from the CONN toolbox, derived from an independent component analysis (ICA) decomposition of 497 subjects of the Human Connectome Project (Supplementary Figure S2 and Table 1) [Reference Nieto-Castanon86]. For the planned post-hoc analysis of the DMN, a separate ICA identified four positively correlated DMN regions (z-threshold = 2.5): MPFC, PCC, and left and right lateral poles (LP) (Supplementary Figure S3). Spherical ROIs (5 mm radius) were defined at the peak coordinates of these clusters.
Network ROIs
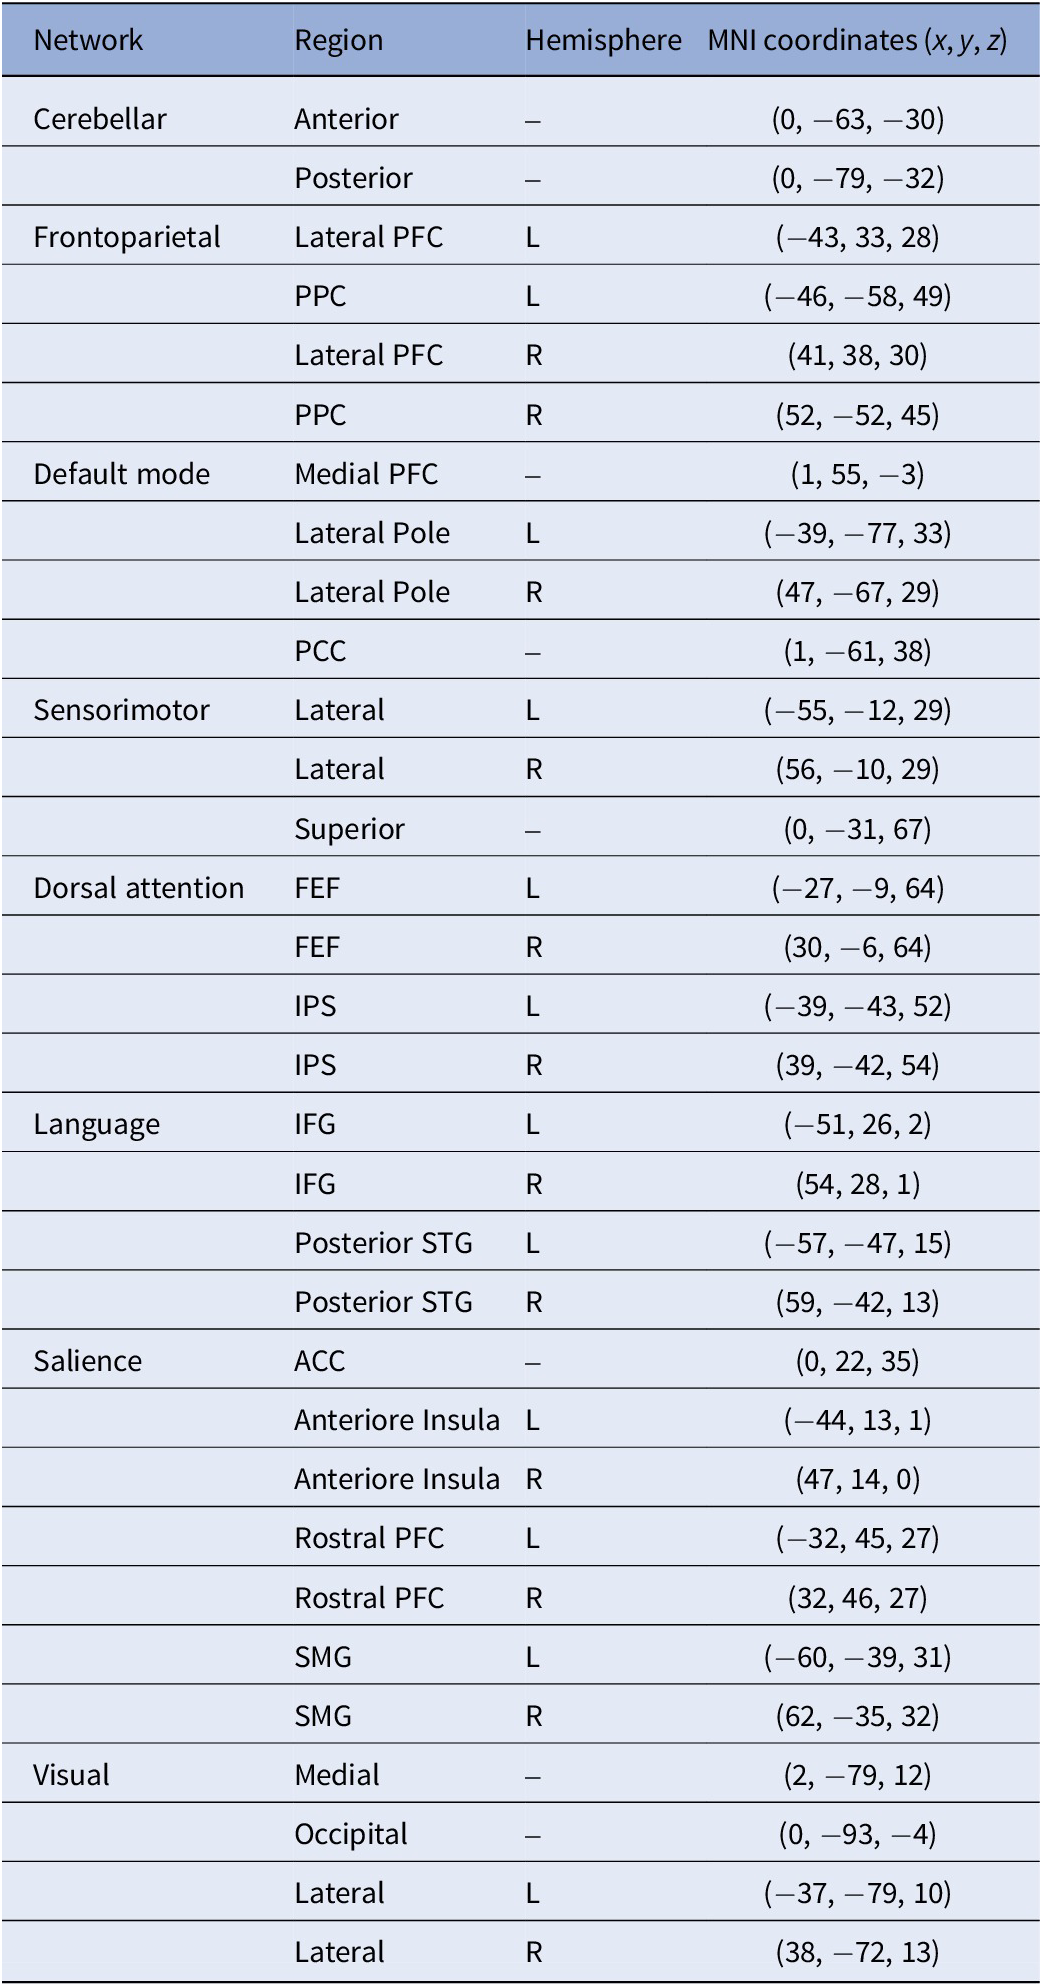
Notes: ACC, anterior cingulate cortex; FEF, frontal eye field; IPS, intraparietal sulcus; L, left; MNI, brain coordinate system developed at the Montreal Neurological Institute; PFC, prefrontal cortex; PPC, posterior parietal cortex; R, right; SMG, supramarginal gyrus; STG, superior temporal gyrus.
Then, a weighted general linear model was applied to each ROI pair to estimate their association while adjusting for confounding noise sources. Resulting bivariate correlation coefficients were Fisher z-transformed for subsequent analyses [Reference Nieto-Castanon84] (see Supplement for details).
Analysis sample
The analysis sample was selected using QC-thresholds (Figure 1). Mean framewise movement had to be ≤0.34 mm (1.5× interquartile range (IQR)), with maximal displacement <10 mm. Standardized BOLD signal variation was required within 1.5x IQR (0.14–0.26), degrees of freedom after denoising ≥24, and ≥ 125 valid scans (≥62.5%, ~6 min). Participants with stroke, MRI abnormalities, or imaging artifacts (n = 48) were excluded. Since adherence and wakefulness during rsfMRI-acquisition were not assessed, and previous findings demonstrated that anterior–posterior DMN connectivity decouples during sleep [Reference Horovitz, Braun, Carr, Picchioni, Balkin and Fukunaga87], participants with low MPFC-PCC connectivity (z < 0.1) were excluded as potentially asleep (n = 160). The TAS-20 total score did neither correlate with MPFC-PCC coupling in the full SHIP-TREND-1 MRI sample (r = −.008, p = .79) nor in the analyzed sample (r = −.058, p = .17).
Flowchart of the analysis sample. Notes: BOLD, blood oxygen level–dependent signal; MPFC-PCC, functional connectivity between the medial prefrontal cortex and the posterior cingulate cortex; MRI, magnetic resonance imaging; PHQ-9, Patient Health Questionnaire–9; TAS-20, Toronto Alexithymia Scale; z, Fisher’s z-transformed correlation coefficient.

Given that age-related neurobiological and neurovascular changes may affect BOLD signals and statistical analyses in older participants [Reference Henson, Olszowy, Tsvetanov, Yadav, Cam-CAN and Zeidman88–Reference Yabluchanskiy, Nyul-Toth, Csiszar, Gulej, Saunders and Towner90], that resting-state networks change with advancing age [Reference Grady, Protzner, Kovacevic, Strother, Afshin-Pour and Wojtowicz91–Reference Chow, Rabi, Paracha, Hasher, Anderson and Alain96], and that no direct measure of impaired BOLD responsiveness was available, we performed sensitivity analyses to assess potential age-related effects. Analyses of the TAS-20 total score, including both sets of covariates, were conducted using age cut-offs ranging from 55 to 75 years, showing diminishing effects when participants older than 60 years were included (Supplementary Figures S4–S5). Accordingly, a cut-off of >60 years was chosen to optimize data quality and sample size, consistent with reports identifying this age as a turning-point for declining vascular health and autonomic function [Reference Fan, Juttukonda, Goodale, Wang, Orbán and Varadarajan97].
Alexithymia as a trait demonstrated relative high stability across the lifespan [Reference Bagby, Parker and Taylor75, Reference De Gucht, Fontaine and Fischler76, Reference Luminet, Bagby and Taylor78–Reference Rufer, Ziegler, Alsleben, Fricke, Ortmann and Brückner80]. Because no alexithymia measure was available in SHIP-TREND-1, TAS-20 scores from SHIP-TREND-0 were used, assuming relative stability of alexithymia across the time interval to MRI acquisition, while acknowledging this as a limitation.
Statistical analysis
ROI-to-ROI analyses examined the associations between TAS-20 scores (total, DIF, DDF, EOT) and FC across eight large-scale networks: DMN, DAN, FPN, SN, SMM, Visual, Cerebellar (CN), and Language. They are assumed to contribute to intrinsic brain activity and, therefore, may be altered in alexithymia [Reference Liemburg, Swart, Bruggeman, Kortekaas, Knegtering and Ćurčić-Blake60–Reference Deco, Jirsa and McIntosh67]. Post-hoc analyses were conducted on four ICA-derived DMN ROIs to increase sensitivity, as potential alexithymia-related alterations may be obscured by the anterior–posterior DMN coupling thresholds applied for quality control.
Connection-level effects between all ROI pairs were tested using multivariate random-effects analyses. Statistical inference was made at the predefined cluster level using parametric statistics within and between network pairs [Reference Jafri, Pearlson, Stevens and Calhoun98]. Results were thresholded at p < .05 (connection-level) and FDR-corrected at p < .05 (cluster-level) [Reference Benjamini and Hochberg99].
All analyses used a base model including age (linear and quadratic), sex, handedness, and coil configuration to control for signal variability. The fully adjusted model additionally included smoking status, PHQ-9 depression score, educational level, partnership status, physical activity, average alcohol consumption, and BMI to account for sociodemographic, clinical, and technical confounders [Reference Kun, Alpay, Bodó, Molnár, Horváth and Karsai50, Reference Thorberg, Young, Sullivan and Lyvers51, Reference Jöckel, Babitsch and Bellach70, Reference Mielck71, Reference Ramzi, Auvinen, Veijola, Miettunen, Ala-Mursula and Sebert100–Reference Sweetnam and Flack103], aiming to show that observed FC patterns are specifically linked to alexithymia.
TAS-20 and PHQ-9 scores were log-transformed to reduce skewness.
Results
Characteristics of the sample
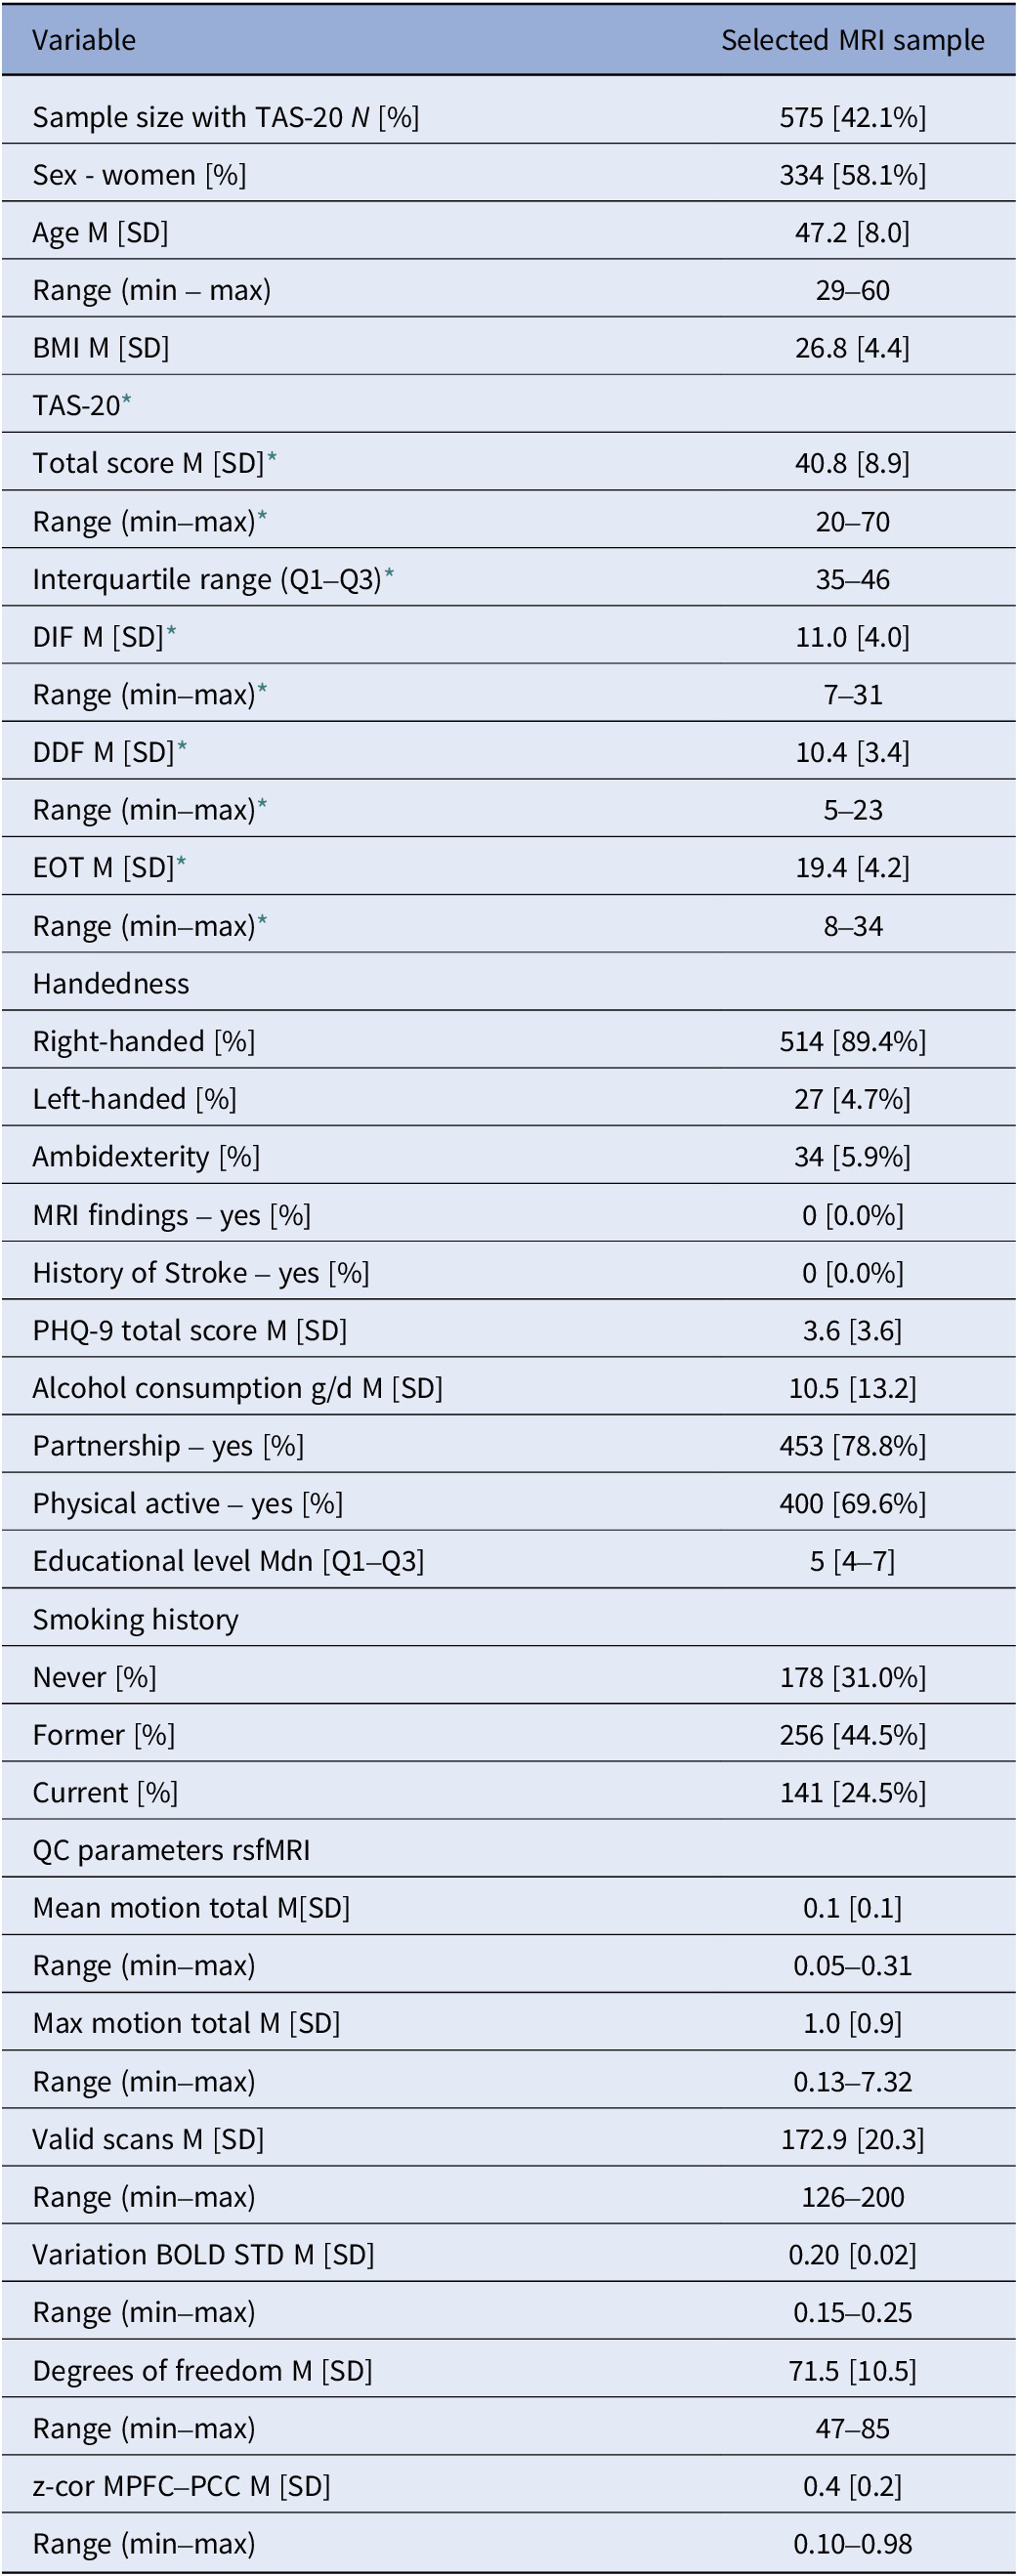
The analysis sample comprised 575 participants (Table 2 and Supplementary Table S1; M[SD] = 47.2[8.0] years, range 29–60; 58.1% women (n = 334)). The average TAS-20 total score was 40.8, with subscale means of 11.0 for DIF, 10.4 for DDF, and 19.4 for EOT.
Sample characteristics
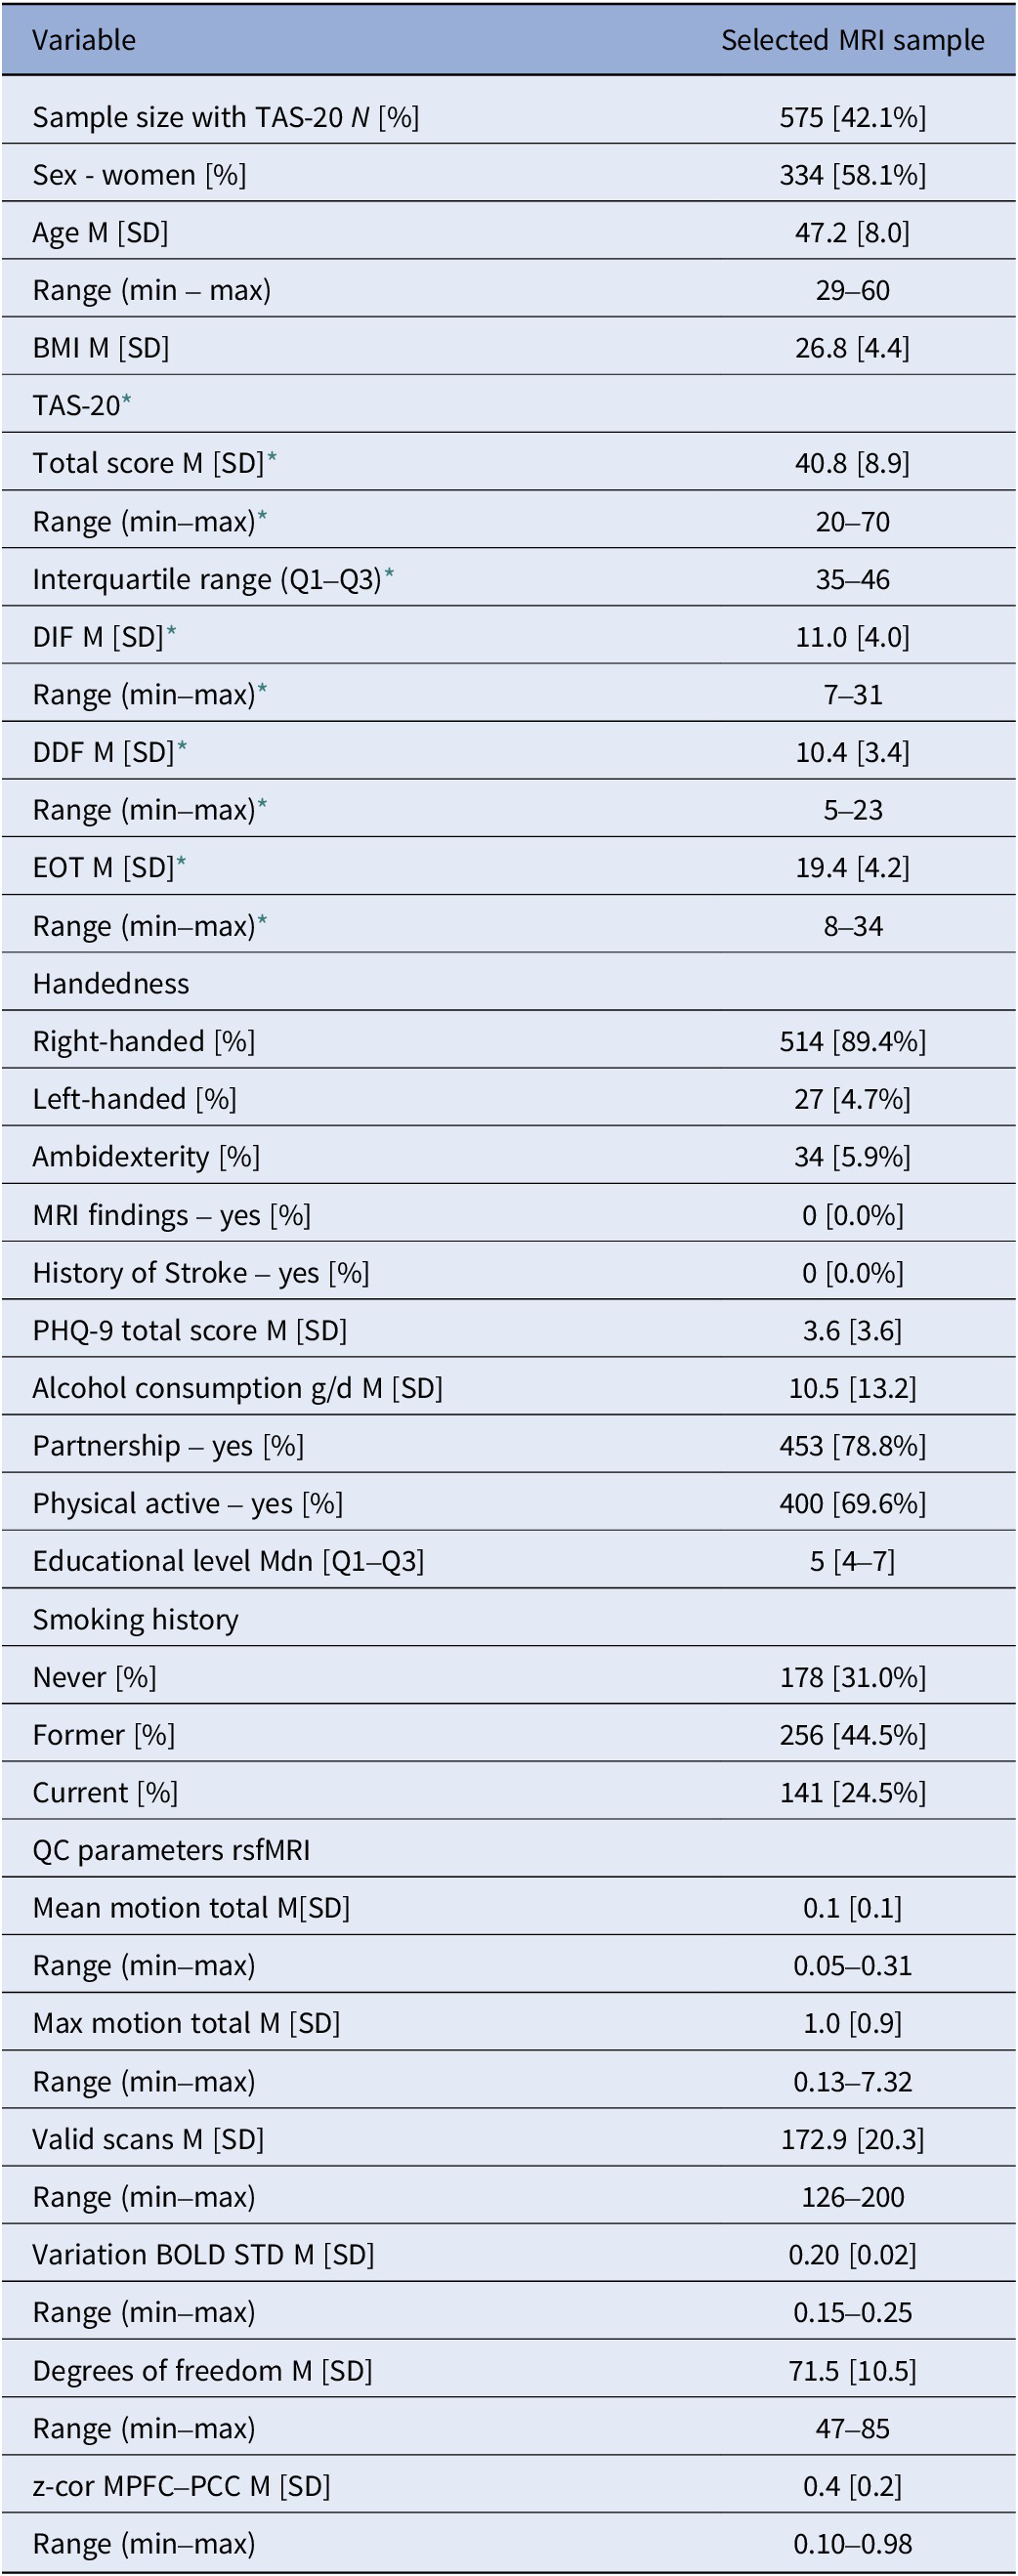
Notes: BMI, body mass index; DDF, difficulties describing feelings; DIF, difficulties identifying feelings; EOT, externally oriented thinking; M, mean; MPFC, ventromedial prefrontal cortex; PCC, posterior cingulate cortex; PHQ-9, patient health questionnaire; QC parameters rsfMRI, quality control parameters derived from resting-state functional magnetic resonance imaging; SD, standard deviation; TAS-20, Toronto Alexithymia Scale.
* TAS-20 was assessed in SHIP-TREND-0; all other variables were assessed in SHIP-TREND-1.
TAS-20 scores were not correlated with age (total ρ = −.04, DIF ρ = −.05, DDF ρ = −.04, EOT ρ = .03, all p > .05), while the total score (ρ = .26, p = 1.9e-10), DIF (ρ = .41, p < 2.2e-16), and DDF (ρ = .19, p = 4.0e-06) were positively correlated with the PHQ-9, but not EOT (ρ = .03, p > .05).
Functional connectivity and TAS-20 total score
Base model
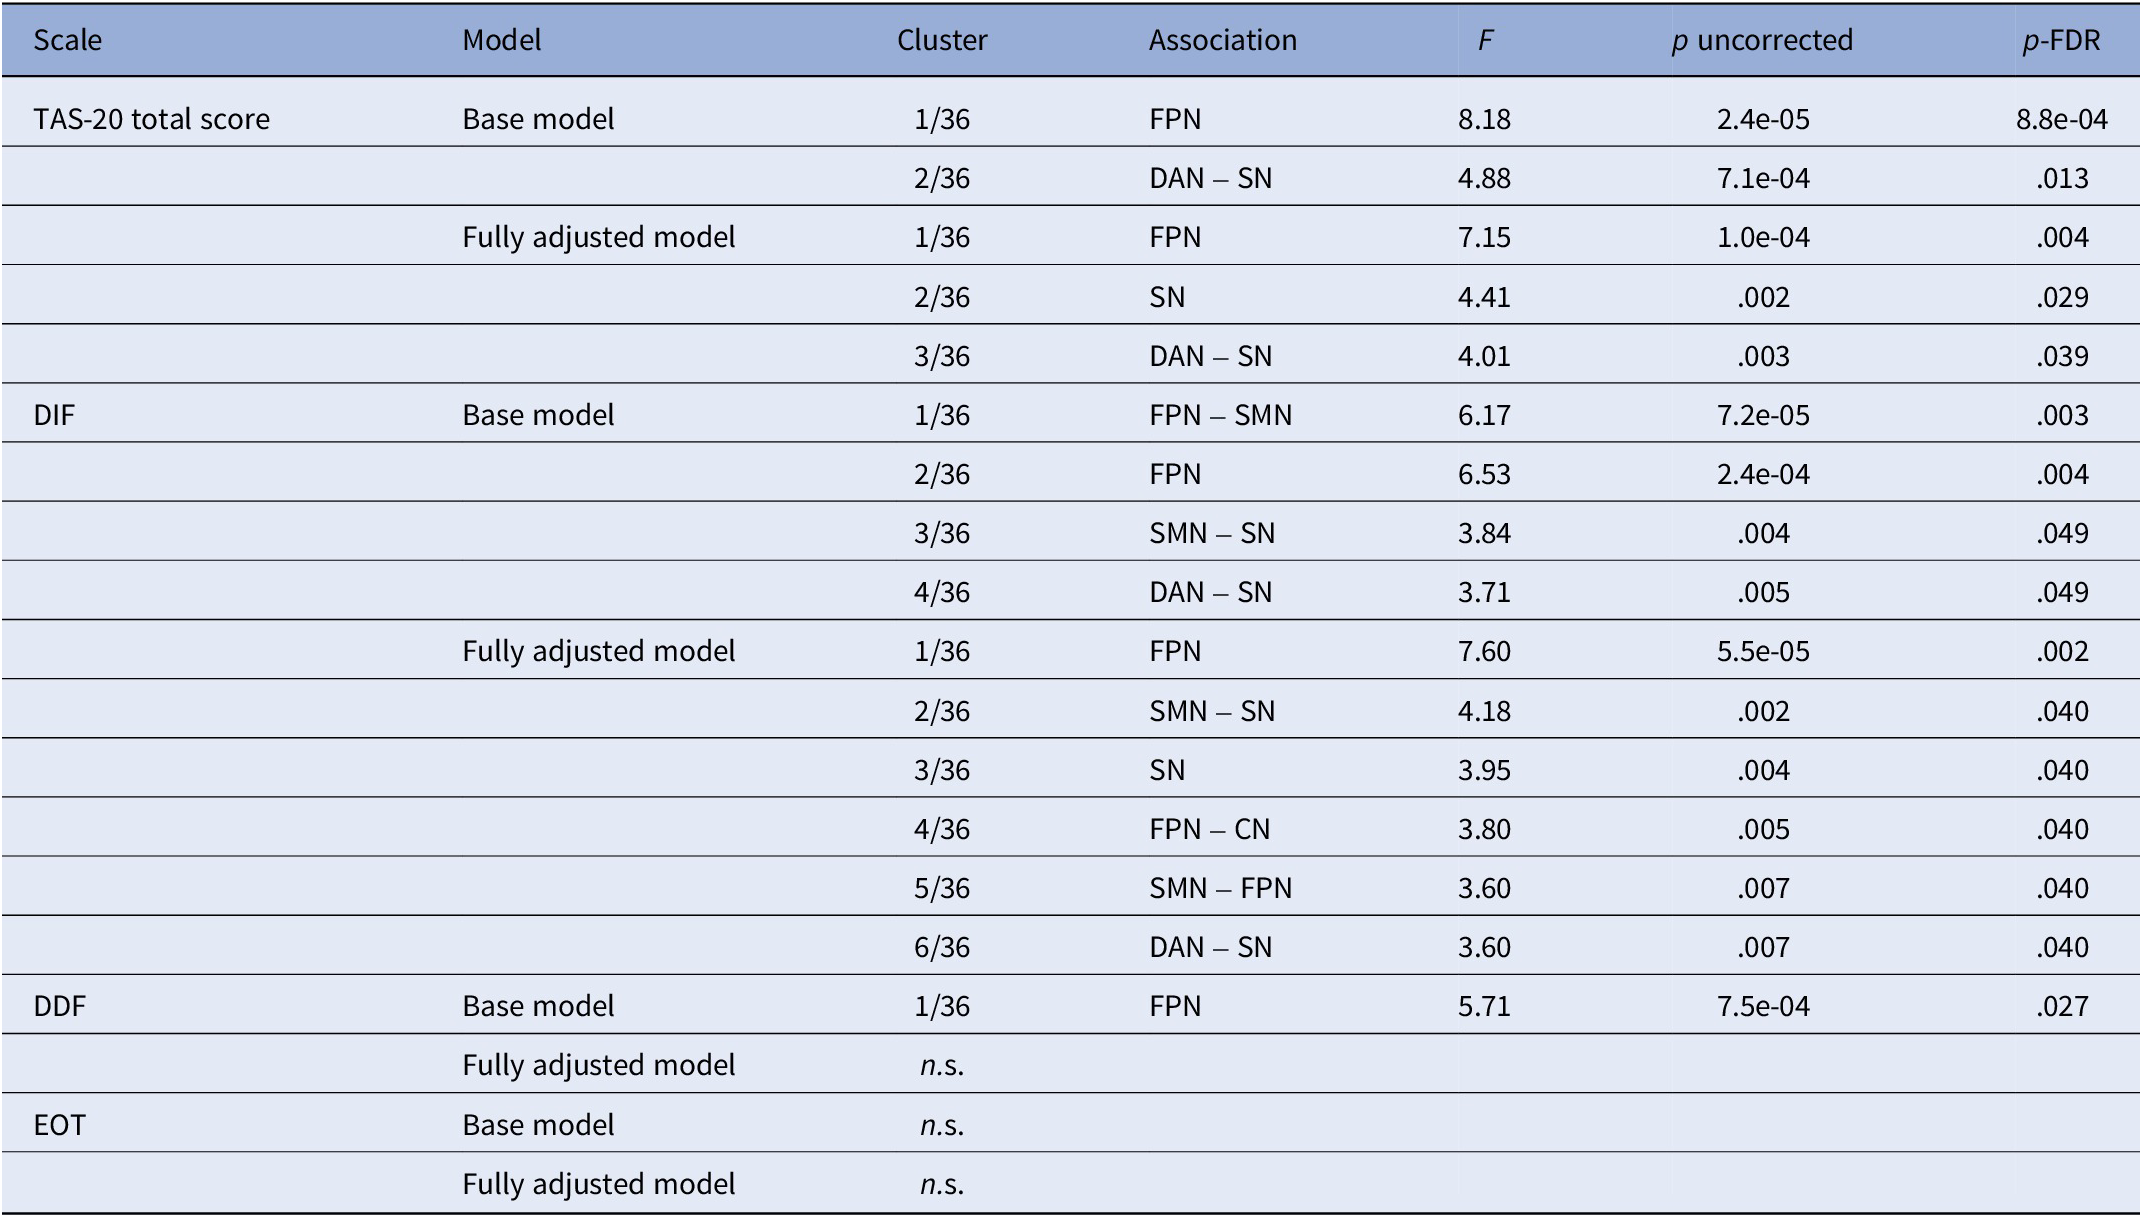
The TAS-20 total score was associated with altered FC within two clusters: one within the FPN (F(3,565) = 8.18, p = 8.8e-04; Supplementary Figure S6, Table 3 and Supplementary Table S2), and one between the DAN and SN (F(4,564) = 4.88, p = .013).
Functional connectivity
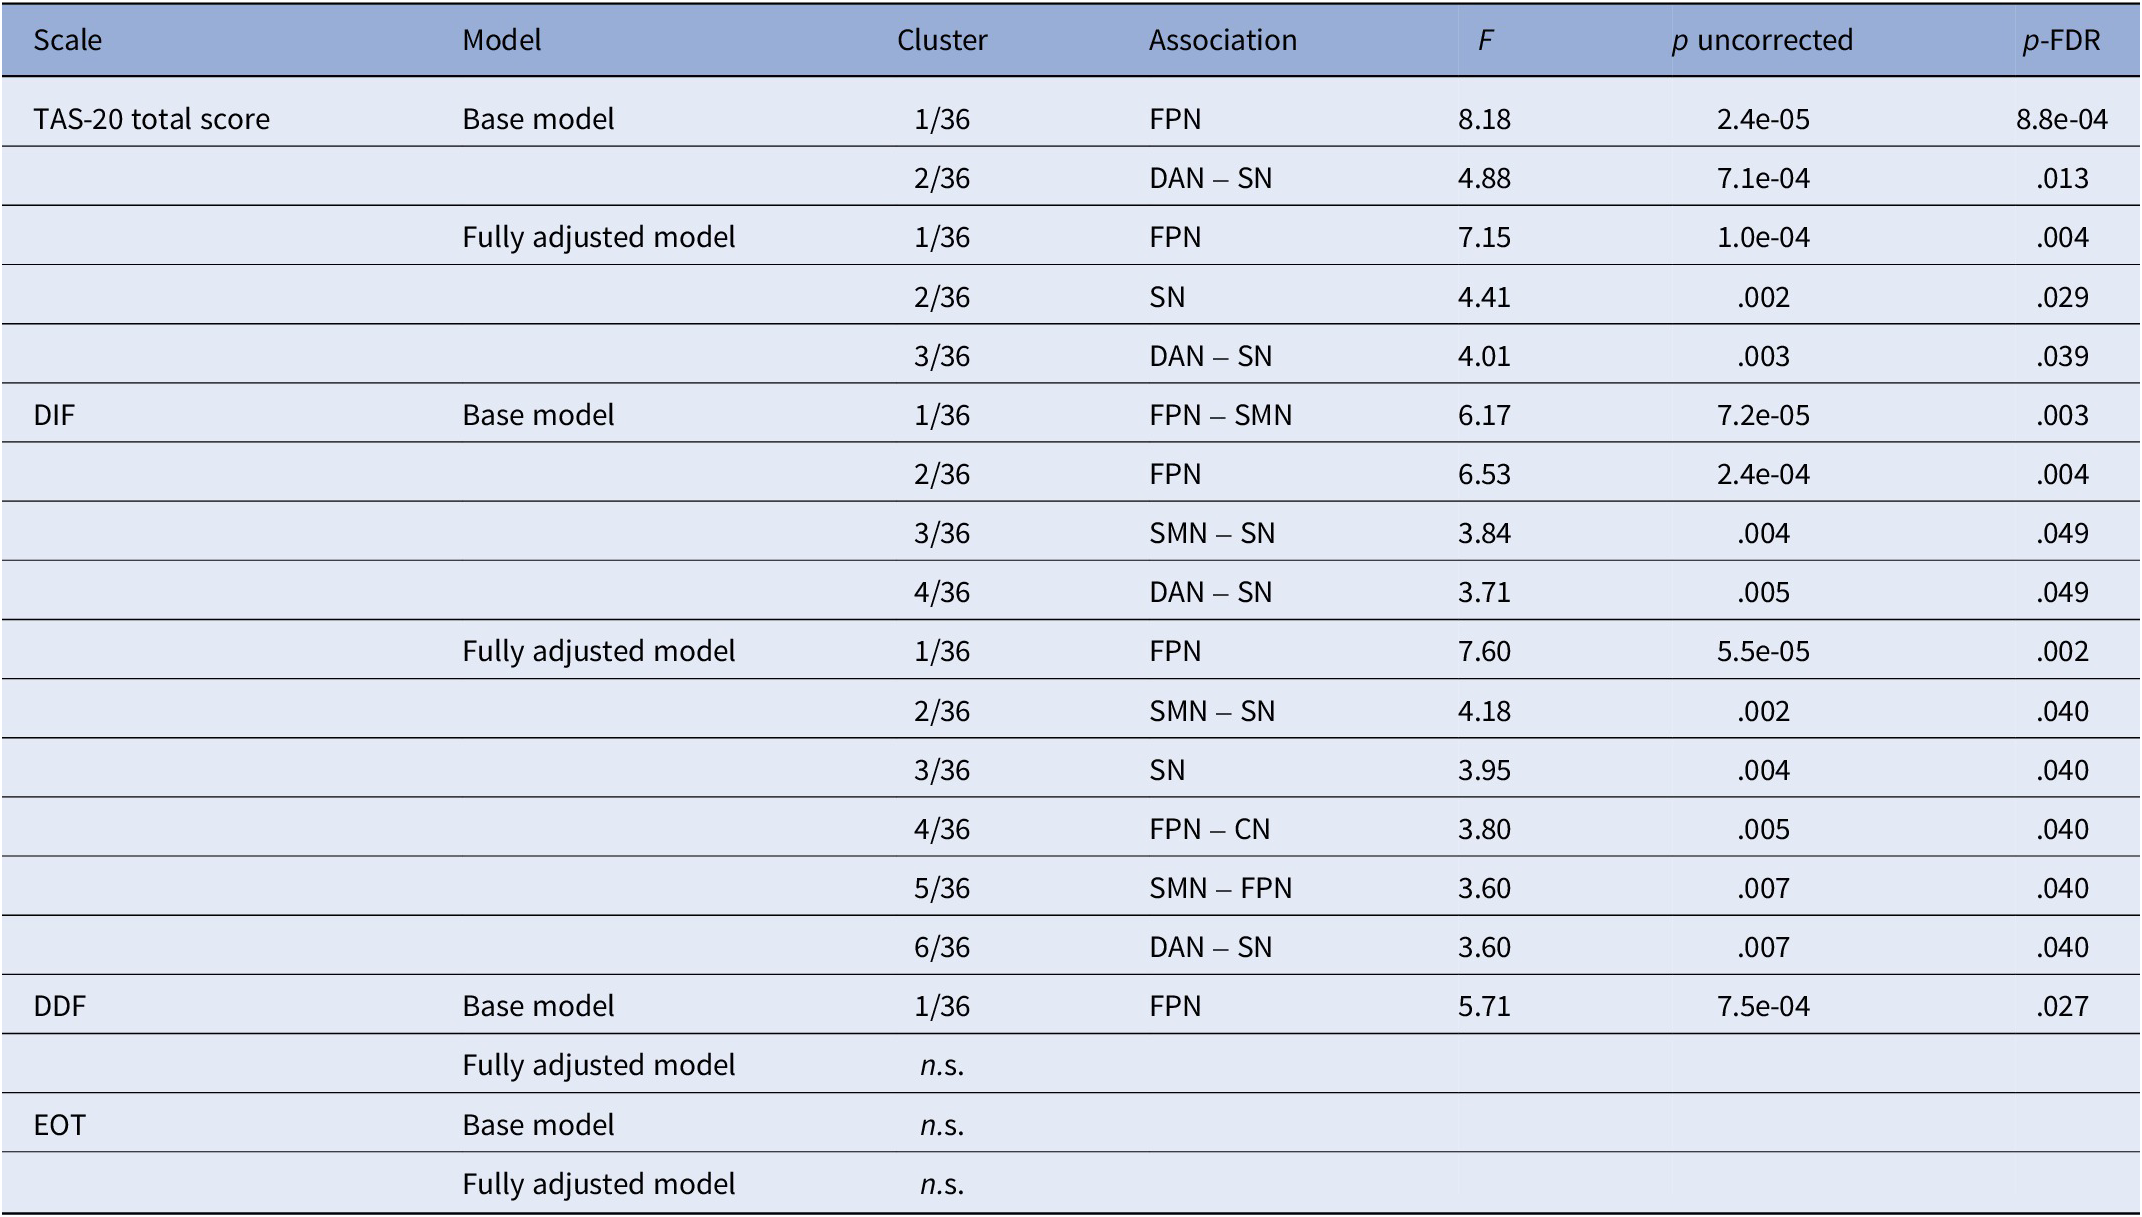
Notes: Only significant clusters are presented in the table. Base model, model adjusted for age (linear and quadratic), sex, handedness, and activated coils; CN, cerebellar network; DAN, dorsal attentional network; DDF, difficulties describing feelings; DIF, difficulties identifying feelings; EOT, externally oriented thinking; FPN, frontoparietal network; fully adjusted model, model adjusted for covariates of the base model plus BMI, school years, smoking behavior, alcohol consumption, and current depressive symptoms; n.s., not significant; SMN, sensorimotor network; SN, salience network; TAS-20, Toronto Alexithymia Scale.
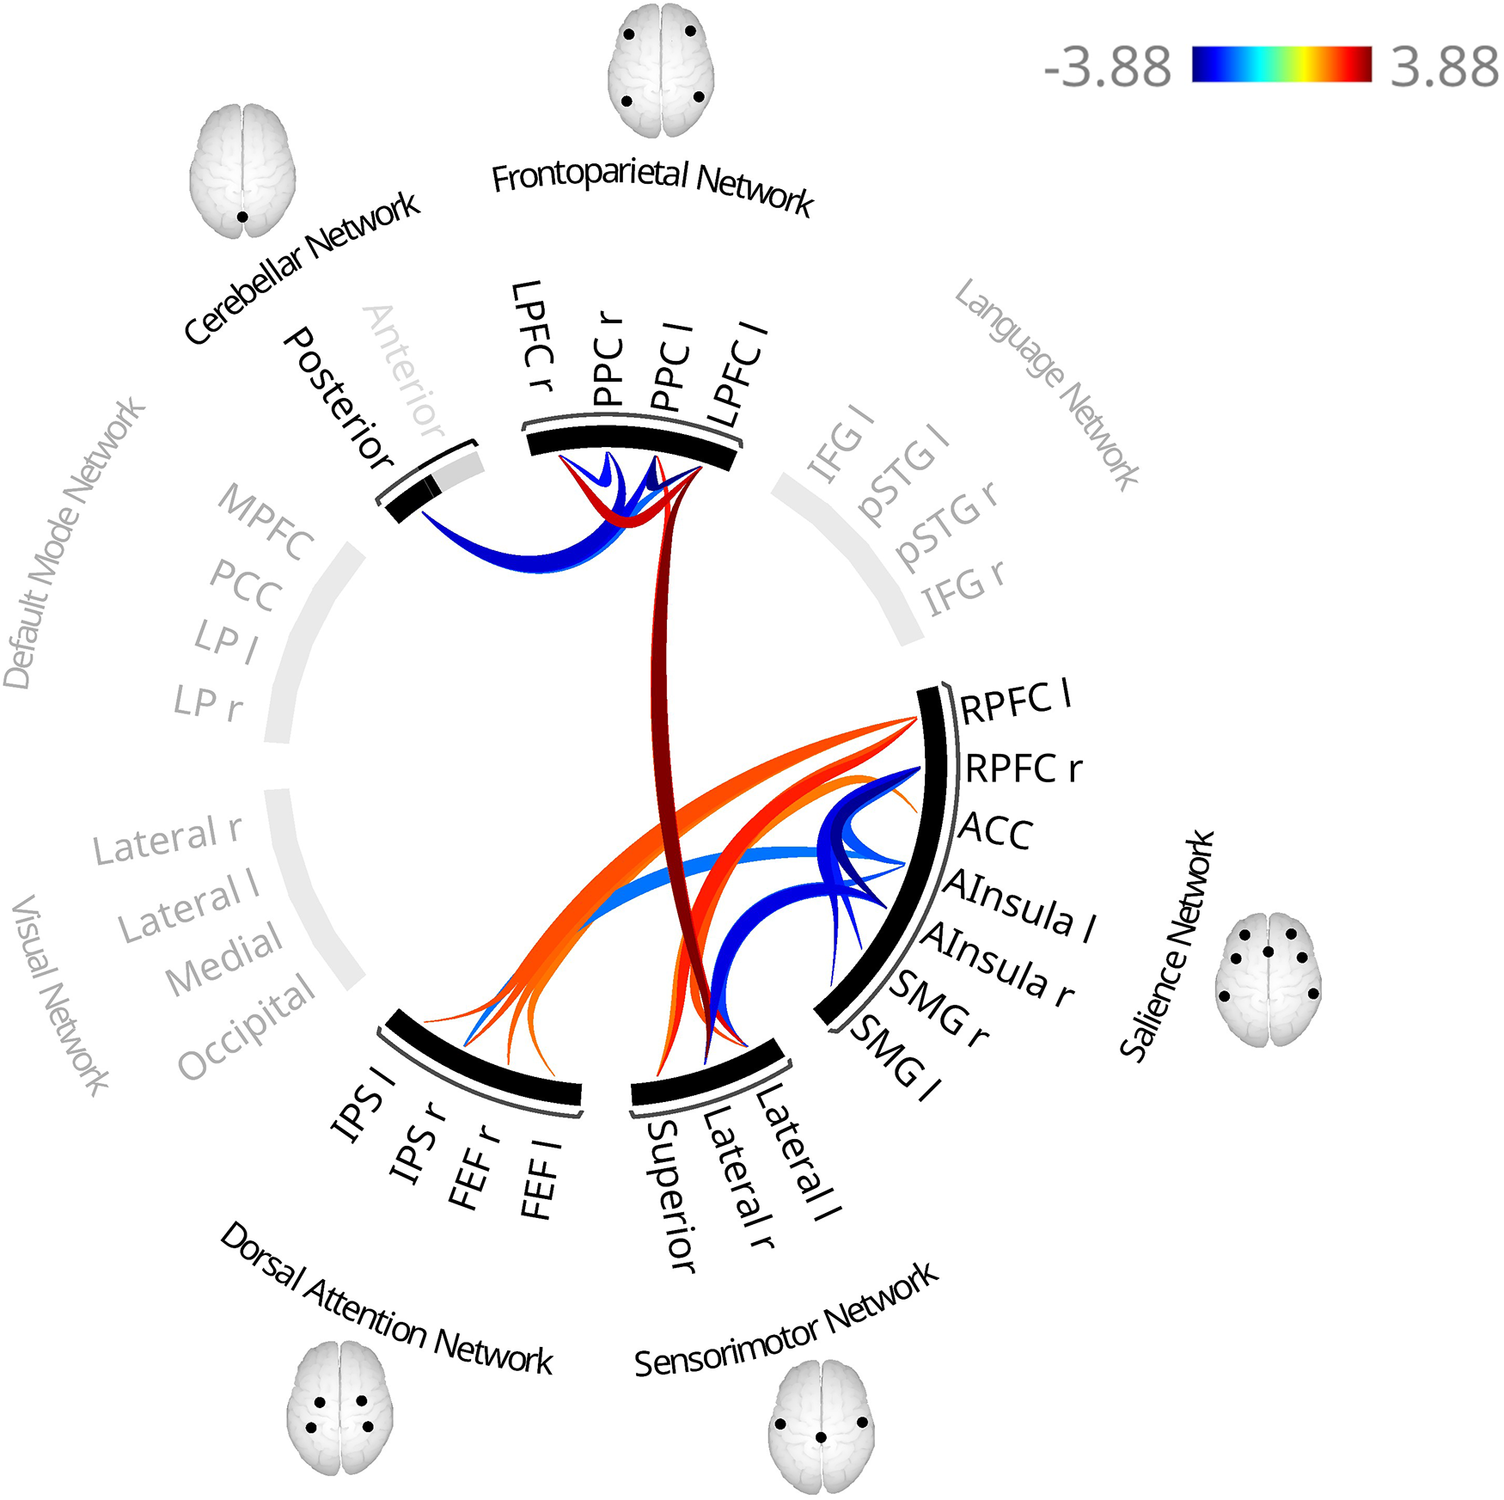
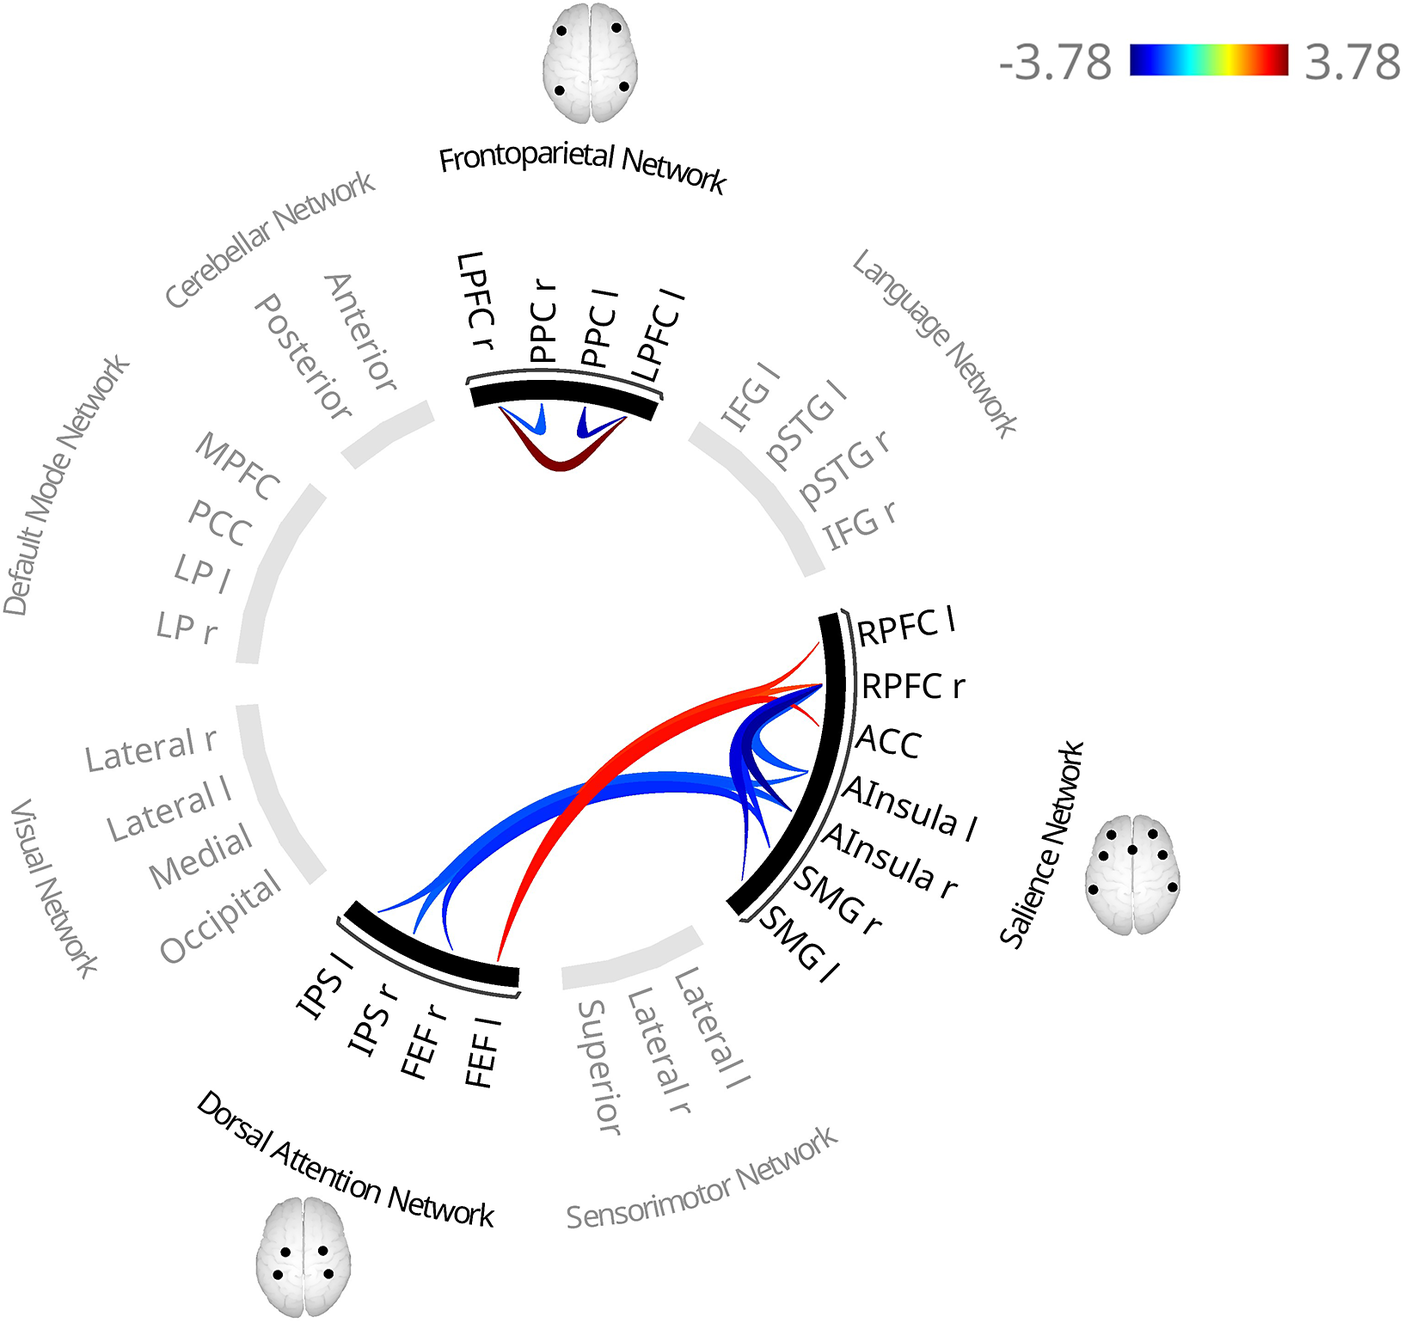
In the first cluster, higher TAS-20 total scores were associated with lower FC between the posterior parietal cortex (PPC) and lateral prefrontal cortex (LPFC) in both hemispheres and higher interhemispheric LPFC connectivity.
In the second cluster, FC was bilaterally lower between the anterior insula and the intraparietal sulcus (IPS), and between the right frontal eye field (FEF) and right supramarginal gyrus (SMG), alongside higher FC between the left FEF and the bilateral rostral prefrontal cortex (RPFC) and the ACC, and between the left IPS and left RPFC.
Fully adjusted model
Controlling for BMI, smoking, alcohol consumption, education, physical activity, partnership status, and depressive symptoms did not substantially change the FC pattern within the FPN (Figure 2, Tables 3 and S2, F(3,556) = 7.15, p = .004) or between the DAN and SN (F(3,556) = 4.01, p = .039), only the left IPS–left RPFC association did not survive correction. An additional cluster within the SN revealed lower FC between the right RPFC and both bilateral anterior insulae and SMGs (F(3,556) = 4.41, p = .029).
Functional connectivity patterns associated with higher TAS-20 total scores in the fully adjusted model. The fully adjusted model includes additional covariates beyond the base model, namely physical activity, relationship status, smoking, depressive symptoms, BMI, and educational level. Red lines indicate higher functional connectivity and blue lines indicate lower functional connectivity associated with higher scores. In contrast to the base model (adjusted for age, sex, coil configuration, and handedness), the larger left IPS–left RPFC association did not survive cluster correction. Notes: ACC, anterior cingulate cortex; AInsula, anterior insula; BMI, body mass index; FEF, frontal eye fields; IPS, intraparietal sulcus; l, left; LPFC, lateral prefrontal cortex; PPC, posterior parietal cortex; r, right; RPFC, rostral prefrontal cortex; SMG, supramarginal gyrus; TAS-20, Toronto Alexithymia Scale.

Functional connectivity and DIF
Base model
DIF scores were associated with altered FC in four clusters: between the FPN and the SMN (F(3, 563) = 6.17, p = .003; Supplementary Figure S7, Table 3 and Supplementary Table S3), within the FPN (F(3,564) = 6.53, p = .004), between the SMN and the SN (F(4,563) = 3.84, p = .048), and between the DAN and SN (F(3,563) = 3.71, p = .049).
In the first cluster, higher DIF scores were associated with higher FC between lateral and superior SMN nodes and the left FPN (LPFC, PPC), and between the right LPFC and right lateral SMN.
The second cluster showed higher interhemispheric LPFC connectivity and lower intrahemispheric LPFC–PPC connectivity.
In the third cluster, FC was lower between the left anterior insula and right lateral SMN and between the right anterior insula and bilateral lateral SMN, alongside higher FC between the left RPFC and both the left lateral and superior SMN, and between the ACC and superior SMN.
Within the fourth cluster, FC was lower between the left anterior insula and right IPS, alongside higher FC between the left RPFC and bilateral IPS and right FEF, and between the right RPFC and left FEF.
Fully adjusted model
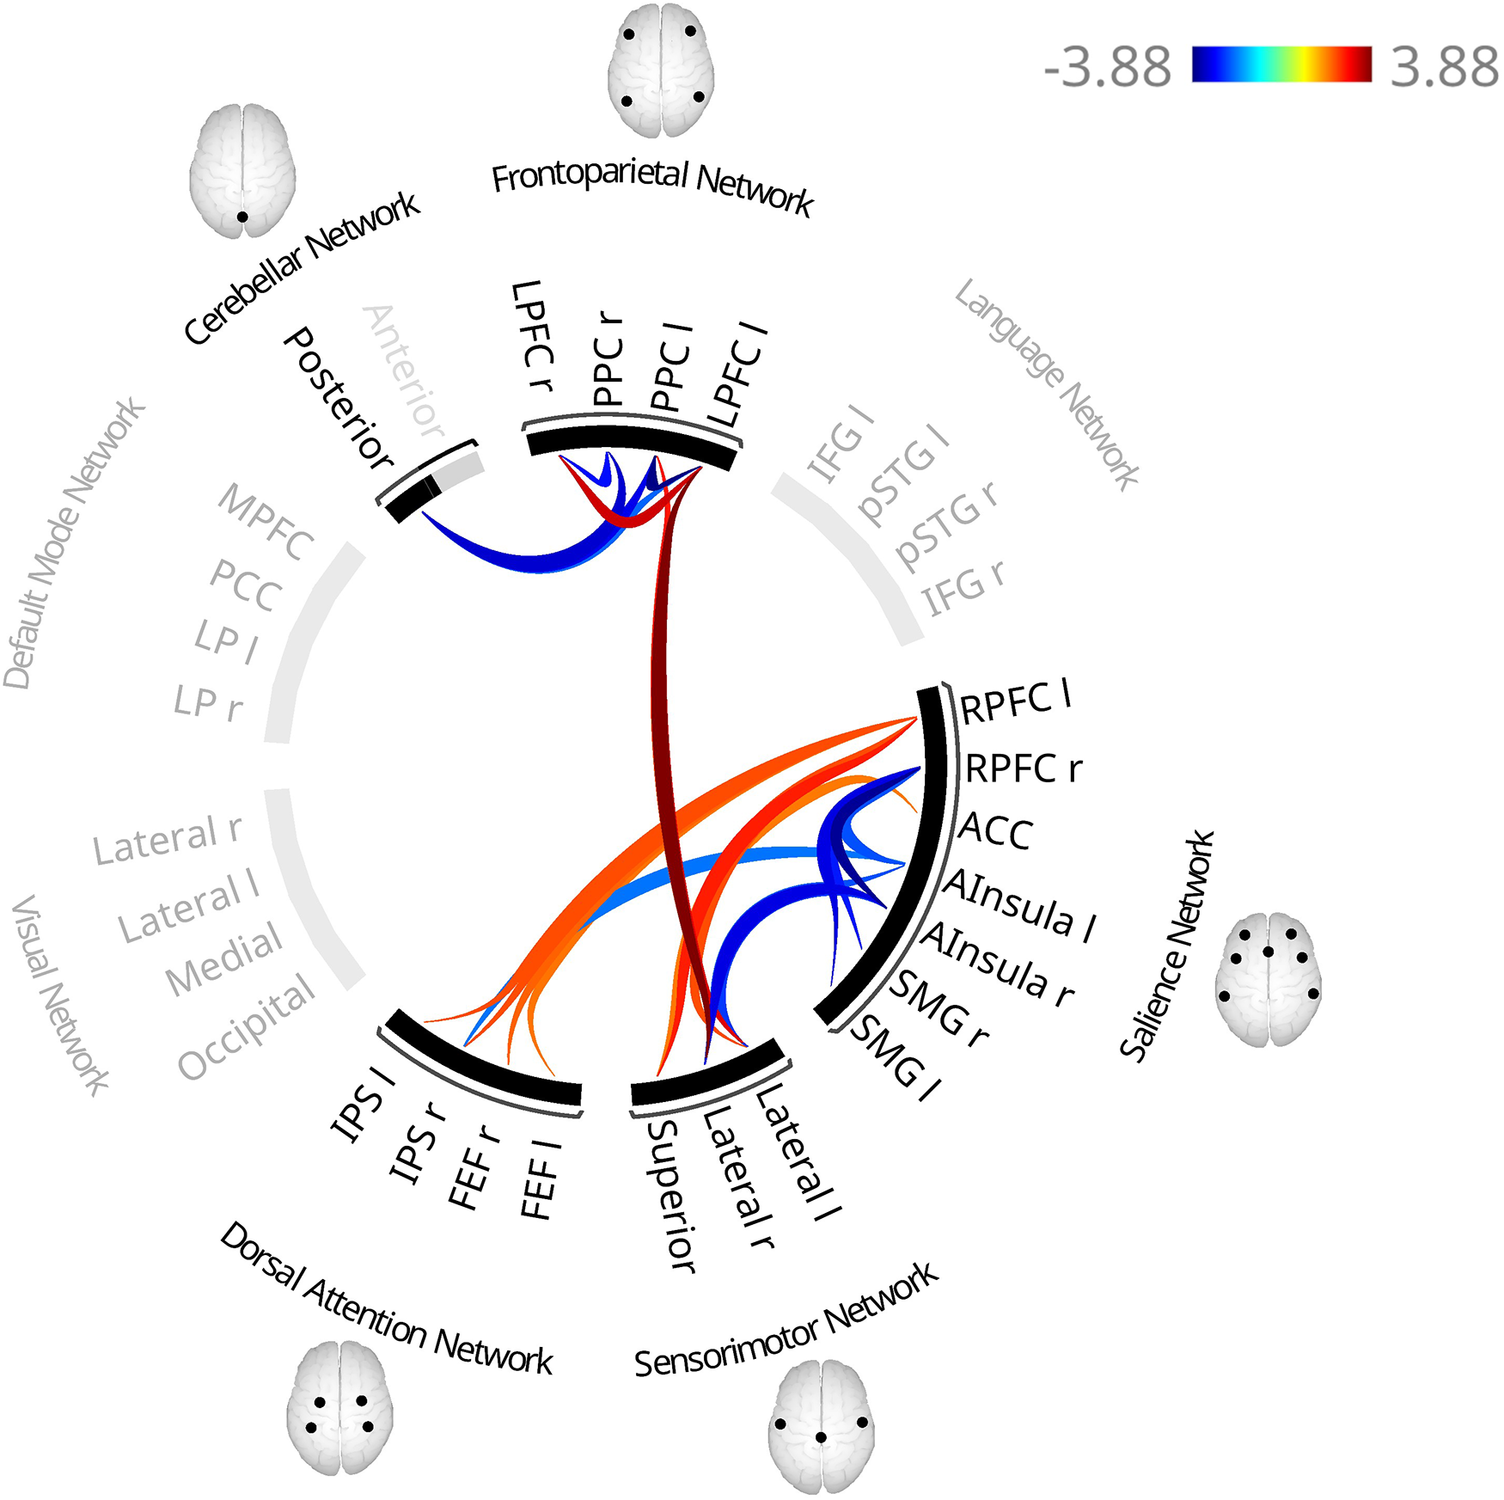
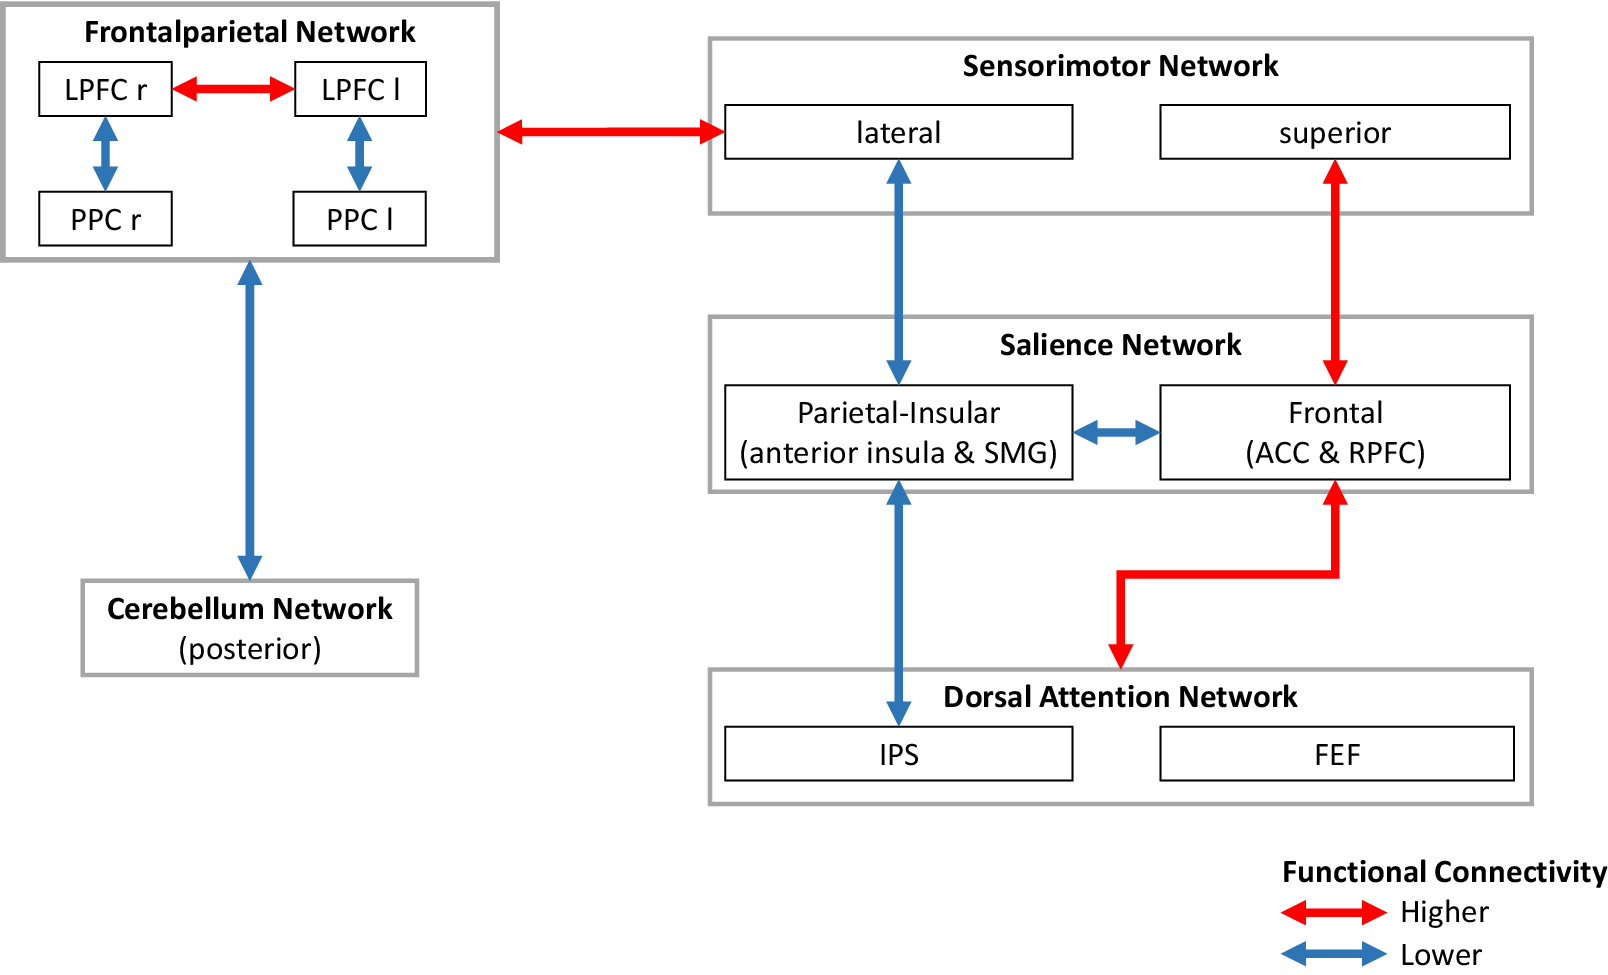
Two additional clusters emerged, within the SN (F(4,555) = 3.95, p = .040) and between the CN and FPN (F(4,555) = 3.80, p = .040), while clusters revealed in the base model remained largely unchanged (Figure 3, Figure 4 for simplified visualization, Table 3 and Supplementary Table S3).
Functional connectivity patterns associated with higher scores on the subscale ‘Difficulties Identifying Feelings’ of the 20-item Toronto Alexithymia Scale (TAS-20) in the fully adjusted model. The fully adjusted model includes additional covariates beyond the base model, namely physical activity, relationship status, smoking, depressive symptoms, BMI, and educational level. Red lines indicate higher functional connectivity and blue lines indicate lower functional connectivity associated with higher scores. In contrast to the base model (adjusted for age, sex, coil configuration, and handedness), an additional cluster revealed smaller association between the posterior CN and the bilateral PPC and left LPFC. Additionally, FC was higher between the right RPFC and superior SMN, and between the left RPFC and left FEF. In contrast, the connectivity between the superior SMN and both the left PPC and left LPFC did not survive correction. Notes: ACC, anterior cingulate cortex; AInsula, anterior insula; FEF, frontal eye fields; IPS, intraparietal sulcus; l, left; LPFC, lateral prefrontal cortex; PPC, posterior parietal cortex; r, right; RPFC, rostral prefrontal cortex.
Simplified schematic visualization of the functional connectivity pattern associated with higher scores on the subscale “Difficulties Identifying Feelings” of the 20-item Toronto Alexithymia Scale (TAS-20). Notes: ACC, anterior cingulate cortex; FEF, frontal eye fields; IPS, intraparietal sulcus; l, left; LPFC, lateral prefrontal cortex; PPC, posterior parietal cortex; r, right; RPFC, rostral prefrontal cortex; SMG, supramarginal gyrus.
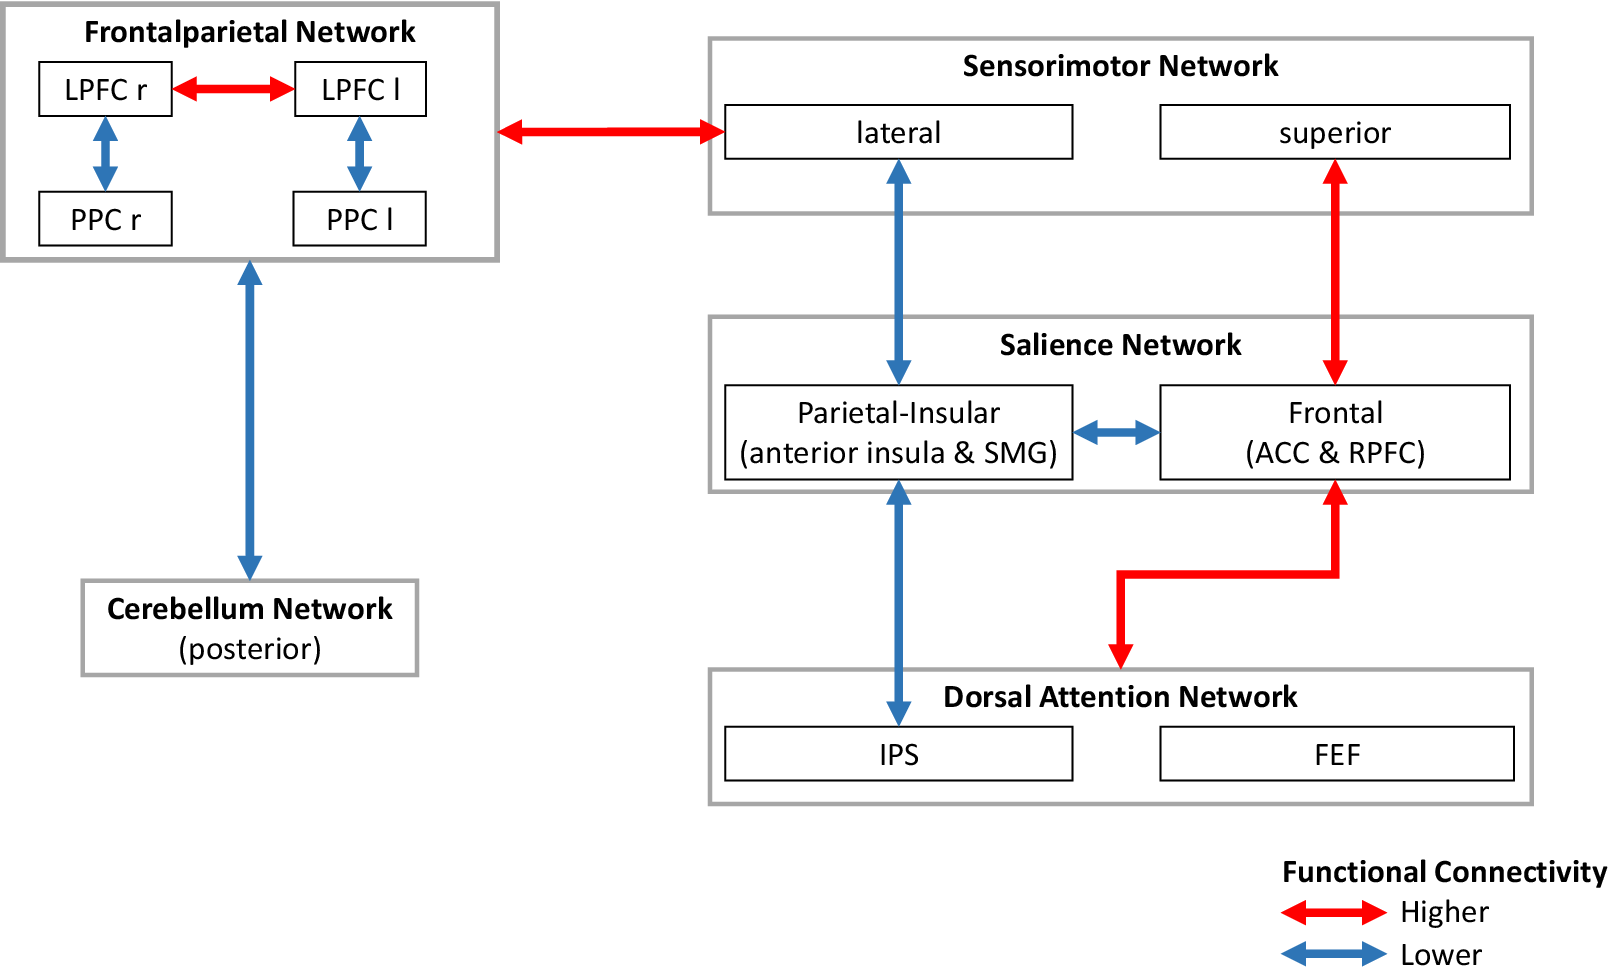
Specifically, higher DIF scores were associated with lower FC between the right RPFC and both bilateral anterior insula and SMG, and between the posterior CN and bilateral PPC and left LPFC.
Minor changes were observed in previously identified clusters: FC between the superior SMN and right RPFC, right RPFC-left FEF, and right LPFC-superior SMN did not survive correction.
Functional connectivity and DDF
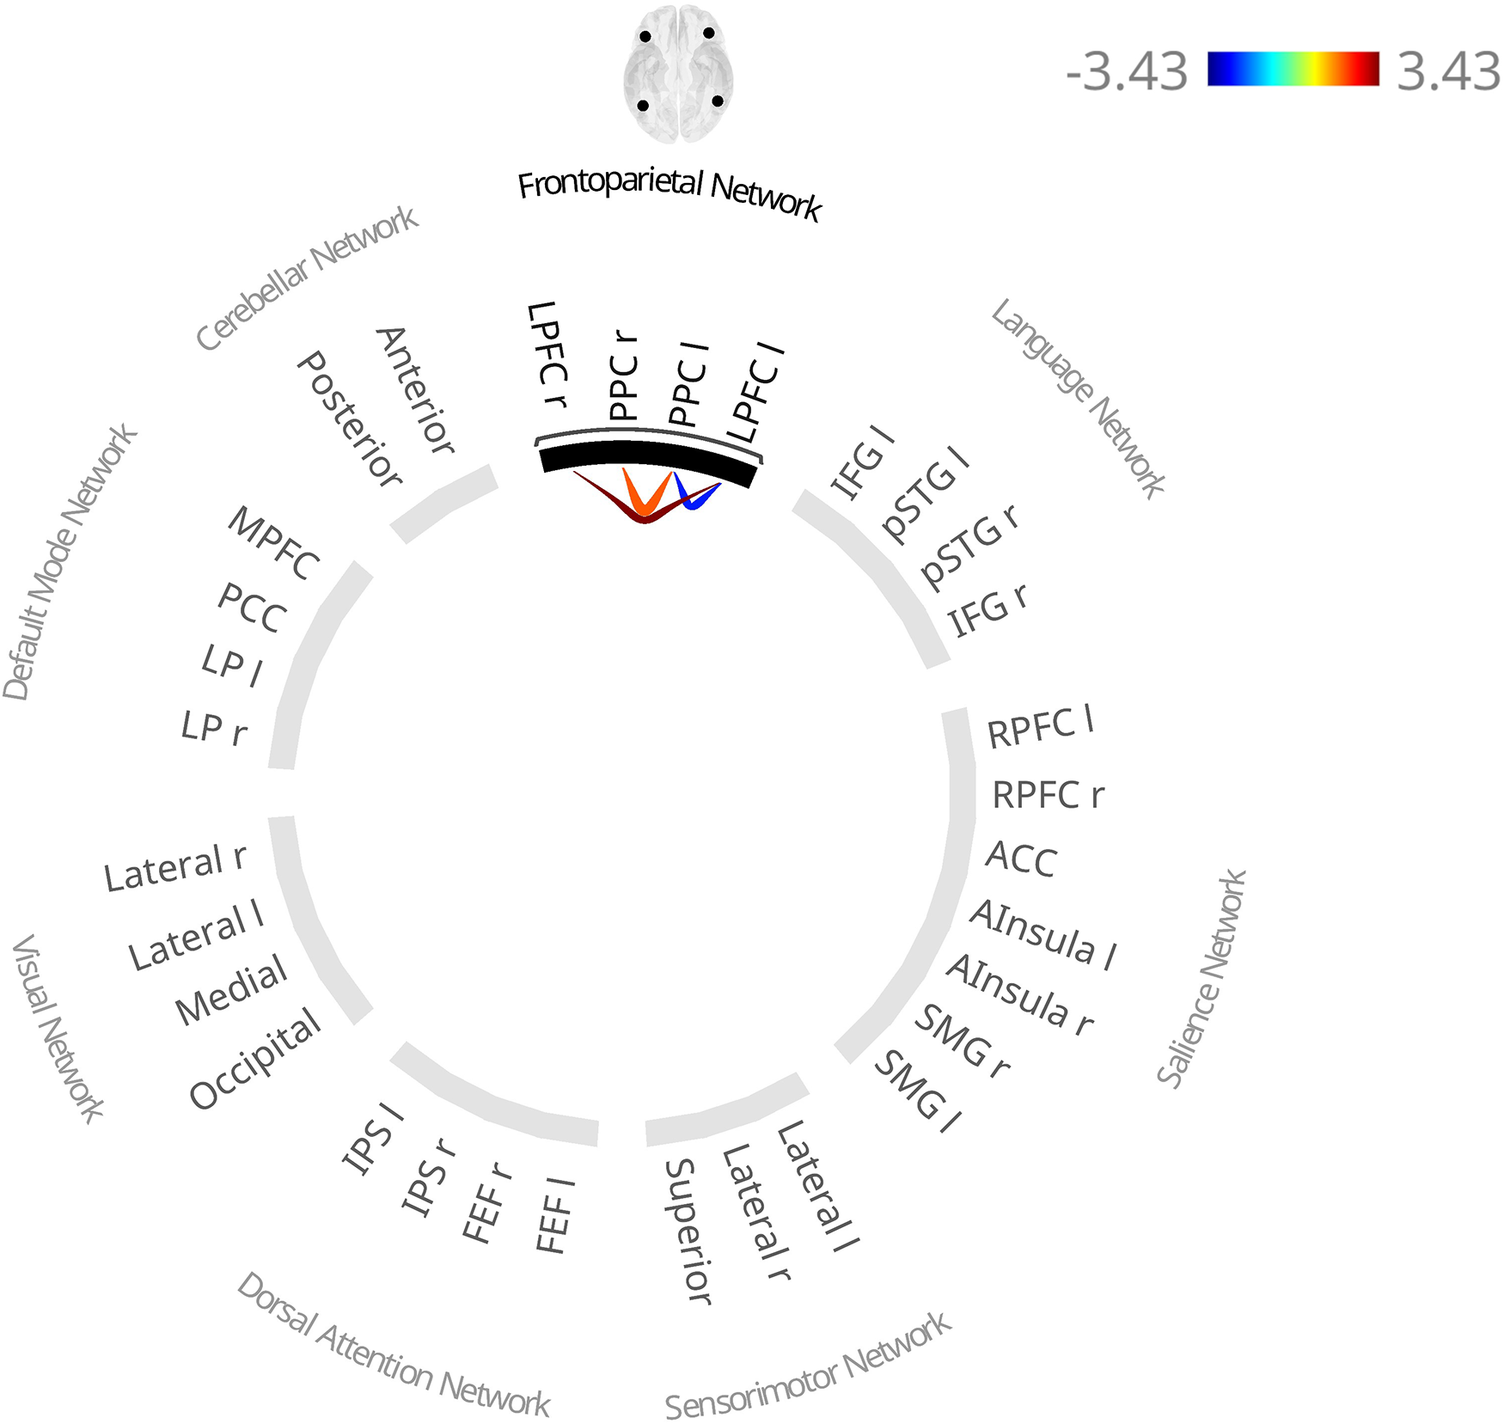
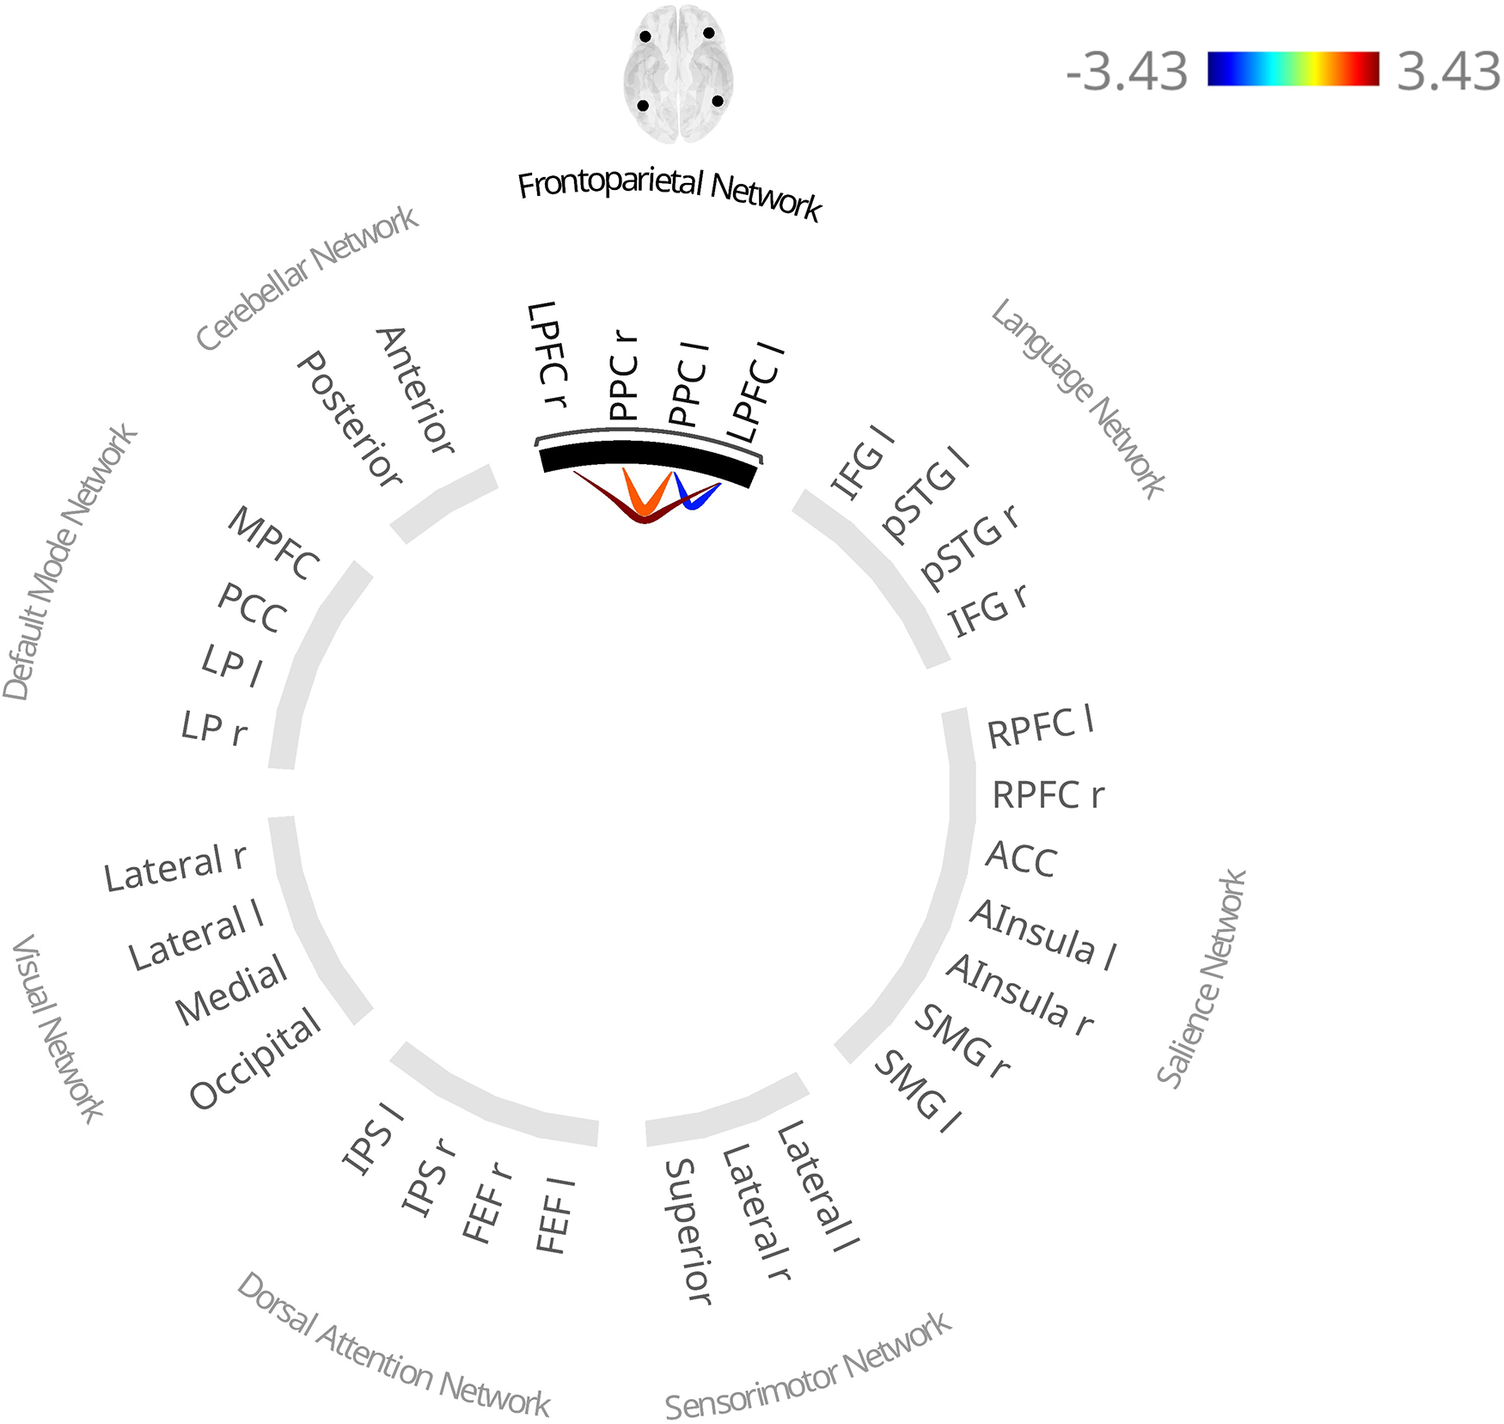
DDF scores were associated with one cluster (F(3,565) = 5.71, p = .027; Figure 5, Table 3, and Supplementary Table S4), showing higher interhemispheric PPC and LPFC connectivity and lower left PPFC-LPFC connectivity, which was no longer present in the fully adjusted model.
Functional connectivity patterns associated with higher scores on the subscale “Difficulties Describing Feelings” of the Toronto Alexithymia Scale (TAS-20) in the base model (adjusted for age, sex, coil configuration, and handedness). Red lines indicate higher functional connectivity and blue lines indicate lower functional connectivity associated with higher scores. Notes: l, left; r, right; LPFC, lateral prefrontal cortex; PPC, posterior parietal cortex.
Functional connectivity and EOT
No EOT-related FC alterations were observed in either model.
Functional connectivity within the DMN
TAS-20 total score
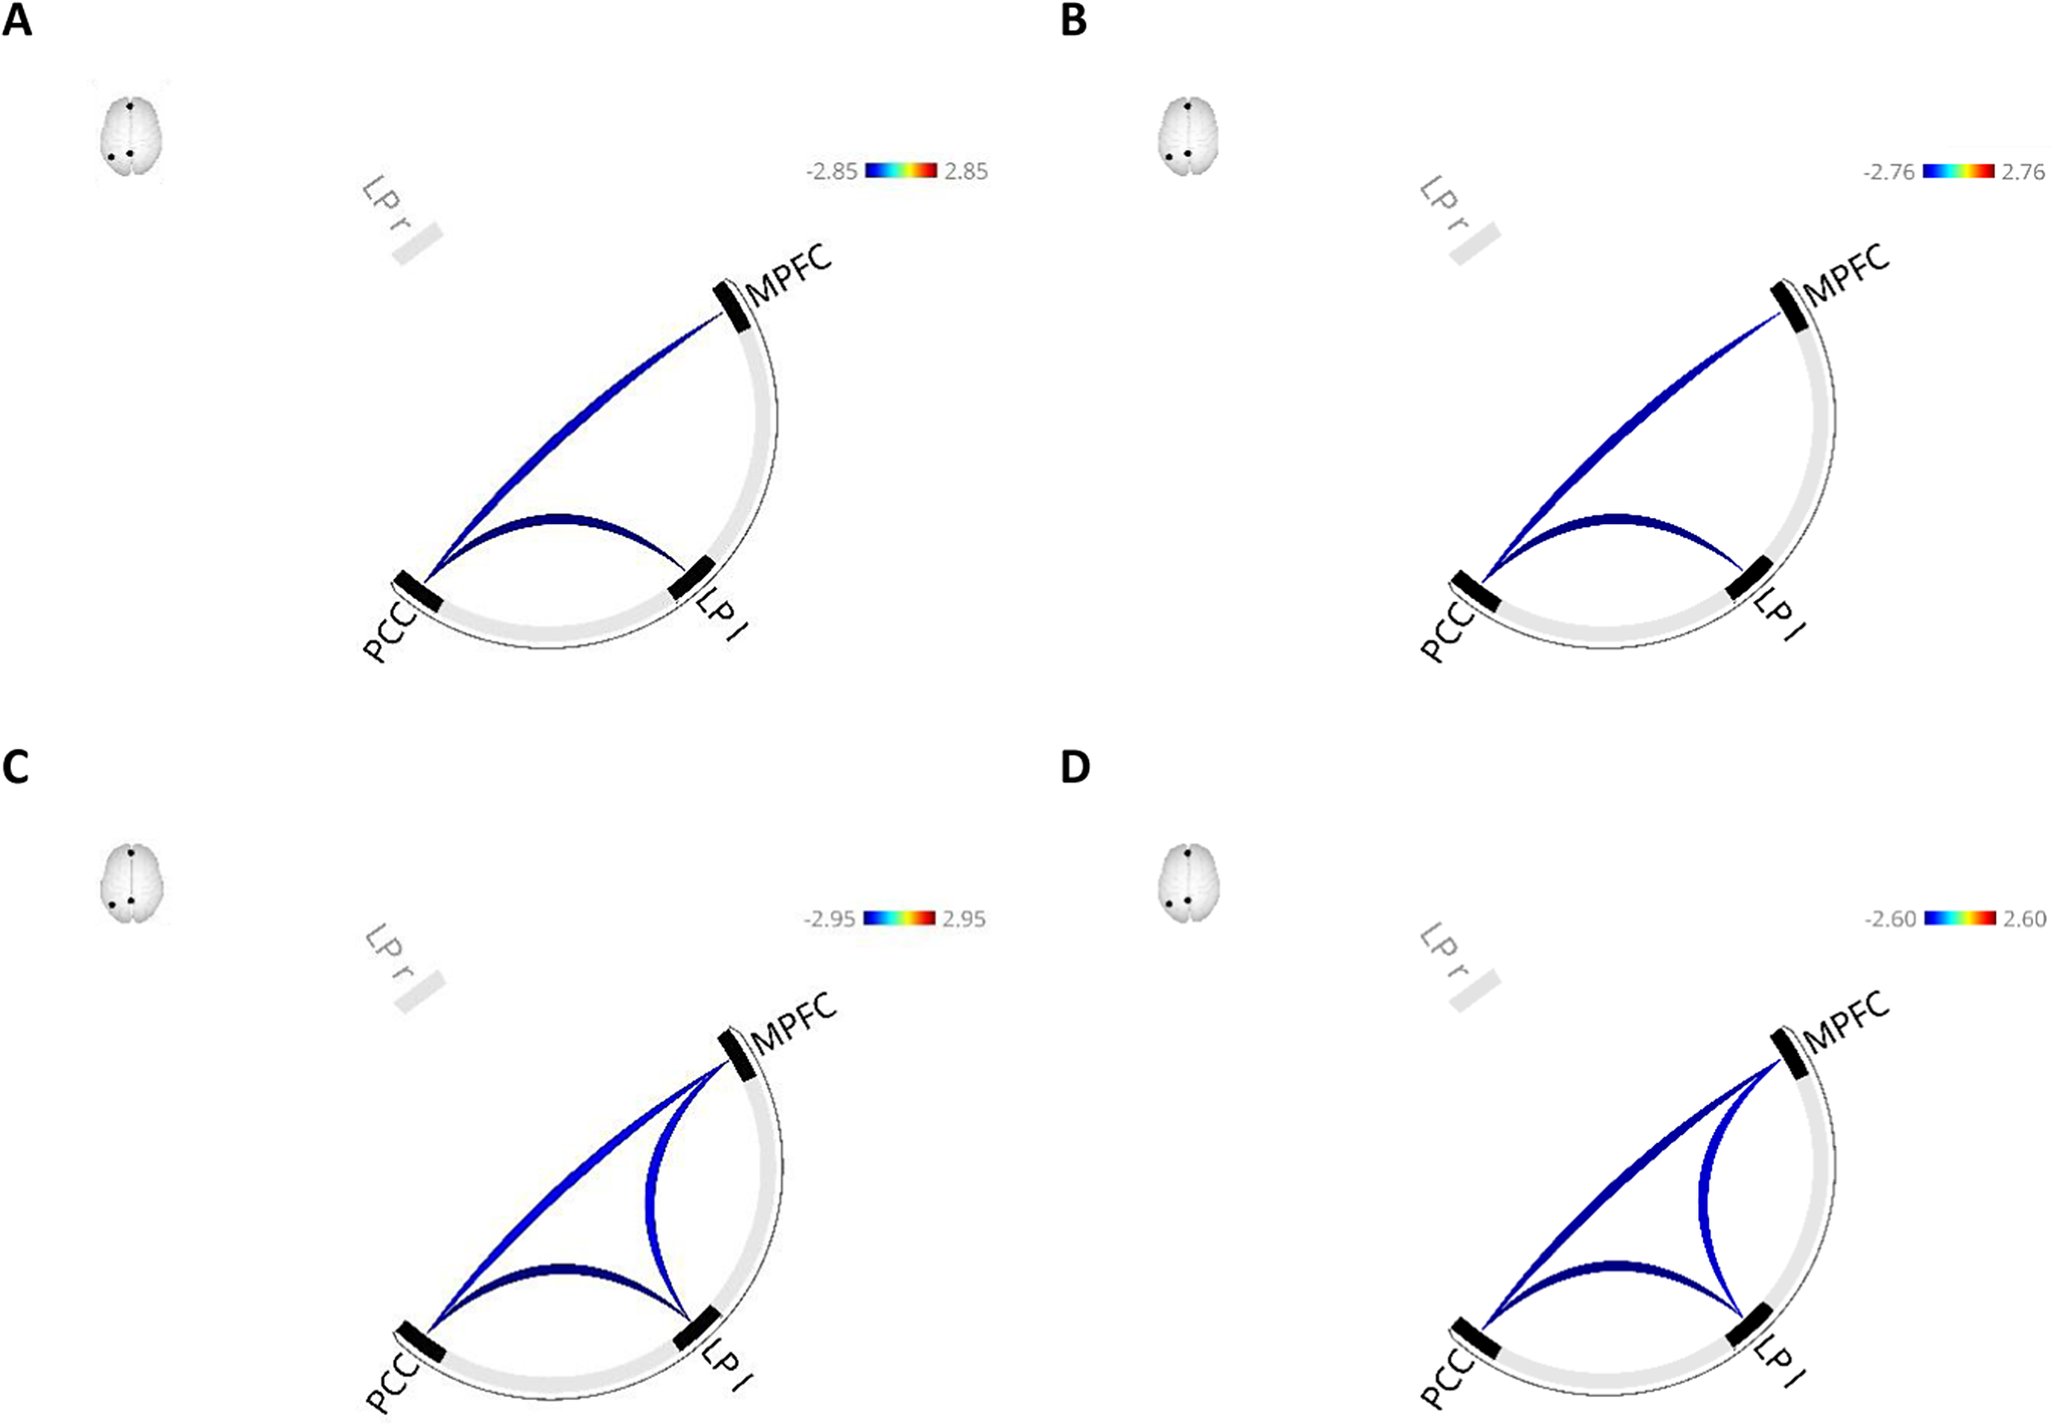
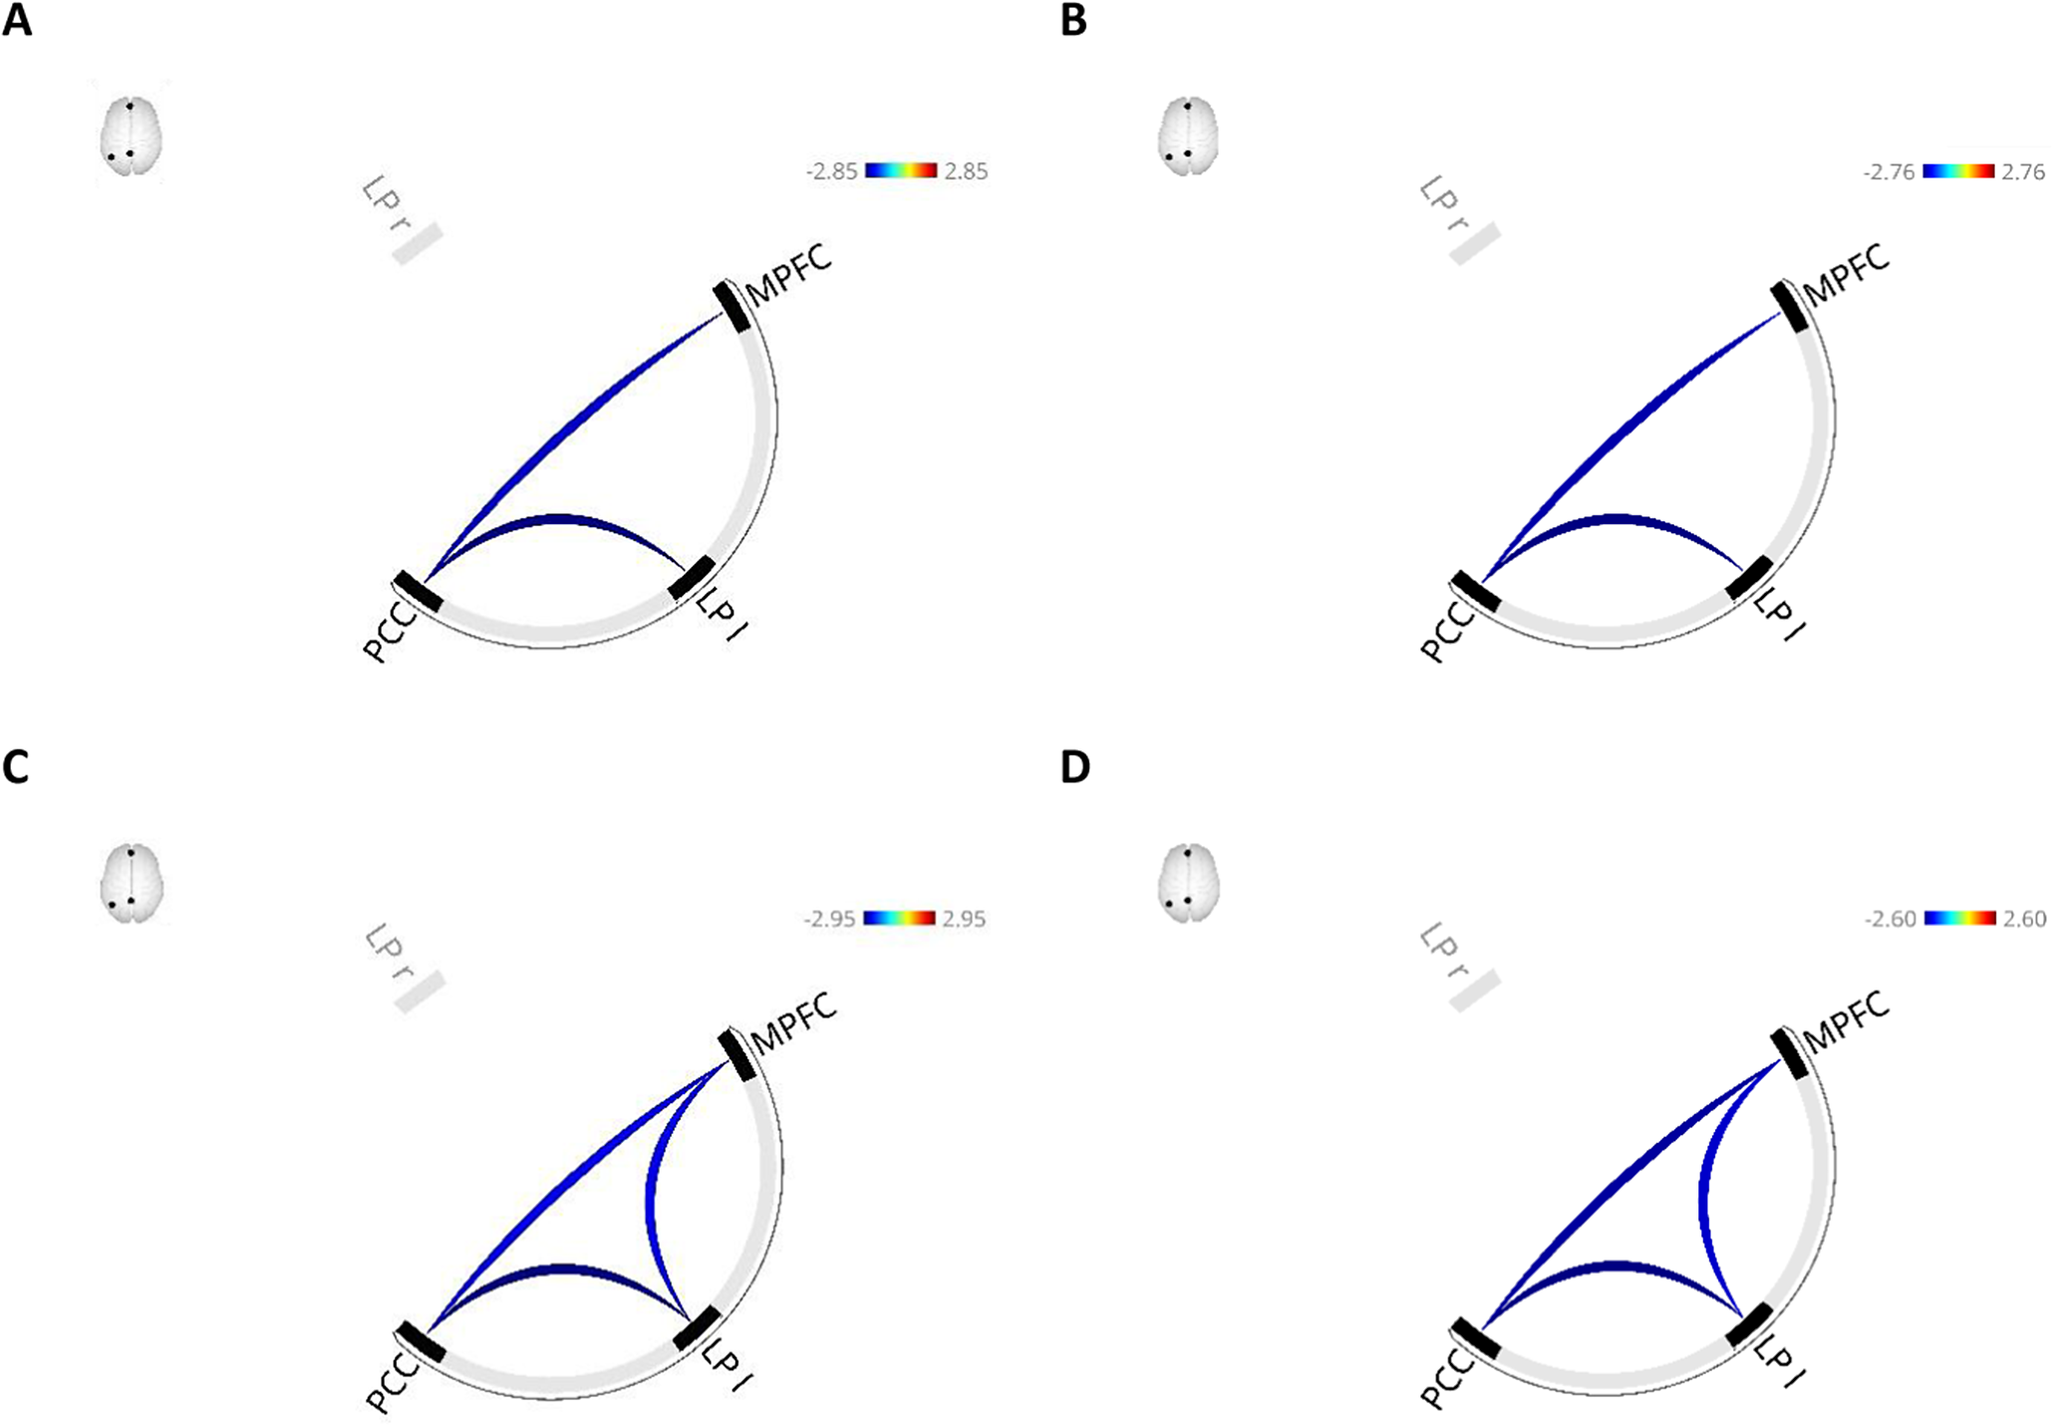
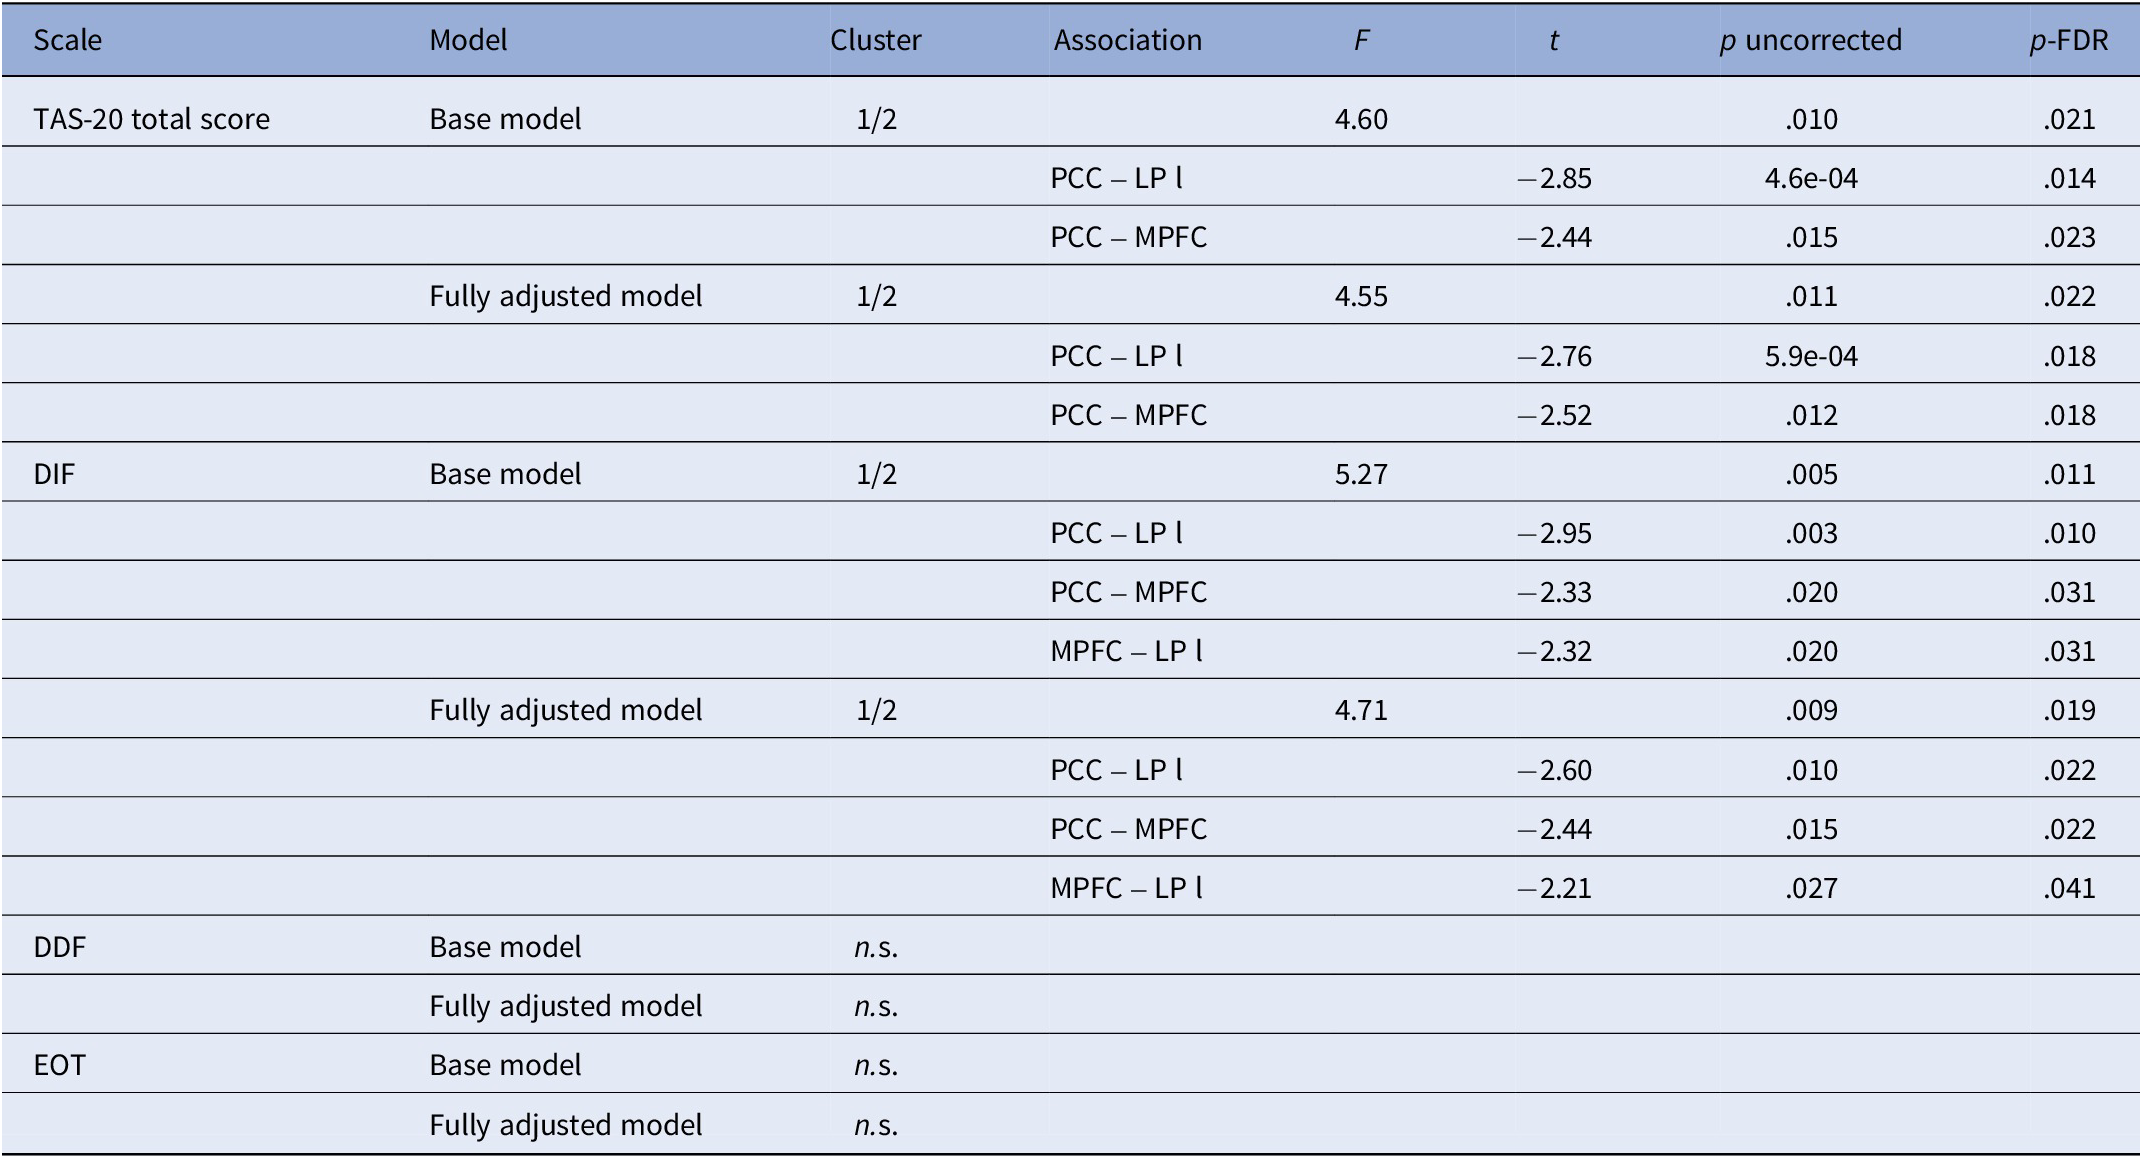
Higher scores were associated with lower left LP-PCC and MPFC-PCC connectivity in both the base (F(2,566) = 4.60, p = .021; Figure 6A, Table 4) and fully adjusted model (F(2,558) = 4.55, p = .022; Figure 6B, Table 4).
Functional connectivity patterns associated with higher Toronto Alexithymia Scale (TAS-20) total scores in the base model (A) and the fully adjusted model (B), and with higher scores on the “Difficulties Identifying Feelings” subscale of the TAS-20 in the base model (C) and the fully adjusted model (D). The base model was adjusted for age, sex, coil configuration, and handedness, while the fully adjusted model additionally included physical activity, relationship status, smoking, depressive symptoms, BMI, and educational level. Red lines indicate higher functional connectivity and blue lines indicate lower functional connectivity associated with higher scores. Notes: LP l, left lateral pole; MPFC, medial prefrontal cortex; PPC, posterior parietal cortex.
Functional connectivity in the default mode network
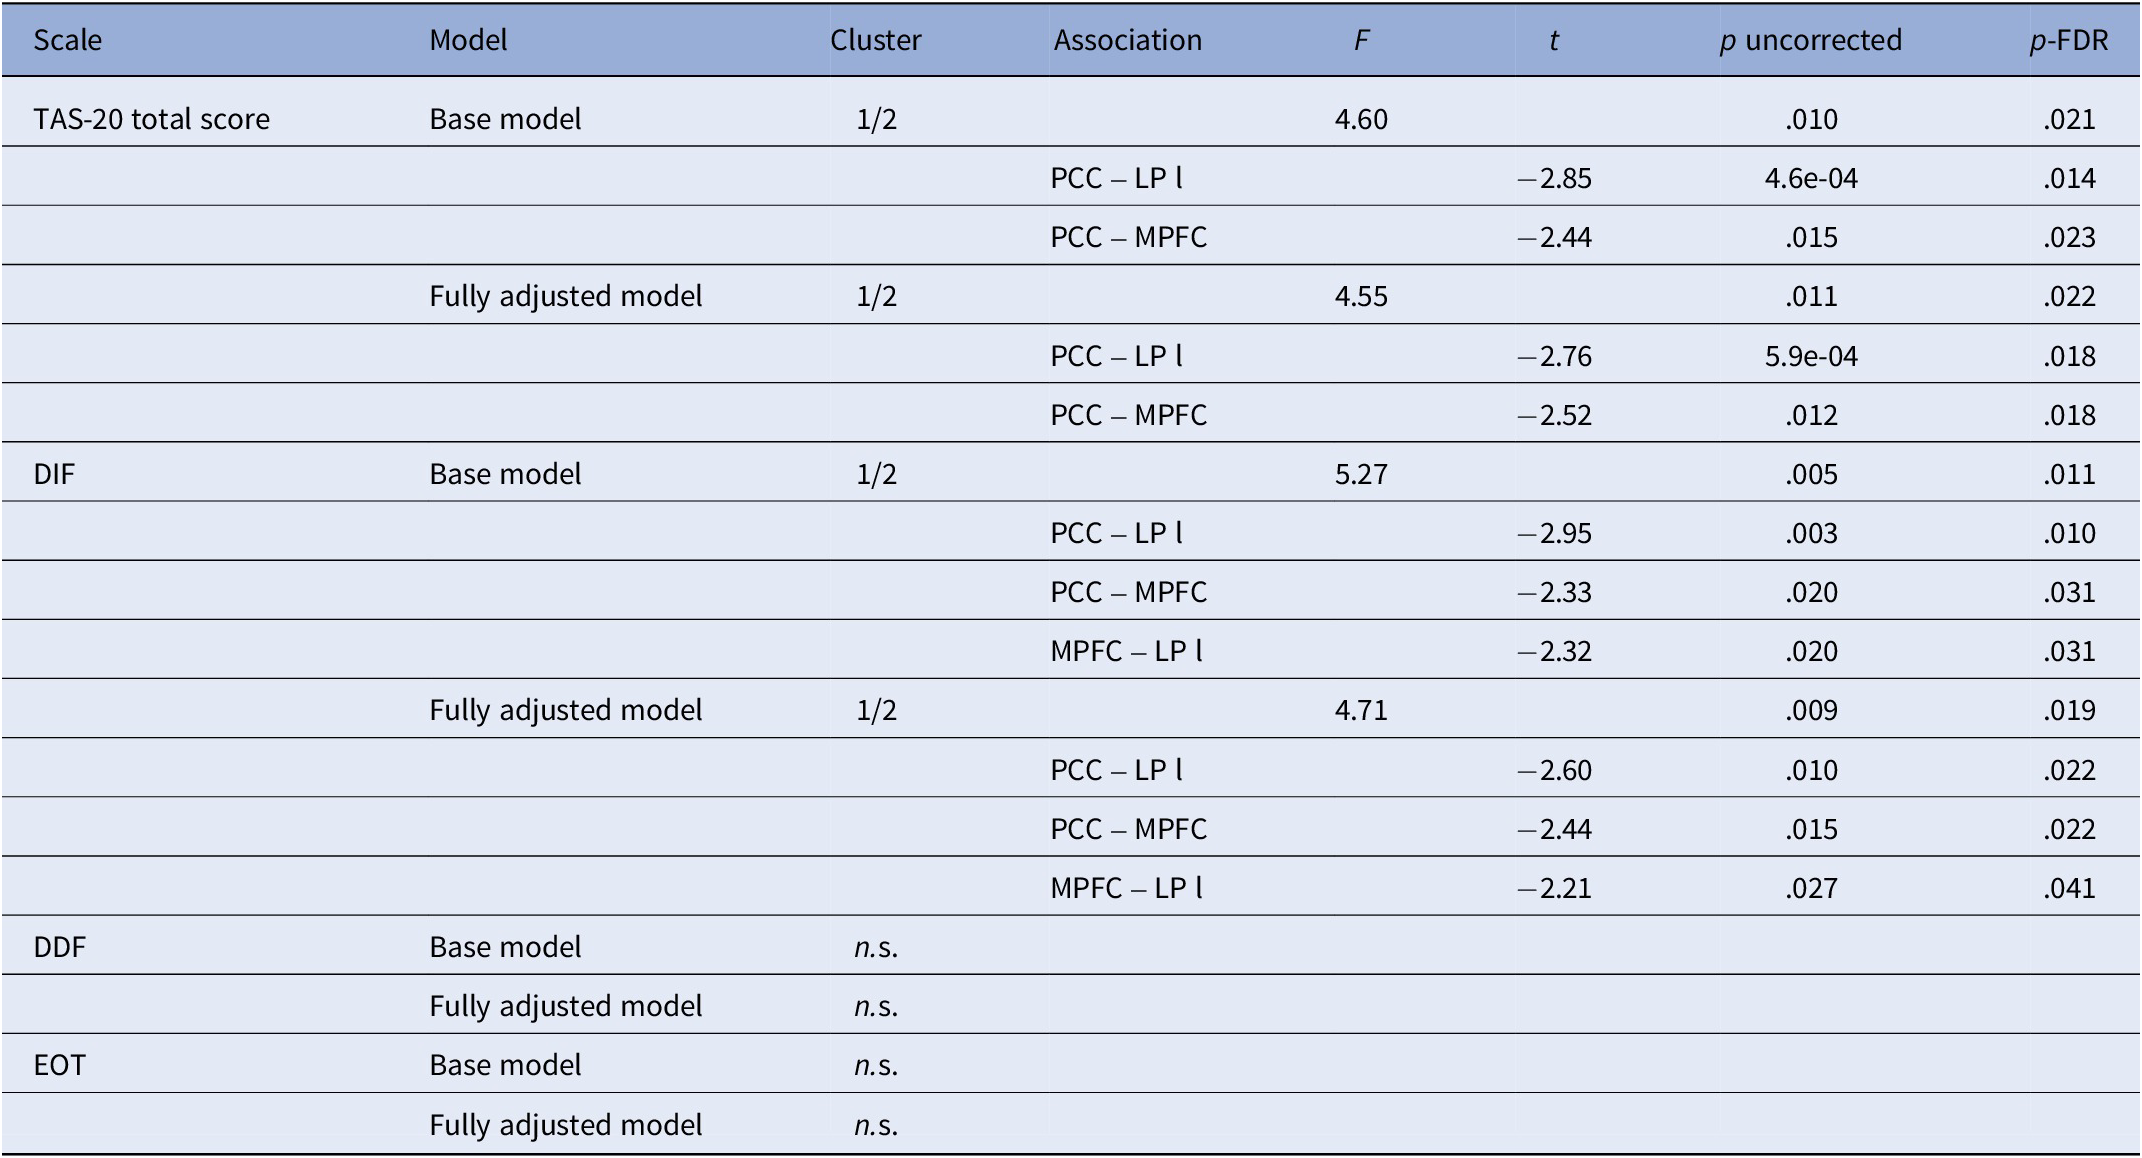
Notes: Only significant clusters are presented in the table. Base model, model adjusted for age (linear and quadratic), sex, handedness, and activated coils; DDF, difficulties describing feelings; DIF, difficulties identifying feelings; EOT, externally oriented thinking; FDR, False Discovery Rate; Fully adjusted model, model adjusted for covariates of the base model plus BMI, educational level, relationship status, physical activity, smoking behavior, alcohol consumption, and current depressive symptoms; LP l, lateral pole left; LP r, lateral pole right; MPFC, medial prefrontal cortex; n.s., not significant; PCC, posterior cingulate cortex; TAS-20, Toronto Alexithymia Scale.
Discussion
Investigating alexithymia-related functional brain networks, we identified distinct alterations within and between networks implicated in emotion processing and attention allocation. To our knowledge, this is the first population-based, whole-brain study to demonstrate such alterations of FC across the alexithymia spectrum, enhancing generalizability.
Higher TAS-20 scores were associated with intra-hemispheric hypoconnectivity between the PPC and LPFC and higher inter-LPFC connectivity within the FPN. The PPC is associated with cognitive processes, including attention shifting and stimulus selection [Reference Behrmann, Geng and Shomstein104–Reference Whitlock106], whereas the LPFC supports executive control and generates top-down signals that modulate sensory processing and behavior [Reference Miller and Cohen107–Reference Tanji and Hoshi109]. Lower fronto-parietal coupling has been reported in ASD [Reference Just, Keller, Malave, Kana and Varma110], where alexithymia is highly prevalent [Reference Kinnaird, Stewart and Tchanturia19, Reference Hogeveen and Grafman36]. As challenges in emotion recognition are better explained by alexithymia rather than autism [Reference Bird and Cook9], the observed FC-pattern overlaps with the underconnectivity theory of autism [Reference Just, Keller, Malave, Kana and Varma110], which proposes reduced long-range cortical and altered large-scale integration within higher-order cognitive control regions.
Besides organic factors (i.e., brain damage), alexithymia may emerge during early childhood due to developmental strains (e.g., negative primary caregiver interactions) [Reference Wearden, Cook and Vaughan-Jones42, Reference Goerlich55, Reference Lesser111, Reference Messina, Beadle and Paradiso112], potentially moderated by serotonergic genetic variation [Reference Kano, Mizuno, Kawano, Aoki, Kanazawa and Fukudo113, Reference Terock, Weihs, Teumer, Klinger-König, Janowitz and Grabe114], or later in life following severe stress or trauma [Reference Taylor, Bagby, Parker and Grotstein81, Reference Freyberger115, Reference Van Bael, Scarfo, Suleyman, Katherveloo, Grimble and Ball116]. Irrespective of its genesis, alexithymia is associated with attenuated interoception, indicated by worse heartbeat counting performance, which may necessitate compensatory top-down processing to support emotional and behavioral functioning in the absence of reliable bodily signals [Reference Murphy, Catmur and Bird32, Reference Van Der Velde, Servaas, Goerlich, Bruggeman, Horton and Costafreda53, Reference Murphy, Brewer, Hobson, Catmur and Bird117, Reference Shah, Hall, Catmur and Bird118]. This aligns with the original description of alexithymia as focusing on external events while avoiding inner experiences, raising the question of whether it originates from a deficit or an (un)intentional coping strategy [Reference Sifneos26, Reference Hogeveen and Grafman36]. The attention-appraisal model [Reference Preece, Becerra, Allan, Robinson and Dandy35] provides a framework, positing differences in emotion valuation that involve both attentional processes (difficulty focusing on emotions) and subsequent appraisal (difficulty identifying and describing emotions). This comprises appropriate responding, as emotion regulation depends on accurate identification of the experienced emotion. Additionally, avoidance of emotions may serve as a short-term regulatory strategy in alexithymia but contributes to persistent deficits and reduced quality of life over time [Reference Bilotta, Giacomantonio, Leone, Mancini and Coriale119–Reference Torunsky, Knauz, Vilares, Marcoulides and Koutstaal122]. Nevertheless, as the rsfMRI-setting does not explicitly elicit emotions, higher FC in top-down control regions likely reflects an alexithymia-related network alteration rather than avoidance. The idea of long-term network alteration is further supported by altered DAN-SN connectivity with higher TAS-20 scores. Specifically, frontal SN regions (ACC, RPFC) showed higher coupling with the left DAN, whereas parietal-insular SN regions (anterior insula, SMG) exhibited lower DAN connectivity. This divergence is noteworthy as the anterior insula and ACC have a close functional relationship [Reference Medford and Critchley123], yet exhibit different coupling patterns. Specifically, the insula plays a crucial role in generating interoceptive awareness of ascending sensory signals, whereas the ACC coordinates responses to interoceptive and exteroceptive events. Together, they form a key node of the SN, which facilitates switching between interoceptive and exteroceptive processing [Reference Menon124, Reference Uddin125]. Accordingly, high-alexithymia individuals showed stronger ACC activation during affective stimulation [Reference Van Der Velde, Servaas, Goerlich, Bruggeman, Horton and Costafreda53], whereas insular dysfunction underlies altered interoceptive awareness [Reference Hogeveen, Bird, Chau, Krueger and Grafman126]. Given their joint interplay with emotional awareness [Reference Craig30, Reference Medford and Critchley123], the observed divergent FC pattern may be associated with its impairment in alexithymia [Reference Gu, Hof, Friston and Fan127–Reference Motomura, Fukuzaki, Eto, Hirabayashi, Gondo and Izuno129]. Additionally, we found hyperconnectivity between the frontal SN and left FEF of the DAN, potentially indicating altered network interactions that might be associated with enhanced, possibly compensatory, attention to external stimuli [Reference Reynolds and Chelazzi130, Reference Squire, Noudoost, Schafer and Moore131].
For DIF, altered FC across the FPN, SN, SMN, CN, and DAN were revealed, even after adjustment for lifestyle factors, health indicators, and depressive symptoms, despite the moderate association between DIF and PHQ-9. These findings suggest that DIF may be linked with network alterations involving interoceptive processing and top-down attentional regulation, potentially contributing to differences in emotional awareness and adaptive responses to emotional and environmental demands [Reference Craig30]. Additionally, higher DIF was associated with higher FPN-lateral SMN connectivity. Given the SMN’s role in primary motor and somatosensory processing [Reference Uddin, Yeo and Spreng132], this hyperconnectivity may indicate altered network interactions facilitating external attention and top-down regulation [Reference Uddin, Yeo and Spreng132–Reference Wen, Liu and Hsieh134]. This extends the observed divergence between frontal and parietal–insular SN nodes, characterized by lower connectivity between these nodes, hyperconnectivity of the partial-insular node with the DAN and SMN, and hyperconnectivity of frontal SN nodes with these networks. Overall, hypoconnected nodes – including the anterior insula, lateral SMN, SMG, and IPS – may reflect alterations in a sensory-integration network, whereas hyperconnected nodes encompassing the superior SMN, ACC, RPFC, and DAN may indicate an altered executive-control network. This interpretation is further supported by hypoconnectivity between the lateral CN and FPN, suggesting altered cerebellar contributions to frontoparietal network functioning involved in cognitive control and executive processing [Reference Boonstra135–Reference Zhang, Duan, Ou, Ling, Cao and Qian137].
Unlike DIF, no reliable effects were observed for DDF or EOT. Given the absence of explicit emotional stimulation in the resting-state paradigm, these findings suggest that alexithymia – particularly DIF – modulates attention during rest, potentially reflecting an altered “idle” network organization biased away from interoceptive and emotional signals as they may have less informative value. In contrast, all alexithymia facets are likely more engaged during active emotional processing [Reference Preece, Becerra, Allan, Robinson and Dandy35]. As alexithymia affects processes along the cognition-emotion interface [Reference Luminet, Nielson and Ridout138], future studies should examine subscale-specific network effects using emotion-eliciting paradigms or clinical samples with higher prevalence, where such alterations may be more pronounced.
Whole-brain analysis showed no DMN alterations associated with alexithymia. Post-hoc analyses showed lower FC between anterior and posterior DMN and the left LP, suggesting altered self-referential processes or self-awareness [Reference van Buuren, Gladwin, Zandbelt, Kahn and Vink139, Reference Davey, Pujol and Harrison140]. As this contrasts with two prior studies [Reference Liemburg, Swart, Bruggeman, Kortekaas, Knegtering and Ćurčić-Blake60, Reference Sutherland, Carroll, Salmeron, Ross and Stein64], possibly due to methodological differences, while others similarly reported no DMN alterations [Reference Han, Li, Mei and Sun61] or did it examine the DMN [Reference Kim, Park, Lee, Jeon, Kim and Lee62, Reference Li, Peng, Qin, Luo, Ren and Wang63], further research is needed to clarify the DMN’s role.
Conclusion
The results indicate that alexithymia is associated with resting-state connectivity alterations at the network-level within and between networks involved in emotion processing and attention, potentially reflecting tonic differences in top-down control, interoception, and attentional allocation. Altered connectivity of the ACC, anterior insula, and frontal regions suggests an altered trait-like large-scale network organization already during the resting (‘idling’) state, which may affect adaptive responses to emotional and environmental demands before active emotion processing. Given that alexithymia is a well-established transdiagnostic risk factor across psychopathological and somatic conditions, these network-level alterations may have clinically relevant implications, including risk stratification, understanding patterns of comorbidity and chronic symptom trajectories, and potentially predicting treatment response. Framing alexithymia in terms of large-scale network alterations may therefore help bridge neurobiological findings with clinically relevant outcomes and intervention strategies.
Alexithymia is shaped by early emotional socialization and varies across the lifespan [Reference Taylor, Bagby, Parker and Grotstein81, Reference Parker, Taylor and Bagby141], potentially influencing the development of large-scale networks involved in emotional awareness and regulation [Reference Menon124, Reference Gogtay, Giedd, Lusk, Hayashi, Greenstein and Vaituzis142, Reference Fair, Cohen, Dosenbach, Church, Miezin and Barch143]. Given these networks’ prolonged, experience-sensitive development, future studies should examine altered developmental trajectories, which may contribute to alexithymia-related FC patterns.
Limitations
ROI-to-ROI analyses capture only linear relationships and lack directionality or causality, limiting interpretability and may oversimplify brain connectivity. Because adherence to resting-state instructions was not formally assessed, DMN connectivity was used as a proxy to exclude potentially sleeping participants, risking misclassification. Additionally, the absence of physiological recordings may have affected FC estimates [Reference Yoshikawa, Masaoka, Yoshida, Koiwa, Honma and Watanabe144], and despite artifact-removal procedures, this likely reduced the accuracy of detected FC alterations. Furthermore, some relevant covariates were unavailable (e.g., sleep quality) or had limited granularity.
Excluding participants older than 60 limits interpretation and generalizability across the adult lifespan and socialization histories. The regional scope of SHIP-TREND further constrains generalization to other cultural or geographic populations. Additionally, lower TAS-20 scores compared with other samples [Reference Franz, Popp, Schaefer, Sitte, Schneider and Hardt17] may have reduced sensitivity to FC alterations, especially in the DMN.
Although alexithymia is considered a relatively stable personally trait [Reference Bagby, Parker and Taylor75–Reference Taylor, Bagby, Parker and Grotstein81], the 7-to 8-year gap between alexithymia assessment (SHIP-TREND-0) and rsfMRI (SHIP-TREND-1) may have weakened the reported effects and underestimated the impact on functional networks. Moreover, covariates associated with alexithymia may have changed within individuals over time (e.g., depressive symptoms, alcohol consumption, BMI, smoking behavior), potentially obscuring alexithymia-related FC alterations. As such, we had no information about psychotherapeutic treatment, which could alter alexithymia levels, or anxiety, given its likely impact on alexithymia [Reference Berthoz, Consoli, Perez-Diaz and Jouvent145], particularly on DIF. Overall, alexithymia-related FC alterations appeared to be driven by DIF, likely reflecting overlap between DIF items and somatic symptoms rather than emotion processing per se [Reference Preece, Petrova, Mehta, Sikka and Gross146].
Although widely used, the TAS-20 has notable limitations, including weak EOT reliability and construct validity, overlap with negative affect, reliance on self-report despite impaired introspection, and limited assessment of affective dimensions [Reference Bagby, Parker and Taylor75, Reference Lumley147–Reference Preece, Becerra, Boyes, Northcott, McGillivray and Hasking149]. Accordingly, future studies may benefit from complementing it with multidimensional instruments, such as the Perth Alexithymia Questionnaire [Reference Preece, Becerra, Robinson, Dandy and Allan28].
We used a 1.5 T MRI with a TR of 2.86 s. Although studies using similar settings have demonstrated reproducible resting-state networks [Reference Damoiseaux, Rombouts, Barkhof, Scheltens, Stam and Smith95, Reference Xavier, Esteves, Jorge, Abreu, Giraud and Sadaghiani150, Reference Moreno-Ayure, Páez, López-Arias, Mendez-Betancurt, Ordóñez-Rubiano and Rudas151], this might have affected our results, as newer 3 T scanners with shorter TRs provide higher signal-to-noise ratio, improved spatial and temporal resolution, and enhanced BOLD contrast [Reference Krasnow, Tamm, Greicius, Yang, Glover and Reiss152–Reference Voss, Zevin and McCandliss154].
Abbreviations
- ACC
-
anterior cingulate cortex
- ASD
-
autism spectrum disorder
- BMI
-
body mass index
- BOLD
-
blood oxygenation level-dependent
- CN
-
cerebellar network
- DAN
-
dorsal attention network
- DDF
-
difficulties describing feelings
- DIF
-
difficulties identifying feelings
- DMN
-
default mode network
- EOT
-
externally oriented thinking
- EPI
-
echo-planar imaging
- FEF
-
frontal eye field
- FPN
-
frontoparietal network
- ICA
-
independent component analysis
- IFG
-
inferior frontal gyrus
- IPS
-
intraparietal sulcus
- IQR
-
interquartile range
- LPFC
-
lateral prefrontal cortex
- MNI
-
Montreal Neurological Institute
- PHQ-9
-
patient health questionnaire
- PPC
-
posterior parietal cortex
- ROI
-
region of interest
- RPFC
-
rostral prefrontal cortex
- SMG
-
supramarginal gyrus
- SMN
-
sensorimotor network
- SN
-
salience network
- STG
-
superior temporal gyrus
- TAS-20
-
20-item Toronto Alexithymia Scale
- TE
-
echo time
- TR
-
repetition time
- MPFC
-
medial prefrontal cortex
Supplementary material
The supplementary material for this article can be found at http://doi.org/10.1192/j.eurpsy.2026.10177.
Data availability statement
The data from the SHIP study cannot be made publicly available due to the informed consent of the study participants; however, it can be accessed through a data application form available at https://fvcm.med.unigreifswald.de/ for researchers who meet the criteria for access to confidential data.
Acknowledgements
The authors would like to sincerely thank everyone who participated in SHIP-TREND.
Author contribution
E.K., J.K.K. and H.J.G. designed the project. All co-authors contributed to the acquisition, analysis or interpretation of the data. E.K. and J.K.K drafted the manuscript, while all other coauthors critically revised it. E.K. and J.K.K. conceived and conducted the statistical analyses with support from S.F., M.O.W., H.V., R.B., and H.J.G. were involved in data curation, administrative, technical, or material support, or funding acquisition. H.J.G. supervised the project. All authors have read and approved the submitted version of the manuscript.
Financial support
SHIP is part of the Community Medicine Research net of the University of Greifswald, Germany, which is funded by the Federal Ministry of Education and Research (grants no. 01ZZ9603, 01ZZ0103, and 01ZZ0403), the Ministry of Cultural Affairs as well as the Social Ministry of the Federal State of Mecklenburg-West Pomerania, and the network ‘Greifswald Approach to Individualized Medicine (GANI_MED)’ funded by the Federal Ministry of Education and Research (grant 03IS2061A).
Whole-body MR imaging was supported by a joint grant from Siemens Healthineers, Erlangen, Germany and the Federal State of Mecklenburg West Pomerania.
Competing interests
H.J.G. has received travel grants and speakers honoraria from Neuraxpharm, Servier, Indorsia and Janssen Cilag. All other authors reported no financial interests or other potential conflicts of interest.
Statement of ethics
Study approval statement: The studies were approved by the Ethics Committee at the University Medicine Greifswald, Germany (approval number BB 39/08).
Consent to participate statement: Oral and written informed consents were obtained from all participants according to the principles of the Declaration of Helsinki.
Declaration of generative AI and AI-assisted technologies in the writing process
ChatGPT was used to improve the clarity and readability of this work. Afterwards, we carefully reviewed and edited the text and take full responsibility for the final content.


 Open access


Comments
No Comments have been published for this article.