


It is widely accepted that obesity is a major common chronic metabolic disease worldwide that it is mostly induced by the imbalance in energy, which leads to excessive or abnormal accumulation of the body fats(Reference Huang, Chen and Cao1). By altering the diets related to the lifestyle, obesity spreads quickly amongst the children, adolescents and adults. However, the latest statistics for global spread of obesity showed that 13 % of adults suffer from obesity. In fact, this condition and the enhanced BMI have been introduced as the key risk factors for some diseases that jointly result in the “Metabolic syndrome”(Reference Han and Lean2) which entails CVD and type 2 diabetes. Researchers also illustrated the association of socio-economic conditions with obesity(Reference Pavela, Lewis and Locher3). Notably, incidence of obesity is growing and involves nearly 60 % of people with type 2 diabetes who live in the south Asia areas(Reference Nanditha, Ma and Ramachandran4). Moreover, research demonstrated the close relationship of obesity with the enhanced level of fasting glucose and dysregulation of the lipid metabolism(Reference Wang, Xu and Sagada5), which leads to greater TAG and lower HDL-cholesterol(Reference Alberti and Zimmet6). In addition, it has been found that there is a positive correlation between the level of fasting glucose and type 2 diabetes together with the enhanced adipocyte differentiation and maturation(Reference Mishra, Dubey and Ghosh7). Furthermore, analysis of other studies showed the underlying altered redox state inherent with obesity(Reference Codoner-Franch, Tavárez-Alonso and Murria-Estal8) and involving in the chronic inflammation as one of the drivers for most related diseases such as type 2 diabetes and cognitive decline with Alzheimer’s disease(Reference Verdile, Keane and Cruzat9). In fact, exposing to the increased fat and increased energy diets over a lengthy period causes abnormal accumulation of the body fat, thereby increasing the level of lipids. Consequently, massive amounts of NEFA will be produced by the lipid degradation, which reduces the synthesis of the hepatic glycogen and increases the outputs of glucose that may additionally worsen the lipid metabolism dysfunction. On the one hand, oxidative stress (OS) may cause and stimulate obesity. Actually, cellular dysregulation stemming from the extended obesity is highly caused by the chronic OS wherein natural antioxidant system faces challenges because of the enhanced levels of nitrogen species and reactive oxygen(Reference Codoñer-Franch, Valls-Bellés and Arilla-Codoñer10). So, greater systemic OS involves in the collected co-morbidity of the metabolic syndrome(Reference Furukawa, Fujita and Shimabukuro11).
Studies considered exercise as the other major parameter for preventing obesity(Reference Jakicic, Marcus and Lang12). In fact, exercise declines the body weight via elevating the energy expenditure and enjoys potency for increasing the basal fat oxidation from the dietary intake or bodily reserve, while the energy intake cannot match the increased level of expenditure. Additionally, exercise enhances insulin sensitivity in the skeletal muscle and reduces the level of blood glucose and numerous risk factors for CVD(Reference Stewart13,Reference Henriksen14) . Hence, regular continuous exercise would be highly recommended for preventing obesity so that it will have the greatest effect on the weight control in combination with the improvements in the eating habits. In addition, the effect of swimming exercise(Reference Anttila, Jäntti and Mänttäri15–Reference Sun, Jin and Jiao21) and swimming with supplements such as Ginger, Aloe Vera extract and Garlic on lipid metabolism is reported(Reference Zar, Hoseini and Ahmadi22–Reference Farazandeh, Hosseini and Riyahi24).
Chitosan (CS), as one of the relatively deacetylated chitin, is prepared from marine sources (such as shrimp waste) in tetra steps: extraction of protein matter in alkaline medium (deproteinisation) and it is traditionally done by treating the waste with aqueous solutions of NaOH. Elimination of inorganic matter (CaCO3) in dilute acidic medium (demineralisation), which is accomplished using HCl solution and finally bleaching in dilute NaOCl (decolourisation), afforded pure chitin. Finally, chitin is converted into more applicable CS using alkaline hydrolysis(Reference Shushizadeh, Moghimi Pour and Zare25). Marine CS is formulated in a number of dietary supplements because of the same features with the dietary fibres, non-toxicity as well as higher bio-compatibility(Reference Liu, Yang and Song26). Several researches showed that products containing CS are effective in reducing body weight(Reference Razdan and Pettersson27), reduction of cholesterol(Reference Van Bennekum, Nguyen and Schulthess28), absorption(Reference Gades and Stern29), protective agent against obesity(Reference Walsh, Sweeney and Bahar30), anti-obese of glucosamine(Reference Huang, Chen and Cao1), lipid metabolism and insulin sensitivity(Reference Bahijri, Alsheikh and Ajabnoor31) and anti-obesity effect(Reference Do, Cho and Cho32).
It is notable that the dietary interventions are a safer and relatively common way to decrease weight. However, researchers extensively examined the anti-obesity impacts of CS and ST(Reference Huang, Chen and Cao1,Reference Bahijri, Alsheikh and Ajabnoor31) . According to the literature(Reference Xiong, Li and Xiong33), CS combined with swimming is applied for promotion health in rats. Nonetheless, no report has been made about the combination of interventional diets of CS and ST in the high-fat diets (HFD) induced-obesity mice model. Therefore, the objectives of this research were determination of the effects of CS, ST and dietary CS in combination with ST on the development of obesity, inhibition of OS and hypo-glycaemic impacts in HFD mice.
Experimental methods
Ethical statement
All the experiments have been accomplished based on the directions provided by the Committee of Animal Experimentation of Islamic Azad University-Science Research Branch (Ethical code: IR.IAU.SRB.REC.1398.138).
Experimental design
According to the research design(Reference Xiong, Li and Xiong33), healthy 6-week-old NMRI male mice of 23 (sem 2) g weight have been bought from the animal house in Ahvaz Jundishapur University of Medical Sciences animal house. These animals have been kept in the eight poly-propylene cages with free access to the drinking water and standard chow based on the controlled conditions in a 12 h light–12 h dark cycle at 20 (sem 2) °C and the relative humidity 50 (sem 10) %.
Dietary intervention
Following a 1-week adaptive feeding with the normal diet, forty weight-matched mice were randomly divided into five groups (n 8 per group), including control group (normal mice with the standard diet), HFD group (the HFD-induced-obesity mice with high-fat food with 20 % fat), HFD + CS group (obese mice induced by the high-fat food with 5 % CS), HFD + ST group (obese mice induced by HFD and ST) and HFD + CS + ST group (obesity mice induced by the high-fat food with 5 % CS and ST). Each experimental group was treated with the specific diets for 8 weeks. It should be mentioned that the animal diet has been formulated by Razi Karaj Serum Institute and marine CS (low molecular weight, deacetylated degree = 95 %) was prepared and produced by Marine Pharmaceutical Research Center of Ahvaz Jundishapur University of Medical Sciences. The researchers were blinded to treatment groups.
Swimming training
The present swimming protocol has been provided and set to the moderate training(Reference Craig and Foley34). Therefore, the animals have been subjected to swimming for 1 h in each day and 5 d in each week for 8 weeks. Then, swimming has been done by the four mice groups in an 80 × 40 × 40 cm tank, and water temperature has been kept at about 32–35°C that has been controlled by a thermostat. Afterwards, the animals have been acclimated to water by the 15-min swimming intervals and the training time gradually enhanced to 60 min over a 1-week period.
Food intake, body and liver weight
Food intake and body weight
We recorded the food intake as well as body weight once per week. By the completion of the experimental period, animals have been fasted overnight.
Tissue collection
Then, the mice were anaesthetised using combination of ketamine/xylazine (60/6 mg/kg, i.p.), and their blood has been sampled from the jugular vein after decapitation. Serum was separated and stored at −20°C. Then, the liver was rapidly removed and weighed. In order to do histological examinations, a segment of tissue has been fixed in 10 % phosphate-buffered formalin. Moreover, in order to perform biochemical estimation, the second segment of the tissue has been homogenised (1/10, w/v) in the ice-cold Tris-HCl buffer (0·1m, pH 7·4). Then, Bradford method(Reference Bradford35) with the use of crystalline bovine serum albumin as standard has been used to measure the protein content in the homogenates.
Blood analysis
With the completion of the experiments and following euthanasia via instant decapitation of the mice fasted overnight, we gathered the blood samples (1–2 ml) and treated them with non-vacuum tube (expilab gel and clot activator). In the next stage, centrifugation of the samples (8000 g , 4°C, 6 min) has been performed for separating serum to detect the fasting glucose, total cholesterol (TC), TAG, LDL-cholesterol, HDL-cholesterol concentrations and activity levels of aspartate aminotransferase, alkaline phosphatase and alanine aminotransferase. Then, serum has been aliquoted (–80°C) for biochemical analysis. Based on the Company’s direction, commercial kits (Randox Laboratories Co.) have been used to perform analyses.
Biochemical parameters in liver homogenates
Malondialdehyde level assay
The amount of MDA has been measured to express lipid peroxidation through 2-thiobarbituric acid colour reaction via the procedure illustrated by Buege & Aust(Reference Buege and Aust36). In fact, 0·5 ml of liver homogenate has been mixed with 2·5 ml of trichloro acetic acid (10 %, w/v), centrifugation of the samples has been performed at 3000 rpm for 10 min and 2 ml of each sample supernatant has been transported to a test tube consisting of 1 ml of 2-thiobarbituric acid solution (0·67 %, w/v). Then, the mixture has been maintained in the boiling water for 10 min until a pink colour solution formed. As a result, the mixture has been cooled directly and a spectrophotometer (UV-1650 PC; Shimadzu) has been used to measure the absorbance at 532 nm. The outputs have been written as the nmol/mg protein.
Assay of GSH level
According to the procedure presented by Ellman(Reference George37), we measured level of GSH in liver homogenate with regard to the formation of a yellow-coloured complex with Ellman’s Reagent 5, 5-dithiobis (2-nitrobenzoic acid). In summary, 2 ml Tris–EDTA buffer (pH of 8.6) has been added to 40 µl homogenate in 2 ml cuvettes and, subsequently, 40 µl 5, 5-dithiobis (2-nitrobenzoic acid) reagent (10 mm in methanol) has been added into the mixture. Then, incubation of the reaction mixture has been performed at room temperature for 20 min, and the yellow colour has been read at 412 nm with a spectrophotometer (UV-1650 PC; Shimadzu). The outputs have been written as nmol/mg protein.
Catalase activity assay
The following procedure of Aebi(Reference Aebi38) has been chosen to assay CAT activity in liver. Therefore, in a cuvette consisting of 200 µl PBS and 50 µl of the tissue supernatant, which has been achieved following centrifugation of the tissue homogenate at 12 000 g at 4°C for 20 min, has been added 250 µl of 0·066 m H2O2 and the amount of decline in OD has been gauged at 240 nm for 60 s. Notably, 1 unit of activity equalled to the moles of the H2O2 degraded (per min), divided by the number of mg of protein in the tissue supernatant. Moreover, molar extinction coefficient of 43·6 m −1/cm has been utilised for determining CAT activities.
Superoxide dismutase activity assay
In the section, tissue supernatant achieved following centrifugation at 12 000 g at 4°C for 20 min has been spectrophotometrically measured via computing the suppression rate of the auto-oxidation of haematoxylin to assay SOD based on the technique illustrated by Martin(Reference Martin, Dailey and Sugarman39) and written as the u/mg protein.
Assay of glutathione peroxidase activity
It is widely accepted that glutathione peroxidase (GPx) has been introduced as a general term of an enzyme family with peroxidase activities whose key biological contribution is the protection of the organism from the oxidative damages. Moreover, GPx biochemical function has been proposed to be the reduction of the lipid hydroperoxides to their corresponding alcohol as well as the free hydrogen peroxide to water. Therefore, a GPx kit (Randox Labs; Crumlin) has been used to measure the activity of GPx.
Histopathological examination
In order to do histological examinations, small sections of the liver have been fixed in 10 % phosphate-buffered formalin, placed in paraffin and sectioned at 5 µm. Finally, haematoxylin–eosin has been used to stain them for the light microscopic observation.
Statistical analysis
The outputs were expressed as mean values with their standard errors. Kolmogorov–Smirnov test was applied to determine normality of results. The one-way ANOVA and Tukey post hoc test were used to compare the main effects of CS and ST, different diets and their interaction on each parameter in all five groups of animals. Therefore, Prism 5.0 has been utilised to analyse the data, and P-value < 0·05 has been regarded as significant. Mice were randomly divided into five groups, considering that the weight of the groups at the beginning of the study was almost the same.
Results
Body and liver weights
Figure 1 represents the changes made in the body weight of the animals (n 8 for each group) following the 8-week period in five groups. As seen, values of initial body weight are the same (P > 0·05) in various groups that implies acceptability of the grouping procedure. The gradual growing tendency of the body weight in the normal animals indicated acceptability of the dietary structure. In fact, the higher values in HFD group than control in the course of the experiment revealed successful induction of obesity by the HFD. Moreover, by the completion of the 8th week, the body weight of interventional group diminished and HFD + CS + ST-treated group experienced the highest reduction. After the 8-week period, liver weight of the obese mice has been greater than the normal mice weight (Fig. 2) and HFD + CS + ST-treated group showed lower liver weight of the obese mice in comparison with the normal animals (P > 0·05).
Effect of HFD + CS, HFD + ST and HFD + CS + ST on body weight gain and liver weight. ![]() Control;
Control; ![]() HFD;
HFD; ![]() HFD + CS;
HFD + CS; ![]() HFD + ST;
HFD + ST; ![]() HDF + CS + ST
HDF + CS + ST

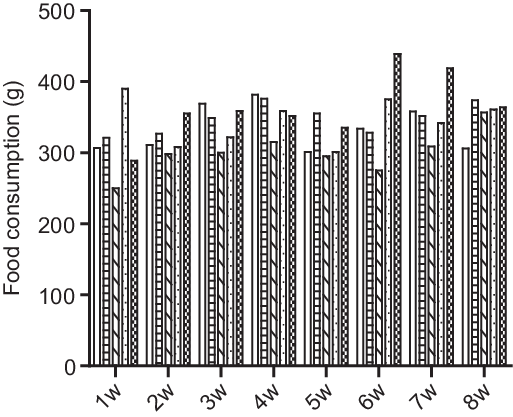
Effect of HFD + CS, HFD + ST and HFD + CS + ST on food consumption in the five groups per week. ![]() Control;
Control; ![]() HFD;
HFD; ![]() HFD + CS;
HFD + CS; ![]() HFD + ST;
HFD + ST; ![]() HDF + CS + ST
HDF + CS + ST
Level of blood glucose and lipid profile
Figure 3 depicts information of blood glucose in the treated animals (n 8 for each group) and control in the course of the treatment period. With the completion of the 8-week treatment course, level of blood glucose of the HFD group significantly enhanced in comparison with other groups (P < 0·01). Following the 8-week treatment, level of TC, TAG, LDL-cholesterol and HDL-cholesterol in serum has been gauged. In this regard, Fig. 4 and 5 present a summary of the level of blood lipid of the treated mice at the completion of the experimental course. Moreover, we found that the HFD considerably enhanced the level of TC, LDL-cholesterol (P < 0·01, P < 0·001) and TAG (P < 0·01) and declined HDL-cholesterol. With regard to the intervention, in hyperlipidaemia induced by HFD, the concentration of TAG (P < 0·05, P < 0·001) and LDL-cholesterol dramatically declined in TC by HFD + CS + ST and HFD + CS treatments (P < 0·05, P < 0·01, P < 0·001). It also elevated the concentration in HDL-cholesterol by each of the three treatments.
Effect of HFD + CS, HFD + ST and HFD + CS + ST on blood glucose after 8-week period in the five groups. Values represent mean and their standard errors. *Significantly different from the control group (**P < 0·01).

Effect of HFD + CS, HFD + ST and HFD + CS + ST on TAG levels in mice. Values are mean and their standard errors. *Significantly different from the control group (**P < 0·01). #Significantly different from the HFD group (#P < 0·05, ###P < 0·001).

Effect of HFD + CS, HFD + ST and HFD + CS + ST on TC, HDL-cholesterol and LDL-cholesterol levels in mice. Values are mean and their standard errors. *Significantly different from the control group (**P < 0·01, ***P < 0·001). # Significantly different from the HFD group (#P < 0·05, ##P < 0·01, ###P < 0·001).

Hepatic enzymes activity
As shown in Fig. 6, significant elevated alanine aminotransferase, aspartate aminotransferase and alkaline phosphatase levels in obese mice (P < 0·05, P < 0·01) compared with the control group (n 8 for each group). In all treatment groups, liver enzyme levels decreased and in HFD + CS and HFD + CS + ST groups, there was a significant decrease compared with the HFD group (P < 0·05, P < 0·01).
Effect of HFD + CS, HFD + ST and HFD + CS + ST on hepatic enzymes activity in HFD-induced oxidative stress in mice. Values are mean and their standard errors. *Significantly different from the control group (*P < 0·05, **P < 0·01). # Significantly different from the HFD group (#P < 0·05, ##P < 0·01).

Oxidative stress markers
Level of superoxide dismutase, catalase, GSH, glutathione peroxidase and malondialdehyde
The present research findings showed that the serum level of MDA significantly enhanced and GSH level (P < 0·05, P < 0·001) declined in the obese animals in comparison with normal control group (Fig. 7). Moreover, SOD, GPx and CAT activities decreased (Fig. 8) in comparison with the control group (P < 0·001). In addition, CAT, GPx (P < 0·05, P < 0·01, P < 0·001) and GSH concentration in the three treatment groups enhanced and MDA concentration decreased in comparison with the HFD group (P < 0·01). It is notable that the HFD + CS + ST group exhibited the most efficiency to suppress OS by enhancing the activities of SOD, GPx, GSH and CAT. There were eight mice in each group.
Effect of HFD + CS, HFD + ST and HFD + CS + ST on MDA and GSH levels in liver tissues. Values are mean and their standard errors of the mean. *Significantly different from the control group (*P < 0·05, ***P < 0·001). # Significantly different from the HFD group (##P < 0·01).

Effect of HFD + CS, HFD + ST and HFD + CS + ST on CAT, SOD and GPx activity. Values are mean and their standard errors. *Significantly different from the control group (***P < 0·001). # Significantly different from the HFD group (#P < 0·05, ##P < 0·01, ###P < 0·001).

Histological analysis
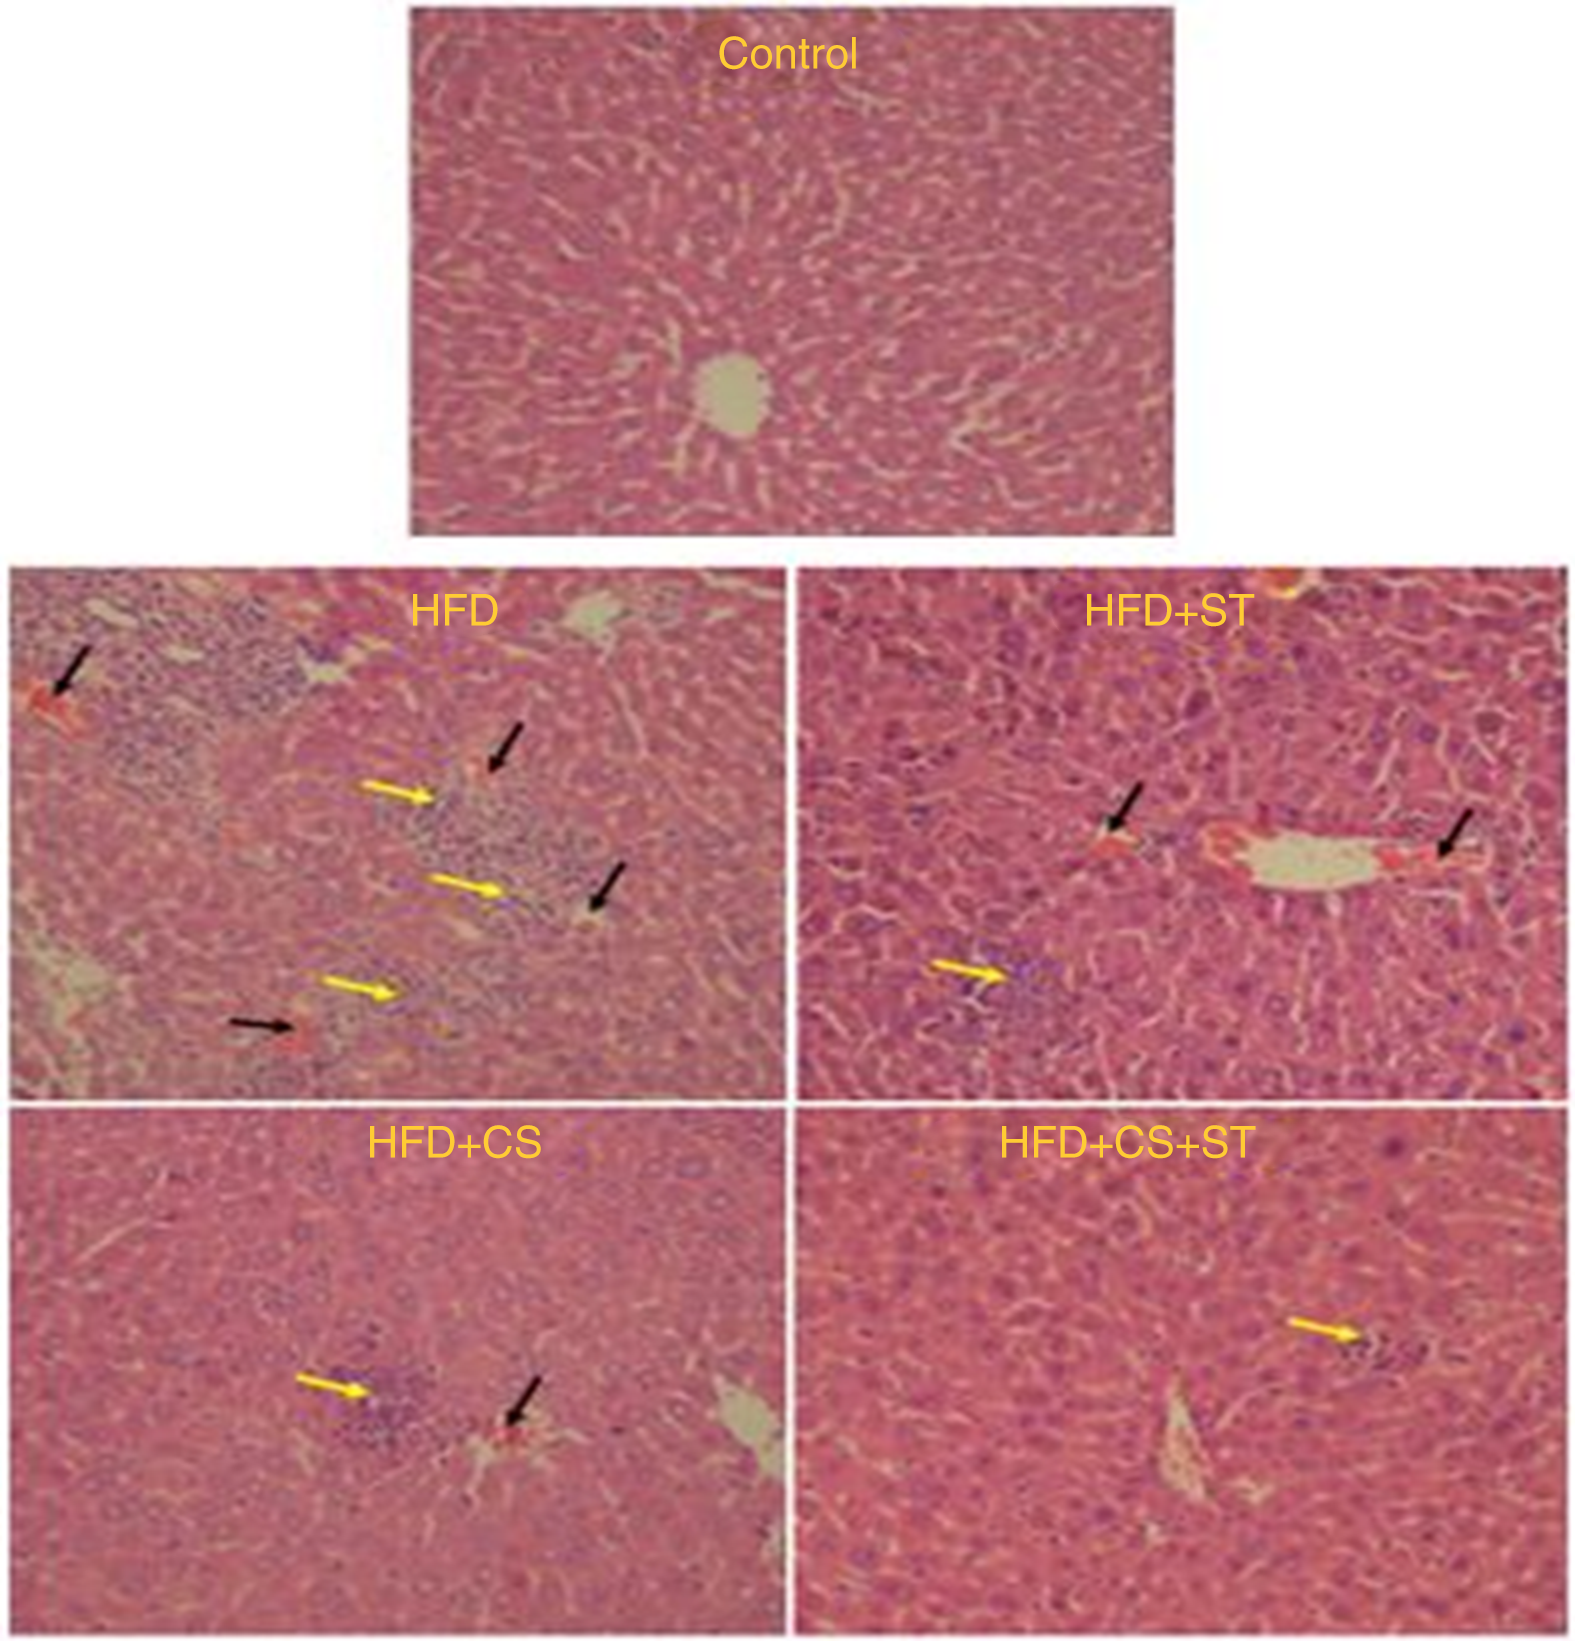
According to the research design, H&E stained section has been utilised to examine the histopathological changes in the mice liver (n 8 for each group). Moreover, histopathological examinations demonstrated normality and healthiness of the cells in the control. Nevertheless, the number of inflammatory cells enhanced and RBC congested in HFD group. The parameters have also been observed in HFD + ST and HFD + CS groups except for the case that severity diminished. However, severity of lesions reduced considerably in the HFD + CS + ST group in comparison with HFD group (Fig. 9).
Effect of HFD + CS, HFD + ST and HFD + CS + ST on liver in the five experimental groups (H&E ×250). Black arrow indicates erythrocytes congestion, and yellow arrow indicates inflammation.
Discussion
As mentioned earlier, obesity has been introduced as a global epidemic and several obese people present with dyslipidaemia that indicates the enhanced TAG and non-HDL-cholesterol(Reference Feingold and Grunfeld40). In fact, obesity is a risk factor for CVD and diabetes(Reference Mandviwala, Khalid and Deswal41). Therefore, this research determined interventional impact of ST and CS on the body and liver tissue weight, OS and serum indices in the obesity-induced mice with a HFD formula. Actually, a HFD enhanced the body weight and liver tissue weight and led to greater level of serum of glucose, TC, LDL-cholesterol as well as TAG, less concentration of HDL-cholesterol in comparison with the control. The augmented level of the blood glucose induced by obesity has correlation with the enhanced gluconeogenesis in the hepatic cells induced by accumulation of fat in liver that weakens transformation from glucose to lipid in lipodystrophy. In addition, dyslipidaemia is directly proportional to the degree of obesity. Hence, the elevated serum TAG levels declined the HDL-cholesterol concentration by exchanging the very LDL TAG with the HDL-cholesterol ester(Reference Si, Strappe and Blanchard42).
This research verified that ST, CS + ST and CS intervention may manipulate the hyperlipidaemic and hyperglycaemic status with a reduced level of blood glucose and improved composition of the blood lipid (TAG, HDL-cholesterol and TC) in the obese animals. Even though each treatment exhibited amelioration in the blood lipid composition, they showed various regulation patterns. Furthermore, CS is capable of inhibiting hydrolysis of dietary fat via suppression of pancreatic lipase that diminished the fat absorption from intestine, enhanced the faecal fat excretion and lowered the level of plasma cholesterol(Reference Si, Strappe and Blanchard42). According to the results, CS + ST intervention showed the most efficacy in enhancing TC, LDL-cholesterol and TAG and attenuated the HDL-cholesterol decrease induced by HFD in comparison with either CS or ST treatment. The ST results of this study are consistent with the results reported by Xiong et al. (Reference Craig and Foley34). They showed that TC was significantly decreased in HFD + CS + ST group compared with the other four groups. Similarly, in compared with control group, LDL level was lower in HFD + CS + ST group. The abnormal higher level of LDL-cholesterol can deposit in arterial wall and generate atheroma. Both CS and exercise could lower the level of TC and LDL, which probably makes CS + ST a choice to prevent CVD. In addition, Wang et al. (Reference Wang, Zhang and Wang43) in their study of the effects of CS on hyperlipidaemia and OS in mice fed a HFD, compared with control, HFD increased body weight, the liver weight and TAG, TC and LDL-cholesterol in plasma, while the CS supplementation reduced body weight, the liver weight and plasma lipids compared with HFD group [44]. Moreover, Botezelli et al. (Reference Botezelli, Cambri and Ghezzi44) in their study of the effect of different exercise protocols on the metabolic syndrome markers and antioxidant status in rats showed that exercised animals reduced body weight and TAG concentration and increased HDL-cholesterol concentration compared with control group. In another study, Si et al. (Reference Si, Strappe and Blanchard42) investigated the anti-obesity effect of resistant starch, CS and CS–starch complexes (CL) in HFD-fed rats. Compared with control group, CL administration performed more efficiently in controlling body weight, with an increase in HDL-cholesterol concentration.
Consequently, obesity may be described as one of the chronic inflammatory diseases(Reference Wang, Zhang and Wang43) that is related to the unbalanced rate of the reactive oxygen species generation in comparison with their elimination. A few animal research demonstrated the relationship of obesity with the increased free radical production via lipid peroxidation(Reference Botezelli, Cambri and Ghezzi44) that may apply downstream impact on the cells’ function(Reference Vincent and Taylor45). It is notable that the activity of key antioxidant enzymes including GPx, CAT and SOD was measured. It has been found that HFD resulted in greater generation of MDA and decrease in GSH level and activity of SOD, GPx and CAT enzymes in comparison with the control. This indicates lower abilities for scavenging of the free radicals in the obese animals and later development of OS. The ingestion of a HFD consisting of multiple energy intake led to the elevated energy metabolism and hyperglycaemia status in the mice so that it augmented the glucose oxidation for producing excess oxidative products. Moreover, heavier oxidative abilities of the products in comparison with the antioxidant capacities may result in OS in body. Thus, decline of the antioxidant enzymes activity can be related to the fast consumption and exhaustion of their storage in body while fighting the free radicals produced in the course of the obesity development(Reference Noeman, Hamooda and Baalash46). In addition, it is necessary to exist a balance between reactive oxygen species and their detoxification via antioxidant enzymes for preventing the oxidative damages.
Consequently, researchers regarded low-to-moderate ST intensity as one of the efficient non-pharmacological treatments for up-regulating expression and activities of the antioxidant enzymes in diverse tissues and metabolic disorders(Reference Golbidi, Badran and Laher47) that enhances insulin sensitivity(Reference Johnson and George48). Such an adaptation to the exercise training in the redox balance into the liver would be highly possible because aerobic exercise causes a temporal generation of reactive oxygen species in liver and then causes a resistance OS response, which would protect the liver from specific toxic impacts of the enhanced reactive oxygen species production(Reference Wilson and Johnson49). Furthermore, MDA content of the treated groups considerably diminished, and the activity of GPx and CAT and level of GSH were elevated across the three groups HFD + CS + ST, HFD + ST and HFD + CS compared with the HFD group. In fact, CS + ST intervention contributed to the increased level of SOD, GSH, CAT and GPx in comparison with individual CS and ST intervention alone, implying the greater impact of this intervention on the OS inhibition in the obese bodies.
Si et al. (Reference Si, Strappe and Blanchard42) in their study showed that OS suppression by CL appeared to be associated with elevated SOD activity and increased GSH level. Results obtained by this study are consistent with the outputs reported by Botezelli et al. (Reference Botezelli, Cambri and Ghezzi44). They showed that Wistar rats exposed to ST for 6–8 weeks exhibited lower lipid peroxidation that could be related to the enhanced SOD and CAT activity in liver. In this regard, Navarro et al. (Reference Navarro, Gomez and López-Cepero50) showed that the chronic moderate exercise enhances the mitochondrial SOD activities and diminishes the oxidation products in the liver of the exercised animals. Moreover, Sun et al. (Reference Sun, Shen and Liu51) demonstrated in the rats exposed to a 4-week resistance training that GSH concentration in the liver mitochondria enhanced, implying the greater antioxidant activities. Earlier results as well as the present outputs indicate an obvious adjustment of liver that acts as one of the major antioxidant systems after ST. It should be noted that our study was not designed to verify whether the activity of SOD and CAT and content of GSH were of cytosolic or mitochondrial origin because we assessed these parameters in total liver homogenates.
For investigating the therapeutic impacts on the modulation of the liver function, this study measured hepatic aspartate aminotransferase, alkaline phosphatase and alanine aminotransferase activities. It has been found that activities of aspartate aminotransferase, alkaline phosphatase and alanine aminotransferase significantly declined in each of the three treatment groups in comparison with the obesity group, reflecting the protecting effects of interventions on the hepatic function. Taken together, HFD + ST, HFD + CS + ST and HFD + CS interventions diminished OS in the obese animals that can have indirectly caused by stronger anti-lipid peroxidation impacts and improvement in the activities of the antioxidant enzymes in the obese animals by declining the obesity-induced lipid peroxidation and elevating the free radicals scavenging.
Although some controversy still exists about the clinical relevance of CS for treatment against obesity in humans, several studies in animals and humans have reported that CS reduces both body weight and cholesterol(Reference Neyrinck, Bindels and De Backer52). Additionally, in humans, different studies carried out to determine the effect of CS on body weight and fat excretion. The fat-trapping ability of CS was measured (2·5 g/d) in an 8-d controlled-feed study (4-d control, 4-d treatment) in college-age men and women. They found that CS supplementation produced little increase in fat excretion: 1·8 g/d (16 kcal/d) in men and none in women. In fact, the few studies performed in humans have been based on fat excretion and reduction of body weight combined or individuals taking low doses of CS(Reference Gades and Stern29).
However, ST, CS + ST and CS interventions applied positive impact on the regulation of the HFD-induced obesity in mice. Therefore, a complex of CS and ST supplements in the HFD decreased the diet-induced obesity more effectively via enhancing the levels of HLD-cholesterol, declined the generation of lipid peroxidation, and enhanced the antioxidant status by elevating the activities of the antioxidant, diminished the fatty acid and TAG synthesis, increased lipid oxidation and ameliorated cholesterol homoeostasis.
Conclusion
The present research demonstrated that treating with HFD + CS + ST in comparison with HFD + ST or HFD + CS alone might effectively decline the metabolic dysfunction in the obesity-induced mice to control the body weight and control the liver tissue and ameliorate the composition of the blood lipid. Moreover, it improved the antioxidant condition in the body. Moreover, greater antioxidant enzyme activities could protect the liver cells and enhance the lipid metabolism modulation, expression of OS-associated genes and liver function in the HFD-induced obese mice. Finally, our results in mice seem to be aligned with those observed in humans.
Acknowledgements
This work was supported by Deputy of Research of Islamic Azad University Science and Research Branch of Tehran, Iran. The authors would like to thank Ahvaz Jundishapur University of Medical Sciences for its financial support in samples preparation and determination by apparatus in toxicology laboratory.
All authors contributed to the design of the manuscript and interpretation of the results. Z. Z. and A. R. V. conducted the statistical analyses, designed the figures and drafted the manuscript. M. J. K., F. G., L. K. and M. R. S. revised the manuscript.
All authors declare no conflict of interest related to the present work.


