


Non-technical Summary
Sharks today live in a variety of habitats, but the range of environments occupied by extinct sharks is not well known. The water temperature and chemistry of marine environments is incorporated in the composition of fish teeth, as well as the way organisms regulate their body temperature. To better understand the ecology of ancient sharks, we analyzed the chemical composition (stable oxygen isotope values) of six Late Cretaceous–age (86–79 million years ago) shark species from the Gulf Coastal Plain of Alabama, USA. We also analyzed teeth from the fish Enchodus petrosus, which should record ambient water temperature and chemistry, and compared the shark data with that of E. petrosus. Two of the shark taxa (Ptychodus mortoni and Cretoxyrhina mantelli) have much lower values compared with other fossil sharks and the fish E. petrosus. The low P. mortoni values are best explained by P. mortoni having a higher body temperature than the surrounding water, either through active or passive body heating. Similarly, the low C. mantelli values are best explained by both migration and higher body temperatures. It was proposed from other evidence that C. mantelli had higher body temperatures, but this study marks the first quantitative evidence of higher body temperatures in P. mortoni. If P. mortoni had an elevated body temperature, then it is likely that body temperature regulation evolved many times in sharks in the geologic past, as this species is not closely related to other species in which this phenomenon is documented.
Introduction
Sharks are cosmopolitan apex predators of both modern and ancient aquatic ecosystems. The evolutionary success of sharks is due in large part to their adaptation to a variety of different habitats, including marine and nonmarine environments. Habitats of extinct shark taxa are usually assessed through the interpretation of depositional environments from the sedimentary units in which they are found (e.g., Case and Schwimmer Reference Case and Schwimmer1988; Shimada Reference Shimada2007; Bice and Shimada Reference Bice and Shimada2016) and through comparisons with extant analogues (e.g., Welton and Farish Reference Welton and Farish1993; Schwimmer et al. Reference Schwimmer, Stewart and Williams1997; Shimada Reference Shimada1997b). However, these habitat interpretations based on depositional environments do not consider differences in preferred water column position, time spent in a habitat, or postmortem transport and mixing of remains. Furthermore, sharks continuously shed teeth throughout their lifetimes, and many sharks are migratory, losing teeth in different locations during their life spans. Differential preservation potential across environments (i.e., differences in the conditions at the time and place of burial that allow for preservation) also leads to gaps in our full understanding of biogeographic ranges. Habitat information from extant sharks can help fill some of these gaps, but modern taxa are limited in their usefulness as analogues due to significant differences in climate and ecosystem structure.
Stable oxygen isotope analysis of biogenic apatite phosphate (δ18Op) in shark tooth enameloid has the potential to be an additional, more precise paleohabitat proxy. Shark teeth consist of an internal, porous dentin layer and an outer, highly mineralized fluorapatite (Ca5(PO4)F) enameloid layer (e.g., Enax et al. Reference Enax, Prymak, Raabe and Epple2012). Unlike dentin, enameloid is highly resistant to diagenesis (e.g., Kolodny and Raab Reference Kolodny and Raab1988), preserving original isotopic values even at geologic timescales (e.g., Ostrom et al. Reference Ostrom, Macko, Engel, Silfer and Russell1990, Reference Ostrom, Macko, Engel and Russell1993; Kolodny and Luz Reference Kolodny and Luz1991; Fischer et al. Reference Fischer, Voigt, Franz, Schneider, Joachimski, Tichomirowa, Gotze and Furrer2012, Reference Fischer, Schneider, Voigt, Joachimski, Tichomirowa, Tütken, Gotze and Berner2013; Hättig et al. Reference Hättig, Stevens, Thies, Schweigert and Mutterlose2019; Kast et al. Reference Kast, Griffiths, Kim, Rao, Shimada, Becker and Maish2022; Comans et al. Reference Comans, Smart, Kast, Lu, Lüdecke, Leichliter, Sigman, Ikejiri and Martínez-García2024). Enameloid phosphate precipitates in isotopic equilibrium with body water at body temperature due to rapid, enzyme-catalyzed exchange reactions (Kolodny et al. Reference Kolodny, Luz and Navon1983). The body water of fishes is in equilibrium with seawater (Kolodny et al. Reference Kolodny, Luz and Navon1983), making the δ18Op of biogenic apatite phosphate in fish enamel(oid) (i.e., bony fishes and sharks) a function of the oxygen isotope composition of seawater (δ18Osw) and body temperature at the time of tooth formation (Longinelli and Nuti Reference Longinelli and Nuti1973; Kolodny et al. Reference Kolodny, Luz and Navon1983; Kolodny and Raab Reference Kolodny and Raab1988). Most sharks are poikilothermic, meaning the surrounding ambient sea temperatures control their body temperatures. Thus, the δ18Op of shark enameloid should reflect ambient water-temperature conditions during tooth formation (e.g., Žigaitė and Whitehouse Reference Žigaitė and Whitehouse2014; Karnes et al. Reference Karnes, Chan, Kuntz, Griffiths, Shimada, Becker and Maisch2024). Indeed, researchers have used the δ18Op of shark enameloid to infer environmental conditions, including seawater temperature (Kolodny and Raab Reference Kolodny and Raab1988; Kolodny and Luz Reference Kolodny and Luz1991; Pucéat et al. Reference Pucéat, Lecuyer, Sheppard, Dromart, Reboulet and Grandjean2003; Hättig et al. Reference Hättig, Stevens, Thies, Schweigert and Mutterlose2019; Leuzinger et al. Reference Leuzinger, Kocsis, Luz, Vennemann, Ulyanov and Fernández2023) and salinity (Fischer et al. Reference Fischer, Voigt, Franz, Schneider, Joachimski, Tichomirowa, Gotze and Furrer2012, Reference Fischer, Schneider, Voigt, Joachimski, Tichomirowa, Tütken, Gotze and Berner2013; Leuzinger et al. Reference Leuzinger, Kocsis, Billon-Bruyat, Spezzaferri and Vennemann2015) in both modern (Vennemann et al. Reference Vennemann, Hegner, Cliff and Benz2001; Kocsis et al. Reference Kocsis, Vennemann, Ulianov and Brunnschweiler2015; Tütken et al. Reference Tütken, Weber, Zohar, Helmy, Bourgon, Lernau, Jochum and Sisma-Ventura2020) and ancient systems (e.g., Kohn and Cerling Reference Kohn and Cerling2002; Fischer et al. Reference Fischer, Voigt, Franz, Schneider, Joachimski, Tichomirowa, Gotze and Furrer2012; Tütken et al. Reference Tütken, Weber, Zohar, Helmy, Bourgon, Lernau, Jochum and Sisma-Ventura2020). Limited studies have used δ18Op to explore the paleoecology of these fossil sharks directly (e.g., Fischer et al. Reference Fischer, Voigt, Franz, Schneider, Joachimski, Tichomirowa, Gotze and Furrer2012, Reference Fischer, Schneider, Voigt, Joachimski, Tichomirowa, Tütken, Gotze and Berner2013; Griffiths et al. Reference Griffiths, Eagle, Kim, Flores, Becker, Maish IV and Traylor2023; Larocca Conte et al. Reference Larocca Conte, Aleksinski, Liao, Kriwet, Mörs, Trayler, Ivany, Huber and Kim2024).
Here we measured the δ18Op of six Late Cretaceous shark species from two formations (the offshore Mooreville Chalk and the nearshore Blufftown Formation) to investigate shark paleoecology in the Gulf Coastal Plain (GCP). The geologic formations are similar in age but with different lithologies. The sampled localities are within a relatively small geographic area and probably experienced similar environmental conditions within the GCP, which was likely in open exchange with the Atlantic Ocean. Also, many specimens of each taxon are available in museum collections from both formations for partially destructive analysis. We also compared shark tooth enameloid δ18Op values with those of tooth enamel from a co-occurring bony fish, Enchodus petrosus Cope, Reference Cope1874, in each formation as a reference for ambient conditions (Harrell et al. Reference Harrell, Perez-Huerta and Suarez2016). We expect that sharks that spent significant time in a nearshore environment with the potential for low δ18O freshwater input (e.g., brackish conditions) preserved enameloid with lower δ18Op values than those from strictly marine environments. However, sharks can be migratory, and given tooth replacement and isotopic incorporation rates (e.g., weeks to months depending on the taxon; Moss Reference Moss, Gilbert, Matthewson and Rall1967; Reif et al. Reference Reif, McGill and Motta1978; Bruner Reference Bruner1998; Zeichner et al. Reference Zeichner, Colman, Polo-Silva, Galvan-Magana and Kim2017), we consider possible sources of δ18Op variation within individuals and across taxa, including water depth and thermal gradients, migrations and latitudinal thermal gradients (e.g., Western Interior Seaway [WIS]), and variation in the δ18Osw (e.g., marine vs. brackish settings). In addition, although most sharks are poikilothermic, several modern taxa are recognized as having higher body temperatures than surrounding waters (e.g., great white shark, Carcharodon carcharias ), and there is increasing evidence for thermoregulation in some Late Cretaceous sharks (Ferrón Reference Ferrón2017; Pimiento et al. Reference Pimiento, Cantalapiedra, Shimada, Field and Smaers2019), which would influence δ18Op. We consider a variety of these biological and environmental influences and present here paleoecological interpretations of several Late Cretaceous sharks in the GCP.
Materials and Methods
Sampled Late Cretaceous Taxa
We sampled tooth specimens from six different shark species, including five Lamniformes (hereafter referred to as lamniforms): Cretoxyrhina mantelli Agassiz, Reference Agassiz1835, Cretalamna appendiculata Agassiz, Reference Agassiz1835, Scapanorhynchus texanus Roemer, Reference Roemer1849, Squalicorax kaupi Agassiz, Reference Agassiz1843, Squalicorax pristodontus Agassiz, Reference Agassiz1835, and Ptychodus mortoni Mantell, Reference Mantell1839. The higher taxonomic placement of the genus Ptychodus is debated (see Shimada Reference Shimada2012), and in this study, we adopt the designation incertae sedis (e.g., Hoffman et al. Reference Hoffman, Hageman and Claycomb2016). Paleontologists have proposed that the definitive Late Cretaceous lamniforms included in this study were globally distributed nektonic predators based on inferred diets, depositional environments, and similarities to modern lamniforms (e.g., Cappetta Reference Cappetta1987; Shimada Reference Shimada1997a; Shimada and Cicimurri Reference Shimada and Cicimurri2005; Shimada Reference Shimada2007). The piercing- and cutting-type lamniform teeth were likely effective for consuming a variety of prey items found in both near- and offshore environments, including marine reptiles (Schwimmer et al. Reference Schwimmer, Stewart and Williams1997; Everhart Reference Everhart2004), bony fishes (Hamm and Shimada Reference Hamm and Shimada2002; Ciampagalio et al. Reference Ciampagalio, Wray and Corliss2005), and other sharks (e.g., Shimada Reference Shimada1997a). Ptychodus mortoni is known from marine deposits in North America (United States), South America (Mexico), Europe, and Africa (e.g., Applegate Reference Applegate1970; Cappetta Reference Cappetta1987; Shimada et al. Reference Shimada, Everhart, Decker and Decker2010; Ciampagalio et al. Reference Ciampagalio, Cicimurri, Ebersole and Runyon2013; see review of localities by Blanco-Piñón et al. Reference Blanco-Piñón, Garibay–Romero and Alvarado–Ortega2007). Similar to modern durophagous sharks with molariform teeth, the genus Ptychodus is interpreted to be a benthic predator (e.g., Shimada et al. Reference Shimada, Rigsby and Kim2009, Reference Shimada, Everhart, Decker and Decker2010) that consumed hard-shelled macroinvertebrates by crushing or crunching (Ciampagalio et al. Reference Ciampagalio, Wray and Corliss2005; Shimada Reference Shimada2012; Amadori et al. Reference Amadori, Kindlimann, Fornaciari, Giusberti and Kriwet2022), although nektonic turtles and ammonites have also been proposed as components of their diets (Vullo et al. Reference Vullo, Villalobos-Segura, Amadori, Kriwet, Frey, González González, Padilla Gutiérrez, Ifrim, Stinnesbeck and Stinnesbeck2024). Thus, lamniform and P. mortoni diets inferred from tooth morphology suggest that there may be some habitat differences or partitioning among the sampled taxa (e.g., offshore vs. nearshore, benthic vs. nektonic).
Following the approach of Harrell et al. (Reference Harrell, Perez-Huerta and Suarez2016), we used E. petrosus as a reference for poikilothermic fish whose δ18Op values record ambient conditions. We compared the mean shark taxon δ18Op values with those of E. petrosus from the same geologic formation. Enchodus petrosus was an active predator (Cumbaa et al. Reference Cumbaa, Underwood, Schröder-Adams, Arratia, Schultze and Wilson2013) but may also have been a prey item of larger vertebrates, including sharks (e.g., Shimada Reference Shimada1997a; Everhart Reference Everhart2004), meaning it likely occupied the same habitat as the predatory sharks (e.g., Schein and Lewis Reference Schein and Lewis2007; McIntosh et al. Reference McIntosh, Shimada and Everhart2016; Allen and Shimada Reference Allen and Shimada2021). Comparing shark δ18Op values with those of E. petrosus allows us to evaluate the direction and magnitude of any potential differences between sharks and ambient conditions and explore possible drivers of those differences.
Geologic Setting
The Mooreville Chalk and the Blufftown Formation in Alabama (Fig. 1) are temporally equivalent (latest Santonian–Campanian) but with different lithologies, and both have well-preserved marine vertebrate fossils (e.g., Applegate Reference Applegate1970; Case and Schwimmer Reference Case and Schwimmer1988; Shimada and Hooks Reference Shimada and Hooks2004; Shimada and Brereton Reference Shimada and Brereton2007; Shimada et al. Reference Shimada, Rigsby and Kim2009; Ikejiri et al. Reference Ikejiri, Ebersole, Blewitt and Ebersole2013; Ehret and Harrell Reference Ehret and Harrell2018). The Mooreville Chalk consists of yellowish-gray to dark-bluish-gray fossiliferous chalky clay and chalky marl with siliciclastic sediments near the base of the formation. The upper Arcola Limestone Member overlays the lower, undifferentiated strata of the Mooreville Chalk and consists of calcisphere wackestones and packstones (Tew Reference Tew2000) and chalky marl beds (Raymond et al. Reference Raymond, Obsborne, Copeland and Neathery1988). Sedimentologists have interpreted the Mooreville Chalk to represent deposition in an inner to middle neritic environment (Mancini and Soens Reference Mancini and Soens1994; Puckett Reference Puckett1995; Mancini et al. Reference Mancini, Puckett and Tew1996) with water depths ranging up to 90 m (Puckett Reference Puckett1991).
Map of the Late Cretaceous (Santonian–Maastrichtian) strata exposed in Alabama, USA (modified from Mohr et al. Reference Mohr, Tobin and Tompkins2024) with specimen localities sampled in this study. The purple shaded area in the inset map shows the Gulf Coastal Plain. The stratigraphic column inset shows a simplified view of Late Cretaceous units from western to eastern Alabama (Raymond et al. Reference Raymond, Obsborne, Copeland and Neathery1988). Alabama geologic map data sourced from the Geological Survey of Alabama (Szabo et al. Reference Szabo, Osborne, Copeland and Neathery1988). See Supplemental Data for locality information for each specimen.

In Alabama, the Blufftown Formation is exposed in the eastern portion of the state (Fig. 1) and consists of gravelly, glauconitic, calcareous sand and sandy clay that grades into the Mooreville Chalk in western Alabama (Raymond et al. Reference Raymond, Obsborne, Copeland and Neathery1988). The Blufftown Formation was deposited in a nearshore, marginal marine environment (Skotnicki and King Reference Skotnicki and King1986; King Reference King1990; Schwimmer et al. Reference Schwimmer, Williams, Dobie and Siesser1993; King and Skotnicki Reference King and Skotnicki1994), potentially with substantial freshwater input from rivers in the upper portion of the Blufftown of eastern Alabama to western Georgia (e.g., Case and Schwimmer Reference Case and Schwimmer1988).
Sampling Approach
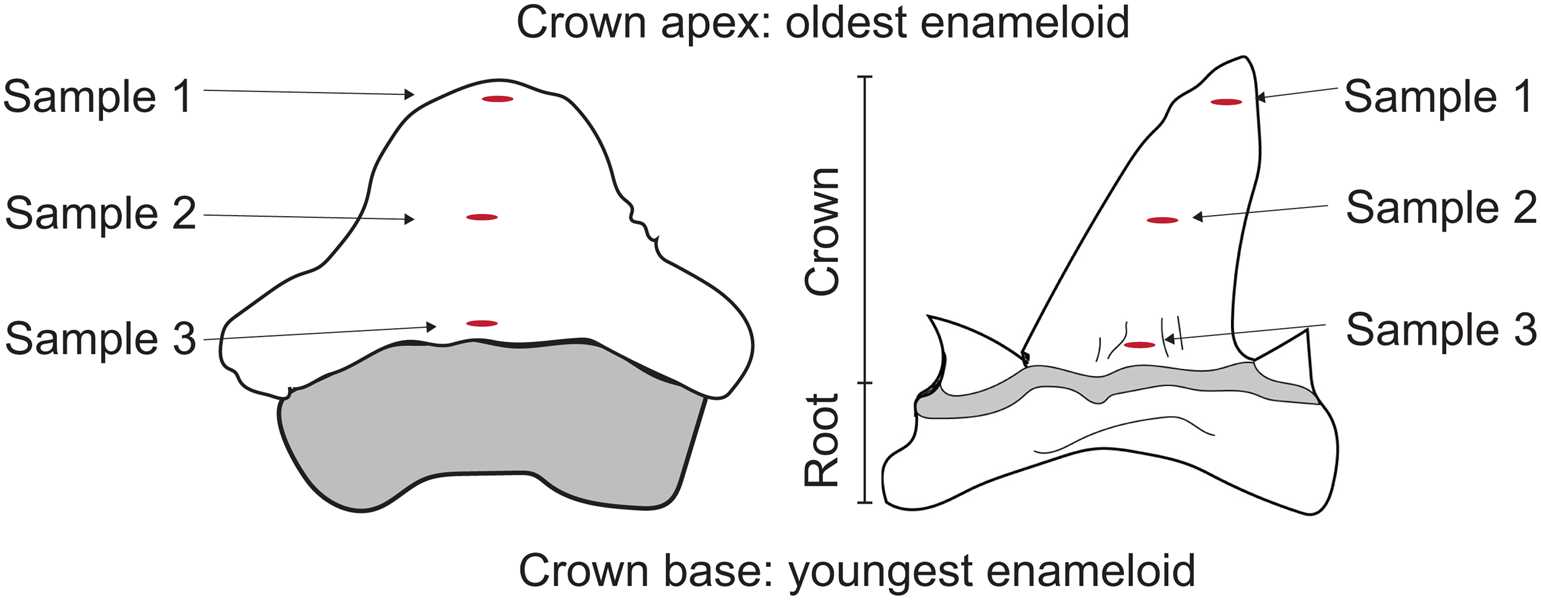
We sampled specimens from the Alabama Museum of Natural History (ALMNH) and the Auburn University Museum of Natural History (AUM) (see Appendix A, Supplemental Data). When possible, we sampled at least three teeth from each selected species within both formations (Table 1). Due to specimen availability, we sampled only a single S. pristodontus tooth and no P. mortoni teeth from the Blufftown Formation. We used a Dremel rotary tool with a diamond drill bit to remove the outer enameloid layer, creating 300–500 μg of enameloid powder per sample. We sampled each tooth in three discrete locations: at the apex, the middle, and the base of the crown (Fig. 2). During shark tooth formation, the enameloid is first mineralized at the apex of the crown, and mineralization progresses toward the base (Jambura et al. Reference Jambura, Kindlimann, Lopez-Romero, Marrama, Pfaff, Stumpf, Turtscher, Underwood, Ward and Kriwet2019). Because enameloid thickness varies across the tooth crown, we also re-analyzed our data using only results from a single position (apical) to confirm that sampling position did not affect our results. The amount of time captured by tooth formation (i.e., isotopic incorporation rate; e.g., Kim et al. Reference Kim, Del Rio, Casper and Koch2012; Zeichner et al. Reference Zeichner, Colman, Polo-Silva, Galvan-Magana and Kim2017) can vary across shark taxa from weeks to months (Moss Reference Moss, Gilbert, Matthewson and Rall1967; Reif et al. Reference Reif, McGill and Motta1978; Bruner Reference Bruner1998; Zeichner et al. Reference Zeichner, Colman, Polo-Silva, Galvan-Magana and Kim2017). By sampling in three different locations along the crown, we capture the isotopic history of the tooth and can assess intra-tooth variability. We also sampled teeth from E. petrosus using the same sampling procedure outlined earlier.
Summary of the mean δ18Op values by taxon from the Mooreville Chalk and Blufftown Formation with upper and lower 95% confidence intervals (CI). Asterisks (*) indicate statistically significant offsets from co-occurring Enchodus petrosus averages. N = the number of teeth sampled per taxon. n = the total number of measurements per taxon. VSMOW, Vienna Standard Mean Ocean Water.

Individual specimen sampling strategy. Three samples were drilled from each tooth specimen from the base to the top of the enameloid crown. Sample 1 was taken from the apex, Sample 2 from the middle, and Sample 3 from the base of the crown. The tooth on the left illustrates the general shape of a Ptychodus mortoni crown. The tooth on the right illustrates the general shape of the lamniform Cretalamna appendiculata, but the sampling strategy was applied to all lamniforms sampled in this study.
Single Individual Sampling Approach
Many modern lamniform sharks undertake migrations of hundreds to thousands of miles (e.g., Bonfil et al. Reference Bonfil, Meÿer, Scholl, Johnson, O'Brien, Oosthuizen, Swanson, Kotze and Paterson2005; Gore et al. Reference Gore, Rowat, Hall, Gell and Ormond2008), passing through different habitats and environmental conditions. Sharks continuously shed and replace their teeth throughout their lifetimes, and a single tooth records only a narrow time interval of an individual's life. Examining multiple teeth from a single individual that are precipitated at different times, thus potentially recording various environmental conditions, can provide valuable insight into migrations or habitat changes over time. However, it is often difficult to conduct these studies due to the rarity of multiple teeth found in association from a single individual. We analyzed five randomly chosen, disarticulated (i.e., not in situ), yet associated teeth that are interpreted to come from a single individual (Squalicorax kaupi; ALMNH:Paleo:2422a-e) collected from the Mooreville Chalk to assess intra-individual variability.
Stable Oxygen Isotope Analysis of Biogenic Phosphate
We processed and analyzed powdered enameloid samples at the University of Arkansas Stable Isotope Laboratory (UASIL) following the slow microprecipitation of silver phosphate (Ag3PO4) method adapted from O'Neil et al. (Reference O'Neil, Roe, Reinhard and Blake1994), Vennemann et al. (Reference Vennemann, Fricke, Blake, O'Neil and Colman2002), and Bassett et al. (Reference Bassett, Macleod, Miller and Ethington2007). We added 100 μl of 0.5 M HNO3 to each sample and allowed samples to sit overnight to dissolve the enameloid powder. Next, we added 75 μl of 0.5 M KOH and 200 μl of 0.17 M KF to increase pH, decrease the solubility of CaF2, and precipitate out Ca2+ as CaF2. We then centrifuged samples and used disposable glass pipettes to transfer the supernatant to new, clean microcentrifuge tubes. To precipitate the Ag3PO4 crystals, we added 250 μl of silver ammine solution (O'Neil et al. Reference O'Neil, Roe, Reinhard and Blake1994; Bassett et al. Reference Bassett, Macleod, Miller and Ethington2007) and allowed samples to sit for 21 hours in an oven at 46°C. At 21 hours, we added 1 ml of deionized water to each sample and centrifuged to prevent nitrate oxide contamination. We then decanted the supernatant. After precipitation of the silver phosphate crystals was completed, we centrifuged and rinsed samples five more times with deionized water and allowed them to dry for at least 24 hours in an oven at 46°C. After the samples were dried, we inspected each centrifuge tube of Ag3PO4 crystals under a microscope to assess crystal appearance and exclude samples with suspected contamination by fibers or any non-Ag3PO4 crystals. We analyzed Ag3PO4 crystals using a high-temperature conversion elemental analyzer by reacting the crystals with graphite at 1400°C to produce CO gas (Vennemann et al. Reference Vennemann, Fricke, Blake, O'Neil and Colman2002) that was then measured via continuous flow using a Thermo Finnigan Delta Plus XL Gas Chromatograph Isotope Ratio Mass Spectrometer (IRMS). We report our results here in standard delta notation (δ18O) relative to VSMOW (Vienna Standard Mean Ocean Water).
We prepared NIST SRM 120c along with enameloid samples as a quality control standard to monitor accuracy and precision (21.6 ± 1.2‰, n = 9). UASIL used the following reference standards: USGS-81 (34.6 ± 1.3‰, n = 21) and NBS-127 (8.5 ± 0.4‰, n = 14). The instrumental precision was 0.4‰, derived from the NBS-127 standard. We removed measurements with low mass to peak area relation (i.e., not completely Ag3PO4, n = 7 measurements) or small peaks (i.e., poorly constrained, n = 2 measurements) before beginning data analyses (See Appendix A, Supplemental Data).
Statistical Approach
Our data have a hierarchical structure, and we calculated our mean δ18Op values at the specimen (single-tooth) level and then used mean specimen values to calculate a taxon-level mean δ18Op value. To calculate a confidence interval, we resampled each measurement 10,000 times from a normal distribution, where the δ18Op value was the mean and the instrumental precision (0.4‰) was the standard deviation. For each resampling iteration, we calculated mean δ18Op values for each specimen and subsequently, from each specimen mean, each taxon mean within each formation. Standard deviations for specimen and taxon mean δ18Op values were calculated from the standard deviation of calculated values from all resampling iterations. Almost all calculated specimen and taxon δ18Op values had standard deviations below instrumental precision (0.4‰). To be conservative, we increased (to 0.4‰) the standard deviation for any calculated specimen or taxon standard deviation values that were below this instrumental precision. Higher values were not modified. Next, we followed the same resampling approach to estimate the offsets between shark taxa and E. petrosus δ18Op mean values (i.e., shark mean minus E. petrosus mean). We resampled offset means and standard deviations using the previously calculated mean taxon values and standard deviations. Finally, we tested the significance of offsets between shark taxa and E. petrosus using analysis of variance and post hoc Tukey's honestly significant difference (HSD) tests. We observed identical offsets between sharks and E. petrosus when we resampled our data following the same procedure but using two random values from each specimen, confirming the adequacy of our physical sampling scheme (Fig. 2). We used an α value of 0.05 for all tests and completed all statistical analyses using RStudio v. 4.2.1 (R Core Team 2022).
Results
Shark δ18Op Offsets from Enchodus petrosus
Mooreville Chalk
Summary δ18Op values for each taxon in the Mooreville Chalk are shown in Table 1. Cretalamna appendiculata, Scapanorhynchus texanus, Squalicorax kaupi, and Squalicorax pristodontus have δ18Op values that are statistically indistinguishable from co-occurring E. petrosus (21.3‰; see Table 1). Post hoc Tukey HSD tests for multiple comparisons found δ18Op values are significantly different between only Ptychodus mortoni–E. petrosus and Cretoxyrhina mantelli–E. petrosus (p < 0.01 and p = 0.04, respectively; Fig. 3, Table 1, Supplementary Table 1). Ptychodus mortoni δ18Op is 1.1‰ lower and C. mantelli δ18Op is 2.2‰ lower than co-occurring E. petrosus δ18Op (Fig. 3, Table 1). The δ18Op values for C. mantelli and P. mortoni are nearly, but not significantly different from each other (Student's t-test: t = 2.51, df = 4, p = 0.06). There are no differences in δ18Op values between shark specimens from the Arcola Limestone Member of the Mooreville Chalk and the reference E. petrosus from the lower unnamed Mooreville Chalk (Student's t-test: t = −1.3, df = 16, p = 0.2).
Mean specimen (circle) and taxon (X) δ18Op values from the Mooreville Chalk and the Blufftown Formation. Bracketed vertical lines indicate 95% confidence intervals (CIs) of the taxon mean. Light gray vertical bars indicate 95% CIs of the specimen mean. Asterisks (*) on taxon names indicate that the mean isotopic composition of those taxa are significantly different from the mean of the co-occurring fish Enchodus petrosus. VSMOW, Vienna Standard Mean Ocean Water. The image silhouettes are from PhyloPic (https://www.phylopic.org) and were contributed as follows: Cretoxyrhina mantelli by Dmitry Bogdanov (2013; CC BY 3.0), and the orignal color was changed from black to orange; Cretalamna appendiculata by Oliver E. Demuth and Cooper et al. (Reference Cooper, Pimiento, Ferrón and Benton2020) (2023; CC BY 4.0), and the original color was changed from black to blue; and Scapanorhynchus texanus by Dianne Bray/Museum of Victoria (2013; CC BY 3.0), and the original color was changed from black to grey.

Blufftown Formation
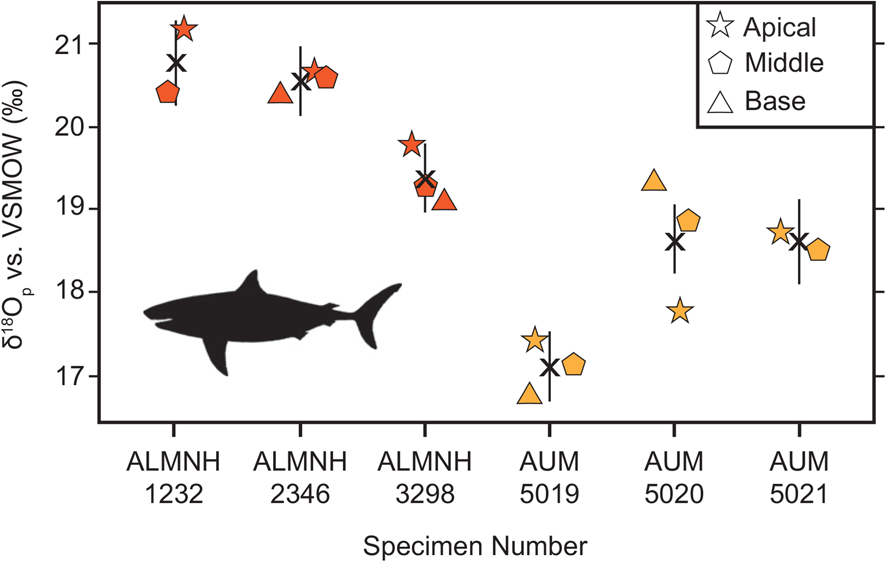
Summary δ18Op values for each taxon in the Blufftown Formation are shown in Table 1. Similar to the Mooreville Chalk, C. appendiculata, S. texanus, S. kaupi, and S. pristodontus have overlapping δ18Op values with co-occurring E. petrosus (21.4‰; see Table 1). Post hoc Tukey HSD tests for multiple comparisons found δ18Op values are significantly different only between C. mantelli–E. petrosus (−3.3‰ difference, p ≪ 0.01; Fig. 3, Table 1). Cretoxyrhina mantelli is also the only taxon sampled from both formations to have significantly different δ18Op values between the formations (Student's t-test: t = 3.17, df = 4, p = 0.03; Fig. 4;).
Individual measurements per specimen and mean tooth (X) δ18Op values for Cretoxyrhina mantelli specimens from the Mooreville Chalk (dark orange) and the Blufftown Formation (light orange). Black vertical lines indicate 95% confidence intervals of each specimen mean. Tooth crown sample positions: apical (stars), middle (pentagons), and base (triangles). ALMNH, Alabama Museum of Natural History; AUM, Auburn University Museum of Natural History; VSMOW, Vienna Standard Mean Ocean Water. The image silhouette is from PhyloPic (https://www.phylopic.org) and was contributed by Dmitry Bogdanov (2013; CC BY 3.0).
δ18Op Variability
Intra-individual Variability
The five teeth measured from a single S. kaupi individual from the Mooreville Chalk have a mean δ18Op value of 22.2‰ and a range of 2.1‰ (20.8‰ to 22.9‰; Supplementary Fig. 1), much higher than previously reported intra-individual variations (up to 1.1‰; Vennemann et al. Reference Vennemann, Hegner, Cliff and Benz2001), and higher than any intra-taxon variability observed within a formation (Supplementary Table 2). Specimens ALMNH:Paleo:2422d and ALMNH:Paleo:2422e have significantly different mean values from the other three teeth sampled but have δ18Op values consistent with co-occurring E. petrosus (Supplementary Fig. 1). Specimens ALMNH:Paleo:2422b and ALMNH:Paleo:2422d have the highest intra-tooth variability, but variability within all five teeth from the single S. kaupi individual is less than 0.5‰.
Discussion
Most shark taxa sampled here were likely poikilothermic and living in open-marine environments, as evidenced by the overlapping δ18Op values of taxa within and between the Mooreville Chalk and the Blufftown Formation (Fig. 3, Table 1, Supplementary Table 1). Within both formations, Cretalamna appendiculata, Scapanorhynchus texanus, Squalicorax kaupi, and Squalicorax pristodontus have δ18Op values indistinguishable from the bony fish, Enchodus petrosus. While many sharks can migrate vast distances, potentially recording a variety of environmental conditions, the low intra-taxon variability of those taxa measured here (Supplementary Table 2) would indicate that most taxa spent substantial time in the GCP, at least relative to their tooth replacement rates. An exception to this generality is the poikilothermic S. kaupi individual that has teeth with significantly different δ18Op values (Supplementary Fig. 1) and large intra-individual variability (2.1‰) that suggests migration between different environments (e.g., higher and lower latitudes within the Northern Atlantic Ocean; Cappetta Reference Cappetta1987, Reference Cappetta2012). The difference in isotopic histories between a single tooth and multiple teeth from a single individual can provide greater insight into migration or habitat shifts over time, but articulated shark jaws are rare and generally not available for destructive sampling for isotope analyses.
We observe significant differences in Ptychodus mortoni and Cretoxyrhina mantelli δ18Op values from co-occurring E. petrosus δ18Op values in the Mooreville Chalk and the Blufftown Formation. These offsets from E. petrosus are likely not the result of differences in environmental conditions between the formations, because the δ18Op values for E. petrosus are similar in each unit. Rather, these offsets likely result from variations in δ18Osw or temperature due to differences in the habitats or biology of these taxa specifically. Species-specific nonequilibrium isotope biologic fractionation effects (i.e., kinetic effects), sometimes called “vital effects,” could explain these differences, but we are unable to recognize such vital effects over and above those of biological or habitat signals. Vennemann et al. (Reference Vennemann, Hegner, Cliff and Benz2001) investigated possible δ18Op vital effects in several modern shark species (including lamniforms) and found little evidence of vital effects distinguishable from habitat or biological signals. Žigaitė and Whitehouse (Reference Žigaitė and Whitehouse2014) demonstrated the effects of tooth histology and ontogeny on the δ18Op of modern sandbar shark (Carcharhinus plumbeus) enameloid and dentin precipitated under controlled conditions and concluded that enameloid was a reliable recorder of ambient environmental conditions. Because disequilibrium vital effects have not been documented, and paleotemperature reconstructions from δ18Op of shark enameloid are generally consistent with other proxies (e.g., Kolodny and Raab Reference Kolodny and Raab1988; Roelofs et al. Reference Roelofs, Barham, Cliff, Joachimski, Martin and Trinajstic2017; Hättig et al. Reference Hättig, Stevens, Thies, Schweigert and Mutterlose2019), we consider this explanation unlikely to explain the observed offsets.
In the following sections, we address ecological explanations for the divergent δ18Op values, with a particular focus on the anomalous taxa P. mortoni and C. mantelli. First, we consider explanations driven by different δ18Osw values these taxa could encounter in other habitats; second, we consider explanations driven by different temperatures these taxa could either encounter or generate internally.
δ18O of Seawater
If the negative P. mortoni–E. petrosus and C. mantelli–E. petrosus offsets are driven solely by differences in δ18Osw values, we can calculate the required δ18Osw values using the relationship between temperature, δ18Osw, and δ18Op and holding temperature constant (e.g., Lécuyer et al. Reference Lécuyer, Amiot, Touzeau and Trotter2013):

For a constant temperature, differences in δ18Op equate exactly to the same magnitude difference in δ18Osw. If we assume a δ18Osw of −1‰ for an ice-free Late Cretaceous (e.g., Shackleton and Kennett Reference Shackleton and Kennett1975), the P. mortoni–E. petrosus offset in the Mooreville Chalk indicates a δ18Osw of −3.2‰, and the C. mantelli–E. petrosus offsets in the Mooreville Chalk and the Blufftown Formation indicate δ18Osw of −2.1‰ and −4.2‰, respectively. These lower δ18Osw values could be explained by increased local freshwater influence or migration from areas with lower open-marine δ18Osw values, which we explore below.
Freshwater Influence
The low P. mortoni and C. mantelli δ18Op values could be explained by some time spent in a brackish environment. A previous study used the δ18Op of hybodont shark enameloid from the Late Triassic Rhaetian Sea to show the transition from marine to nonmarine conditions within the region, supporting euryhalinity (i.e., tolerance for a wider range of salinities) in certain hybodont taxa (Fischer et al. Reference Fischer, Voigt, Franz, Schneider, Joachimski, Tichomirowa, Gotze and Furrer2012). Although our data imply that the Blufftown Formation is open marine with normal salinity, areas of nearby brackish conditions in the GCP are implied by frequent (e.g., biweekly) negative δ18Op excursions from in situ mosasaur teeth, which were interpreted to represent short migrations into local areas of fresher water (Taylor et al. Reference Taylor, Totten, Suarez, Gonzalez, Martin, Lambert, Ehret and Harrell2021). We cannot sample a similar articulated jaw for sharks, but the consistently lower δ18Op values from P. mortoni and C. mantelli individuals could be explained if they inhabited or spent substantial time in brackish conditions.
Most modern marine sharks, except for the bull shark (Carcharhinus leucas, Carcharhiniformes) are stenohaline (i.e., tolerant of a narrow range of salinities). After time spent in 75% seawater (i.e., 25% freshwater), stenohaline sharks (e.g., Heterodontus portusjacksoni, Mustelus antarcticus) suffer a significant decrease in urea and blood oxygen that can compromise osmoregulation (Cooper and Morris Reference Cooper and Morris2004; Morash et al. Reference Morash, Mackellar, Tunnah, Barnett, Stehfest, Semmens and Currie2016). If we apply this 25% freshwater (75% seawater) threshold to stenohaline Late Cretaceous sharks and assume a δ18Osw of −1‰ with a δ18O of freshwater of −9‰ in the eastern GCP (e.g., Poulsen et al. Reference Poulsen, Pollard and White2007), then we may expect that stenohaline sharks in the GCP could tolerate an average local δ18Osw as low as −3‰ (or an offset of −2‰ from our E. petrosus). Offsets from E. petrosus beyond −2‰ (i.e., more negative) could indicate tolerance of a wider range of salinities. Thus, while the smaller C. mantelli–E. petrosus offset in the Mooreville Chalk (−1.1‰) could be explained by some time in a brackish environment within standard shark salinity tolerance limits, the larger offset in the Blufftown Formation (−3.3‰) would require a living environment that was fresher than most sharks can tolerate (Table 1). The P. mortoni–E. petrosus offset in the Mooreville Chalk (−2.2‰) is plausibly consistent (within uncertainty) with a brackish-water habitat for P. mortoni, albeit at the lower edge of salinity tolerances for most sharks (see “δ18O of Seawater”).
While the isotopic results of this study are consistent with P. mortoni inhabiting brackish conditions over long periods, we consider this explanation unlikely for several reasons. First, P. mortoni is known only from marine deposits (see “Sampled Late Cretaceous Taxa”). Further, P. mortoni from the Eutaw Formation (Alabama, USA; Fig. 1) had lower nitrogen isotope values from enameloid-bound organic matter (δ15NEB) than co-occurring marine lamniforms (Comans et al. Reference Comans, Smart, Kast, Lu, Lüdecke, Leichliter, Sigman, Ikejiri and Martínez-García2024), inconsistent with the higher δ15NEB values expected in estuarine conditions (Shipley et al. Reference Shipley, Newton, Frisk, Henkes, LaBelle, Camhi, Hyatt, Walters and Olin2021). Second, we might expect sharks like C. leucas that transition between marine and brackish settings (e.g., Heupel and Simpfendorfer Reference Heupel and Simpfendorfer2008; Smoothey et al. Reference Smoothey, Lee and Peddemors2019) to have a greater range of δ18Op values, because their teeth would incorporate different environmental conditions during their lifetimes (e.g., Žigaitė and Whitehouse Reference Žigaitė and Whitehouse2014). Ptychodus mortoni specimens have a very small δ18Op range (0.3‰; Supplementary Table 2), implying they remained in one location rather than transitioning between different environments. Given the lack of physical evidence for their presence in brackish environments, their measured δ15NEB values, low interspecimen δ18Op variability, and the rarity of euryhaline tolerance in sharks, we do not consider occasional migrations or full-time occupancy of a brackish habitat as a likely explanation for the P. mortoni–E. petrosus offset in the Mooreville Chalk.
Similarly, the lower δ18Op values recorded for C. mantelli from both formations could potentially be explained by differences in time spent in brackish conditions, although we also consider this explanation implausible for this taxon. Ontogenetic habitat partitioning, wherein juveniles inhabited nearshore environments while adults lived offshore, could explain the lower δ18Op values in the Blufftown Formation if those specimens are juveniles. Researchers have observed such habitat partitioning in the modern Carcharodon carcharias and Isurus oxyrinchus (Hoyos-Padilla et al. Reference Hoyos-Padilla, Klimley, Galván-Magaña and Antoniou2016; Tamburin et al. Reference Tamburin, Kim, Elorriaga-Verplancken, Madigan, Hoyos-Padilla, Sánchez-González, Hernández-Herrera, Castillo-Geniz, Godinez-Padilla and Galván-Magaña2019), which are modern analogues for C. mantelli (Shimada Reference Shimada1997a,Reference Shimadab). However, adult individuals from either of these modern species are not known to inhabit brackish or freshwater, and we interpret the C. mantelli teeth sampled from each formation in this study to represent adult individuals. Further, C. mantelli specimens are known only from marine strata (see “Sampled Late Cretaceous Taxa”). The larger (−3.3‰) δ18Op offset for this taxon in the Blufftown Formation would require ~40% freshwater contribution, which would be difficult for most sharks to tolerate. Additionally, the inferred prey items of C. mantelli based on predator–prey interactions in the fossil record (e.g., Shimada Reference Shimada1997a; Shimada and Hooks Reference Shimada and Hooks2004) indicate a primarily marine habitat. Thus, inferences from modern analogues, the lack of C. mantelli specimens collected from nonmarine or estuarine environments, and an inferred diet of marine prey do not support the freshwater hypothesis or account for differences in δ18Op values between formations.
δ18Osw Variation and Migration
A nearby brackish habitat is an unlikely explanation for the anomalously low P. mortoni and C. mantelli δ18Op values, but there could have been a δ18Osw gradient between surface and bottom waters (e.g., Craig Reference Craig1966; Woo et al. Reference Woo, Anderson, Railsback and Sandberg1992) in the GCP due to evaporative effects. However, a surface to bottom water difference would result in higher δ18Op values, not lower, for surface-dwelling nektonic sharks. Alternatively, either P. mortoni or C. mantelli could have spent substantial time in fully marine environments with lower δ18Osw values relative to the GCP (e.g., the more normal marine WIS). In this model, the organism would have grown teeth in the WIS before migrating to the GCP and losing teeth there, which could explain both shark taxon–E. petrosus offsets as well as the C. mantelli δ18Op differences between formations. Both C. mantelli (e.g., Shimada Reference Shimada1997a) and P. mortoni (Shimada et al. Reference Shimada, Everhart, Decker and Decker2010) have biogeographic distributions that include the WIS (see “Sampled Late Cretaceous Taxa”). If we consider the proximity of the WIS to the GCP and that each tooth represents weeks to months of an individual's life, then it is feasible that individuals migrated from lower δ18Osw waters of the WIS to higher δ18Osw waters of the GCP. Indeed, previously reported WIS δ18Osw values (−8‰ to −1‰) are consistent with the δ18Osw values estimated for our measured specimens (e.g., Coulson et al. Reference Coulson, Kohn and Barrick2011; Peterson et al. Reference Peterson, Tabor, Lohmann, Poulsen, Meyer, Carpenter, Erickson, Matsunaga, Smith and Sheldon2016; see “δ18O of Seawater”). Thus, given our understanding of shark biology, migration from marine waters with lower δ18Osw (likely the WIS) is a more likely explanation than more local δ18Osw variation driven by a local brackish habitat for the lower P. mortoni and C. mantelli δ18Op values. However, given tooth replacement rates, if migration from the WIS explains the lower δ18Op values, we also expect to find that some teeth from these organisms represent local GCP conditions in their δ18Op (i.e., δ18Op values similar to E. petrosus), but we do not (Fig. 3). Additionally, this model would require that lower WIS δ18Osw values were not associated with significantly brackish conditions, and this seems likely, given the abundance of marine taxa recovered from the WIS. Freshwater input to the WIS likely had drastically lower δ18O values (e.g., Fricke et al. Reference Fricke, Foreman and Sewall2010), so even relatively small freshwater volumes could strongly influence δ18Osw.
Temperature
Differences in tooth formation temperatures, rather than changes in δ18Osw, could explain the shark–E. petrosus offsets. We can estimate the required temperature difference to generate the magnitude and direction of δ18Op offsets at the time of tooth formation by holding the δ18Osw constant using equation (1). The offsets for C. mantelli (−1.1‰) and P. mortoni (−2.2‰) from E. petrosus in the Mooreville Chalk equate to approximately a 5.0°C and 9.9°C temperature increase, respectively, above ambient conditions in the GCP. The C. mantelli–E. petrosus offset in the Blufftown Formation (−3.3‰) equates to a 14.9°C temperature increase above local water habitat (Table 1). Temperature differences could be achieved by occupying different water depths, migration from different locations or water currents, or warmer body temperatures relative to surrounding water temperatures.
Water Depth and Thermal Gradients
Modern and fossil shark taxa occupy a range of depths in the water column, including benthic habitats where sea temperatures may be lower than surface waters, but these differences in depth are probably not sufficient to explain the δ18Op offsets between P. mortoni–E. petrosus and C. mantelli–E. petrosus. The GCP region was likely too shallow during the Late Cretaceous to have a substantial thermal gradient (see “Geologic Setting”). Furthermore, modern temperature–depth gradients in the Gulf of Mexico indicate no substantial thermal gradient in the upper 100 m (Forrest et al. Reference Forrest, Marcucci and Scott2005; Christie and Nagihara Reference Christie and Nagihara2016). Moreover, in most marine habitats, benthic environments are colder than the overlying surface waters, which would result in higher δ18Op values of organisms living at or near the seafloor. We observe significantly lower δ18Op values for P. mortoni and C. mantelli compared with E. petrosus values, indicating warmer, not cooler temperatures (Fig. 3). In addition, we do not observe a significant difference between S. texanus and E. petrosus in either formation, as expected based on morphological similarities between S. texanus and the modern analogue goblin shark (Mitsukurina owstoni) (Welton and Farish Reference Welton and Farish1993), a deep-water, benthopelagic shark still found in the Gulf of Mexico today (e.g., Parsons et al. Reference Parsons, Ingram and Havard2002). Thus, differences in δ18Op values due to habitat partitioning within the water column are not good explanations for the magnitude or the direction of the P. mortoni–E. petrosus and C. mantelli–E. petrosus offsets.
Migration from Warmer Water
Migration from warmer tropical waters could also explain the lower P. mortoni and C. mantelli δ18Op values, as both taxa are known from lower-latitude subtropical regions (see “Sampled Late Cretaceous Taxa”). A δ18Osw of −1‰ is commonly used for the global ocean in an “ice-free” world like that of the Cretaceous (Shackleton and Kennett Reference Shackleton and Kennett1975), but this value implies water temperatures of 16.6°C to 17.1°C for E. petrosus tooth formation (using equation 1), which is lower than expected for the GCP (Liu Reference Liu2009; Harrell et al. Reference Harrell, Perez-Huerta and Suarez2016). Harrell et al. (Reference Harrell, Perez-Huerta and Suarez2016) argued that the GCP had a higher δ18Osw (0‰) due to evaporative enrichment, from which they calculated a Enchodus sp. tooth formation temperature of 28.3°C, using the equation of Pucéat et al. (Reference Pucéat, Joachimski, Bouilloux, Monna, Bonin, Motreuil and Morinière2010). Using equation (1) and a δ18Osw of 0‰, we calculated water temperatures of 21.1°C to 21.6°C, which is more consistent with other temperature estimates for the GCP (Coulson et al. Reference Coulson, Kohn and Barrick2011; Peterson et al. Reference Peterson, Tabor, Lohmann, Poulsen, Meyer, Carpenter, Erickson, Matsunaga, Smith and Sheldon2016). Pucéat et al. (Reference Pucéat, Lécuyer, Donnadieu, Naveau, Cappetta, Ramstein, Huber and Kriwet2007) calculated sea-surface temperatures of up to 30°C for latitudes of 10–15°N using the δ18Op from bony fish (δ18Osw of −1‰ and the equation of Kolodny et al. [Reference Kolodny, Luz and Navon1983]). Thus, there is likely to be an approximately 9°C temperature difference (equivalent to a −2‰ δ18Op offset from E. petrosus) from the subtropical GCP to the tropical region. Based on this approximate latitudinal range of temperatures and estimated temperature offsets from shark δ18Op (see “Temperature”), migration from warmer lower-latitude waters could explain the C. mantelli–E. petrosus (−1.1‰) and P. mortoni–E. petrosus (−2.2‰) offsets in the Mooreville Chalk but is likely insufficient to fully explain the C. mantelli–E. petrosus (−3.3‰) offset in the Blufftown Formation (Table 1).
Although migration from warmer tropical settings could explain the observed δ18Op offsets, individuals may not have needed to migrate farther than the Western Atlantic to find waters warmer than those of the GCP. The presence of a warm-water paleo–Gulf Stream in the late Campanian to Maastrichtian has been previously proposed (Watkins and Self-Trail Reference Watkins and Self-Trail2005) and may have been enhanced due to major ocean circulation changes associated with the formation of deep water in low and high latitudes (Linnert and Mutterlose Reference Linnert and Mutterlose2009). Exploitation of warm-water ocean currents such as the Gulf Stream have been observed in the modern shark C. carcharias (e.g., Gaube et al. Reference Gaube, Braun, Lawson, McGillicuddy, Penna, Skomal, Fischer and Thorrold2018), where warm, nutrient-rich currents not only provide access to prey but also reduce the metabolic demands of thermoregulation. The Late Cretaceous C. mantelli may have exploited the paleo–Gulf Stream in a similar way, but this model seems less likely for durophagous P. mantelli that would likely have remained in shallow-marine settings where there was an abundance of hard-shelled macroinvertebrate prey. Additionally, we would expect to find that at least some of the teeth from these organisms record isotopic values consistent with local conditions.
Body Temperature
Higher temperatures during tooth formation may also be driven by increased internal body temperatures (endothermy) of the sharks above ambient conditions. Most sharks are poikilothermic, but all modern species in the Lamnidae family (e.g., C. carcharias and I. oxyrinchus) and common thresher shark (Alopias vulpinus, Alopiidae: Lamniformes) maintain core body temperatures 3°C to 25°C above ambient temperatures (Carey et al. Reference Carey, Kanwisher, Brazier, Gabrielson, Casey and Pratt1982; Goldman Reference Goldman1997; Bernal et al. Reference Bernal, Sepulveda and Graham2001; Carlson et al. Reference Carlson, Goldman and Lowe2004; Bernal and Sepulveda Reference Bernal and Sepulveda2005) using a vascular countercurrent heat exchange with aerobic swimming muscles in the shark's core (i.e., regional endothermy, or mesothermy as defined by Ferrón [Reference Ferrón2017]). There is paleontological evidence (e.g., phylogenies, estimated swimming speeds, and energetic budgets) that suggests Late Cretaceous otodontids (e.g., Cretalamna) and cretoxyrhinids (e.g., Cretoxyrhina) were mesothermic (e.g., Ferrón Reference Ferrón2017; Pimiento et al. Reference Pimiento, Cantalapiedra, Shimada, Field and Smaers2019). Notably, we do not observe statistically significant offsets between C. appendiculata–E. petrosus in either formation (Table 1), as expected based on previous studies. However, the magnitude of temperature difference in the shark's mouth over ambient temperatures, and therefore recorded by enameloid, is unclear, as body heat diffuses from the core muscles in the anterior and posterior directions (Carey and Teal Reference Carey and Teal1969; Carey et al. Reference Carey, Kanwisher, Brazier, Gabrielson, Casey and Pratt1982). Recent Otodus megalodon enameloid δ18Op values yielded body temperatures 7–8°C warmer than ambient conditions (Griffiths et al. Reference Griffiths, Eagle, Kim, Flores, Becker, Maish IV and Traylor2023), providing quantitative evidence for the possible magnitude of mesothermy in fossil otodontid taxa. Here, an 8°C increase from mesothermy would result in an approximately −1.8‰ offset from co-occurring E. petrosus. Thus, mesothermy is consistent in magnitude and direction with the observed P. mortoni and C. mantelli offsets in the Mooreville Chalk but may be insufficient to fully explain the magnitude of the C. mantelli offset in the Blufftown Formation.
Ptychodus mortoni was a gigantic shark (Shimada et al. Reference Shimada, Everhart, Decker and Decker2010; Shimada Reference Shimada2012; i.e., total body lengths greater than 6 m as defined by Pimiento et al. [Reference Pimiento, Cantalapiedra, Shimada, Field and Smaers2019] and Shimada et al. [Reference Shimada, Becker and Griffiths2021]), which may be sufficient to explain increased body temperature through mesothermy. Pimiento et al. (Reference Pimiento, Cantalapiedra, Shimada, Field and Smaers2019) proposed mesothermy and filter feeding (i.e., dietary exploitation) as the two primary pathways to gigantism in sharks and suggested a single origin of shark mesothermy in Cretaceous lamniforms. Due to unresolved phylogenies, those authors did not include C. mantelli or P. mortoni in their analyses but noted that future inclusion of those species could alter conclusions on the evolution of mesothermy in sharks. Indeed, our P. mortoni δ18Op values in the Mooreville Chalk (19.1 ± 0.4‰; Table 1) overlap with previously reported δ18Op values for the endothermic mosasaur Platecarpus in the Mooreville Chalk (19.5 ± 0.2‰; Harrell et al. Reference Harrell, Perez-Huerta and Suarez2016). Ptychodus mortoni could have passively retained heat via gigantothermy (i.e., low surface area-to-body volume ratio that allows for passive heat retention; e.g., Paladino et al. Reference Paladino, O'Connor and Spotila1990; Harrell et al. Reference Harrell, Perez-Huerta and Suarez2016; Ferrón Reference Ferrón2017) as an alternative to active heating (i.e., mesothermy). If P. mortoni was gigantic because its specialized durophagy allowed it to efficiently exploit its environment, similar to extant filter feeders, then gigantothermy may be the result of its large size. While our dataset is insufficient to address the question of active versus passive heating, some form of thermoregulation is a biologically plausible explanation for lower P. mortoni δ18Op values.
Mesothermy can also explain the C. mantelli–E. petrosus offset in the Mooreville Chalk, but mesothermy alone is probably insufficient to explain the C. mantelli–E. petrosus offset in the Blufftown Formation (−1.1‰ and −3.3‰, respectively; Table 1, Supplementary Table 1). Cretaceous cretoxyrhinids and otodontids are likely to be phylogenetically close to modern mesothermic lamnid sharks (e.g., Cappetta Reference Cappetta1987, Reference Cappetta2012; Siverson et al. Reference Siverson, Lindgren, Newbrey, Cederstrom and Cook2015; Ferrón Reference Ferrón2017) and have been suggested to be mesothermic (Ferrón Reference Ferrón2017). Given associated uncertainty, the C. mantelli temperature increase of 5.0°C in the Mooreville Chalk overlaps with the estimated up to 8°C body temperature increase in mesothermic sharks. Indeed, the fusiform body shape and gigantic body size (e.g., Shimada Reference Shimada1997b), increased swimming speed (e.g., Shimada Reference Shimada1997b; Amalfitano et al. Reference Amalfitano, Giusberti, Fornaciari, Vecchia, Luciani, Kriwet and Carnevale2019), large latitudinal range (e.g., Case and Baird Reference Case and Baird1990; Siverson Reference Siverson1992), and inferred high trophic level (Shimada Reference Shimada1997a) all support a possible mesothermic interpretation of our C. mantelli δ18Op data. However, the 14.9°C temperature increase estimated for C. mantelli in the Blufftown Formation is nearly 7°C warmer than expected for mesothermy alone. Mesothermy in addition to other influence(s) is a more likely explanation than mesothermy alone to explain both C. mantelli offsets.
Preferred Hypotheses
Ptychodus mortoni
We consider the higher body temperature hypothesis to be the most likely explanation for the anomalous P. mortoni δ18Op values in the Mooreville Chalk, although we cannot ascertain whether a higher body temperature was a cause or a consequence of their gigantic size. If P. mortoni was indeed mesothermic, it would mark a second possible occurrence of mesothermy evolving in Late Cretaceous sharks. Future studies could compare δ18Op or estimated body temperatures as a function of total body length for different P. mortoni specimens to investigate mesothermy versus gigantothermy. Other explanations explored earlier are consistent with our isotopic results, but we consider them less consistent with other paleontological and isotopic evidence.
Cretoxyrhina mantelli
We propose that the most likely explanation for the C. mantelli–E. petrosus offsets are the result of a combination of migration and mesothermy, because the very low δ18Op values for this taxon in the Blufftown Formation are too low for either explanation alone to be plausible. The potential phylogenetic relationship between C. mantelli, the mesothermic O. megalodon, and modern mesothermic Lamnidae sharks (e.g., Cappetta Reference Cappetta1987, Reference Cappetta2012; Siverson et al. Reference Siverson, Lindgren, Newbrey, Cederstrom and Cook2015; Ferrón Reference Ferrón2017) along with body morphology (e.g., Shimada Reference Shimada1997a,Reference Shimadab) and function (Ferrón Reference Ferrón2017), and a global biogeographic range all support C. mantelli being potentially migratory and mesothermic. One likely but equivocal explanation is that the approximately 1‰ offset in both formations is driven by endothermy, and the larger offset in the Blufftown Formation also reflects exploitation by C. mantelli of nearby warmer water masses, such a paleo–Gulf Stream. Future studies should compare C. mantelli δ18Op values with co-occurring endothermic and poikilothermic taxa, particularly in cooler, high-latitude localities, to confirm mesothermy and estimate the degree of warming.
Conclusions
Most of the fossil shark δ18Op values in this study are consistent with Enchodus petrosus δ18Op values, indicating similar or overlapping habitats of sharks and the predatory bony fish that we assume was poikilothermic. However, measurements of multiple teeth from a single Squalicorax kaupi individual indicate possible migration from cooler, higher-latitude waters or waters with a higher δ18Osw. We also observe statistically significant negative differences between Ptychodus mortoni and E. petrosus in the Mooreville Chalk and Cretoxyrhina mantelli and E. petrosus in both the Mooreville Chalk and the Blufftown Formation. The significantly different P. mortoni δ18Op values are best explained by increased body temperature, either active (mesothermy) or passive (gigantothermy). Low C. mantelli δ18Op values are best explained by a combination of migration (either from warm, low-latitude waters, the warm currents of the paleo–Gulf Stream, or low-δ18Osw waters in the WIS) and mesothermy. If P. mortoni was mesothermic, then it would mark a second evolution of mesothermy in Late Cretaceous sharks that is potentially outside the lamniform sharks. In future studies, similar approaches including comparisons with poikilothermic fishes should be applied to studying the potential degree of mesothermy in C. mantelli, particularly in higher-latitude, lower-temperature paleogeographic settings, where a clearer mesothermic signal might be observed.
Acknowledgments
We thank A. Klompmaker and the Alabama Museum of Natural History, as well as R. Wilhite and D. Laurencio and the Auburn University Museum of Natural History, for allowing study and sampling of specimens from their collections. We thank the Alabama Stable Isotope Laboratory for allowing use of their equipment for sampling. We thank C. Suarez and E. D. Pollock at the University of Arkansas Stable Isotope Laboratory for their help with sample analysis. This study was funded by the Geological Society of America, the Palaeontological Society, the University of Alabama Graduate School, and the Department of Geological Sciences at the University of Alabama. We thank two anonymous reviewers for their feedback, which significantly improved the article.
Competing Interests
The authors declare that they have no competing interests.
Data Availability Statement
All data and supplementary information are available on Dryad at https://doi.org/10.5061/dryad.nvx0k6f00 and on Zenodo at https://doi.org/10.5281/zenodo.11068191.


 Open access