

Over the last decade, reducing dietary protein has been of great interest to the poultry industry. Lowering crude protein in broiler feed can decrease N emissions and hence diminish the negative impact on the environment(Reference Hofmann, Siegert and Kenéz1). Additionally, protein is one of the most expensive components of poultry diets, especially in Europe, and reducing it is therefore an effective way to lower production costs providing that the animal’s performance is not negatively affected(Reference Hilliar, Huyen and Girish2,Reference Ndazigaruye, Kim and Kang3) . However, not only the animal’s own performance should be validated but protein content and protein source in the maternal diet are also important when considering pre- and postnatal development(Reference Jahan-Mihan, Rodriguez and Christie4). Maternal programming during early life developmental stages has been shown to affect the progeny in the long term. Plenty of research focuses on the influence of maternal dietary changes during gestation and/or lactation on the health status and performance of the progeny. In broiler chickens, maternal diets have been seen to affect offspring’s body weight and carcass yield(Reference Moraes, Pishnamazi and Wenger5), growth(Reference Lv, Fan and Song6–Reference Zhu, Li and Lu8), lipid metabolism(Reference Lv, Fan and Song6,Reference Beckford, Howard and Das9,Reference Hu, Sun and Hu10) , feeding behaviour and neophobic attitude(Reference Aiqueperse, Calandreau and Bertin11,Reference de Haas, Calandreau and Baéza12) . In the current study, a maternal diet based on reduced crude protein levels in female broiler breeder chickens is investigated. A two-by-two experimental design, in which female broiler breeders as well as their progeny received a reduced balanced protein (RP) diet or an isoenergetic control regime, enables to investigate a match (similar diet) or mismatch (dissimilar diet) between mother and offspring nutritional environment. A mismatch is known to result in the suboptimal development of the offspring(Reference Van der Waaij, van den Brand and van Arendonk13). The question raised here was if chickens, when fed a reduced protein diet while descending from mothers fed a lower amount of protein (match), could have altered their liver metabolism in such a way that their performance increased compared with those reared on a reduced protein diet but born from mothers that received a normal amount of protein (mismatch). Along the same reasoning, it was investigated if there was a difference in control-fed animals, descending from control-fed mothers (match) rather than reduced protein-fed mothers (mismatch).
Materials and methods
Animals
In this project, the maternal influence of a low-protein diet was investigated in broiler breeder chickens. To this extent, a control (C) or RP diet was fed to two generations of chickens: while the F0 generation consisted of two groups (C and RP), the F1 generation contained four groups in total, C/C, C/RP, RP/C and RP/RP, with letters indicating the breeder diet from 3 weeks of age till slaughtering in, respectively, the F0 and F1 generation. More information on growth and reproductive performance of the C v. RP birds of the F0 generation can be found in Lesuisse et al. (Reference Lesuisse, Li and Schallier14). For the F1 generation, more details on their performance parameters and that of their offspring have also been described earlier(Reference Lesuisse, Li and Schallier15,Reference Lesuisse, Schallier and Li16) . In addition, Lesuisse et al. (Reference Lesuisse, Li and Schallier15) give a detailed description of the dietary treatments administered to the chickens discussed in this article. In short, RP-fed chickens received a feed with a 25 % reduction in dietary crude protein and amino acids. Feed allocations were however weekly adapted to maintain a similar body weight for all groups throughout the entire experiment(17). In the rearing period, at 10 weeks of age, this resulted in a 13 % higher feed allocation on average and consequently, in a 15 % reduction in daily protein intake in the RP-fed chickens compared with the C-fed chickens when grown to the same body weight. In the laying period, there was an average net protein intake reduction of 6 % in the RP/C, of 15 % in C/RP and of 17 % in RP/RP chickens compared with C/C chickens(Reference Lesuisse, Li and Schallier15). All animal procedures were approved by the Animal Ethics Committee of the KU Leuven (accession no. P187/2013).
Sampling and data collection
Twenty female chickens of the F1 generation, five per dietary group, were euthanised by electrical stunning prior to decapitation before feeding at 44 weeks of age. Of these chickens, as described previously, several body composition parameters such as total weight and weight of liver, breast muscle, adipose fat pad and pancreas were measured(Reference Lesuisse, Li and Schallier15). The proportional tissue weights were calculated by dividing the absolute tissue weight by the liver weight of the corresponding breeder. Liver samples of all chickens were collected, snap-frozen in liquid N2 and stored at −80°C until further RNA processing. Five animals per dietary group were chosen, which surmounts to the number seen in other liver RNA-sequencing studies to give significant results(Reference Willson, Forder and Tearle18,Reference Khalique, Zeng and Wang19) .
Statistics on performance parameters
Body composition parameters were analysed with the statistical software SAS University (SAS Institute Inc.) using a general linear model (GLM) with maternal dietary treatment of the F0 generation, dietary treatment of the F1 generation and their interaction as classification variables. When there was a significant effect of any of the dietary treatments or their interaction, means were further compared by a post hoc Tukey’s test. Data are presented as mean values with their standard errors in online Supplementary Table S1. For each result, the significance level was set at P < 0·05.
RNA extraction, library construction and RNA-sequencing processing
Total RNA was extracted from liver samples of the twenty female F1 chickens using TRIzol® Reagent (Life Technologies) according to the manufacturer’s protocol. RNA concentrations were quantified using a NanoDrop ND-1000 spectrophotometer (Nano-Drop Technologies), and quality was assessed using an Agilent Bioanalyzer 2100 (Agilent Technologies, Inc.). RIN values were at least 8·5 before further processing. Libraries were constructed using the Illumina TruSeq stranded mRNA kit. RNA-sequencing was performed at the Genomics Core Leuven, Belgium. One hundred twenty-five bp paired-end sequencing was performed using the Illumina HiSeq™ 2500 platform. Reads were aligned to the Gallus gallus-5.0 reference genome, Ensembl release 86. Quality of the reads was checked using FASTQC(Reference Andrews20), and mapping was done using TopHat(Reference Trapnell, Roberts and Goff21). All RNA-sequencing FASTQ files were submitted to the European Nucleotide Archive database under accession number PRJEB35156.
RNA-sequencing differential expression analyses
The R package DESeq2 was used to investigate differences between experimental groups(Reference Love, Huber and Anders22). Principal component analyses (PCA) were performed using the plotPCA function within the DESeq2 package. Subsequently, low reads were filtered out so that the remaining data sets contained solely genes with at least ten counts in 90 % of the samples, which resulted in 14 017 genes. To find differentially expressed (DE) genes, the Benjamini–Hochberg correction for multiple testing was taken into account (false discovery rate < 0·05). To analyse the differences in function of the genes that were DE, data were corrected for body weight and several comparisons were made. This correction for body weight was done as we aimed to maintain the same body weight in all groups. However, near the end of the experiment, significant differences in body weight were seen due to diet, which prompted the decision to correct the data accordingly. First, we compared groups coming from a similar F0 feed, but a different F1 feed (C/C v. C/RP and RP/C v. RP/RP). Second, analyses were performed keeping the F1 feed constant and changing the F0 feed (C/C v. RP/C and C/RP v. RP/RP). Venny was used to visualise the differences in numbers of DE genes between the different comparisons(Reference Oliveros23). Gene function pathway analyses were performed using the gene ontology (GO) tool g:profiler(Reference Reimand, Kull and Peterson24) with the Ensembl gene ID for Gallus gallus as input and all other options as default. GO was assessed at the molecular function, biological process and cellular component level, and for biological pathways, the Kyoto Encyclopedia of Genes and Genomes (KEGG) and Reactome were examined.
Weighted gene co-expression network analysis
For the comparison of C/RP v. RP/RP, a weighted gene co-expression network analysis (WGCNA) was performed to cluster highly correlated genes and to find modules whose expression was significantly correlated with these two groups(Reference Langfelder and Horvath25). For the correlations, C/RP was set to 0 and RP/RP was set to 1. Modules were forced to have a minimum of 250 genes and were considered interesting when the nominal P value for their correlation with the treatment was P < 0·001. Gene function pathway analyses were also performed on the significant modules as described above.
Results
Body composition
Even though it was attempted to keep chickens at the same body weight during the entire experiment, this parameter seemed to be affected by both the F0 and F1 dietary treatment at 44 weeks of age, without interaction effect (online Supplementary Table S1). The same could be observed for proportional breast muscle and proportional abdominal fat pad (online Supplementary Table S1). The proportional liver weight was significantly higher in chickens receiving the RP diet compared with those that received the C diet (P = 0·01) (online Supplementary Table S1). This corresponds to the findings of Lesuisse et al. (Reference Lesuisse, Li and Schallier15), where the same differences in proportional weight were observed when five additional animals per group were measured to the five animals in this project.
Differential expression
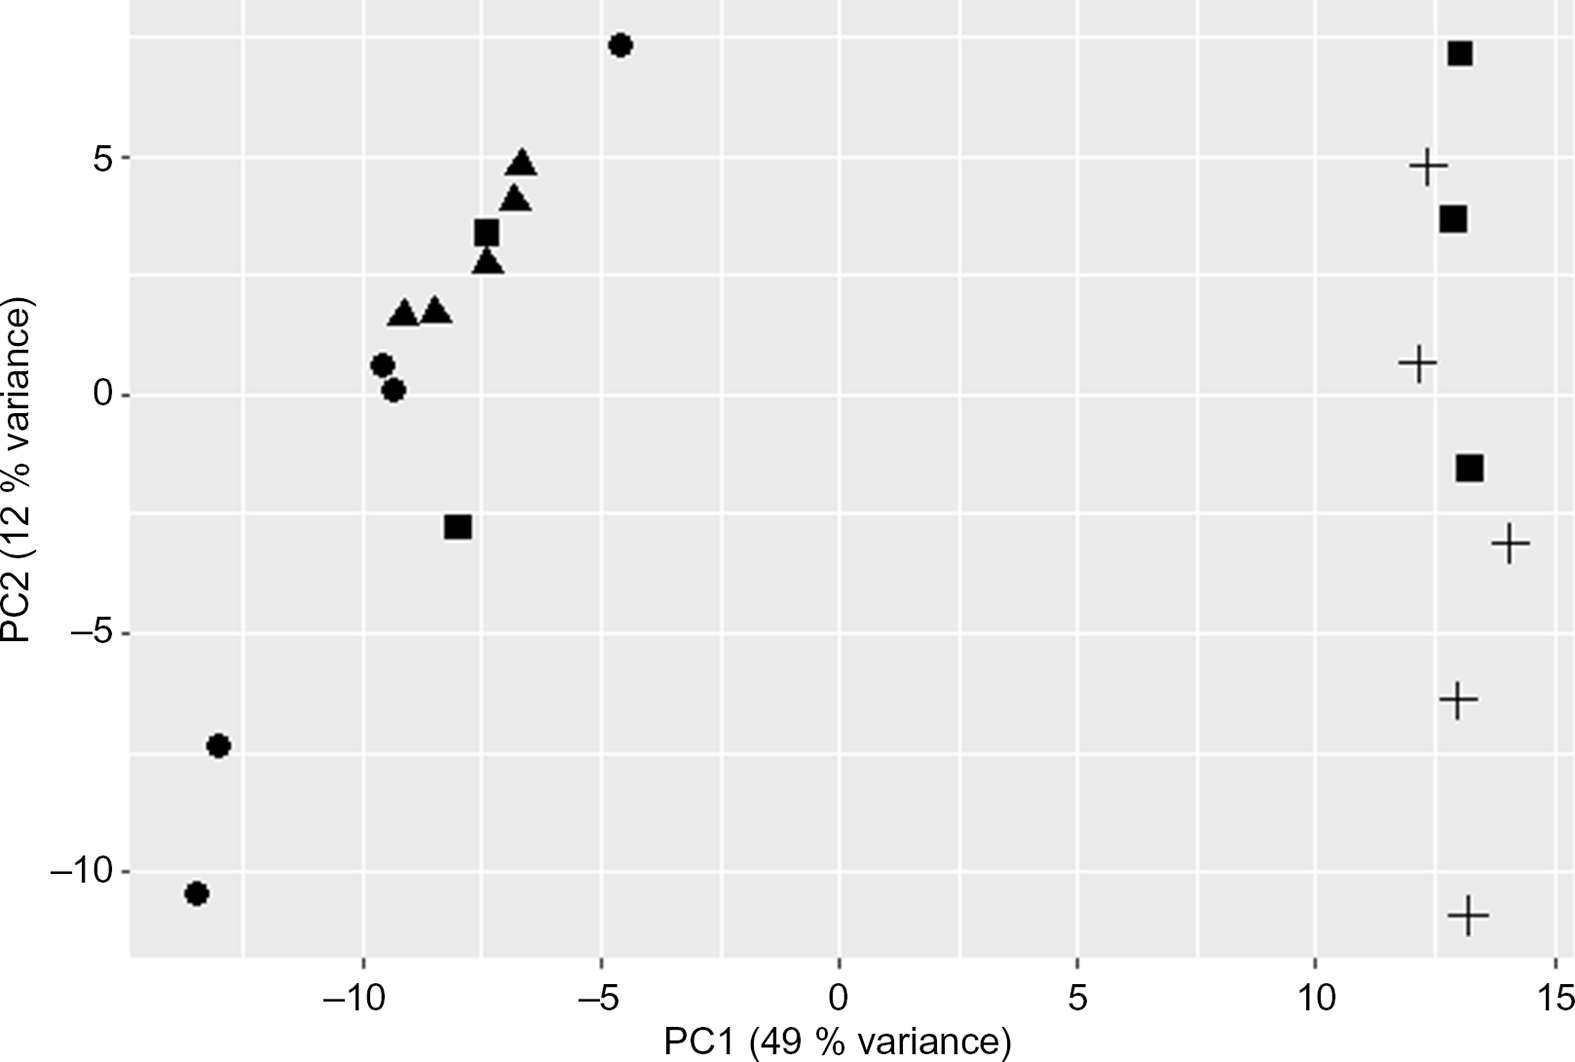
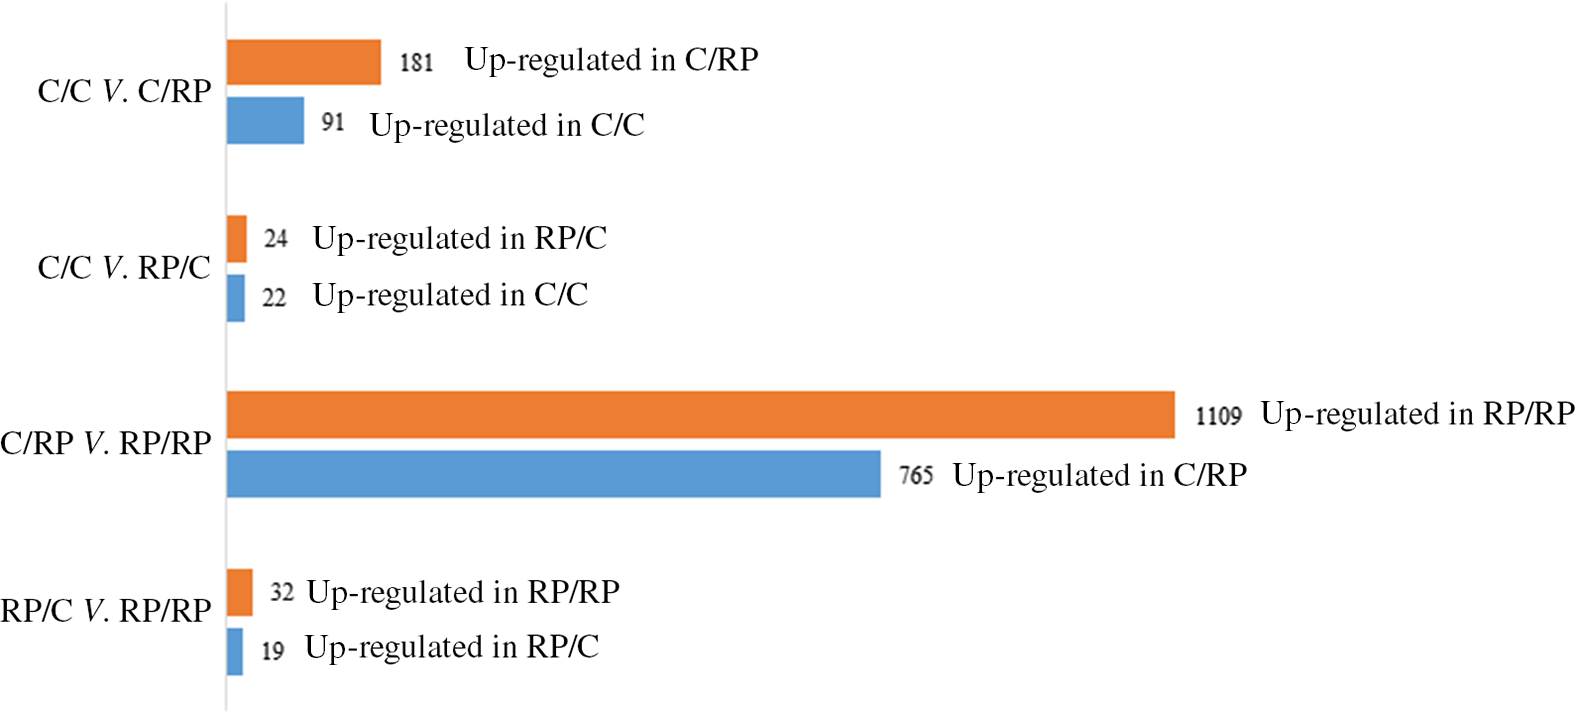
The PCA plot revealed 49 % of variance explained on the x-axis which separated the four groups mostly according to maternal diet (Fig. 1). To analyse the transcriptomic difference between groups of interest, several comparisons were made. First, differences were examined between groups with the same F0 feed, but a different F1 feed (groups C/C v. C/RP and groups RP/C v. RP/RP) (Fig. 2). This resulted in ninety-one up-regulated genes and 181 down-regulated genes in C/C compared with C/RP and nineteen up-regulated genes and thirty-two down-regulated genes in RP/C compared with the RP/RP group. When comparing the DE in these respective comparisons, three genes were found in common (Fig. 3, Table 1). Second, groups reared on the same F1 feed, but with a different maternal F0 feed were analysed (groups C/C v. RP/C and groups C/RP v. RP/RP) (Fig. 2). This resulted in twenty-two up-regulated genes and twenty-four down-regulated genes in C/C compared with RP/C and 765 up-regulated genes and 1109 down-regulated genes in C/RP compared with the RP/RP group. The intersection between these two comparisons comprises six genes (Fig. 3, Table 1). Looking at all DE genes, 87·1 % of them were found in comparison between C/RP and RP/RP, which is reflected by the division seen by the PCA plot. Two RP/C samples were clustered with the C/RP and C/C samples in the PCA, and analyses were repeated without these two RP/C samples. This way, more DE genes were found when comparing C/C with RP/C, while less DE genes were found in the RP/C v. RP/RP comparison, which agrees with the PCA plot. Indeed, a total of 422 genes were up-regulated in the C/C group when compared with the RP/C group, and forty-eight genes were up-regulated in the RP/C when compared with the C/C group. When comparing the RP/C group with the RP/RP group, only four genes were up-regulated in the RP/C group, as opposed to eight up-regulated genes in the RP/RP group.
Principal component (PC) analysis plot of the liver RNA-sequencing data. Only the first two PC are shown. C/C (![]() ), C/RP (
), C/RP (![]() ), RP/C (
), RP/C (![]() ) and RP/RP (
) and RP/RP (![]() ), with C for control diet and RP for reduced balance protein diet for the diet in, respectively, the F0 and F1 generation. Letters indicating the breeder feed in, respectively, the F0 and F1 generation. Dots represent individuals.
), with C for control diet and RP for reduced balance protein diet for the diet in, respectively, the F0 and F1 generation. Letters indicating the breeder feed in, respectively, the F0 and F1 generation. Dots represent individuals.
Number of differentially expressed (DE) genes when comparing the C/C with C/RP group, the C/C with RP/C group, the C/RP with RP/RP group and the RP/C with RP/RP group. The number of DE genes is split into those up- and down-regulated between the groups compared. Letters indicating the breeder feed in, respectively, the F0 and F1 generation. Benjamini–Hochberg correction for multiple testing was set to false discovery rate < 0·05. C, control diet; RP, reduced balanced protein diet.
Venn diagram of the number of differentially expressed (DE) genes within different comparisons. Comparisons of interest were those between the groups of which the F0 diet was kept constant, but the F1 diet changed (C/C v. C/RP and RP/C v. RP/RP) or vice versa (C/C v. RP/C and C/RP v. RP/RP). The percentage is given as the percentage of all DE genes. Letters indicating the breeder feed in, respectively, the F0 and F1 generation. Benjamini–Hochberg correction for multiple testing was set to false discovery rate (FDR) < 0·05. C, control diet; RP, reduced balanced protein diet.

Overview of genes that were common differentially expressed (DE) genes when comparing C/C v. C/RP and RP/C v. RP/RP, which reflects genes whose expression is affected by giving a direct reduced protein diet, and genes that were common DE genes when comparing C/C v. RP/C and C/RP v. RP/RP, which reflects genes whose expression is affected by giving a maternal reduced protein diet*

C, control diet; RP, reduced balanced protein diet; TENM2, teneurin transmembrane protein 2; OAT, ornithine aminotransferase; CD82, cluster of differentiation 82; PTMA, prothymosin α.
* ENSEMBL gene ID and gene symbols (when available) are given, as well as their binary logarithmic fold change (log2FC) difference and the adjusted P values for the comparisons of interest.
Weighted gene co-expression network analysis
Looking at both PCA and DE analyses, the largest difference between groups was found between the C/RP and RP/RP chickens. Therefore, additionally, WGCNA was performed on this comparison to identify the hub genes driving this difference. One module was significantly correlated with the groups when coded as 0 and 1 with a correlation coefficient of −0·88, at a nominal P value of <0·001. This module contained 1495 genes, whose ENSEMBL gene ID, gene significance and module membership can be found in online Supplementary Table S2. Hub genes of the module are those with a high gene significance and module membership value in this table with the gene encoding for methyltransferase-like 21C (METTL21C) as a top network hub gene.
Functional analyses
When looking at the direct influence of a protein diet when the maternal diet was a control diet, GO analysis by comparing the C/C with the C/RP group revealed an up-regulation of the α-amino acid metabolic processes and transaminase activity in the control group (C/C), while for the chickens that received the RP diet, the fatty acid metabolism was up-regulated (C/RP). When comparing the two different F1 diets in chickens of which the maternal diet was the RP diet, the control diet again showed an up-regulation of transaminase activity (RP/C), while the RP diet now triggered the glucose metabolism (RP/RP). The gene OAT, which translates into ornithine aminotransferase, was up-regulated in both the C/C and RP/C groups when compared with C/RP and RP/RP, respectively. The expression of this gene was found to be 2·2-fold up-regulated in the C/C group compared with the C/RP group and more than 2·5-fold up-regulated in the RP/C group compared with the RP/RP group. One of the few up-regulated genes C/RP and RP/RP held in common compared with the C/C and RP/C groups, respectively, was the gene encoding for teneurin transmembrane protein 2 (TENM2). The up-regulated fatty acid metabolism in the C/RP group was reflected by an increase in the expression of fatty acid desaturases encoded by the fatty acid desaturase 1 gene (FADS1) and the fatty acid desaturase 2 gene (FADS2) and elongases such as encoded by the elongation of very long-chain fatty acids protein 2 gene (ELOVL2). Elevated levels of the phosphofructokinase gene (PFKL), 6-phosphofructo-2-kinase/fructose-2,6-biphospatase 4 (PFKFB4) and fructose-biphosphate aldolase C (ALDOC) were seen in the RP/RP group compared with the RP/C group, which points to an activated glucose metabolism. The GO term differences in the group comparisons remained unaltered when the analysis was done without the two RP/C samples that did not cluster with the other RP F0 diet samples, with again an up-regulation of transaminase activity in the RP/C group and an up-regulation of protein arginine methyltransferase in the RP/RP group, which indeed has been described to play a role in glucose metabolism(Reference Bayen, Saini and Gaur26).
Comparing chickens that received the RP diet but were hatched from hens with a different F0 diet exposed (C/RP v. RP/RP) a nucleocytoplasmic carrier activity elicited by the control maternal diet, while the maternal RP diet showed an up-regulation of terms such as ‘negative regulation of gene expression’. No informative GO terms appeared to be enriched between the chickens that received the control diet but were hatched from hens with a different diet, not with nor without the two RP/C samples that clustered differently. Raising the threshold for the false discovery rate to 0·10 did not affect the GO terms either, not with all samples, or without the two RP/C outliers. An overview of the major GO annotations in these comparisons and their enrichment scores is shown in Fig. 4. Genes in the significant module that correlated with the C/RP v. RP/RP groups were also analysed for GO annotation and ‘phosphotyrosine residue binding’ and ‘protein phosphorylated amino acid binding’ came out as the top GO terms for molecular function. The term ‘autophagy’ came out as a significant KEGG pathway related to this module. A full overview with all genes belonging to the respective GO terms can be found in online Supplementary Table S3.
Gene ontology (GO) analyses results of the contrast between the C/C and C/RP groups (a), the C/C and RP/C groups (b), the C/RP and RP/RP groups (c) and the RP/C with RP/RP groups (d). The enrichment score reflected in this figure is the –log10 of the adjusted P value of the enrichment analysis. Letters indicating the breeder feed in, respectively, the F0 and F1 generation. C, control diet; RP, reduced balanced protein diet. ![]() , C/C v.
, C/C v. ![]() , C/RP;
, C/RP; ![]() , C/C v.
, C/C v. ![]() , RP/C;
, RP/C; ![]() , C/RP v.
, C/RP v. ![]() , RP/RP;
, RP/RP; ![]() , RP/C v.
, RP/C v. ![]() , RP/RP.
, RP/RP.

Discussion
The objective of this study was to examine if maternal programming occurred in the liver of breeder broiler chickens triggered by a RP diet. Additionally, direct effects of such a diet on liver metabolism were assessed. In the F0 generation, female chickens were fed a C or RP diet and the progeny was subjected to the same two diets, resulting in four experimental groups, C/C, C/RP, RP/C and RP/RP. Only female chickens were considered in this study, and feed allocation was adapted weekly to maintain a similar body weight. However, when we look at 44 weeks of age, among the five chickens we sampled per group, body weights differed with regard to both the F0 and F1 diet, but without interaction effect. The chickens that received a C/RP diet had a significantly higher body weight than the RP/C chickens, with the C/C and RP/RP chickens at intermediate weight. Chickens in this experiment were a subset of those described by Lesuisse et al. (Reference Lesuisse, Li and Schallier15), and the results for proportional breast muscle weight, proportional abdominal fat weight and proportional liver weight did not differ much from those earlier described. In general, it is the F1 feed that influenced these body composition parameters the most. The proportional breast muscle weight was higher in the C/C chickens when compared with the C/RP and RP/RP chickens, with the RP/C chickens as intermediate. In addition, C/RP and RP/RP chickens had more abdominal fat compared with C/C and RP/C chickens, and proportional liver weights were the highest in the C/RP chickens and were significantly higher when compared with the RP/C chickens. These changes are in accordance with other studies where low- and high-protein diets were administered while maintaining similar body weights in broiler breeders(Reference van Emous, Kwakkel and van Krimpen27,Reference van Emous, Kwakkel and van Krimpen28) .
The liver transcriptome revealed interesting differences when looking at specific group comparisons and examining the genes that were up- and down-regulated between these groups of chickens. GO analyses showed that a direct effect of a control diet (C/C v. C/RP and RP/C v. RP/RP) evoked the molecular function term for transaminase activity, independent of maternal diet. One of the three genes in the intersection of DE genes that appeared in these comparisons was the OAT gene (Table 1). Ornithine is involved in the urea cycle and gets converted by the OAT enzyme into glutamate and proline(Reference Ginguay, Cynober and Curis29,Reference Sivashanmugam, Jaidev and Umashankar30) . In the liver, it has previously been described that the enzymatic activity of OAT proportionally increases with dietary protein levels. This is accomplished by an increase in the number of hepatocytes expressing OAT in chickens fed a high-protein diet as compared with those fed a low-protein diet(Reference Matsuzawa, Kobayashi and Tashiro31). In a reduced protein diet, it is seen that N excretion decreases and N retention increases(Reference Lesuisse, Schallier and Li16,Reference Gou, Jiang and Jiang32) . The rise of OAT could potentially help with the detoxification of the ammonia excess induced in diets with higher protein levels(Reference Boon, Geerts and Jonker33).
The feed formulations for all groups were isoenergetic, and the fat percentage was similar in the C and RP diets, but chickens in the RP groups were fed proportionally more to maintain a similar body weight(Reference Lesuisse, Li and Schallier15). To keep the diets isoenergetic, protein was substituted by carbohydrates. Combined with the fact that the RP groups were allocated more feed, the RP groups ingested more carbohydrates than the C groups. However, the feed of the F0 generation seemed to be the determining factor on which the metabolic pathway was mainly triggered. For animals descending from the control F0 hens, a RP diet up-regulated the fatty acid metabolism pathway significantly. FADS1, FADS2 and ELOVL2 play a central key in the biosynthesis of long-chain n-3 and n-6 PUFA(Reference Jing, Gakhar and Gibson34). FADS1 and FADS2 are necessary to introduce cis double bonds in fatty acids, and ELOVL2 catalyses carbon chain extensions. They convert essential fatty acids such as linoleic acid and α-linolenic acid into arachidonic acid, EPA and DHA(Reference Sun, Zou and Wang35). FADS1, FADS2 and ELOVL2 were highly expressed and at least 2-fold up-regulated in the C/RP group compared with the C/C group, but this effect was not observed between F1 animals on a RP diet v. C diet descending from F0 hens on a RP diet. Instead, in the liver of animals on a RP diet v. C diet, descending from the RP F0 hens (RP/RP v. RP/C), an up-regulation of fructose and mannose metabolism was seen, with elevated levels of PFKL, PFKFB4 and ALDOC. This differential expression due to the RP diet was not observed for animals descending from the control F0 hens (C/RP v. C/C). These genes are key players in the glycolysis and point to more glycogen breakdown as a result of a higher demand of energy(Reference Kuo, McQueen and Chen36,Reference Webb, Dosey and Wittmann37) . One of the genes, TENM2, found in common between C/C v. C/RP and RP/C v. RP/RP comparison, and thus important for a direct reduced protein diet effect regardless of maternal diet, was up-regulated in both reduced protein groups (Table 1). Interestingly, TENM2 has been described to be involved in adipogenic differentiation(Reference Tews, Fromme and Keuper38). An up-regulation of TENM2 in the RP/RP and C/RP groups, when compared with the RP/C and C/C groups, respectively, could be the result of a higher uptake of carbohydrates and fats in the groups reared on a RP diet, but were allocated more feed.
It is very interesting that the greatest number of DE genes in our comparisons was caused by the maternal diet when chickens were fed an RP diet, that is, between the C/RP and RP/RP groups. This was also shown by the PCA plot that completely separated the C/RP and RP/RP groups. GO analysis of these DE genes exhibited the negative regulation of cellular biosynthetic processes as the highest biological process GO term, up-regulated in the RP/RP chickens when compared with the C/RP chickens. It seems that the RP/RP animals are having a lower amount of genes expressed and could therefore potentially show a lower metabolism rate than the C/RP animals. Nevertheless, T3 and T4 concentrations in the plasma were not found to be different between these two groups(Reference Lesuisse, Li and Schallier15). However, in line with a decreased metabolism, Li et al. (Reference Li, Hu and Lesuisse39) reported significant differences in behaviour due to maternal diet in animals fed a RP diet. RP/RP animals were less active as reflected by a decreased level of litter scratching, reduced feather pecking behaviour and an increased time spent sitting compared with the C/RP animals. To find the most important drivers behind the differences between C/RP and RP/RP animals, we performed a WGCNA. This resulted in one significant module whose eigengene was higher expressed in the C/RP group compared with the RP/RP group. In the C/RP group, the GO term ‘autophagy’ represented an up-regulated KEGG pathway compared with the RP/RP group and the module contained multiple post-translational modification genes, reflected by significant GO terms such as ‘phosphorylated amino acid binding’. Hub genes of this module are those with a high gene significance and high module membership. An example of such a hub gene is the top annotated gene for gene significance, METTL21C, which encodes for a methyltransferase protein and has also been found to regulate autophagy-associated protein breakdown(Reference Wiederstein, Nolte and Günther40). So, when animals, programmed for a RP diet by the F0 generation, are fed a RP diet themselves, they seem to have less protein breakdown compared with animals whose mothers were fed the control diet.
The up-regulated autophagic GO term in the WGCNA for the C/RP group v. the RP/RP group reinforces our DE analysis. Upon fasting, it is well established that cells shift their metabolism from glucose to fatty acid oxidation to produce energy and an autophagic degradation of lipid droplets is thought to mobilise TAG during the starvation processes(Reference Singh, Kaushik and Wang41,Reference Saito, Kuma and Sugiura42) . It seems that the fatty acid metabolism was activated significantly more in the C/RP chickens when compared with their control group C/C, while glucose metabolism took the overhand for RP/RP chickens when compared with their control group C/RP, as described above. This may suggest that the C/RP chickens are in a deeper starvation state than the RP/RP chickens, or, in other words, the RP/RP chickens seemed to be more maternally adapted to the RP diet than the C/RP chickens.
Conclusion
Irrespective of diets in the F0 generation, chickens reared on a C diet showed an up-regulation of transaminase activity in the liver compared with a RP diet, which might indicate a higher amino acid catabolism and uric acid synthesis. However, the F0 diet influenced the metabolism triggered by the RP diet fed to the F1 generation, being the fatty acid metabolism when the mothers received a C diet or the glycolysis metabolism when the mothers received a RP diet. It seems as if chickens, when fed a RP diet, act on the reduced amount of protein in the diet either by using their reserves through an autophagic degradation of lipid droplet when the F0 generation was fed a control diet, or by lowering their entire metabolism for those animals descending from RP-fed hens. The distinction between these two coping mechanisms appears to be guided by the maternal diet.
Acknowledgements
The authors would like to acknowledge the technical assistance performed by Daniel Vermeulen, Astrid Koppenol, An Bautil, Winnie Clímaco, Luís Daniel Giusti Bruno and André Respen.
This work was partly supported by the Agency for Innovation by Science and Technology in Flanders (IWT) Agency for Flanders Innovation & Entrepreneurship (VLAIO) (grant no. 141671).
M. S. wrote the paper. J. B. conceived and supervised the study. N. E., J. L. and J. B. developed the experimental design. J. L., C. Li and S. S. organised the animal trails and samplings. J. L. and C. La performed RNA extractions. M. S. executed DE and GO analyses. J. L. and M. S. performed statistical analyses. All authors (M. S., J. L., C. La, C. Li, S. S., N. E. and J. B.) read, edited and approved the manuscript.
The authors declare that there are no conflicts of interest.
Supplementary material
For supplementary materials referred to in this article, please visit https://doi.org/10.1017/S0007114520003785


