







1. Introduction
In the following, the standard non-dimensionalization is adopted, with the ‘inner’ or viscous length scale  $\hat {\ell } \equiv (\hat {\nu }/\hat {u}_\tau )$, where $\hat {u}_\tau \equiv (\hat {\tau }_w/\hat {\rho })^{1/2}$, $\hat {\rho }$ and $\hat {\nu }$ are the friction velocity, density and dynamic viscosity, respectively, with hats denoting dimensional quantities. The resulting non-dimensional mean velocity is $U^+ \equiv (\hat {U}/\hat {u}_\tau )$, and the inner and outer wall-normal coordinates are $y^+=\hat {y}/\hat {\ell }$ and $Y=y^+/{Re}_{\tau }$, respectively, with ${Re}_{\tau }\equiv \hat {\mathcal {L}}/\hat {\ell }$ the friction Reynolds number and $\hat {\mathcal {L}}$ the outer length scale such as channel half-width, pipe radius or boundary layer thickness.
1.1. The log law and matched asymptotic expansions
The log law for the mean velocity in wall-bounded turbulent flows goes back to the celebrated work of von Kármán (Reference von Kármán1934) and Millikan (Reference Millikan1938) and is firmly rooted in the framework of matched asymptotic expansions (MAE) (see for example Kevorkian & Cole (Reference Kevorkian and Cole1981), Wilcox (Reference Wilcox1995) and Panton (Reference Panton2005)), where it represents a key term of the overlap layer between the inner and outer mean velocity expansions,  $U^+_{in}(y^+)$ and $U^+_{out}(Y)$. Its traditional form is $\kappa ^{-1} \ln y^+$, with $\kappa$ the Kármán ‘constant’, or rather parameter, as its flow dependence is confirmed by the present work.
By definition, this logarithm is, within the overlap, common to both the leading-order inner and outer expansions, where it takes the form  $\kappa ^{-1} [\ln Y + \ln {Re}_{\tau }]$. Hence, $\kappa$ can be equally well determined from $U^+(y^+)$ or $U^+(Y)$, but the choice is not as trivial as it seems. The matching also involves some subtleties, which may not be so well known.
(i) For the asymptotic matching of inner and outer expansions, the term $\kappa ^{-1} \ln {Re}_{\tau }$ in the outer expansion has to be treated as an $O(1)$ term, according to the principle of ‘block matching’, which has been introduced in MAE by Crighton & Leppington (Reference Crighton and Leppington1973) to handle terms containing powers of the logarithm of the small parameter $\epsilon$. Thereby, all the terms proportional to $\epsilon ^n(\ln \epsilon )^m$ are regrouped into the same ‘block order’ $n$, and have to be treated simultaneously for the matching. This general concept was developed to treat MAE problems in two-dimensional acoustics, where logarithms and powers of logarithms abound and $\epsilon$ is typically the ratio of acoustic wavelength to distance from the source. This concept has actually been used for a long time by the turbulent boundary layer community without being formalized. To match inner and outer expansions of the mean velocity profile (MVP) across the overlap, $\kappa ^{-1}\ln y^+$ in the inner expansion has always been identified with $\kappa ^{-1}\ln Y + \kappa ^{-1}\ln {Re}_{\tau }$ in the outer expansion, where $\ln {Re}_{\tau }$ has been treated as an $O(1)$ term. Obviously, there is no match in the inner expansion for $\kappa ^{-1}\ln {Re}_{\tau }$ alone.
(ii) Furthermore, if the outer expansion is of the well accepted form
$\kappa ^{-1} [\ln Y + \ln {Re}_{\tau }]$ plus an $O(1)$ function of $Y$ (see for example Coles (Reference Coles1956)), plus terms of order $O({Re}_{\tau }^{-1})$ and higher, the leading-order centreline velocity in channels and pipes is $\kappa ^{-1} \ln {Re}_{\tau }$ plus a constant, as discussed in Nagib et al. (Reference Nagib, Monkewitz, Moscotelli, Fiorini, Bellani, Zheng and Talamelli2019) and Monkewitz (Reference Monkewitz2021), for instance. This equality of overlap and centreline $\kappa$ could only be relaxed, if the outer expansion contained an additional $O(1)$ term proportional to $[\exp (-\mathrm {const.}/Y)\ln {Re}_{\tau }]$, which becomes transcendentally small for $Y \to 0$ (see for example Wilcox (Reference Wilcox1995), for a discussion of transcendentally small terms). Lacking any evidence for such a term, the $\kappa$ values extracted from overlap profiles and from the ${Re}_{\tau }$ dependence of the centreline velocity must be identical!


1.2. The role of the additional linear term in the channel and pipe MVP overlap
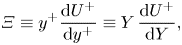
Traditionally, the MVP overlap in all wall-bounded turbulent flows has been associated with a purely logarithmic region, readily identified with the logarithmic-indicator function
 \begin{equation} \varXi \equiv y^+\frac{\mathrm{d} U^+}{\mathrm{d} y^+} \equiv Y\,\frac{\mathrm{d} U^+}{\mathrm{d} Y} , \end{equation}
which is constant whenever  $U^+$ is a linear function of $\ln y^+$. It is noted, however, that an interval of constant $\varXi$ is not automatically an inner–outer overlap, as there are additional requirements in MAE. Specifically, the centre of the overlap has to scale on the intermediate variable $(y^+Y)^{1/2}$, and its extent has to expand with ${Re}_{\tau }$. In technical MAE terms, looking for a region of constant $\varXi$, i.e. a simple log law, amounts to consider the basic ( $1{O}{\rm inner}/1{O}{\rm outer}$) common part or overlap. Here and in the following, ‘( ${\rm n}{O}{\rm inner}/{\rm m}{O}{\rm outer}$) overlap’, is a shorthand for an overlap constructed from an inner asymptotic expansion of $n$th order and its outer counterpart of $m$th order.
The problems with this traditional approach stem from additional terms in the overlap region, discussed early on by Yajnik (Reference Yajnik1970) and Afzal & Yajnik (Reference Afzal and Yajnik1973), among others. Of particular relevance is the linear term  $S_0\,y^+/{Re}_{\tau }$ in the $U^+$ overlap profile of channels and pipes, which represents an $O({Re}_{\tau }^{-1})$ correction of the innerscaled indicator function $\varXi (y^+)$, as discussed for instance by Jiménez & Moser (Reference Jiménez and Moser2007), Lee & Moser (Reference Lee and Moser2015, § 3.1) and Luchini (Reference Luchini2017), who has argued that the coefficient $S_0$ of this linear term $S_0\,y^+/{Re}_{\tau }$ is proportional to the pressure gradient (see Appendix C for a review of this issue). As this linear term is of higher order in the inner expansion, it is not included in the ( $1{O}{\rm inner}/1{O}{\rm outer}$) MVP overlap, despite moving up to $O(1)$ in the outer-scaled indicator function $\varXi (Y)$. This follows formally from the overlap description in terms of the intermediate variable $\eta = y^+{Re}_{\tau }^{-1/2} = Y\,{Re}_{\tau }^{+1/2}$, where the linear term $S_0\,y^+/{Re}_{\tau } \equiv S_0Y$ is of order $O({Re}_{\tau }^{-1/2})$ relative to the $O(1)$ log law.
However, at the Reynolds numbers where data are available, the basic ( $1O{\rm inner}{/}1{O}{\rm outer}$) overlap to determine $\kappa$ is not very helpful in the presence of an additional linear overlap term $S_0\,y^+/{Re}_{\tau }$, such as in channels and pipes, where the overlap indicator function takes the form
 \begin{equation} \varXi_{\mathrm{OL}} = \frac{1}{\kappa} + \frac{S_0\,y^+}{{Re}_{\tau}} + \mathrm{H.O.T.} \equiv \frac{1}{\kappa} + S_0Y + \mathrm{H.O.T.}, \end{equation}
where H.O.T. designates higher-order linear terms considered only for the channel in § 2.
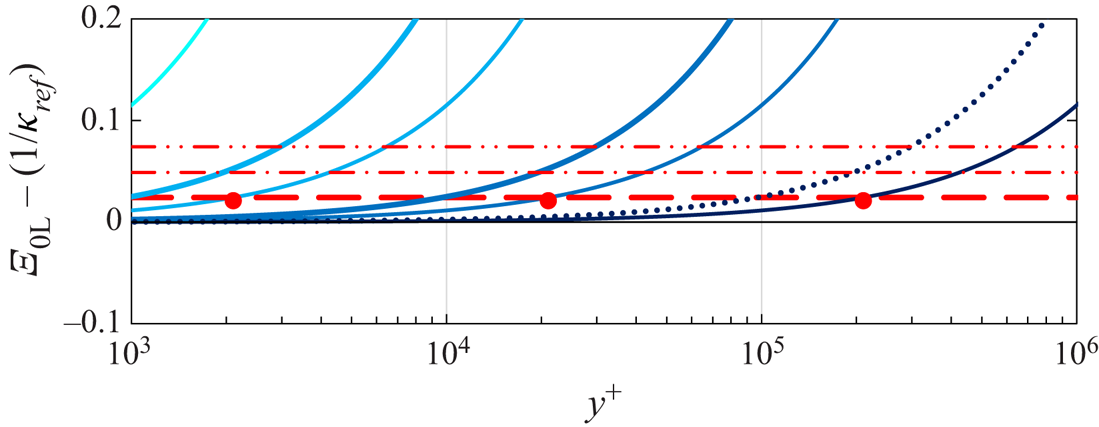
Ignoring the linear contribution to the overlap  $\varXi _{\mathrm {OL}}$ in (1.2) has been the main reason for the lack of agreement on $\kappa$ values. The example of figure 1 shows, that determining $\kappa$ with an error below 1 % from a region of sufficiently constant $\varXi _{\mathrm {OL}}$, extending from, say, $y^+ = 10^3$ to $10^4$, requires a very large Reynolds number of ${Re}_{\tau } \approx (10^6\kappa S_0)$. Note that the reason for considering only the region of $y^+\geq 10^3$ in figure 1 is the ‘hump’ or ‘bulge’ of $\varXi$ below $y^+\approx 10^3$ on top of the linear overlap (1.2), which will be discussed in the next § 2.
Illustration of the effect of the linear term  $S_0\, y^+/{Re}_{\tau }$ on the estimate of $\kappa ^{-1}$ from the overlap $\varXi _{\mathrm {OL}}$ (1.2) with (red) $- - -$, $-\cdot -\cdot$, $-\cdot \cdot \,-$, $\kappa$ errors of $-1\,\%$, $-2\,\%$ and $-3\,\%$ relative to $\kappa _{ref}=0.417$. Linear deviations $S_0\, y^+/{Re}_{\tau }$ from the baseline log law for ${Re}_{\tau } = 10^4$, $10^5$, $10^6$ and $10^7$ (increasingly dark blue) with $S_0=1.15$ (—) and $S_0=2.5$ ( $\cdot \cdot \cdot$); (red) $\bullet$, locations where the linear terms with $S_0 = 1.15$ induce a $-1\,\%$ error of $\kappa$.
The problem of the non-negligible linear term in the overlap of channels and pipes is resolved by moving to the ( $2{O}{\rm inner}/1{O}{\rm outer}$) overlap, which includes the linear term $S_0\,y^+/{Re}_{\tau } \equiv S_0Y$, because it is present in both the limit $y^+ \to \infty$ of the inner expansion carried to the order $O({Re}_{\tau }^{-1})$, $U^+_{in}(y^+\gg 1) \sim \kappa ^{-1}\ln y^+ + B_0 + B_1/{Re}_{\tau } + S_0\,y^+/{Re}_{\tau }$ (see (2.3)), and in the limit $Y \to 0$ of the leading-order outer expansion $U^+_{out}(Y\ll 1) \sim \kappa ^{-1}[\ln Y + \ln {Re}_{\tau }] + B_0 + S_0Y$. This ( $2{O}{\rm inner}/1{O}{\rm outer}$) overlap corresponds to the linear outer-scaled indicator function $\varXi _{\mathrm {OL}} = \kappa ^{-1} + S_0Y$ (1.2), which, up to $y^+ \approx 10^3$, is ‘buried’ under an innerscaled ‘hump’ or ‘bulge’, further discussed in § 2 and clearly visible in figure 3 for channel direct numerical simulations (DNS) beyond a ${Re}_{\tau }$ of around 4000 and, less pronounced, in figure 5 for pipe DNS. This supports the conclusion of Monkewitz (Reference Monkewitz2021) about the ‘late start’ of the channel overlap.
Beyond  $y^+ \approx 10^3$, the linear overlap $[\kappa ^{-1} + S_0Y]$ of $\varXi _{\mathrm {OL}}$ becomes clearly visible in these figures and is seen to extend to $Y \approx 0.4\unicode{x2013}0.5$.
From the above outer-scaled form (1.2) of the overlap  $\varXi _{\mathrm {OL}}$ it follows conclusively, that the ‘humps’ of $\varXi$ on top of the linear overlap, seen in all the channel and pipe profiles below a $y^+$ of roughly $10^3$, belong to the inner expansion. Consequently, the short horizontal or near-horizontal parts of $\varXi$ within these ‘humps’, seen for instance in Lee & Moser (Reference Lee and Moser2015, figure 3), as well as in figures 3 and 5 of the present paper, are not overlap log laws, but locally logarithmic or nearly logarithmic regions of the inner expansion.
The interpretation of the indicator function  $\varXi$ is further complicated by a surprisingly large variability between different channel DNS, and even more so between pipe DNS. This variability has different sources, such as domain size, computational scheme, convergence of computation and grid spacing. The particular effect of grid spacing in the outer flow region is highlighted in Appendix B. The analysis suggests that there is a critical grid spacing $\Delta y^+$ of 3 to 4, which, when exceeded towards the centreline, leads to a decrease of the effective ${Re}_{\tau }$ in the central flow region (see figures 3 and 12 of Appendix B).
1.3. Outline of the paper
The purpose of this paper is to clarify both the location, extent and the functional form of the inner–outer overlap in channels and pipes, and to propose a novel robust method to extract  $\kappa$ from MVPs in pressure-driven flows. A comparison with the zero-pressure-gradient turbulent boundary layer (ZPG TBL) further clarifies the issues. The paper is organized as follows.
(i) In § 2, an improved outer fit of the mean velocity derivative in channels is developed from DNS, with additional details provided in Appendix A. The resulting outer fit of the indicator function
$\varXi$ is compared with different channel DNS and the variability of the results is correlated with the different choices of computational grid spacing. The superposition of log law and linear term in the overlap is supported by the experimental data of Zanoun, Durst & Nagib (Reference Zanoun, Durst and Nagib2003) and Schultz & Flack (Reference Schultz and Flack2013) obtained in channels of aspect ratio $\approx 8$. The simultaneous determination of the two overlap parameters $\kappa$ and $S_0$ is performed with a new robust method, presented in figure 4 and believed more discriminating than the iterative method of Luchini (Reference Luchini2018).(ii) Section 3 then presents an analysis of three pipe flow DNS by El Khoury et al. (Reference El Khoury, Schlatter, Noorani, Fischer, Brethouwer and Johansson2013), Pirozzoli et al. (Reference Pirozzoli, Romero, Fatica, Verzicco and Orlandi2021) and Yao et al. (Reference Yao, Rezaeiravesh, Schlatter and Hussain2023), which show considerable differences of
$\varXi (Y)$. On the other hand, the $\varXi$ for the Superpipe data of Zagarola & Smits (Reference Zagarola and Smits1998), McKeon (Reference McKeon2003) and Bailey et al. (Reference Bailey2013) are found to be very consistent, and the new method for the determination of overlap parameters yields $\kappa = 0.433$ and $S_0 = 2.5$ for the coefficient of the linear term.(iii) In the brief § 4, the findings for channel and pipe flow are contrasted with the ZPG TBL. The experimental data from three independent sources reveal that the TBL indicator function also features a linear part of a significantly higher slope than in channels and pipes, with the crucial difference that this linear part only starts in the outer region at
$Y=0.11$, and therefore does not belong to the overlap.(iv) The final § 5 summarizes the main results and closes with observations on the universality, or rather non-universality, of the so-called canonical turbulent flows: channel flow, pipe flow and ZPG TBL.


Three appendices complete the paper: Appendix A provides more details on the fit of the channel MVP, used in § 2; Appendix B discusses the likely effect of grid spacing on the results of channel and pipe DNS; Appendix C, finally reviews different approaches, including the one by Luchini (Reference Luchini2017), to take into account the effect of pressure gradient on MVP overlap profiles.
2. The outer expansion and the overlap of the indicator function in channels
To prepare for the analysis of the channel indicator function, the outer mean velocity fit of Monkewitz (Reference Monkewitz2021, (3.6)) is improved and simplified, while maintaining its basic ingredients. The differences with Monkewitz (Reference Monkewitz2021) are that the fitting is started with the mean velocity derivative, the  $\kappa$ is slightly modified to 0.417, and the $O({Re}_{\tau }^{-1})$ contribution to $\mathrm {d} U^+/\mathrm {d} Y$ is simplified,
 \begin{equation} \left. \frac{\mathrm{d} U^+}{\mathrm{d} Y}\right\vert_{{channel\ out}} = \frac{1}{\kappa Y} + \left[S_0 + \frac{1}{{Re}_{\tau}}\,S_1\right] - \left[\frac{1}{\kappa} + S_0 + \frac{1}{{Re}_{\tau}}\,S_1\right] \frac{\mathrm{d} W}{\mathrm{d} Y} \end{equation}
with
 \begin{equation} \kappa = 0.417, \quad S_0 = 1.15, \quad S_1 = 380 \quad \mathrm{and} \quad \frac{\mathrm{d} W}{\mathrm{d} Y} = \frac{\ln\{\exp[11(Y-0.73)] + 1\}}{\ln\{\exp[11(1-0.73)] + 1 \}}, \end{equation}
 \begin{align} U^+\vert_{{channel\ out}} &= \frac{\ln Y}{\kappa} + \frac{\ln{Re}_{\tau}}{\kappa} + \left[S_0 + \frac{S_1}{{Re}_{\tau}}\right]Y + \left[B_0 + \frac{B_1}{{Re}_{\tau}}\right] \nonumber\\ &\quad - \left[\frac{1}{\kappa} + S_0 + \frac{S_1}{{Re}_{\tau}}\right]W(Y), \end{align}
 \begin{equation} \mathrm{with}\quad B_0 = 5.45,\quad B_1 ={-}250 . \end{equation}
 Starting with the velocity derivative has the advantage that, for the correct  $\kappa$, the term $\mathrm {d} U^+_{\mathrm {DNS}}/\mathrm {d} Y - (\kappa Y)^{-1}$ becomes locally constant in the overlap region, irrespective of the value of $S_0$ in (2.1). This is clearly seen in figure 2(a), where $(\mathrm {d} U^+_{\mathrm {DNS}}/\mathrm {d} Y) - (\kappa Y)^{-1}$ is constant in the range $0.2 \lesssim Y \lesssim 0.45$ for $\kappa = 0.417$ and Reynolds numbers beyond around 2 000.
Successive approximations of mean velocity derivative  $\mathrm {d} U^+_{\mathrm {DNS}}/\mathrm {d} Y$ for eight channel DNS: $- \cdot -$ (grey), ${Re}_{\tau } = 934$ (del Alamo et al. Reference del Alamo, Jimenez, Zandonade and Moser2004); $- - -$ (grey), ${Re}_{\tau } = 1001$ (Lee & Moser Reference Lee and Moser2015); — (grey), ${Re}_{\tau } = 1995$ (Lee & Moser Reference Lee and Moser2015); — (dark orange), ${Re}_{\tau } = 3986$ (Yamamoto & Tsuji Reference Yamamoto and Tsuji2018); — (yellow), ${Re}_{\tau } = 4079$ (Bernardini, Pirozzoli & Orlandi Reference Bernardini, Pirozzoli and Orlandi2014); — (red), ${Re}_{\tau } = 5186$ (Lee & Moser Reference Lee and Moser2015); — (violet), ${Re}_{\tau } = 8000$ (Yamamoto & Tsuji Reference Yamamoto and Tsuji2018); — (light grey), ${Re}_{\tau } = 10049$ (Hoyas et al. Reference Hoyas, Oberlack, Alcántara-Ávila, Kraheberger and Laux2022). (a) Graph of $\mathrm {d} U^+_{\mathrm {DNS}}/\mathrm {d} Y - (0.417Y)^{-1}$; (b) profiles in (a) minus constant $(1.15 + 380\,{Re}_{\tau }^{-1})$ , $\bullet \bullet \bullet$ (blue), wake fit $[\kappa ^{-1} + 1.15 + 380\,{Re}_{\tau }^{-1}] (\mathrm {d} W/\mathrm {d} Y)$ (2.1), (2.2a–d); (c) profiles in (b) minus wake fit.
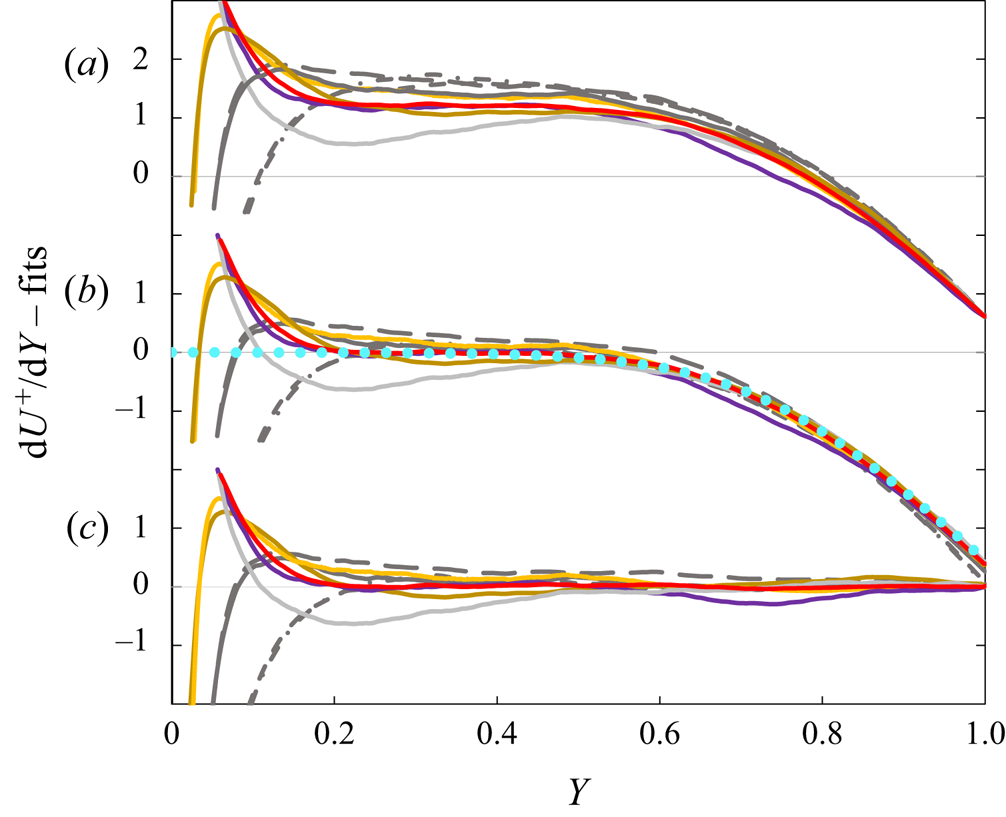
The choice of  $\kappa = 0.417$ fits the profile of Lee & Moser (Reference Lee and Moser2015) for ${Re}_{\tau } = 5186$, considered among the most reliable, particularly well and is within the estimated range of uncertainty for the $\kappa$ values deduced from centreline velocities in Monkewitz (Reference Monkewitz2017, figure 8) and Monkewitz (Reference Monkewitz2021, figure 6). The only profile in figure 2, which is not well fitted by $\kappa = 0.417$, is the ${Re}_{\tau } = 10\,049$ profile of Hoyas et al. (Reference Hoyas, Oberlack, Alcántara-Ávila, Kraheberger and Laux2022). Possible reasons for this discrepancy are discussed in Appendix B.
In a second step from figure 2(a) to figure 2(b), the constants in (2.1),  $[1.15 + 380\,{Re}_{\tau }^{-1}]$, are subtracted, showing that the $O({Re}_{\tau }^{-1})$ correction consistently reduces the spread between profiles of different ${Re}_{\tau }$. In the last step from figures 2(b) to 2(c), the derivative $[\kappa ^{-1} + 1.15 + 380\,{Re}_{\tau }^{-1}] (\mathrm {d} W/\mathrm {d} Y)$ of the wake profile is subtracted, demonstrating the quality of the outer fit (2.1), (2.2a–d).
How much one can be led astray when deducing Kármán ‘constants’ from an inappropriate region of the indicator function (1.1) is demonstrated with figure 3, which compares the outer fit of  $\varXi$, obtained from (2.1), (2.2a–d), with the $\varXi _{\mathrm {DNS}}$ of the six highest ${Re}_{\tau }$ cases of figure 2.
Channel indicator functions  $\varXi$ from DNS for the six highest ${Re}_{\tau }$ cases of figure 2 ( ${Re}_{\tau } = 1995$ and up). Same colour scheme as in figure 2. (a) Lines and symbols: —, total $\varXi$ versus $y^{+}$; $\bullet \bullet \bullet$, linear overlap fits $[\kappa ^{-1} + (S_0 + S_1\,{Re}_{\tau }^{-1})Y]$ ; - - -, complete outer fits of $\varXi$ for ${Re}_{\tau } = 4079$ and up (2.1), (2.2a–d); — (blue), $(1/0.417)$; ${\blacksquare}$ (green), $y^+ = 1200$ marking the approximate start of the overlap; ${\blacksquare}$ (red), $Y = 0.45$ marking the approximate end of the overlap. Note that for the lowest ${Re}_{\tau } = 1995$, the overlap ends before it starts. (b) Indicator functions in (a), corrected for finite ${Re}_{\tau }$ effects according to (2.1), (2.2a–d), i.e. $\varXi _\infty = \varXi - S_1Y[1- \mathrm {d} W/\mathrm {d} Y]/{Re}_{\tau }$, versus outer Y; $\bullet \bullet \bullet$ (blue), leading-order linear fit $(1/0.417) + 1.15Y$; grey band, variation of linear fit for $0.407 \leq \kappa \leq 0.427$.
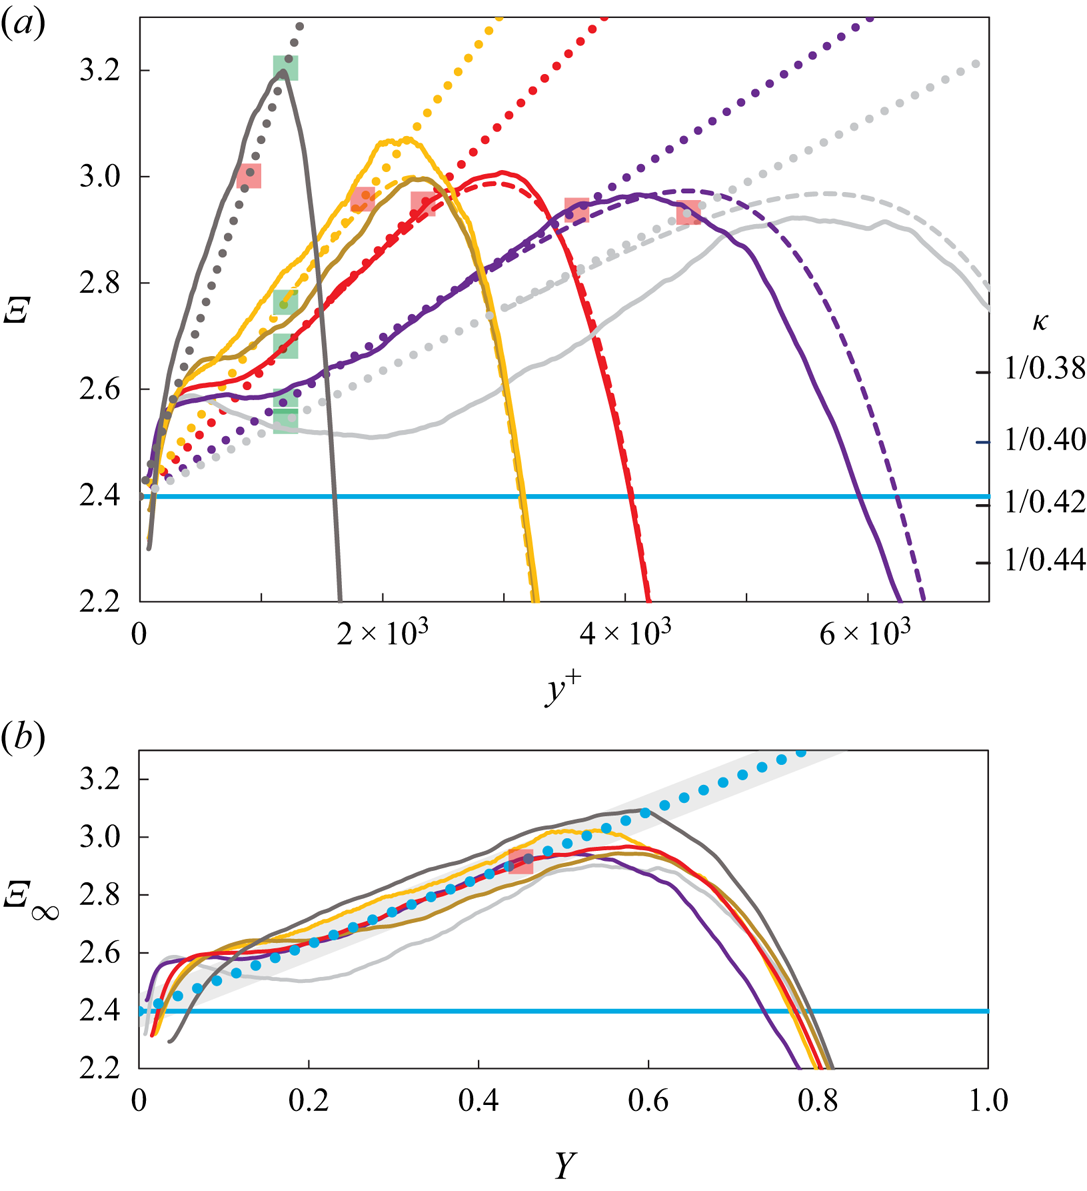
As already stated in the introduction, the outer expansion of  $\varXi$ contains the complete ( $2{O}{\rm inner}/1{O}{\rm outer}$) overlap (1.2), consisting of log law plus the linear term. Therefore, the near-wall deviations of the $\varXi _{\mathrm {DNS}}$ from their linear outer fits, i.e. the ‘humps’ or ‘bulges’ on top of the linear fits in figure 3(a), seen for $y^+ \lessapprox 10^3$ necessarily belong to the inner expansion and not to the overlap. In particular the short, near-horizontal portions of $\varXi$ within these ‘humps’, seen around $y^+$ of 500 in figure 3(a), are not related to the overlap log law, but correspond to limited, approximately logarithmic inner regions (see also Monkewitz (Reference Monkewitz2021, figure 12)).
The widespread association in the literature of these inner, nearly horizontal portions of  $\varXi$ with the inner–outer overlap has fuelled years of controversy about the differences between $\kappa$ values determined from these features and from the ${Re}_{\tau }$-dependence of the centreline velocity, discussed in the introductory § 1. In addition, it has led many authors to place the overlap layer in channels and pipes too close to the wall. To just cite a carefully documented example, Lee & Moser (Reference Lee and Moser2015, table 2 and figure 3) estimated, for ${Re}_{\tau } = 5186$, a $\kappa$ between 0.384 and 0.387 from the near-wall ‘hump’ of $\varXi$, tantalizingly close to the well established $\kappa$ of 0.384 for ZPG TBLs, reported by Monkewitz, Chauhan & Nagib (Reference Monkewitz, Chauhan and Nagib2007) and Nagib & Chauhan (Reference Nagib and Chauhan2008), but significantly different from the centreline $\kappa$ values for the same data, shown in figure 8 of Monkewitz (Reference Monkewitz2017), for instance.
Figure 3(a) also shows the boundaries of the ( $2O{\rm inner}/1{O}{\rm outer}$) overlap, defined as the locations, where the difference between $\varXi _{\mathrm {DNS}}$ and the linear overlap fit $[\kappa ^{-1} + (S_0 + S_1\,{Re}_{\tau }^{-1})Y]$ – the dotted lines in figure 3(a) – falls below a set value, taken here as 0.02. This choice results in an overlap starting at $y^+ \approxeq 1200$ and ending at $Y \approxeq 0.45$, shown by green and red squares in figure 3. Note, that with the above criterion, the overlap for ${Re}_{\tau } = 1995$ ends before it starts, which means that inner and outer expansions are not yet sufficiently separated to reveal the functional form of the overlap.
In figure 3(b), the  $O({Re}_{\tau }^{-1})$ contributions to the $\varXi$ of figure 3(a), fitted by $S_1Y[1- \mathrm {d} W/\mathrm {d} Y]/{Re}_{\tau }$ (see (2.1), (2.2a–d)), have been subtracted to approximate the infinite Reynolds number limit $\varXi _\infty$ of $\varXi$. What is somewhat surprising in this figure 3(b) are the remaining rather large differences between the $\varXi _\infty$ values. The usual explanation is that, in terms of $y^+$, $\varXi$ is the product of a small and a large number. However, this is not so in terms of $Y$, which means that in current DNS practice, the outer part of the flow receives less, and possibly not enough attention compared with the near-wall part. Besides the size of the ‘computational box’ and the numerical scheme, the computational grid is a likely prominent culprit. This hypothesis is examined in Appendix B.
Confirmation for the above analysis of the channel overlap, as reflected by the  $\varXi$ values obtained from DNS, is sought from experiments. Recognizing that experimental channels have a finite aspect ratio and a flow development region, one has to assume or hope that they provide MVPs that are reasonably close to those from DNS. Incidentally, channel DNS also use spanwise periodic boxes to approximate the infinite aspect ratio, with their width typically a small multiple of ${\rm \pi}$ times the channel half-height, and the effect of ‘quantizing’ the average aspect ratio of streamwise rolls has, to the present authors knowledge, not yet been fully explored.
The data sets for this comparison are the experimental data of Zanoun et al. (Reference Zanoun, Durst and Nagib2003), who used hotwires combined with the oil film technique to determine the wall skin friction, and of Schultz & Flack (Reference Schultz and Flack2013), who used laser Doppler anemometry. These data were obtained in channels of aspect ratio around 8, comparable to the computational box aspect ratios of the DNS in figure 3. Their analysis is shown in figure 4. Figure 4(a) and figure 4(b) show  $\varXi _\infty$, equal to the full $\varXi$ from experiment minus the ${Re}_{\tau }^{-1}$ corrections in (2.1), (2.2a–d) versus $Y$, and an enlarged view of the wall region versus $\log y^+$, respectively. In figure 4(a), $\varXi _\infty$ shows considerable scatter due to the differentiation of experimental MVPs, but the linear trend is obvious between $Y \approx 0.2$ and $\approx 0.5$ with a slope of $S_0 = 1.1$, slightly less than the slope of 1.15 educed from channel DNS. Figure 4(b) shows the near-wall behaviour of $\varXi _\infty$ and clearly reveals the ‘hump’ on top of the linear fit $1.1Y$ in the data of Zanoun et al. (Reference Zanoun, Durst and Nagib2003), between $y^+\approx 100$ and close to $10^3$, similar to the ‘humps’ in the DNS of figure 3. However, for unknown reasons, the data of Schultz & Flack (Reference Schultz and Flack2013) lack such a ‘hump’.
Indicator function  $\varXi _\infty (Y)$ and $U^+_\infty (Y)$ minus the linear part of the overlap for two channel/duct experiments. The subscript ‘ $\infty$’ indicates that all data are corrected for finite Reynolds number effects with the ${Re}_{\tau }^{-1}$ corrections in (2.1)–(2.4). Hot wire data of Zanoun et al. (Reference Zanoun, Durst and Nagib2003): $+$ (black), ${Re}_{\tau } = 1167$, 1543, $1851$; $\blacktriangle$ (grey), ${Re}_{\tau } = 2155$, $2573$, $2888$; ${\blacksquare}$ (blue), ${Re}_{\tau } = 3046,$ 3386, 3698, 3903; $\bullet$ (dark blue), ${Re}_{\tau } = 4040$, 4605, $4783$. The laser Doppler anemometry data of Schultz & Flack (Reference Schultz and Flack2013): $\lozenge$ (red, increasing size), ${Re}_{\tau } = 1010$, 1956, 4048, 5895. (a) Graph of $\varXi _\infty (Y)$: — (green), linear fit $(1/0.417) + 1.1Y$ (note that the fitted $S_0 = 1.1$ is slightly reduced relative to the best DNS fit in (2.2a–d)). (b) Blowup of $\varXi _\infty$ versus $y^+$, with linear fits $[(1/0.417) + 1.1\,y^+/{Re}_{\tau }]$ for ${Re}_{\tau } = 1167$ and 5895. (c) Corrected $U^+_\infty (Y)$ minus linear fit $[(1/0.417)\ln {Re}_{\tau } + 1.1\,Y]$; - - - (green), resulting log law $[(1/0.417)\,\ln Y + 5.5]$.
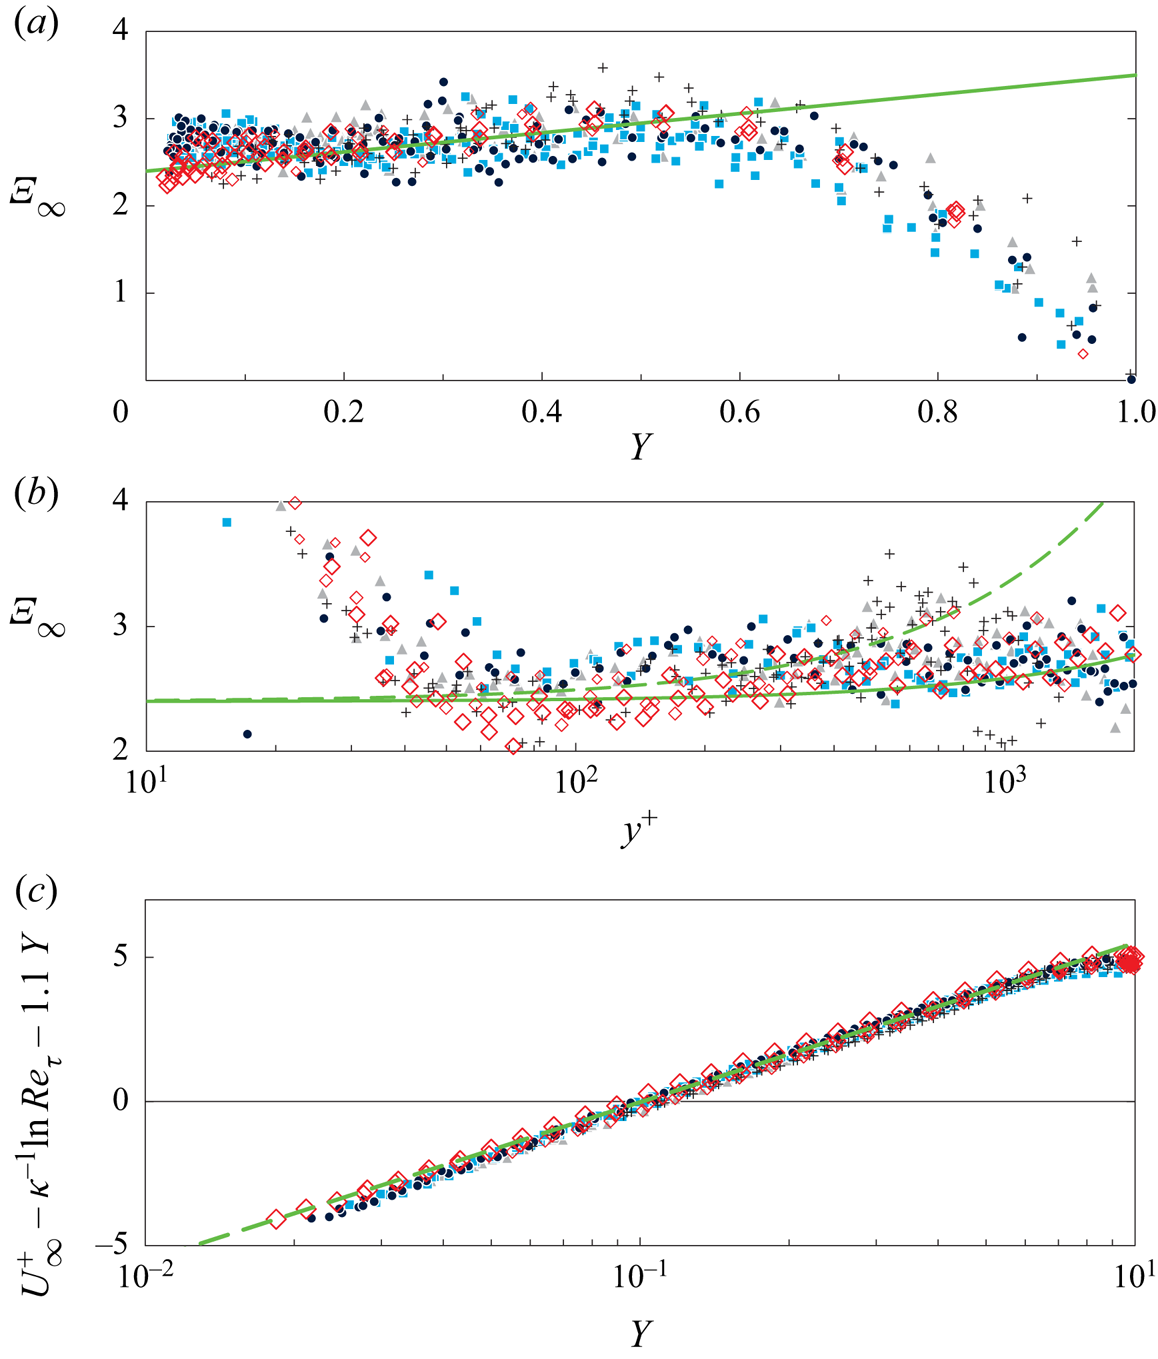
Figure 4(c) is the ‘lynch pin’ of the data analysis, demonstrating that, after removing the linear overlap term, a clear log law  $[(1/0.417)\ln {Re}_{\tau } + 5.5]$ emerges up to $Y \approx 0.5$ . The ‘hump’ below $Y \approx 10^3\,{Re}_{\tau }^{-1}$, seen in figure 4(b) for the data of Zanoun et al. (Reference Zanoun, Durst and Nagib2003), corresponds in figure 4(c) to the data which start to fall below the log law fit, i.e. onto a slope of higher $\kappa ^{-1}$.
At first sight, one might think that figure 4(c) contains no new information, since  $\kappa$ is already used in the linear fit of $\varXi _\infty$. However, only the slope of $\varXi _\infty$ is used and, when subtracting $[\kappa ^{-1}\ln {Re}_{\tau }]$ from $U^+{corr}$, a wrong $\kappa$ only produces vertical ${Re}_{\tau }$-dependent shifts of the data sets, without affecting their logarithmic slope. Hence, this new method to determine the best fit $\kappa$ in the presence of a linear overlap term is both robust and reliable. This assessment is supported by the uncertainty estimates in § 1 of the supplementary material is available at https://doi.org/10.1017/jfm.2023.448, and will be confirmed by the analogous analysis of the Superpipe data in the next § 3.
3. The overlap of the indicator function in pipes
Starting again with DNS indicator functions for pipe flow, figure 5 has the same general shape as for the channel, with a rather clear linear region at higher  ${Re}_{\tau }$, but a slope of approximately twice the slope seen in figure 3 for the channel. In contrast to the channel DNS, where the leading-order overlap of $\varXi _\infty$ is quite well fitted by the leading-order fit $(1/0.417) + 1.15Y$ for of all but one profile of figure 3(b), the $\varXi$ values for the pipe in figure 5 show more substantial differences between the DNS. One likely reason is the difference of computational schemes – finite differences for the profiles of Pirozzoli et al. (Reference Pirozzoli, Romero, Fatica, Verzicco and Orlandi2021) and spectral elements for those of El Khoury et al. (Reference El Khoury, Schlatter, Noorani, Fischer, Brethouwer and Johansson2013) and Yao et al. (Reference Yao, Rezaeiravesh, Schlatter and Hussain2023). In addition, the handling of the centreline grid singularity and the order of the numerical scheme may also have contributed to these differences.
Indicator functions  $\varXi$ for selected pipe DNS (not corrected for finite ${Re}_{\tau }$): — (yellow), ${Re}_{\tau } = 999$ of El Khoury et al. (Reference El Khoury, Schlatter, Noorani, Fischer, Brethouwer and Johansson2013); $-\cdot \cdot -$, $-\cdot -$, — (violet), ${Re}_{\tau } =$ 1976, 3028 and 6019 of Pirozzoli et al. (Reference Pirozzoli, Romero, Fatica, Verzicco and Orlandi2021); — (red), ${Re}_{\tau } = 5197$ of Yao et al. (Reference Yao, Rezaeiravesh, Schlatter and Hussain2023); $\bullet \bullet \bullet$ (violet), linear fit $(1/0.385) + 1.95Y$ of ${Re}_{\tau } = 6019$ profile; $\bullet \bullet \bullet$ (pink), linear fit $(1/0.425) + 2.75Y$ of ${Re}_{\tau } = 5197$ profile.
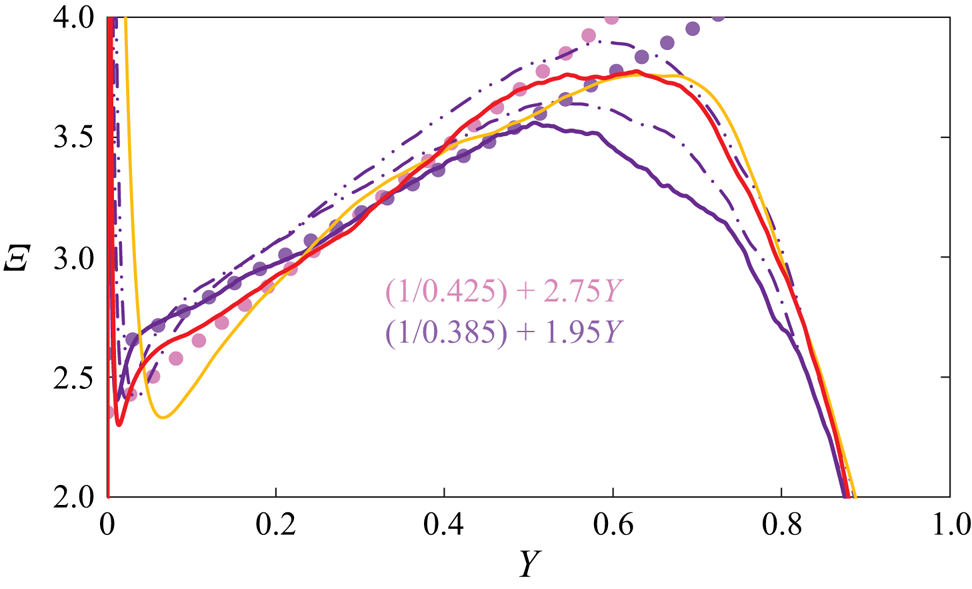
As seen in figure 5, the linear portion of the data of Pirozzoli et al. (Reference Pirozzoli, Romero, Fatica, Verzicco and Orlandi2021) for  ${Re}_{\tau } = 6019$ is quite well fitted by $[(1/0.385) + 1.95Y]$, while the most recent data of Yao et al. (Reference Yao, Rezaeiravesh, Schlatter and Hussain2023) are better fitted by $[(1/0.425) + 2.75 Y]$ in the range $0.2 \leq Y \leq 0.5$ (see also figure 12 in Appendix B). These discrepancies between pipe DNS are clearly more serious than in channels and do not allow us to determine a pipe $\kappa$ from the DNS results with any confidence.
As a consequence, no attempt has been made to determine finite Reynolds number corrections for pipe MVPs, analogous to those in (2.1)–(2.4) for the channel. Hence, the functional form of the pipe overlap and centreline velocities in terms of the outer variable  $Y$ simplify to
 $$\begin{gather} U^+\vert_{{pipe\ OL}} = \frac{\ln Y}{\kappa} + \frac{\ln{Re}_{\tau}}{\kappa} + B_0 + S_0Y, \end{gather}$$
 $$\begin{gather}U^+\vert_{{pipe\ CL}} = \frac{\ln{Re}_{\tau}}{\kappa} + B_0 + S_0 + W(Y=1), \end{gather}$$
where  $W(Y)$ is the pipe wake function.
Turning to experiments, we focus on the Superpipe data (Zagarola & Smits Reference Zagarola and Smits1998; McKeon Reference McKeon2003; Bailey et al. Reference Bailey2013) that are probably the most scrutinized experimental data in turbulence history. Starting with the centreline, the Superpipe data are the only recent data set which cover nearly two decades of high Reynolds numbers ( ${\geq }10^4$), allowing a rather reliable estimate of $\kappa$ from the ${Re}_{\tau }$ dependence of centreline velocity. While the near-wall Pitot data have been the object of numerous challenges and corrections (see for instance Vinuesa & Nagib (Reference Vinuesa and Nagib2016)), the centreline velocities have remained virtually unaffected and allows $\kappa$ to be determined from $U^+_{CL}({Re}_{\tau })$ (3.2). In Monkewitz (Reference Monkewitz2017, figure 4) the quality of the fit with the original $\kappa = 0.436$ of Zagarola & Smits (Reference Zagarola and Smits1998) was found to be comparable to the one with $\kappa = 0.42$, deduced by McKeon (Reference McKeon2003), but the comparative study of Nagib et al. (Reference Nagib, Monkewitz, Moscotelli, Fiorini, Bellani, Zheng and Talamelli2019) suggests, that the pipe centreline $\kappa$ is closer to the original $\kappa = 0.436$ of Zagarola & Smits (Reference Zagarola and Smits1998) than to 0.42.
Since pipe flow is pressure driven like channel flow, it is natural to use the methodology of § 2 to determine the pipe overlap parameters  $\kappa$ and $S_0$ in (3.1). The Superpipe data, corrected according to Bailey et al. (Reference Bailey2013), are shown in figure 6 in the same format as the channel data in figure 4, but without subtracting finite Reynolds number corrections from the data. The indicator function $\varXi$, shown in panel (a) of the figure, has a clear linear part, well fitted by $[(1/0.433) + 2.5Y]$, which extends to $Y \approxeq 0.45$. The enlarged view of $\varXi$ in figure 6(b) versus $y^+$ shows again the ‘hump’ of $\varXi$ between $y^+ \approx 10^2$ and approximately $10^3$, similar to the ‘hump’ in one set of experimental channel profiles and in all channel and pipe $\varXi$ values from DNS.
Indicator function  $\varXi (Y)$ and $U^+(Y)$ minus linear part of overlap (3.1) for the Superpipe data of McKeon (Reference McKeon2003) and Bailey et al. (Reference Bailey2013): $+$ (black), ${Re}_{\tau } < 5.10^3$; $\blacktriangle$ (grey), $5.10^3 < {Re}_{\tau } < 10^4$; ${\blacksquare}$ (blue), $10^4 < {Re}_{\tau } < 5.10^4$; $\bullet$ (red), $5.10^4 < {Re}_{\tau } < 2.10^5$; ${\blacklozenge}$ (purple), $2.10^5 < {Re}_{\tau } < 5.3\,10^5$. (a) Graph of $\varXi (Y)$: — (green), linear fit $(1/0.433) + 2.5Y$. (b) Blowup of $\varXi$ versus $y^+$, with linear fits $[(1/0.433) + 2.5\,y^+/{Re}_{\tau }]$ for ${Re}_{\tau } = 2000$, 25 000 and 250 000. (c) Graph of $U^+(Y) - [(1/0.433)\ln {Re}_{\tau } + 2.5Y]$; - - - (green), resulting log law $(1/0.433)\ln Y + 5.8$.
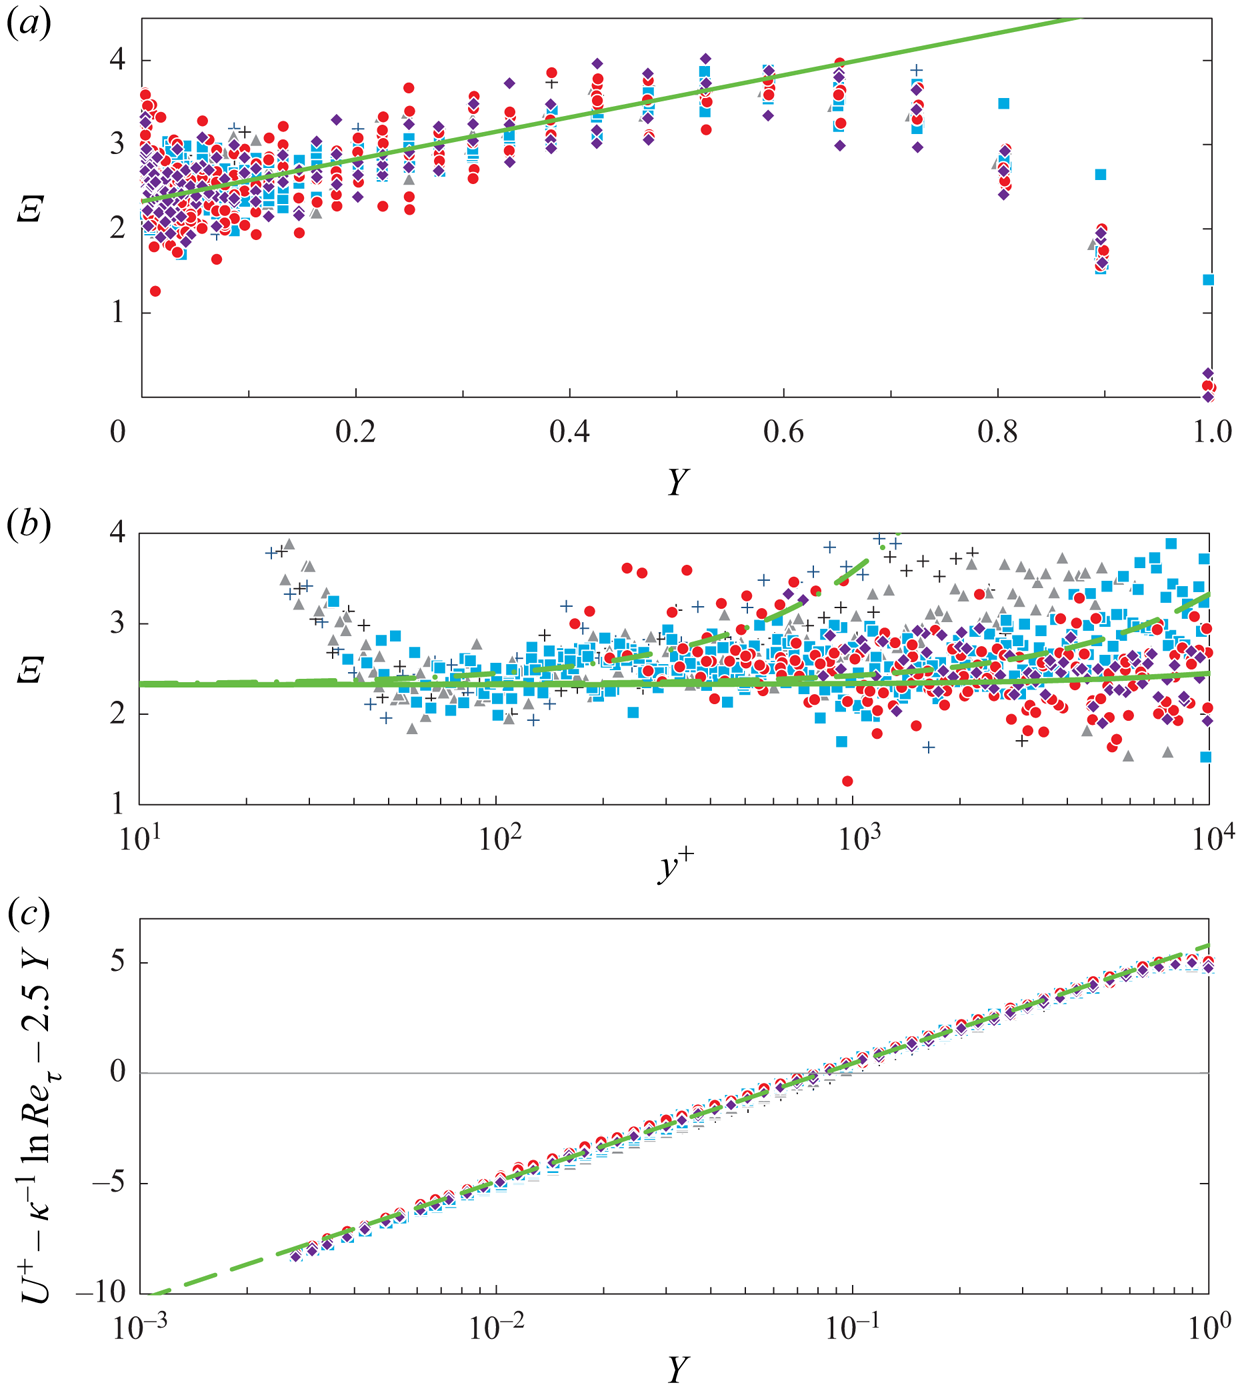
The scatter of  $\varXi$ in figure 6(a) is again relatively large, due to the differentiation of experimental data, and the uncertainty of the intercept is estimated at $[0.433 \pm 0.03]^{-1}$. However, as already made clear in § 2, only the slope $S_0$ of $\varXi$ is needed to determine $\kappa$ from the logarithmic slope in figure 6(c). This last figure shows a remarkable data collapse onto the log law $[(1/0.433)\ln Y + 5.9]$ over approximately half the pipe radius, with an estimated uncertainty in $\kappa$ of $\pm 0.01$. Furthermore, no Reynolds number trend of the linear slope $S_0$ can be detected over the entire range of the Superpipe Reynolds numbers! A more detailed uncertainty analysis can be found in § 2 of the supplementary material.
The alternative approach of first determining  $\kappa$ from the centreline velocity (3.2) has recently been made possible by an upgrade of the CICLoPE pipe (see Nagib et al. (Reference Nagib, Monkewitz, Moscotelli, Fiorini, Bellani, Zheng and Talamelli2019), for a description of the facility) in which reliable hotwire MVPs are available. Knowing $\kappa$, $L_0$ and $B_0$ can thus be obtained by a linear fit to the overlap MVP (3.1) minus the log law.
Significantly, the slope of the linear overlap term, obtained from the Superpipe profiles of this section, is roughly twice the slope in the channel overlap profile. This supports the basic finding of Luchini (Reference Luchini2017), that, for sufficiently small pressure gradients,  $S_0$ is proportional to the pressure gradient parameter $\beta \equiv -(\hat {\mathcal {L}}/\widehat {\tau _w}) (\mathrm {d} \hat {p}/\mathrm {d} \hat {x})$, equal to 1 and 2 for channels and pipes, respectively. His dimensional analysis was, however, unnecessarily constrained, as discussed in Appendix C.
4. Comparison with the outer MVP in the ZPG TBL
According to Luchini (Reference Luchini2017), the ZPG TBL is the only one of the three ‘canonical’ flows considered in the present paper, in which the overlap is a pure log law without a linear component. However, as opposed to channel and pipe flow, the ZPG TBL is slightly non-parallel. The result is, as argued by Spalart (Reference Spalart1988), that the mean advection term behaves like a non-zero pressure gradient term. It is not clear how this affects the overlap, but if a linear overlap term should result, it is too small to be seen in the top part of figure 7, which shows  $\varXi$ obtained from the three experimental data sets of Samie et al. (Reference Samie, Marusic, Hutchins, Fu, Fan, Hultmark and Smits2018), Österlund (Reference Österlund1999) and Nagib, Chauhan & Monkewitz (Reference Nagib, Chauhan and Monkewitz2007) (note that for the latter two data sets, the ${Re}_{\tau }$ values have been rescaled to match the definition of boundary layer thickness by Samie et al.).
The ZPG TBL Indicator function  $\varXi (Y)$ (top) and $U^+(Y)$ minus log law $[(1/0.384)\ln y^+ + 4.17]$ (bottom): $\bullet$ (yellow, dark yellow, red, dark red), data of Samie et al. (Reference Samie, Marusic, Hutchins, Fu, Fan, Hultmark and Smits2018) for ${Re}_{\tau } = 6$, 10, 14.5 and $20 \times 10^3$; $\bullet$ (light blue, blue, dark blue), data of Österlund (Reference Österlund1999) for ${Re}_{\tau } = 5.5$, 6.6 and $7.9 \times 10^3$; $\bullet \bullet \bullet$ (increasingly dark green), data of Nagib et al. (Reference Nagib, Chauhan and Monkewitz2007) for ${Re}_{\tau } = 12.6$, 16 and $22.5 \times 10^3$ (for this last set, the log law constant has been increased from 4.17 to 4.32). Fits: — (light blue), $\varXi = 1/0.384$; — (light green), linear part $\varXi = (1/0.384) + 7.7(Y-0.11)$ for $0.11 \leqq Y \lessapprox 0.45$; — (lavender), full fit of $\varXi$ (4.1), (4.2); - - - (light green), fit $7.7[Y - 0.11 - 0.11\ln (Y/0.11)]$ corresponding to the linear part of $\varXi$. - - - (lavender), full fit of $U^+$ – log law (numerical integration of (4.1), (4.2)).
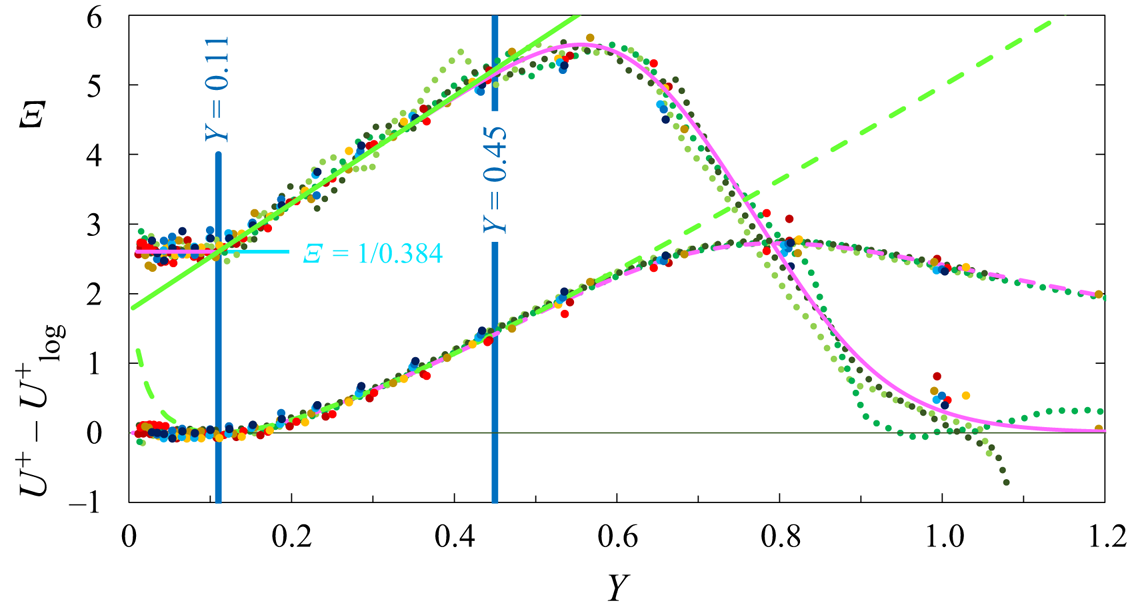
The striking difference to figures 4(a) and 6(a) is the clean (within experimental scatter) overlap log law, with the widely accepted best fit  $\kappa = 0.384$ of Monkewitz et al. (Reference Monkewitz, Chauhan and Nagib2007), which ends abruptly at the outer wall distance of $Y = 0.11$.
The next part of  $\varXi (Y)$ in figure 7, between $Y = 0.11$ and ${\approxeq }0.45$ is linear, with a large slope of $7.7$. As this linear part starts at a fixed outer location, it has nothing to do with the overlap and its physical origin is different. One likely candidate is the entrainment of free stream fluid into the boundary layer, as discussed by Chauhan et al. (Reference Chauhan, Philip, DeSilva, Hutchins and Marusic2014a) and Chauhan, Philip & Marusic (Reference Chauhan, Philip and Marusic2014b), for instance. The part of $\varXi$ beyond $Y \approxeq 0.45$ represents the transition to the free stream where $\varXi = 0$.
Both logarithmic overlap and linear part of  $\varXi$ are seen in the bottom part of figure 7 to provide, upon integration, an excellent outer fit of the MVP up to $Y \approxeq 0.45$. As the clear division of the outer $\varXi$ into constant and linear parts appears more physical than the classical wake formulation of Coles (Reference Coles1956), the following full outer fit is proposed:
 \begin{equation} \left.\begin{gathered} \varXi(Y)\vert_{{outer\ fit}} = \left\{\frac{1}{\kappa} + \varLambda(Y - Y_{break})\,\mathcal{H}(Y-Y_{break})\right\}\left\{1 - Y\,\frac{\mathrm{d} W}{\mathrm{d} Y}\right\} \\ \mathrm{with}\ \mathcal{H}\ \mathrm{the \ Heaviside \ function}, \kappa = 0.384, \ \varLambda = 7.7, \ Y_{break} = 0.11 \end{gathered}\right\}\end{equation}
and
 \begin{align} Y\,\frac{\mathrm{d}
W}{\mathrm{d} Y} &= \left\{\frac{1}{19}\,\ln\left[1 +
\exp\!\big({19\left(Y- 0.59\right)}\big)\right] -
\frac{1}{15}\ln\left[1 + 2\exp\!\big({15\left(Y-
0.92\right)}\big)\right]\right\} \nonumber\\ & \quad
\times\left\{0.92 - 0.59 - \frac{\ln 2}{15}\right\}^{{-}1}
\end{align}
\begin{align} Y\,\frac{\mathrm{d}
W}{\mathrm{d} Y} &= \left\{\frac{1}{19}\,\ln\left[1 +
\exp\!\big({19\left(Y- 0.59\right)}\big)\right] -
\frac{1}{15}\ln\left[1 + 2\exp\!\big({15\left(Y-
0.92\right)}\big)\right]\right\} \nonumber\\ & \quad
\times\left\{0.92 - 0.59 - \frac{\ln 2}{15}\right\}^{{-}1}
\end{align}
where  $Y$ is defined as in Samie et al. (Reference Samie, Marusic, Hutchins, Fu, Fan, Hultmark and Smits2018). Equations (4.1), (4.2), upon numerical integration, yields an excellent outer fit of the MVP in ZPG TBLs, as demonstrated by the dashed lavender curve in the lower part of figure 7.
5. Conclusions
The main conclusion of the present study is that the overlap of the MVP in channels, pipes and ZPG TBLs is not universal. This non-universality includes the overlap parameters, as well as the start or end locations. This non-universality should, however, not come as a surprise, as the MVP overlap provides the transition between the near-universal part of the profile in the inner, near-wall region and the geometry-dependent outer part of the profile. How close to universal the inner parts of the MVP in ZPG TBLs, channels and pipes really are, still remains to be investigated more thoroughly. At any rate, they could only be strictly universal in the limit of  ${Re}_{\tau } \to \infty$, since the Taylor expansion of $U^+$ about the wall contains the higher-order term $\beta (2\,{Re}_{\tau })^{-1}(y^+)^2$ which depends on the pressure gradient parameter $\beta$ (see for example Monkewitz (Reference Monkewitz2021, § 3.3)).
Specific results of the present analysis are as follows.
(i) The overlap in channels and pipes does not start until
$y^+ \approxeq O(10^3)$, as already discussed by Monkewitz (Reference Monkewitz2021). This follows from the outer expansion of the indicator function $\varXi$ which must contain the overlap and, for small $Y$, is a simple linear function of $Y$.(ii) The (
$1{O}\textrm {inner}/1{O}\textrm {outer}$) overlap of the MVP, i.e. the pure log law, is not useful in channel and pipe flow, since extreme Reynolds numbers are required to reveal it over an extended interval of $y^+$.(iii) To remedy this problem, which is specific to channel and pipe flow, and more generally to flows with streamwise pressure gradient, one has to resort to the (
$2O\textrm {inner}/1{O}\textrm {outer}$) overlap, which contains, in addition to the log law, the linear term $S_0 (y^+/{Re}_{\tau }) \equiv S_0Y$ (see also the discussion in § 1). This ($2{O}\textrm {inner}/1{O}\textrm {outer}$) overlap is clearly seen in channels and pipes for ${Re}_{\tau } \gtrapprox 5.10^3$ and extends from $y^+ \approx 10^3$ to $Y \approx 0.5$ with its centre located at the intermediate variable $(y^+ Y)^{1/2} \approx 20\unicode{x2013} 25$.(iv) Based on these findings, a new and robust method has been developed to simultaneously extract
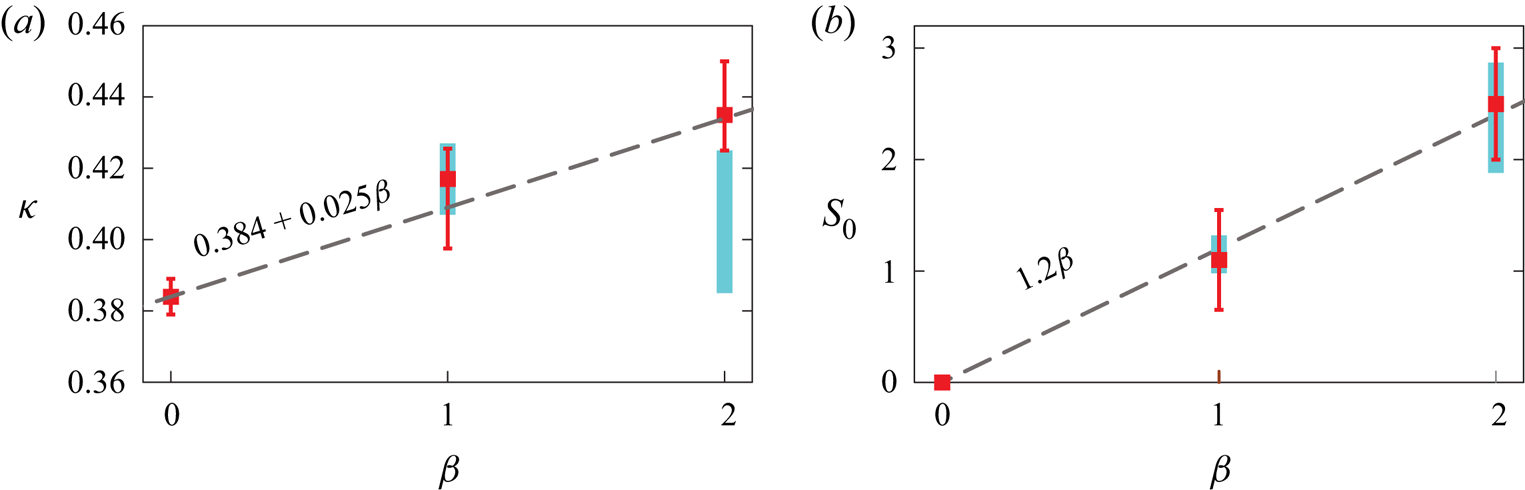
$\kappa$ and $S_0$ from the MVP of pressure-driven flows at currently accessible ${Re}_{\tau }$ values. This new method yields $\kappa$ values, which are consistent with the $\kappa$ values deduced from the leading-order Reynolds number dependence $\ln {Re}_{\tau }/\kappa$ of centreline velocities by Nagib et al. (Reference Nagib, Monkewitz, Moscotelli, Fiorini, Bellani, Zheng and Talamelli2019), Monkewitz (Reference Monkewitz2017) and Monkewitz (Reference Monkewitz2021), for instance. As discussed in § 3, it is also possible to first determine $\kappa$ from the ${Re}_{\tau }$ dependence of the centreline velocity (3.2), to subtract the log law from the overlap velocity (3.1), and to obtain $L_0$ and $B_0$ by a linear fit to the remainder. The present estimates for the dependence of these parameters on the pressure gradient parameter $\beta \equiv -(\hat {\mathcal {L}}/\widehat {\tau _w}) (\mathrm {d} \hat {p}/\mathrm {d} \hat {x})$, equal to 1 and 2 for channel and pipe, are reflected in figure 8.(v) As opposed to channel and pipe flows, the outer expansions of
$\varXi$ and $U^+$ in the ZPG TBL feature a clear logarithmic overlap with $\kappa = 0.384$, which ends at $Y = 0.11$ (using the definition of Samie et al. (Reference Samie, Marusic, Hutchins, Fu, Fan, Hultmark and Smits2018) for the boundary layer thickness). Beyond the overlap, a linear part of the outer $\varXi$ has been identified in the interval $Y \in [0.11, 0.45]$, followed by the transition to the free stream. A new outer fit with these features has been presented in § 4.(vi) Regarding DNS, more higher-quality channel and pipe DNS at
${Re}_{\tau }$ values around $10^4$ with an increased attention to the accuracy of the outer part of the flow are required to narrow down the values of the overlap parameters in channel and pipe flows and to fully clarify their asymptotic structure. Increasing the accuracy of MVPs should have priority over attempts to reach new record Reynolds numbers. It may also be interesting to perform DNS of high Reynolds number flows situated somewhere between channel and pipe flow, i.e. in rectangular or elliptic ducts of different aspect ratio, similar to the simulations of Vinuesa, Schlatter & Nagib (Reference Vinuesa, Schlatter and Nagib2018) at low ${Re}_{\tau }$ values.


Dependence of the overlap parameters  $\kappa$ (a) and the slope of the linear term $S_0$ (b) on the pressure gradient parameter $\beta \equiv -(\hat {\mathcal {L}}/\widehat {\tau _w}) (\mathrm {d} \hat {p}/\mathrm {d} \hat {x})$, equal to 1 and 2 for channel and pipe. Blue vertical bars, range of values deduced from the DNS of figures 3 and 5; red ${\blacksquare}$, baseline fits of the experimental data of figures 7 (ZPG TBL), 4 (channel) and 6 (pipe) with uncertainty estimates elaborated in the supplementary material. - - - (grey), tentative linear fits.
Supplementary material
Supplementary material is available at https://doi.org/10.1017/jfm.2023.448.
Acknowledgements
We are grateful to K. Sreenivasan for the valuable discussions on several points of this manuscript, to R. Vinuesa for sharing his expertise in DNS, which is reflected in the discussion in Appendix B, and to J. Yao for providing figure 5 of Yao et al. (Reference Yao, Rezaeiravesh, Schlatter and Hussain2023) in numerical form.
Declaration of interests
The authors report no conflict of interest.
Appendix A. Additional information on the outer expansion of the channel MVP in § 2
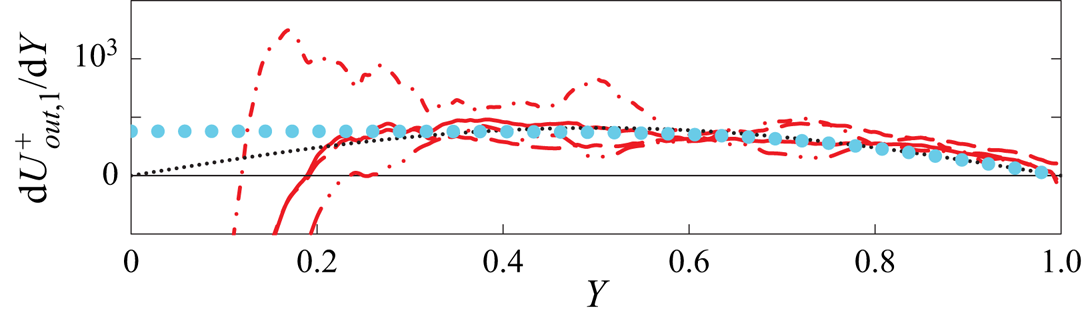
In § 2, the step from figures 2(a) to 2(b) involved the subtraction of contributions of  $O({Re}_{\tau }^{-1})$. In Monkewitz (Reference Monkewitz2021), this higher-order correction for the velocity derivative was modelled by a $\sin {({\rm \pi} Y)}$ function, reproduced here in figure 9. This fit has been simplified in (2.1). The simplified $O({Re}_{\tau }^{-1})$ fit is seen in figure 9 to be equivalent to the previous one, except for $Y \lesssim 0.2$ where it cannot be deduced from DNS at currently available ${Re}_{\tau }$ values.
Contributions of order  $O({Re}_{\tau }^{-1})$ to the channel $\mathrm {d} U^+/\mathrm {d} Y$, taken from figure 4(b) of Monkewitz (Reference Monkewitz2021): $\bullet \bullet \bullet$ (blue), new fit (2.1), (2.2a–d); $\cdots$ (black), previous fit in Monkewitz (Reference Monkewitz2021).
To further validate the present outer expansion of the channel mean velocity, the MVPs of the channel DNS used in figure 2 minus the outer fit (2.3), (2.4) are shown in figure 10 to collapse rather well, although individual profiles could obviously be better fitted with slight adjustments of the parameters. For  ${Re}_{\tau }$ values beyond $10^3$, the differences between DNS and the outer fit are below 0.5 % of centreline velocities, all the way to the inner boundary of the overlap. The latter can be estimated from figure 10 to be around $y^+ \approx 10^3$ (corresponding to $Y \approx 0.15$ for the Reynolds numbers in this figure), in accord with the conclusions of Monkewitz (Reference Monkewitz2021). The outer limit of the overlap is seen in figure 2 to be located at $Y \approxeq 0.4\unicode{x2013} 0.45$, with the exact value depending on the maximum deviation allowed between overlap and full profile.

Appendix B. Exploring the effect of DNS grid spacing on indicator functions
The differences between the indicator functions from different DNS, seen in figure 3, are rather large, even after subtracting  ${Re}_{\tau }^{-1}$ corrections in figure 3(b), and call for an explanation. Here, a correlation with the grid spacing is explored in figure 11, which shows the distribution of grid spacing $\Delta y^+$ over the channel half-height for a number of channel DNS, together with two indicator functions of Yamamoto & Tsuji (Reference Yamamoto and Tsuji2018).
Grid spacing  $\Delta y^+$ of different channel DNS (right vertical axis) versus $y^+$ compared with two indicator functions of Yamamoto & Tsuji (Reference Yamamoto and Tsuji2018) (left axis). Left axis: — (orange), $\varXi ({Re}_{\tau } = 3986)$; $\cdot \cdot \cdot$ (light brown), linear fit $(1/0.424) + 1.2Y$; - - - (light brown), fit $(1/0.395) + 0.65Y$; $\bullet$ (light brown), switch between the two linear fits at $y^+ \approxeq 1300$. — (red), $\varXi ({Re}_{\tau } = 8000)$; $\cdot \cdot \cdot$ (dark red), linear fit $(1/0.424) + 1.3Y$; - - - (dark red), fit $(1/0.405) + 0.85Y$; $\bullet$ (dark red), switch between the two linear fits at $y^+ \approxeq 1900$. Right axis: grid spacing for ${Re}_{\tau } = 3986$ (thick orange dashes) and 8000 (thick red dashes) of Yamamoto & Tsuji (Reference Yamamoto and Tsuji2018) with location of the change of linear slope of $\varXi$ indicated by bullets. Comparison grid spacings shown for ${Re}_{\tau }$ = 934 (del Alamo et al. Reference del Alamo, Jimenez, Zandonade and Moser2004, short green dashes), 1001 (Lee & Moser Reference Lee and Moser2015, long green dashes), 1995 (Lee & Moser Reference Lee and Moser2015, short blue dashes), 2004 (Hoyas & Jiménez Reference Hoyas and Jiménez2006, long blue dashes), 4079 (Bernardini et al. Reference Bernardini, Pirozzoli and Orlandi2014, long violet dashes), 4179 (Lozano-Durán & Jiménez Reference Lozano-Durán and Jiménez2014), 5186 (Lee & Moser Reference Lee and Moser2015, pink solid line), 10046 (Hoyas et al. Reference Hoyas, Oberlack, Alcántara-Ávila, Kraheberger and Laux2022, pink dashes).
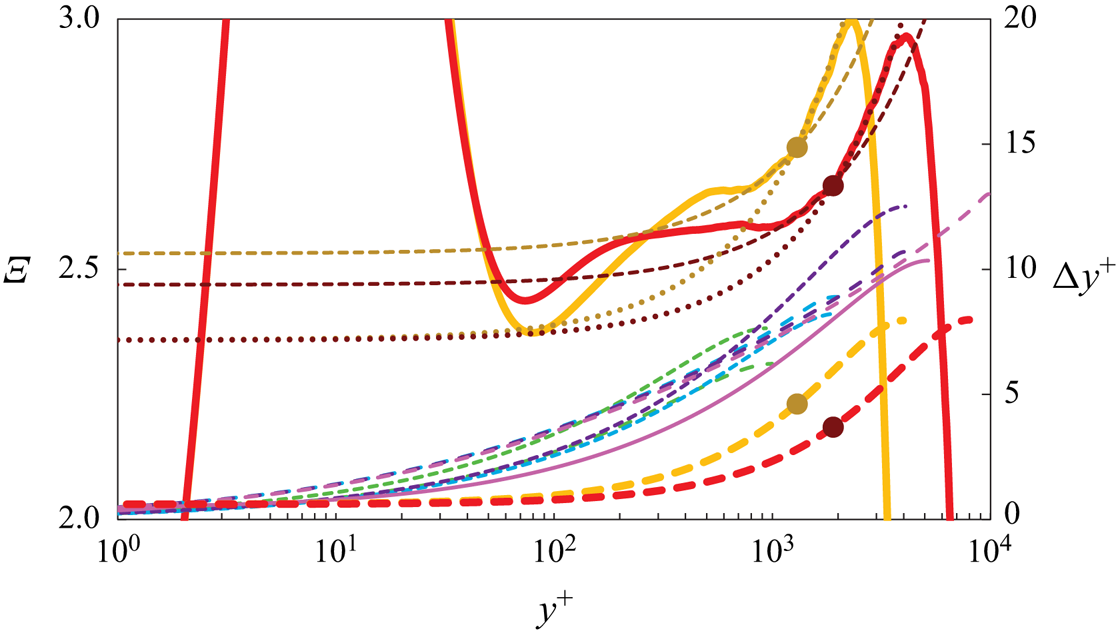
What is striking in figure 11 is the rapid increase of  $\Delta y^+$, reaching 2 already at $y^+ = 100$, and reaching 10–15 on the centreline. The exceptions are the two DNS of Yamamoto & Tsuji (Reference Yamamoto and Tsuji2018), where this increase is delayed to $y^+ \approx 10^3$. In the group of DNS without those of Yamamoto & Tsuji, the DNS of Lee & Moser (Reference Lee and Moser2015) for ${Re}_{\tau } = 5186$ has the smallest $\Delta y^+$ values, while those of Hoyas et al. (Reference Hoyas, Oberlack, Alcántara-Ávila, Kraheberger and Laux2022) for ${Re}_{\tau } = 10\,049$ are approximately twice as large, which has probably contributed to the ‘untypical’ $\varXi$ for this case in figure 3.
Unfortunately, the two DNS of Yamamoto & Tsuji (Reference Yamamoto and Tsuji2018) have the largest  $\Delta y^+$ values close to the wall and use a second-order scheme, which possibly plays a role. Nevertheless, the distribution of $\Delta y^+$ values may contribute to the explanation for the scatter in figure 3(b). In figure 11 the $\varXi$ of these two DNS clearly change slope in the part that is linear in other DNS. The location of these slope changes, marked in the figure by large dots, correlates quite well with the location where the respective $\Delta y^+$ reach a value of around 4.
A similar phenomenon can be observed in pipe DNS, as demonstrated for example by the indicator function  $\varXi$ of Yao et al. (Reference Yao, Rezaeiravesh, Schlatter and Hussain2023) for ${Re}_{\tau } = 5197$ in figure 5, shown below in enlarged form as figure 12. This figure clearly demonstrates a significant change of the slope of $\varXi$ at $Y\approxeq 0.29$, where the grid spacing $\Delta y^+$ reaches a value of around 7.
Detail of  $\varXi (Y)$ [(red) —] for the pipe DNS of Yao et al. (Reference Yao, Rezaeiravesh, Schlatter and Hussain2023, figure 5) at ${Re}_{\tau } = 5197$. Lines: (black) $\cdots$, uncertainty estimates given by Yao et al.; (pink) $\bullet \bullet \bullet$, overall fit $(1/0.425) + 2.75Y$ of figure 5; (green) - - -, best fit $(1/0.408) + 2.34Y$ for $Y\in [0.1, 0.29]$; (blue) $-\cdot -$, best fit $(1/0.443) + 3.00Y$ for $Y\in [0.29, 0.45]$.
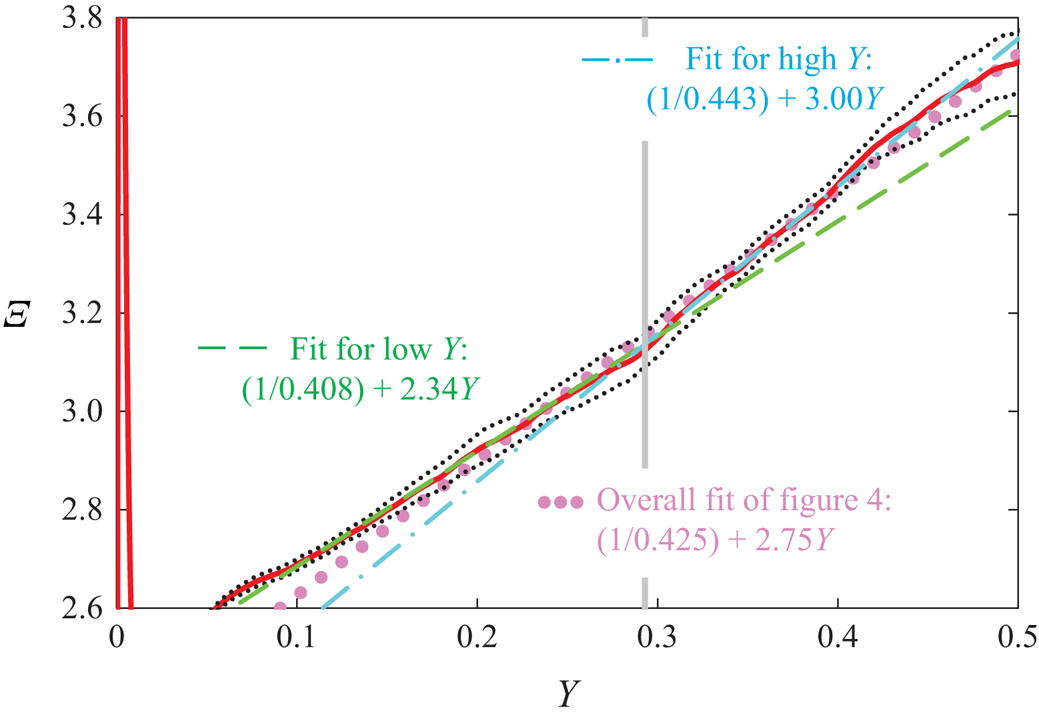
As the slope of the linear part  $S_0Y$ of $\varXi$ is proportional to ${Re}_{\tau }^{-1}$ in a graph of $\varXi$ versus $y^+$ (see (2.1)), the steepening of the linear part of $\varXi$ in figures 3 and 12 corresponds to a decrease of the effective Reynolds number. This phenomenon is well known from the numerical integration of simpler equations, such as the diffusion equation, where an exaggerated rapid increase of the integration step results in a solution corresponding to a higher diffusivity. This suggests, that the grid spacing in the outer flow contributes significantly to the large differences in figures 3 and 12, and should probably be limited to $\Delta y^+ \lessapprox 3\unicode{x2013} 4$. However, the fidelity of a DNS to the true Navier–Stokes solution is also influenced by a number of other factors, such as statistical convergence (see for instance Vinuesa et al. (Reference Vinuesa, Prus, Schlatter and Nagib2016)), the order of the numerical scheme, the computational box size, and the ratio of $\Delta \hat {y}$ to the Kolmogorov length, so that further investigations are clearly called for.
Appendix C. The effect of pressure gradient on the overlap profile – Lucchini's analysis and beyond
The result of Luchini (Reference Luchini2017), that, for sufficiently small pressure gradients, the coefficient  $S_0$ of the linear term in the MVP overlap is proportional to the pressure gradient parameter $\beta \equiv -(\hat {\mathcal {L}}/\widehat {\tau _w}) (\mathrm {d} \hat {p}/\mathrm {d} \hat {x})$, which equals 1 and 2 for channels and pipes, respectively, can be justified in different ways.
One possibility is to use the streamwise mean momentum equation
 \begin{equation} \frac{\mathrm{d}}{\mathrm{d} y^+}\left[{Re}_{\tau} \nu_T\,\frac{\mathrm{d} U^+}{\mathrm{d} y^+}\right] + \frac{\beta}{{Re}_{\tau}} = 0 \end{equation}
with a scaled eddy viscosity  ${Re}_{\tau } \nu _T$. Integrating (C1) once, and switching to the outer coordinate $Y$ yields
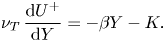 \begin{equation} \nu_T\,\frac{\mathrm{d} U^+}{\mathrm{d} Y} ={-} \beta Y - K. \end{equation}
Integrating (C2) once more with the simple (negative) turbulent viscosity  $\nu _T = -\ell Y$ yields
 \begin{equation} U^+(Y) = \frac{\beta}{\ell}Y + \frac{K}{\ell}\ln Y + C , \end{equation}
where  $\ell$, $K$ and $C$ may depend on $\beta$ and are simply related to the overlap part of the mean velocity derivative in (2.1), (2.2a–d) and of the mean velocity in (2.3). In other words, (C3) is perfectly suited to describe all ‘canonical’ overlap profiles.
As seen below, it is more general than the overlap derived by Luchini (Reference Luchini2017), who used dimensional analysis for the derivation of the  $\beta$-dependence of the overlap profile. However, he excluded the channel half-width or pipe radius from the list of variables for the application of the Buckingham $\varPi$ theorem, while implicitly keeping the hydraulic diameter, which is inversely proportional to the pressure gradient. This resulted in a universal $\kappa$, coveted by generations of fluid mechanicians, but not consistent with experimental evidence (see for example Nagib & Chauhan (Reference Nagib and Chauhan2008), Monkewitz (Reference Monkewitz2017) and Monkewitz (Reference Monkewitz2021)).
Completing Lucchini's list of variables with the channel half-width or the pipe radius  $\hat {\mathcal {L}}$ to $\{\hat {U}_y , \hat {y}, \hat {u}_{\tau }, \widehat {p_x}, \hat {\mathcal {L}}, \hat {\rho } \}$, one readily obtains the functional relation $\varPi _1 = f(\varPi _2, \varPi _3)$ between the three non-dimensional $\varPi$ values:
 \begin{equation} \varPi_1 = \frac{\hat{y}\,\widehat{U_y}}{\hat{u}_{\tau}},\quad \varPi_2 ={-} \hat{\mathcal{L}}\,\frac{\widehat{p_x}}{\hat{\tau}_w} \equiv \beta,\quad \varPi_3 = \frac{\beta\,\hat{y}}{\hat{\mathcal{L}}}. \end{equation}
Linearizing  $\varPi _1 = f(\varPi _2, \varPi _3)$ around $\beta = 0$ yields $\varPi _1=\kappa ^{-1}+ B\varPi _2 + C\varPi _3 + O(\beta ^2)$. With $\hat {\mathcal {L}}\,\hat {u}_{\tau }\,\hat {\nu }^{-1}\equiv {Re}_{\tau }$, this relation integrates to the non-dimensional overlap profile
 \begin{equation} U^+_{overlap} = \frac{1}{\kappa_0 +\kappa_1\beta}\,\ln(y^+) + \left[B_0 + B_1\beta\right] + \frac{\beta}{{Re}_{\tau}}\left[C_0 \,y^+{+} C_1\right] + O(\beta^2). \end{equation}
One readily identifies  $\beta C_0$ in (C5) with the coefficient $S_0$ in (2.1) and (2.2a–d).


 Open access

