


Introduction
The Holocene climate history of southeast Australia is not well understood, especially at the sub-regional level where dynamic coastlines, arid inland plains, and stable mountain ranges may have driven local variability in hydroclimate patterns through time. Southeastern Australia includes the now submerged Bassian Plain (currently Bass Strait) that formed a land bridge between Victoria and eastern South Australia and Tasmania (Aboriginal-given name: Lutruwita) during much of the last glacial period (Lambeck and Chappell, Reference Lambeck and Chappell2001). The west–east distribution of islands in the Bass Strait makes them ideal locations to investigate the history of the general wet west to dry east climatic gradient that currently characterizes this part of southeast Australia. Previous studies from the area suggest a synchronous dry Middle Holocene on the western and eastern islands (Adeleye et al., Reference Adeleye, Haberle, Harris, Connor and Stevenson2021a, Reference Adeleye, Haberle, Hua and Bowman2025), which contrasts with previous hypotheses of a more regional wet climate (De Deckker, Reference De Deckker2022). The spatio-temporal response of terrestrial vegetation communities to past climate between the climatically different islands of western and eastern Bass Strait is poorly known. This knowledge is key to understanding the paleoclimate of the Bass Strait region, and how these records fit within the broader paleoclimatic patterns for southeast Australia.
Studies of Holocene wetland development on Cape Barren Island (Aboriginal-given name: Truwana) in eastern Bass Strait and King Island in western Bass Strait suggest a pattern of Middle Holocene dryness based on a shift from permanent deeper water wetland taxa towards more shallow-water-tolerant wetland taxa (Adeleye et al., Reference Adeleye, Haberle, Harris, Connor and Stevenson2021a, Reference Adeleye, Haberle, Harris, Hopf, Connor and Stevensonb). This dry episode coincides with the timing of regional sea-level transgressions in southeast Australia (Sloss et al., Reference Sloss, Murray-Wallace and Jones2007; Dougherty et al., Reference Dougherty, Thomas, Fogwill, Hogg, Palmer, Rainsley and Williams2019), which also drove expansion of coastal vegetation communities on Cape Barren Island (Adeleye et al., Reference Adeleye, Haberle, Harris, Hopf, Connor and Stevenson2021b) and nearby areas (Thomas and Kirkpatrick, Reference Thomas and Kirkpatrick1996; McWethy et al., Reference McWethy, Haberle, Hopf and Bowman2017). The onset of more frequent El Niño–Southern Oscillation (ENSO) episodes during the Middle Holocene, however, is thought to have contributed to an overall dryness at this time (Adeleye et al., Reference Adeleye, Haberle, Harris, Connor and Stevenson2021a). Elevated fire activity in the Middle Holocene also occurred but was not as important as the effect of sea-level change on terrestrial vegetation communities (McWethy et al., Reference McWethy, Haberle, Hopf and Bowman2017; Adeleye et al., Reference Adeleye, Haberle, Harris, Hopf, Connor and Stevenson2021b). The effect that these dynamic regional paleoclimate changes had on the vegetation and wetland environments of King Island during the Middle Holocene (Adeleye et al., Reference Adeleye, Haberle, Hua and Bowman2025) is less well understood.
Further empirical knowledge of the temporal dynamics of terrestrial vegetation communities on western and eastern Bass Strait islands will help us to better illuminate past sub-regional and regional climate of the areas, ultimately improving our understanding of the Bass Strait landscape and climate of southeast Australia during the Holocene. Therefore, our main goal in this study is to contrast a new terrestrial paleoecological record from King Island with an existing comparable record on Cape Barren Island (Adeleye et al., Reference Adeleye, Haberle, Harris, Connor and Stevenson2021a, Reference Adeleye, Haberle, Harris, Hopf, Connor and Stevensonb) to investigate the spatio-temporal response of vegetation to Holocene climate variability in the wet west and dry east climatic regions of Bass Strait. Other climate drivers, such as sea-level change, and potential anthropogenic land-use effect also are considered. It is important to note in this context that there are few archaeological studies of past human occupation in the Bass Strait area. Of the two islands of focus here, existing evidence suggests more continuous occupation on Cape Barren Island in the east compared to King Island in the west during the Holocene (Sim, Reference Sim1998; Bowdler, Reference Bowdler2015). We therefore also consider the influence of human agency in shaping vegetation patterns throughout the Holocene.
Methods
Western Bass Strait: King Island study site
At 1098 km2, King Island is the second largest of the Bass Strait islands after Flinders Island, which is 1367 km2. King Island sits in the western part of Bass Strait, northwest of Tasmania and southeast of Victoria, mainland Australia (Fig. 1). It receives the highest rainfall of all the Bass Strait islands yet shares a temperate maritime climate with them. Year-to-year rainfall variability on King Island is largely correlated with westerly circulation strength over the area, most strongly relating to the Southern Annular Mode (SAM), particularly in summer months (Fig. 1). In some seasons, the influence of El Niño–Southern Oscillation (ENSO) and the Indian Ocean Dipole (IOD) (Australian Bureau of Meteorology, undated) on monthly rainfall is apparent at the multi-decadal scale (Fig. 1).
Study area and coring site on King Island (a, b). Rainfall map (a) was generated from Land Information System Tasmania (Department of Natural Resources and Environment Tasmania, 2021). (c–e) Correlation of map of monthly multi-decadal rainfall with climatic modes over Tasmania (Lutruwita) from 1957–2021, including the Southern Oscillation Index (SOI): positive wetter, Indian Ocean Dipole (IOD): positive drier, and Southern Annular Mode (SAM): positive drier. (f, g) Correlation of SAM and rainfall during Austral winter (JJA) and summer months (DJF).

Early European accounts of King Island’s landscape indicate the island vegetation was dominated by communities of dense Leptospermum scrub and wet Eucalyptus forests. Since European settlement from the early 1800s, about 70% of the island’s native vegetation has been cleared for dairy- and beef-cattle production (King Island Natural Resource Management Group, 2002). The remaining native vegetation on King Island today comprises diverse communities of forest, scrub, heathland, and sedgeland. Large areas of scrub persist on the island and are dominated by Leptospermum and Melaleuca species (King Island Natural Resource Management Group, 2002). Heathland and sedgeland occupy the northern part of the island in poorly drained soils. Forest communities are now restricted to discontinuous patches of uncleared lands and are dominated by one or more of the following: Eucalyptus sp., Melaleuca ericifolia, and Acacia melanoxylon. Native vegetation composition on King Island is generally similar to other western Bass Strait Islands. By contrast, eastern Bass Strait islands are dominated by dry scrub and forest communities. Also, unlike the wetter King Island where Melaleuca mostly form forests, on the drier eastern Bass Strait Islands species in this genus mostly grow as part of heathland and scrub communities, especially so for Cape Barren Island, which currently hosts the largest heathland and scrub area in the region (Adeleye et al., Reference Adeleye, Haberle, Harris, Hopf, Connor and Stevenson2021b).
There is now clear evidence for a long history of human interaction with the Bass Strait islands and the now submerged glacial-period Bassian Plain spanning at least the last 41,600 years (Adeleye et al., Reference Adeleye, Hopf, Haberle, Stannard, Mcwethy, Harris and Bowman2024), although the nature and intensity of land use likely shifted over time in response to sea-level rise and climatic variability. Archaeological evidence directly from King Island shows human presence on the Bassian Plain during the glacial period, including a human burial site dated to approximately 15,000 years ago (Sim and Thorne, Reference Sim and Thorne1990). Formation of the contemporary island coastline, with an open water distance to the nearest large island of Tasmania of around 65 km for King Island and 20 km for the eastern Bass Strait islands, appears to have played a part in reducing the likelihood of continuous occupation of these islands. Material culture preserved in shell middens and open archaeological contexts suggest continued use of the Bass Strait islands was maintained during the Early and Middle Holocene, as sea levels rose and stabilized, with evidence of occupation until at least ca. 12,000 years ago on King Island and as late as 4500 years ago in eastern Bass Strait islands (Sim, Reference Sim1990; Bowdler, Reference Bowdler2015). After this time, more intermittent use was likely during the Late Holocene, driven by connections to, and seasonal reliance on, island–maritime resources (Bowdler, Reference Bowdler2015; Adeleye et al., Reference Adeleye, Hopf, Haberle, Stannard, Mcwethy, Harris and Bowman2024). At the time of the arrival of Europeans around the turn of the nineteenth century, both King Island and Cape Barren Island in the east were reported as being uninhabited (Sim, Reference Sim1990; Sim and Thorne, Reference Sim and Thorne1990; Bowdler, Reference Bowdler2015).
Sampling
A 3-m sediment core sequence was collected from Lake Martha Lavinia (39°38’52.0”S, 144°03’53.3”E; 20 m asl) on King Island using a D-section corer. Six bulk sediment samples (2.5 cm3) were analyzed for radiocarbon dating at DirectAMS, Bothell, Washington, USA. Resulting AMS radiocarbon dates were used to build a Bayesian age–depth model in ‘rbacon’ (Blaauw et al., Reference Blaauw, Christen, Lopez, Vazquez, Gonzalez, V., Belding, Theiler, Gough and Karney2022), with the latest calibration curve (SHCal20; Hogg et al., Reference Hogg, Heaton, Hua, Palmer, Turney, Southon and Bayliss2020). The lake was accessed by foot, and a core sequence was taken from two overlapping holes next to each other in the shallow part (∼0.8 m depth), about halfway to the lake center (∼2.0 m deep). We were unable to access the center due to strong wind speeds on the day of coring and the extremely soft lake floor, which made it inaccessible by foot. Sediment samples (1.25 cm3) were taken at 2- to 4-cm intervals in the core for pollen analysis and 1-cm intervals for macrofossil analysis (primarily macrocharcoal) to reconstruct terrestrial vegetation and fire history. Preparation of pollen samples included HCl, KOH, and acetolysis treatment (Faegri and Iversen, Reference Faegri and Iversen1975), while sediment subsamples were soaked in household bleach for ca. 15 hours and washed through a 125-µm sieve for macrofossil analysis. At least 300 terrestrial pollen grains were identified and counted in each sample.
Data analysis
Squared Chord Distance (SCD) dissimilarity between pollen samples was calculated using the ‘analogue’ package in R (Simpson et al., Reference Simpson, Oksanen and Maechler2024). This was to estimate compositional turnover of taxa in pollen records, which indicates the magnitude of change in vegetation over time (Davis et al., Reference Davis, Collins and Kaplan2015). The empirically derived turnover threshold for southeast Australia (SCD = 0.2) based on modern pollen–vegetation relationship across the region (Adeleye et al., Reference Adeleye, Mariani, Connor, Haberle, Herbert, Hopf and Stevenson2021c) was used to determine the timing of major turnover and vegetation community phases in the pollen record. An SCD value > 0.2 means a complete shift in pollen assemblages and an SCD < 0.2 means no significant shift in pollen assemblages.
The pollen record was also rarified using the ‘vegan’ package in R to estimate palynological richness (Oksanen et al., Reference Oksanen, Simpson, Blanchet, Kindt, Legendre, Minchin and O’Hara2024), which indicates floristic richness (Birks et al., Reference Birks, Felde, Bjune, Grytnes, Seppä and Giesecke2016). This method is known to have inherent limitations, such as differential pollen productivity (Meltsov et al., Reference Meltsov, Poska, Odgaard, Sammul and Kull2011), although studies in Australia (Adeleye et al., Reference Adeleye, Mariani, Connor, Haberle, Herbert, Hopf and Stevenson2021c) and in the Northern Hemisphere (e.g., Meltsov et al., Reference Meltsov, Poska, Reitalu, Sammul and Kull2013; Connor et al., Reference Connor, van Leeuwen, van der Knaap, Akindola, Adeleye and Mariani2021) have shown pollen richness to generally reflect vegetation floristic richness, especially at landscape scales.
In order to assess the convergence and divergence in vegetation trajectories between the King Island site (Lake Martha Lavinia) and a previously studied site on Cape Barren Island (Big Reedy Lagoon), we first applied Detrended Correspondence Analysis (DCA) to square-root-transformed pollen data from each site and then interpolated results to a mean temporal resolution of 250 years across sites from 0–14 cal ka BP (all ka ages below are calibrated). The resulting ordination scores were then compared using Procrustes analysis and a permutation-based test (PROTEST, 999 permutations) was used to assess the statistical significance of the concordance between the sites. These analyses were also conducted in R using the ‘vegan’ package (Oksanen et al., Reference Oksanen, Simpson, Blanchet, Kindt, Legendre, Minchin and O’Hara2024).
The charcoal influx record (charcoal pieces/cm2/yr) for Lake Martha Lavinia was already presented in Adeleye et al. (Reference Adeleye, Haberle, Hua and Bowman2025). However, here we included the fire (peak) frequency estimate for the site, determined using the CharAnalysis program (Higuera et al., Reference Higuera, Brubaker, Anderson, Hu and Brown2009, Reference Higuera, Gavin, Bartlein and Hallett2010). Given the multi-millennial scale of study, fire frequency here is the frequency of fire episodes and not individual fire events, which was calculated per 500 years, with minimum count cut-off probability for peak detection set to 0.05 using a Gaussian mixed model.
Results
Lake Martha Lavinia, King Island
The Lake Martha Lavinia age–depth model shows an estimated basal age of ca. 14.8 ka BP and mean sediment accumulation rates of 0.02 cm/yr, with the highest accumulation at ca. 7.2–3.5 cal ka and the most recent ca. 700 years (Table 1; Fig. 2). Turnover analysis and threshold (SCD = 0.2) identified four terrestrial vegetation community phases: LML-1 (ca. 15–13 cal ka BP), LML-2 (ca. 13–12 ka), LML-3 (ca. 12–5.5 cal ka), and LML-4 (ca. 5.5 ka to present) (Fig. 3a).
Left: Lake Martha Lavinia Bacon age–depth model and sediment accumulation rates. Right: Markov chain Monte Carlo iterations (top panel), prior (red curves), and posterior distributions (gray histograms) of accumulation rate (middle panel) and its memory (bottom panel).

Lake Martha Lavinia terrestrial pollen and charcoal records (a) from this study and (b) wetland taxa record from Adeleye et al. (Reference Adeleye, Haberle, Hua and Bowman2025). Red-dashed line in panel (a) is the empirical threshold (SCD = 0.2) for significant turnover previously derived for southeast Australia (Adeleye et al., Reference Adeleye, Haberle, McWethy, Connor and Stevenson2021d). SCD > 0.2 means complete shift in pollen assemblages, which is used to identify major phases of vegetation communities in the pollen record. Black curve in panel (b) is the loess-smoothed first axis of Detrended Correspondence Analysis (DCA) of wetland taxa, with bootstrapping at 95% confidence interval (gray-shaded area).

AMS radiocarbon ages of bulk sediment, with Calibrated median age ranges at 95% confidence interval for Lake Martha Lavinia, King Island.

Herbaceous communities dominate LML-1 (ca. 15–13 ka) at ∼60%, with Eucalyptus and Banksia making up just under ∼40%. LML-2 (13–12 ka) sees the transition from herbaceous- to woody-dominated vegetation (Fig. 3a). Eucalyptus and Melaleuca increased substantially in this phase, reaching a total of ∼90%, while Banksia declined. This generally continued into LML-3 (12–5.5 ka), but with an increase in Acacia (∼20%) and minor increases in plants such as Leptospermum, Monotoca, and ferns, especially Dicksonia antarctica. Eucalyptus initially dropped to ∼10% in LML-4 (ca. 5.5 ka to present) in favor of Leptospermum (∼30%) and Melaleuca (∼40%). Acacia decreased to < 10% as well and never recovered. Melaleuca and Leptospermum later fell to < 20% in favor of Eucalyptus (∼20%) and Monotoca (∼20%). Minor increases in other taxa, such as Allocasuarina, Pomaderris, and Dodonaea were also observed and floristic richness peaked in this phase, reaching over 30 taxa/minimum count (Fig. 3a).
Charcoal influx was high in Lake Martha Lavinia before 12 ka and between ca. 7 and 5 ka. However, influx was greatest in the former and so was fire frequency, reaching 150 particles/cm2/yr and >2 fire episodes per 500 years, respectively. This period also coincides with the timing of the greatest turnover in the pollen record, with SCD > 0.3 (Fig. 3a).
Wetland plants Restionaceae and Cyperaceae characterized the margin of Lake Martha Lavinia between ca. 15 and 10 cal ka, and freshwater green algae Zygnemataceae were abundant in the water, which is indicative of high wetland water levels (Fig. 3b). The wetland plants and algae declined after this time, falling to a minimum between 9 and 5.5 ka. Bog fungal type Microthyriaceae increased during this period, which is reflective of low wetland water levels. The previous wetland plant community (and water level) recovered after 5.5 ka, with Triglochin plant and other wetland fungi (e.g., Helicoon) and invertebrates (e.g., Copepoda, Assulina) appearing in the wetland assemblage (Fig. 3b).
Big Reedy Lagoon, Cape Barren Island
The pollen record from Big Reedy Lagoon on Cape Barren Island, eastern Bass Strait, shows a Poaceae-dominated herbaceous community in the area before 13 ka (Adeleye et al., Reference Adeleye, Haberle, Harris, Hopf, Connor and Stevenson2021b). Eucalyptus and Melaleuca expanded from 13 ka, with increased charcoal accumulation from ca. 11.7 ka. Wetland plants Isoetes and Cyperaceae locally dominated Big Reedy Lagoon from ca. 12–9 ka (Adeleye et al., Reference Adeleye, Haberle, Harris, Connor and Stevenson2021a). Allocasuarina increased at the expense of Eucalyptus from ca. 9.5 ka. In addition to the background abundance of Melaleuca and Allocasuarina, Sprengelia and Epacris dominated during ca. 9–6 ka and charcoal accumulation decreased. Restionaceae replaced Isoetes and Cyperaceae in the wetland during this period. Sprengelia and Epacris decline favored increases in Leptospermum, Monotoca, and Pomaderris after 6.5 ka. Cyperaceae recovered in the wetland while Restionaceae decreased, with Botryococcus algae later joining the wetland community in the Late Holocene (Adeleye et al., Reference Adeleye, Haberle, Harris, Connor and Stevenson2021a, Reference Adeleye, Haberle, Harris, Hopf, Connor and Stevensonb).
Comparing Lake Martha Lavinia and Big Reedy Lagoon
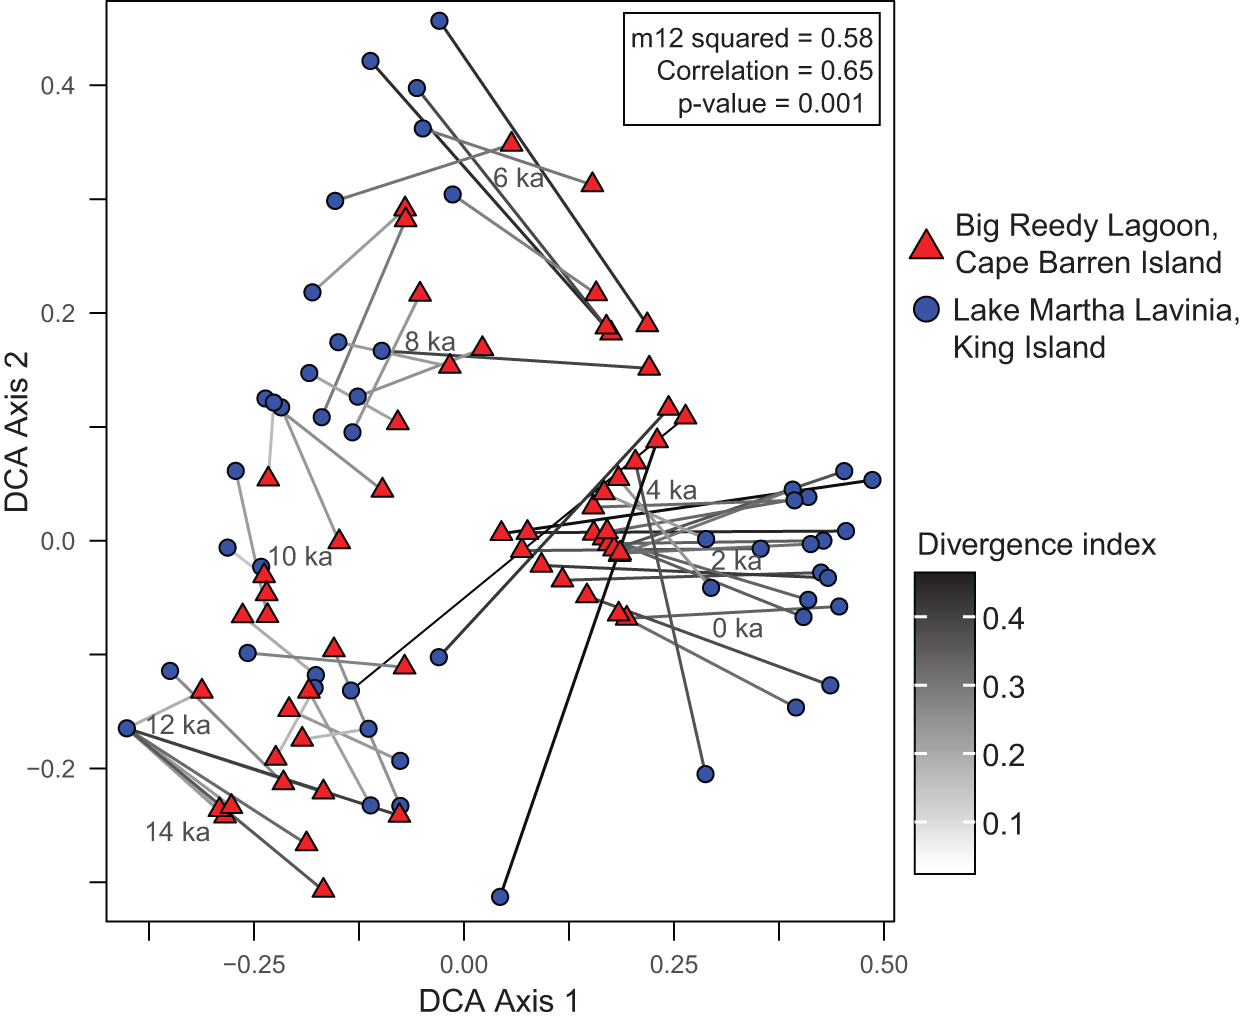
Detrended Correspondence Analysis (DCA) and Procrustes analyses show a significant similarity in the King Island (Lake Martha Lavinia) and Cape Barren Island (Big Reedy Lagoon) sites pollen assemblages (m12 squared = 0.58, correlation = 0.65, p-value = 0.001). This similarity is most evident in the low divergence between 14 and 6 ka. High divergence is observed between sites from 6 ka to present (Fig. 4).
Detrended Correspondence Analysis (DCA) and Procrustes analyses results, comparing Lake Marth Lavinia, King Island and Big Reedy Lagoon, Cape Barren Island (Truwana). Age labels are sample ages at 2000-yr bins. Dark/black lines indicate high divergence in samples and light/gray lines indicate sample convergence or low divergence.

Discussion
This palynological study advances the understanding of the climate dynamics across the Late Pleistocene Bassian Plain and the Holocene Bass Strait, particularly ranking the relative strength of major interannual climate modes, the effects of sea-level rise, and changing intensity of human fire usage. This work also provides an improved understanding of the evolution of climate of southeastern Australia and how climate dynamics affect vegetation distributions and landscape fire activity.
Late glacial and Holocene vegetation changes and associated drivers on King Island
The existing published paleoecological study from King Island (Egg Lagoon) suggests the prevalence of herbaceous vegetation during the last glacial maximum and late glacial, which is in line with the broader Bass Strait and southeast Australian regional paleoecological data (D’Costa et al., Reference D’Costa, Grindrod and Ogden1993; Adeleye et al., Reference Adeleye, Haberle, McWethy, Connor and Stevenson2021d). This is supported by our results from Lake Martha Lavinia, which show a Poaceae- (grass-) dominated landscape during the late glacial between ca. 15 and 13 ka (Fig. 5). A grassy Eucalyptus–Banksia savanna likely prevailed during this period, with low frequency of fire peaks, which is consistent with small or low-intensity fires. The presence of charcoal throughout the late glacial record, despite low amounts of woody biomass in the landscape compared to the Early Holocene, accords with anthropogenic fire management. This fire regime may have particularly favored serotinous Banksia seed dispersal and its population expansion in the landscape (Enright and Lamont, Reference Enright and Lamont2006).
Synthesis of vegetation, fire, and wetland changes on King Island and Cape Barren Island (Truwana) alongside nearby regional sea-surface temperature (SST) and Leeuwin Current (LC) record from marine core SS02-06-GC15 offshore western Victoria (De Deckker et al., Reference De Deckker, Moros, Perner, Blanz, Wacker, Schneider, Barrows, O’Loingsigh and Jansen2020; Moros et al., Reference Moros, Deckker, Perner, Ninnemann, Wacker, Telford, Jansen, Blanz and Schneider2021; De Deckker, Reference De Deckker2022) and the record of El Niño events (Moy et al., Reference Moy, Seltzer, Rodbell and Anderson2002). Wetland water-level changes (black curve) is inferred from loess-smoothed first axis of Detrended Correspondence Analysis (DCA) of wetland taxa, with bootstrapping at 95% confidence interval (gray-shaded area). Blue horizontal line indicates the onset of dry episode on King Island at ca. 7.5 cal ka, followed by increased fires from ca. 7.2 cal ka (solid black line) and major vegetation turnover from ca. 6 cal ka (green line). Blue arrows also point to the cooling and drying trends reflected by SST, LC, and wetland water-level changes at ca. 7.5 cal ka, while black arrows indicate the increase trend of fire from ca. 7.2 cal ka. Black-dashed line is the timing of sea-level transgression in southeast Australia at ca. 6.9 cal ka (Dougherty et al., Reference Dougherty, Thomas, Fogwill, Hogg, Palmer, Rainsley and Williams2019).

A turnover in vegetation occurred from ca. 13 ka, led by Eucalyptus–Melaleuca forest development as conditions became warmer into the Early Holocene. Lake Martha Lavinia water levels remained generally stable (Adeleye et al., Reference Adeleye, Haberle, Hua and Bowman2025), suggesting that moisture increase in the Early Holocene was likely due to reduced evaporation (Wilkins et al., Reference Wilkins, Gouramanis, De Deckker, Fifield and Olley2013) and not necessarily an increase in precipitation. The forest likely became increasingly moist from ca. 11 ka when Acacia expanded (Fig. 5). Acacia presently occupies wet and damp areas on King Island (King Island Natural Resource Management Group, 2002), and in the broader Tasmanian region Acacia co-occurs with Eucalyptus and Melaleuca in wet sclerophyllous forests and swamp forests (Reid et al., Reference Reid, Hill, Brown and Hovenden1999; Howells, Reference Howells2012). High charcoal influx suggests Anthropogenic burning persisted throughout this time, as large charcoal fragments have been found in Cataraqui Monument Quarry on King Island dating to ca. 12 ka (Bowdler, Reference Bowdler2015).
The state of the oceanic surface water temperatures around King Island can be traced using records of the tropical planktic foraminifera Globigerinoides ruber (a proxy for Leeuwin Current changes) and alkenone sea surface temperature (SST) records from offshore western Victoria ∼200 km from King Island (Moros et al., Reference Moros, Deckker, Perner, Ninnemann, Wacker, Telford, Jansen, Blanz and Schneider2021). The Leeuwin Current (LC) presently transports shallow tropical warm waters especially from Indonesia, through Western Australia’s coast to southern Australia, and as far as western Tasmania, bringing rainfall to these regions. The decline in tropical planktic foraminifera G. ruber from ca. 7.5 ka suggests weak LC strength, less-warm waters, and reduced moisture near King Island (Moros et al., Reference Moros, Deckker, Perner, Ninnemann, Wacker, Telford, Jansen, Blanz and Schneider2021). This is also reflected in the sharp decline in Lake Martha Lavinnia water levels at this time (Fig. 5). The LC may have been stronger in South Australia’s waters (Moros et al., Reference Moros, De Deckker, Jansen, Perner and Telford2009) but unlikely as far as the Bass Strait area at this time (Perner et al., Reference Perner, Moros, De Deckker, Blanz, Wacker, Telford, Siegel, Schneider and Jansen2018; Moros et al., Reference Moros, Deckker, Perner, Ninnemann, Wacker, Telford, Jansen, Blanz and Schneider2021). The onset of an extended dry period on King Island at ca. 7.5 ka was followed soon thereafter by high fire activity from ca. 7.2 cal ka, peaking at ca. 6.9–5.5 cal ka, with high vegetation turnover occurring from ca. 6 cal ka and peaking at ca. 5.5 cal ka The timing of events and the lack of archaeological evidence of human occupation during this period (Bowdler, Reference Bowdler2015) suggest that the drier phase on King Island between 7.5 and 5.5 ka drove large fires that significantly (SCD > 0.2) transformed the pre-existing moist forest (Fig. 5).
The IOD also strongly correlates with multi-decadal rainfall variability on King Island today and we suspect its major contribution to the Middle Holocene dry period on the island. There is currently no record of Holocene IOD dynamics in Australia; however, a coral record from east Africa has documented the formation of warm waters in the region from 8–5 ka (Leupold et al., Reference Leupold, Pfeiffer, Watanabe, Nakamura, Reuning, Blume and McClanahan2023). Based on the current pattern of the IOD influence over Australia, warm waters and more rainfall in east Africa in the Middle Holocene possibly meant cool water concentration near Australia with reduced rainfall (positive IOD phases), especially in landmasses in or bordering the eastern Indian Ocean Basin. Reduced rainfall on King Island in the Middle Holocene would have increased biomass dryness, making the moist forest susceptible to burn in events of lightning, leading to forest opening. Lightning strikes are common on the island today (e.g., 6000-ha area burned in lightning-caused fires during the summer of 2001; Corbett, Reference Corbett2010). During the 8–5 ka interval, the forest understory became more open, particularly with the exclusion of Acacia trees and understory dominance by disturbance-tolerant shrubs (Monotoca) and tree ferns (D. antarctica). Monotoca is a common understory shrub in Melaleuca, Eucalyptus, and Acacia forest communities with an absence of a dense understory, and D. antarctica usually occupy forest canopy gaps on King Island (King Island Natural Resource Management Group, 2002).
While direct climate effects (drought and lightning) may explain the Middle Holocene fires and forest transformation at Lake Martha Lavinia, it is important to also note the possible role of sea-level change. Sea level reached a maximum in southeast Australia at ca. 6.9 ka (Dougherty et al., Reference Dougherty, Thomas, Fogwill, Hogg, Palmer, Rainsley and Williams2019), which corresponds with the timing of the expansion of Monotoca, which is also found in coastal scrub on King Island. Sea-level rise effects, especially salt spray and wind disturbance, as the island coastline contracted also may have contributed to the shrub expansion, particularly in locations proximal to the coast in the Middle Holocene (Fig. 5). The Middle Holocene vegetation at Lake Martha Lavinia possibly would have been a mix of open forest and scrub communities, which generally continued into the Late Holocene, with some internal community turnover.
The abundance of Melaleuca and Leptospermum at ca. 5.5–4 ka likely reflects middle successional stage forest development, with tall shrubby layers (King Island Natural Resource Management Group, 2002) as forest started closing again after the Middle Holocene dry period and fire disturbance. Eucalyptus likely dominated the forest canopy after 4 ka with more diverse understory shrubs (e.g., Pomaderris, Monotoca) as the climate became wetter (Fig. 5). However, the driver of Late Holocene wet conditions remains unclear. The LC and SST dynamics points to a general drying and cooling trend during this period, while increasing wetland water levels suggest a wetting trend on the island. Given the dominance of IOD and SAM on the island today, the Late Holocene climate may have been dominated by negative IOD phases and strong westerlies influence, resulting in increased precipitation.
Long-term vegetation dynamics on western vs eastern Bass Strait islands
The paleoecological record from Cape Barren Island shows herbaceous vegetation also characterized the eastern Bass Strait Island during the late glacial before 13 ka (Adeleye et al., Reference Adeleye, Haberle, Harris, Hopf, Connor and Stevenson2021b; Fig. 5). Woody communities dominated by Eucalyptus and Melaleuca expanded from 13 ka as well, with charcoal evidence of fires starting at ca. 12 ka. Wet-habitat and tall forest Eucalyptus species (e.g., E. globulus) are thought to have originally occurred on Cape Barren Island from 13 ka as climate became warmer and wetter. Frequent fires derived from Aboriginal burning practices from ca. 12 ka favored fire-adapted and dwarf woodland Eucalyptus species (e.g., E. nitida) at the expense of the pre-existing forest (Adeleye et al., Reference Adeleye, Haberle, Hopf, Harris and McWethy2023b).
The earlier decline of Eucalyptus on Cape Barren Island by ca. 9 ka in favor of ericaceous coastal heathland communities has been linked to the effect of sea-level rise on the relatively small island, with forest cover limited by recurrent wind breakage and salt stress (Adeleye et al., Reference Adeleye, Haberle, Harris, Hopf, Connor and Stevenson2021b). While Eucalyptus also started to decline from ca. 9 ka on the larger Flinders Island, ∼8 km north of Cape Barren Island, the decline was slower, with Eucalyptus still dominating vegetation on the island until ca. 6.5 ka (Fig. 6), which is shortly after sea level transgression ceased in southeast Australia (Dougherty et al., Reference Dougherty, Thomas, Fogwill, Hogg, Palmer, Rainsley and Williams2019). Eucalyptus tree cover declined in favor of Casuarinaceae heathland expansion on Flinders Island (McWethy et al., Reference McWethy, Haberle, Hopf and Bowman2017) and the coast of northeast Tasmania (∼50 km south of Cape Barren Island) at this time (Thomas and Kirkpatrick, Reference Thomas and Kirkpatrick1996). Wetland water levels on Cape Barren Island also declined from ca. 7 ka, with low levels sustained in the Late Holocene as ENSO intensified (Adeleye et al., Reference Adeleye, Haberle, McWethy, Connor and Stevenson2021d). Diverse coastal heathland and scrub communities were maintained on the island through the Late Holocene, likely due to generally high sea levels and low fire activity (Adeleye et al., Reference Adeleye, Haberle, Harris, Hopf, Connor and Stevenson2021b). Drought-tolerant Callitris trees also increased, especially on the larger Flinders Island (McWethy et al., Reference McWethy, Haberle, Hopf and Bowman2017), which reflects widespread ENSO-driven aridity across eastern Australia during this period (Barr et al., Reference Barr, Tibby, Leng, Tyler, Henderson, Overpeck and Simpson2019).
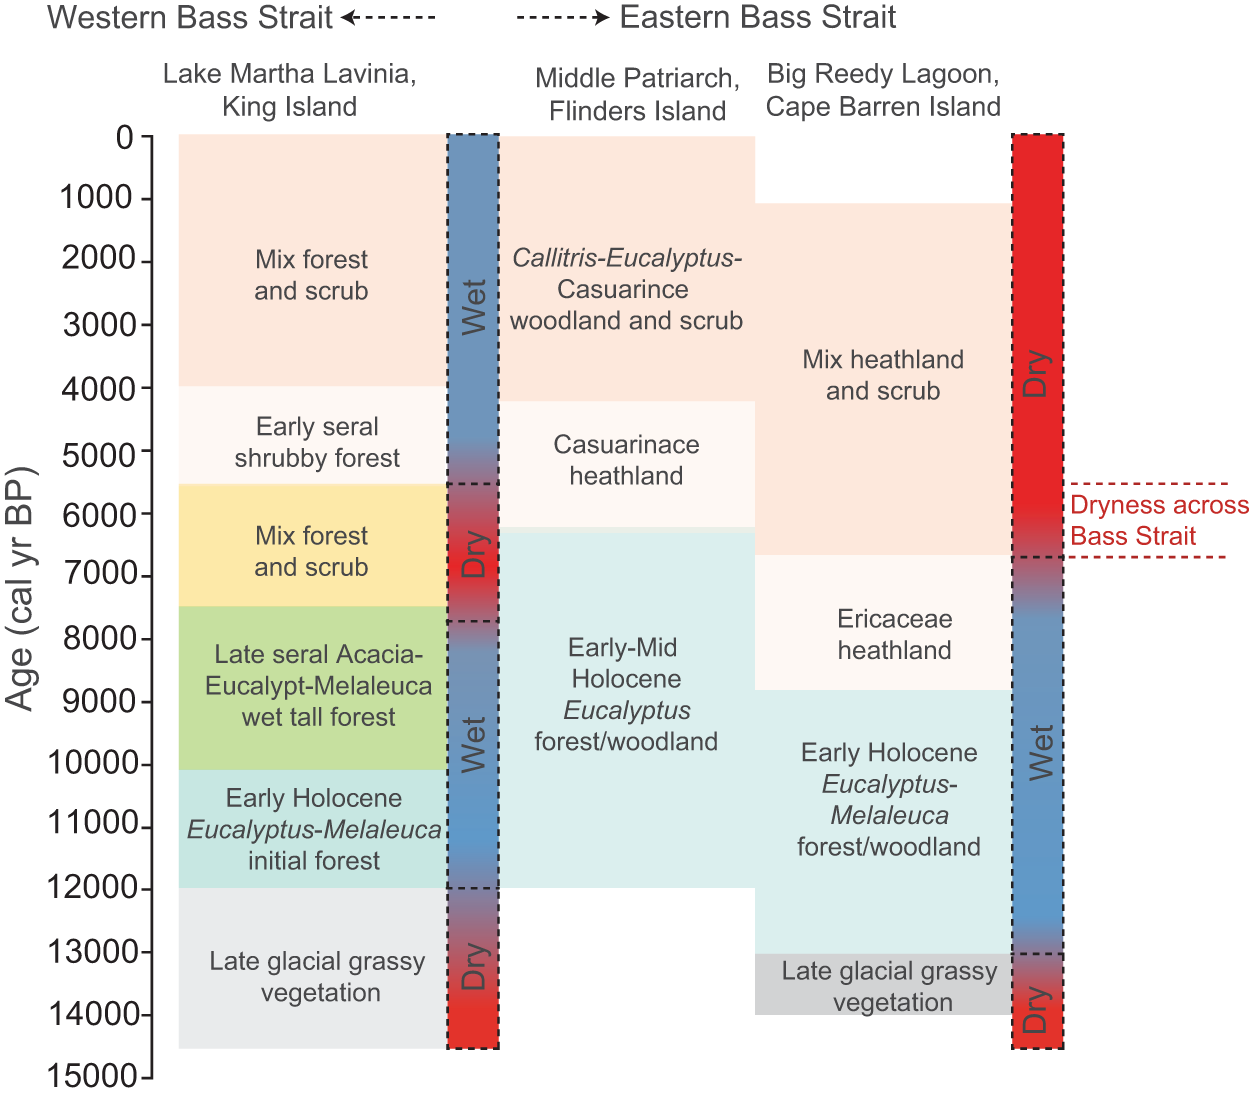
Summary of vegetation and climate trajectories of the Bass Strait region based on pollen records from the three largest islands: King Island, Cape Barren Island (Truwana), and Flinders Island.

The DCA and Procrustes analyses suggest the greatest similarity (low divergence) in vegetation communities was during the late glacial to Middle Holocene (14–6 ka; correlation = 0.65, p-value = 0.001; Figs. 5 and 6). Vegetation development on both western and eastern Bass Strait islands during this period tracks the post-glacial gradual warming and wetting trend, with a transition from herbaceous to wet woodland or forest.
Marked divergence in vegetation trajectories occurred from the Middle Holocene. While relative dryness and fire were major drivers of forest transformation on King Island at this time, sea-level rise was the dominant factor of terrestrial vegetation changes on Cape Barren Island, with a major expansion of treeless coastal heathland communities. Meanwhile sea-level rise effect was likely minimal on the larger King Island as evinced by the stability of Eucalyptus tree abundance (Fig. 5). The increase in Monotoca and Pomaderris on both islands from the Middle Holocene can be linked to the effect of sea-level rise, given the tolerance of both species to salt spray and adaptation to soil disturbance (King Island Natural Resource Management Group, 2002). Nonetheless, divergence in vegetation is reflected in the typical coastal heathland and scrub communities that persisted on Cape Barren Island through the Middle to Late Holocene, while forest continued to be a dominant vegetation component on King Island (Fig. 6). This suggests direct oceanic influence continued to be important in shaping terrestrial vegetation assemblages on the smaller Cape Barren Island in the Late Holocene while climate control remained dominant in shaping vegetation on the larger King Island. Climate dominance likely resumed on the large Flinders Islands near Cape Barren Island as well in the Late Holocene (McWethy et al., Reference McWethy, Haberle, Hopf and Bowman2017).
Insights into southeast Australia’s paleoclimate
Existing studies of southeast Australian paleoclimate and paleoclimatic effect on vegetation and wetland ecosystems generally agree on the increasing influence of ENSO in many parts of the region during the Middle to Late Holocene (Fletcher and Moreno, Reference Fletcher and Moreno2012; Beck et al., Reference Beck, Fletcher, Gadd, Heijnis and Jacobsen2017; McWethy et al., Reference McWethy, Haberle, Hopf and Bowman2017; Barr et al., Reference Barr, Tibby, Leng, Tyler, Henderson, Overpeck and Simpson2019; De Deckker, Reference De Deckker2022). By contrast, Early to Middle Holocene climate across the region has been characterized as gradually warming and wetting, as Southern Westerlies (SW) strengthened, reaching a zenith by the Middle Holocene (Wilkins et al., Reference Wilkins, Gouramanis, De Deckker, Fifield and Olley2013; De Deckker, Reference De Deckker2022). A synthesis study using various data streams suggests a geographically heterogeneous hydroclimatic pattern across southeast Australia during the Early to Middle Holocene (Fletcher and Moreno, Reference Fletcher and Moreno2012) driven by fluctuations in the strength and direction of SW-modulated precipitation gradient. This climate anti-phasing is clearly reflected in plant functional trait responses (e.g., leaf and seed traits) in the region during the Holocene (Adeleye et al., Reference Adeleye, Haberle, Gallagher, Andrew and Herbert2023a), and this climatic pattern is thought to have also prevailed, especially in Tasmania, during the early, middle, and late glacial periods (Fletcher and Thomas, Reference Fletcher and Thomas2010; Fletcher and Moreno, Reference Fletcher and Moreno2012; Adeleye et al., Reference Adeleye, Hopf, Haberle, Stannard, Mcwethy, Harris and Bowman2024).
Our results contrast with previous findings of east–west climate anti-phasing controlled by SW dominance during the Early to Middle Holocene in southeast Australia (Fletcher and Moreno, Reference Fletcher and Moreno2012) and peak wetness in the Middle Holocene across the region (De Deckker, Reference De Deckker2022). Given the well-situated locations of King Island and Cape Barren Island in western and eastern sectors of southeast Australia, respectively, we expect the paleoecology of these islands to reflect the late glacial–Middle Holocene SW-driven climate anti-phasing. However, late glacial–Middle Holocene vegetation on King Island and Cape Barren Island shows a clear transition from dry, open herbaceous to woodland or forest communities (Figs. 5 and 6) that tracks the general post-glacial warming and wetting trend (Wilkins et al., Reference Wilkins, Gouramanis, De Deckker, Fifield and Olley2013; De Deckker, Reference De Deckker2022), with sea-level rise and human land use driving localized dynamics. It is possible that the SW-driven climatic anti-phasing followed a latitudinal gradient in southeast Australia after termination of the last glaciation, with a stronger signal in the higher latitude area of Tasmania than in the Bass Strait and southeast Australian mainland. This may explain why the climate anti-phasing signal was more evident in the vegetation composition and fire regimes in Tasmania (Fletcher and Moreno, Reference Fletcher and Moreno2012; Mariani and Fletcher, Reference Mariani and Fletcher2017) and not in the more northerly Bass Strait Islands.
The Middle Holocene (8–5 cal ka) is thought to be a period of maximum warmth and wetness across southeast Australia (Wilkins et al., Reference Wilkins, Gouramanis, De Deckker, Fifield and Olley2013; De Deckker, Reference De Deckker2022), with the SW bringing more rainfall to western southeast Australia and a reduction in fire activity in western Tasmania at this time (Fletcher and Moreno, Reference Fletcher and Moreno2012). Therefore, we also expected fire activity to be low on King Island in the Middle Holocene, especially given the current lack of archaeological evidence of human occupation at this time, but this was not the case. Fire activity was in fact greatest on the island during this period, accompanied by major forest transformation (Fig. 3a). Relatively dry wetlands (Adeleye et al., Reference Adeleye, Haberle, Hua and Bowman2025) on King Island combined with evidence of weak LC (low rainfall), SST cooling ∼200 km from King Island, and potentially positive IOD phases at this time indicate a Middle Holocene dry episode, at least in western Bass Strait and potentially across the Bass Strait (Fig. 6). ENSO influence was likely more important in eastern Bass Strait at this time, persisting into the Late Holocene. A complex climate system that favored increased rainfall, potentially including negative IOD phases and strong SW influence, is likely to have prevailed on King Island in the Late Holocene.
Conclusion
The new paleoecological record from King Island (western Bass Strait) combined with the existing one from Cape Barren Island (eastern Bass Strait) presented in this study provide an improved understanding of the complexity of the biogeographical and paleoclimatic history of the current Bass Strait islands and submerged Bassian Plains landscape. The spatio-temporal dynamics of floristic composition and drivers of change offer new insights into the paleoclimate of the region and the broader southeast Australia.
Late glacial–Holocene terrestrial vegetation in the Bass Strait area has generally followed a similar trajectory, especially during the late glacial–Middle Holocene, although the drivers of change diverged in the Middle Holocene, triggering a corresponding trajectory divergence between west and east Bass Strait islands. The effect of Middle Holocene sea-level rise was regional, but was greatest on the eastern islands, with the replacement of woodland by coastal heathland communities. A relatively drier period accompanied by major fires transformed forest to forest–scrub communities in western Bass Strait at the same time. Climate and high sea levels maintained Late Holocene vegetation in eastern Bass Strait while vegetation in western Bass Strait was largely shaped by climatic influence.
Vegetation trajectories on both King Island and Cape Barren Island suggest a homogeneous warming and wetting climatic trend prevailed over the Bass Strait area and potentially mainland southeast Australia during the late glacial–Early Holocene. The influence of SW-driven climatic anti-phasing was possibly greatest in the higher latitude of Tasmania. Although conditions may have been wet in some areas of southeast Australia and Tasmania, a combination of climatic events, including weak LC, positive IOD phases, and the onset of ENSO, likely resulted in a dry episode in Bass Strait during the Middle Holocene. The influence of strong SW and negative IOD phases possibly modulated western Bass Strait climate in the Late Holocene, bringing more rainfall to the region, while ENSO intensification drove rainfall declines in eastern Bass Strait.
Acknowledgments
Research on King Island is supported by the Aboriginal Land Council of Tasmania and the Tasmanian Aboriginal Centre. We thank the Working on Country, pakana rangers, and Truwana rangers for guidance and advice while on their country. Permission to core wetlands in the Lavinia State Reserve was granted through the Department of Natural Resources and Environment, Tasmania (No. E22264). Many thanks to the editors and reviewers, especially John Tibby, for his constructive feedback that significantly improved the manuscript. This research was made possible through an Australian Research Council Centre of Excellence for Australian Biodiversity and Heritage support grant CE170100015 (S. Haberle) and Australian Nuclear Science and Technology Organization grant AP13238 (D. Bowman). D. Bowman also acknowledges Laureate grant from the Australian Research Council (FL220100099) and M. Adeleye acknowledges grant from the UK Research and Innovations Future Leaders Fellowship (MR/Y018176/1).
Conflict of interest declaration
Authors declare no conflict of interest.


 Open access