

Introduction
Developing appropriate diagnostics tools, methods and protocols to track parasitic diseases before, during and after control is an important component within the multi-disciplinarity of parasitology. It has been previously highlighted (Stothard and Adams, Reference Stothard and Adams2014) and with regard to schistosomiasis, intestinal schistosomiasis poses a considerable public health burden in Uganda (Loewenberg, Reference Loewenberg2014). Since 2003 there has been an active national control programme against it (Kabatereine et al. Reference Kabatereine, Tukahebwa, Kazibwe, Namwangye, Zaramba, Brooker, Stothard, Kamenka, Whawell, Webster and Fenwick2006, Reference Kabatereine, Brooker, Koukounari, Kazibwe, Tukahebwa, Fleming, Zhang, Webster, Stothard and Fenwick2007; Fenwick et al. Reference Fenwick, Webster, Bosque-Oliva, Blair, Fleming, Zhang, Garba, Stothard, Gabrielli, Clements, Kabatereine, Toure, Dembele, Nyandindi, Mwansa and Koukounari2009; Stanton et al. Reference Stanton, Adriko, Arinaitwe, Howell, Davies, Allison, LaCourse, Muheki, Kabatereine and Stothard2017), as primarily based on preventive chemotherapy campaigns (Montresor et al. Reference Montresor, Gabrielli, Chitsulo, Ichimori, Mariotti, Engels and Savioli2012; Stothard et al. Reference Stothard, Sousa-Figueiredo and Navaratnam2013). Despite much progress in the delivery of praziquantel (PZQ) treatments to school-aged children, infections with Schistosoma mansoni continue to be pervasive, particularly along the immediate shoreline of Lake Albert (Al-Shehri et al. Reference Al-Shehri, Stanton, LaCourse, Atuhaire, Arinaitwe, Wamboko, Adriko, Kabatereine and Stothard2016). Moving some 10–20 km inland, however, infection prevalence by school can decline dramatically, at least if measured by faecal egg-patency for if more sensitive diagnostic tools were used, such as urine-antigen dipsticks, such declines are less precipitous (Stothard et al. Reference Stothard, Kabatereine, Tukahebwa, Kazibwe, Rollinson, Mathieson, Webster and Fenwick2006, Reference Stothard, Kabatereine, Archer, Al-Shehri, Tchuem-Tchuente, Gyapong and Bustinduy2017b).
The incongruence between ‘estimated’ and ‘true’ prevalence is a well-known diagnostic dilemma in surveillance of intestinal schistosomiasis largely due to an operational compromise between imperfect detection tools and insufficient specimen sampling (Bergquist et al. Reference Bergquist, Johansen and Utzinger2009, Reference Bergquist, Yang, Knopp, Utzinger and Tanner2015; Stothard et al. Reference Stothard, Stanton, Bustinduy, Sousa-Figueiredo, Van Dam, Betson, Waterhouse, Ward, Allan, Hassan, Al-Helal, Memish and Rollinson2014; Utzinger et al. Reference Utzinger, Becker, van Lieshout, van Dam and Knopp2015; Weerakoon et al. Reference Weerakoon, Gobert, Cai and McManus2015). Nonetheless, if control programmes are to be monitored effectively and also permit evidence-based adaptation or revision of control tactics (Tchuente et al. Reference Tchuente, Rollinson, Stothard and Molyneux2017), infection dynamics at an individual level need to be captured alongside any broader changes in the epidemiological landscape amenable to measurement (Hawkins et al. Reference Hawkins, Cantera, Storey, Leader and de los Santos2016; Stothard et al. Reference Stothard, Campbell, Osei-Atweneboana, Durant, Stanton, Biritwum, Rollinson, Ombede and Tchuem-Tchuente2017a). As the strive towards elimination grows (Hawkins et al. Reference Hawkins, Cantera, Storey, Leader and de los Santos2016; Colley et al. Reference Colley, Andros and Campbell2017), previous diagnostic shortcomings are revealed highlighting new diagnostic needs that guide future target product profiles (Utzinger et al. Reference Utzinger, Becker, van Lieshout, van Dam and Knopp2015; Weerakoon et al. Reference Weerakoon, Gobert, Cai and McManus2015; Hawkins et al. Reference Hawkins, Cantera, Storey, Leader and de los Santos2016; Savioli et al. Reference Savioli, Albonico, Colley, Correa-Oliveira, Fenwick, Green, Kabatereine, Kabore, Katz, Klohe, Loverde, Rollinson, Stothard, Tchuente, Waltz and Zhou2017; Tchuente et al. Reference Tchuente, Rollinson, Stothard and Molyneux2017).
At an individual level, often the school-aged child, the diagnostic repertoire for surveillance of intestinal schistosomiasis within national control programmes has remained surprisingly meagre; for many years it has been exclusively founded on parasitological methods alone (Stothard et al. Reference Stothard, Stanton, Bustinduy, Sousa-Figueiredo, Van Dam, Betson, Waterhouse, Ward, Allan, Hassan, Al-Helal, Memish and Rollinson2014), with only sporadic application of serological methods (Chernet et al. Reference Chernet, Kling, Sydow, Kuenzli, Hatz, Utzinger, van Lieshout, Marti, Nickel, Labhardt and Neumayr2017; Hinz et al. Reference Hinz, Schwarz, Hahn and Frickmann2017). With the growing need for modernization and interest in adoption of more sensitive disease diagnostics in general (Mabey et al. Reference Mabey, Peeling, Ustianowski and Perkins2004; Solomon et al. Reference Solomon, Engels, Bailey, Blake, Brooker, Chen, Chen, Churcher, Drakeley, Edwards, Fenwick, French, Gabrielli, Grassly, Harding-Esch, Holland, Koukounari, Lammie, Leslie, Mabey, Rhajaoui, Secor, Stothard, Wei, Willingham, Zhou and Peeling2012; Stothard and Adams, Reference Stothard and Adams2014), in recent years there have been two important developments that centre upon scale-up in the use of urine-circulating cathodic antigen (CCA) dipsticks (Colley et al. Reference Colley, Binder, Campbell, King, Tchuente, N'Goran, Erko, Karanja, Kabatereine, van Lieshout and Rathbun2013; Sousa-Figueiredo et al. Reference Sousa-Figueiredo, Betson, Kabatereine and Stothard2013; Foo et al. Reference Foo, Blackstock, Ochola, Matete, Mwinzi, Montgomery, Karanja and Secor2015; Danso-Appiah et al. Reference Danso-Appiah, Minton, Boamah, Otchere, Asmah, Rodgers, Bosompem, Eusebi and De Vlas2016; Greter et al. Reference Greter, Krauth, Ngandolo, Alfaroukh, Zinsstag and Utzinger2016; Kittur et al. Reference Kittur, Castleman, Campbell, King and Colley2016) and development of DNA-detection platforms with real-time PCR with parasite-specific TaqMan® hydrolysis probes (ten Hove et al. Reference ten Hove, Verweij, Vereecken, Polman, Dieye and van Lieshout2008; Mejia et al. Reference Mejia, Vicuna, Broncano, Sandoval, Vaca, Chico, Cooper and Nutman2013; Easton et al. Reference Easton, Oliveira, O'Connell, Kepha, Mwandawiro, Njenga, Kihara, Mwatele, Odiere, Brooker, Webster, Anderson and Nutman2016). Furthermore, recent application of more sophisticated statistical modelling such as latent class analysis (LCA) (Hadgu et al. Reference Hadgu, Dendukuri and Hilden2005), has advanced diagnostic tool performance comparisons beyond the direct need of a fixed reference ‘gold’ standard which, for schistosomiasis, is something we currently do not have (Shane et al. Reference Shane, Verani, Abudho, Montgomery, Blackstock, Mwinzi, Butler, Karanja and Secor2011; Ibironke et al. Reference Ibironke, Koukounari, Asaolu, Moustaki and Shiff2012; Koukounari et al. Reference Koukounari, Donnelly, Moustaki, Tukahebwa, Kabatereine, Wilson, Webster, Deelder, Vennervald and van Dam2013; Beltrame et al. Reference Beltrame, Guerriero, Angheben, Gobbi, Requena-Mendez, Zammarchi, Formenti, Perandin, Buonfrate and Bisoffi2017).
In this study, we attempt to make a diagnostic comparison for surveillance of intestinal schistosomiasis in school children across five primary schools using four methods namely: microscopy of duplicate Kato-Katz smears from two consecutive stools, urine-CCA dipsticks, real-time PCR of stool with a Schistosoma-specific Taqman® probe and serological analysis of finger-prick blood for antibodies against schistosome soluble egg antigen (SEA). Diagnostic congruence was first assessed by empirical cross-tabulations, assuming a ‘gold standard’, then later by LCA with disease prevalence by school also estimated with a LCA model.
Methods
Study area, participants and ethical approval
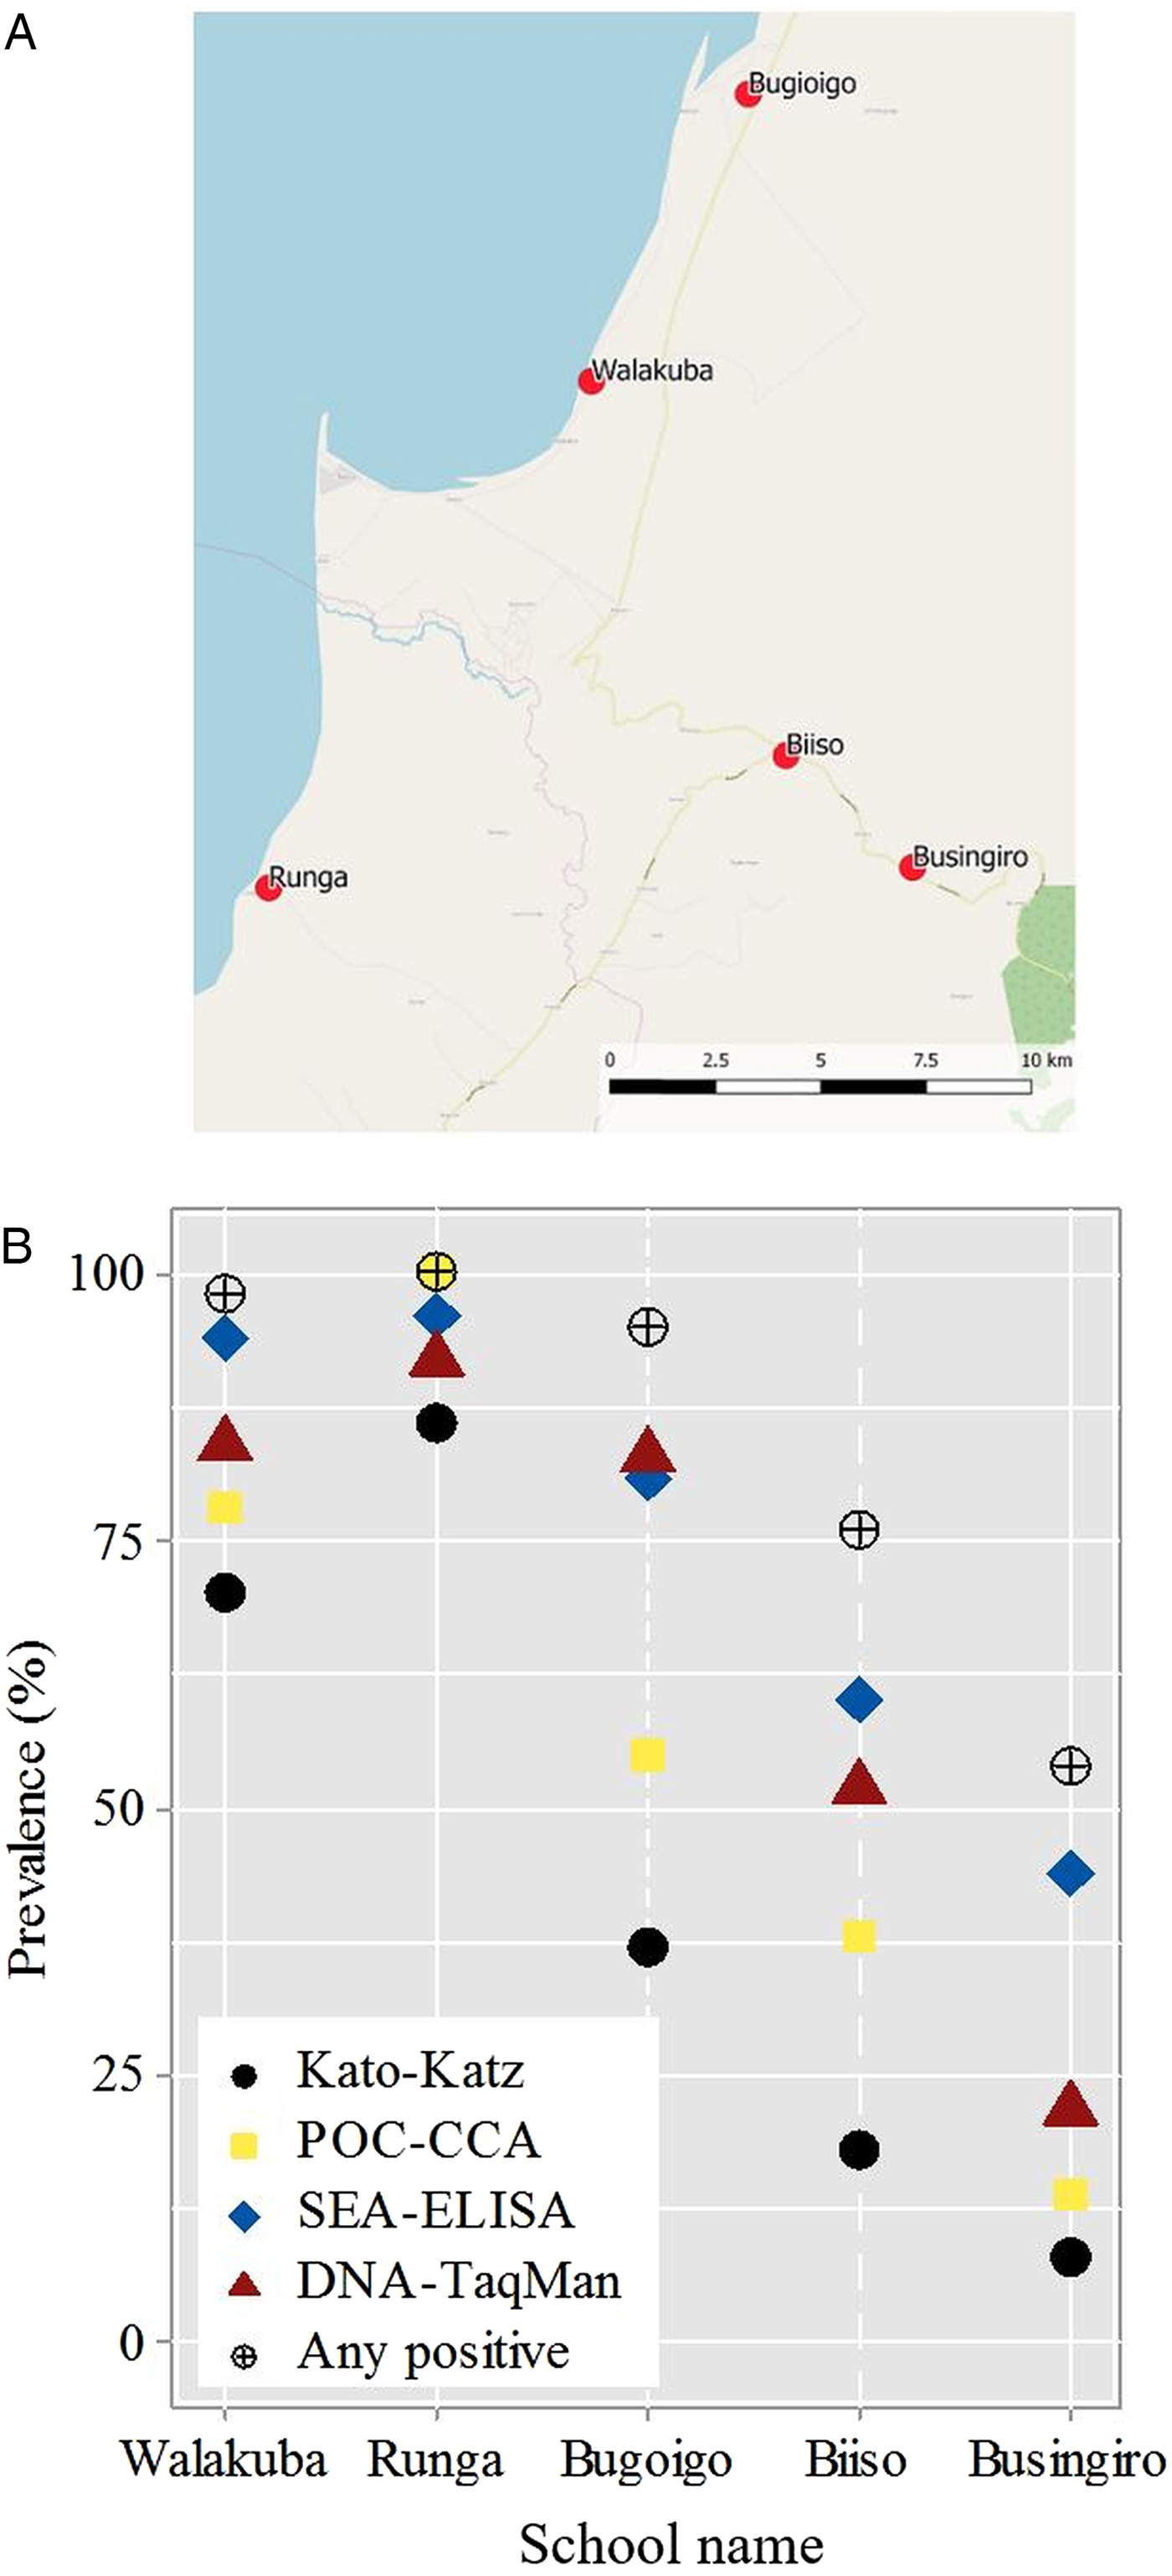
Field sampling and examinations of children took place in May 2015 in five primary schools in Buliisa District located within the Lake Albert region, three of which have been visited previously as sentinel surveillance sites of the national control programme (Kabatereine et al. Reference Kabatereine, Brooker, Koukounari, Kazibwe, Tukahebwa, Fleming, Zhang, Webster, Stothard and Fenwick2007) and the global positioning system locations (GPS) known (Fig. 1). The schools Walakuba (GPS 01°50.323N, 031°22.740E), Bugoigo (GPS 01°54.004N, 031°24.750E) and Runga (GPS 01°43.828N, 031°18.603E) were located on the immediate shoreline while Biiso (GPS 01°45.516N, 031°25.236E) and Busingiro (GPS 01°44.090N, 031°26.855E) were over 10 km away inland which aimed to represent the current control landscape across high- and low-endemic settings, respectively.
(A) Schematic map of the five sampled primary schools in the Lake Albert region, the blue area indicates Lake Albert. (B) Estimated prevalence of Schistosoma mansoni by school for each examined diagnostic test; prevalence by any positive test criterion is also illustrated.
After obtaining written informed consent and verbal assent, a pre-target of 60 children of balanced gender aged between 5 and 10 years of age were enrolled and requested to provide two stool samples on consecutive days, a single urine sample and single finger-prick blood sample. Children were also interviewed with a standardized questionnaire to ascertain recent PZQ treatment history. All participants were provided with a single PZQ (40 mg/kg) treatment by the attending nurse following WHO guidelines (Montresor et al. Reference Montresor, Crompton, Hall, Bundy and Savioli1998). The Ugandan Council for Science and Technology and the Liverpool School of Tropical Medicine granted approval for this study.
Diagnostics: faecal microscopy with Kato-Katz
Duplicate Kato-Katz thick smear slides (41.7 mg templates) were prepared from each stool received after first sieving through a 212 µ m metal mesh (Montresor et al. Reference Montresor, Crompton, Hall, Bundy and Savioli1998). Schistosome eggs were viewed by microscopy (×100 magnification), quantified and expressed as eggs per gram (EPG) of faeces with the intensity of infection classified as: light (1–99 EPG), medium (100–399 EPG) and heavy (⩾400 EPG) following the WHO guidelines (Montresor et al. Reference Montresor, Crompton, Hall, Bundy and Savioli1998). For later DNA analysis, a 0.8 g aliquot of sieved stool was each prepared and stored in 95% ethanol before transportation to the UK for processing.
Diagnostics: schistosome urine-antigen CCA dipsticks
The commercially available urine-CCA dipstick was used to test for schistosome antigens in each urine sample received following manufacturer's instructions (Rapid Medical Diagnostics, Pretoria, South Africa). The test result was classified by visual inspection against a colour chart as used previously (Sousa-Figueiredo et al. Reference Sousa-Figueiredo, Betson, Kabatereine and Stothard2013), by two individuals as negative, trace (±), light positive (+), medium positive (++) and heavy positive (+++). In this setting, all trace reactions were later considered to be positive as justified previously upon biological causality and by prior epidemiological analyses (Standley et al. Reference Standley, Adriko, Arinaitwe, Atuhaire, Kazibwe, Fenwick, Kabatereine and Stothard2010a, Reference Standley, Lwambo, Lange, Kariuki, Adriko and Stothardb; Sousa-Figueiredo et al. Reference Sousa-Figueiredo, Betson, Kabatereine and Stothard2013; Adriko et al. Reference Adriko, Standley, Tinkitina, Tukahebwa, Fenwick, Fleming, Sousa-Figueiredo, Stothard and Kabatereine2014).
Diagnostics: schistosome serology with SEA-enzyme-linked immunosorbent assay (ELISA)
Finger-prick blood was taken from each child and antibodies for SEA were tested using 1 : 40 dilution of harvested sera using a field-based ELISA test following manufacturer's instructions (IVD Inc.; Carlsbad, USA). Upon completion, the micro-titre plate was placed on a white card to view the visual colour of each reaction as graded into pale yellow (light positive), yellow (medium positive) and dark yellow (heavy positive) as recorded previously (Stothard et al. Reference Stothard, Sousa-Figueiredo, Standley, Van Dam, Knopp, Utzinger, Ameri, Khamis, Khamis, Deelder, Mohammed and Rollinson2009).
DNA diagnostics: TaqMan® real-time PCR
After transfer to the UK, each aliquot of stool was spiked with Phocine Herpes Virus (PhHV-1) to act as an internal control for each DNA extraction and later real-time PCR assay for inhibition following protocols of Meurs et al. (Reference Meurs, Brienen, Mbow, Ochola, Mboup, Karanja, Secor, Polman and van Lieshout2015) which targetted a 77 base pair segment within the ribosomal internal transcribed spacer (ITS-2) region which can be identified using S. mansoni (GenBank: AF503487) as reference sequence (Obeng et al. Reference Obeng, Aryeetey, de Dood, Amoah, Larbi, Deelder, Yazdanbakhsh, Hartgers, Boakye, Verweij, van Dam and van Lieshout2008; Meurs et al. Reference Meurs, Brienen, Mbow, Ochola, Mboup, Karanja, Secor, Polman and van Lieshout2015). Schistosome DNA was detected with the Schistosoma-specific primers of Ssp48F (GGT CTA GAT GAC TTG ATY GAG ATG CT) and Ssp124R (TCC CGA GCG YGT ATA ATG TCA TTA) and TaqMan® probe Ssp78T (ROX – TGG GTT GTG CTC GAG TCG TGGC – Black Hole Quencher 3) as developed by (Obeng et al. Reference Obeng, Aryeetey, de Dood, Amoah, Larbi, Deelder, Yazdanbakhsh, Hartgers, Boakye, Verweij, van Dam and van Lieshout2008; Meurs et al. Reference Meurs, Brienen, Mbow, Ochola, Mboup, Karanja, Secor, Polman and van Lieshout2015). DNA-TaqMan® assays were performed in a Chromo-4 with Opticon monitor Version 3.1. (Biorad, Hemel Hempstead, UK) with Biorad iQ™ supermix and thermal cycling conditions of 15 min at 95 °C, followed by 45 cycles, each of 15 s at 95 °C and 60 s at 60 °C. The infection intensity was classified according to C t values: negative (C t > 45), light positive (35 > C t ⩽ 45), medium positive (25 > C t ⩽ 35), and heavy positive (C t ⩽ 25).
Data management and statistical analysis
All data collected in the field and processed in the laboratory were recorded on proforma data sheets. These were then double entered in Microsoft Excel prior to the generation of summary tables for prevalence and intensity of infection (Tables 1 and 2). Empirical estimates of sensitivity, specificity, negative predictive value and positive predictive value was calculated in R statistical package v 2·10·1 (The R Foundation for Statistical Computing, Vienna, Austria) and SPSS software (v 24.0, SPSS Inc., IBM, USA) assuming the urine-CCA as the ‘gold’ standard against the remaining three diagnostic tests (Table 3). For percentage values, 95% confidence intervals (95% CI) were estimated using the exact method (Armitage and Berry, Reference Armitage and Berry1994). We have decided to assume the urine-CCA as the gold standard for our descriptive analyses (i.e. empirical estimates of diagnostic performance), since there have been extensive evaluations of urine-CCA dipsticks (Colley et al. Reference Colley, Binder, Campbell, King, Tchuente, N'Goran, Erko, Karanja, Kabatereine, van Lieshout and Rathbun2013) and WHO recommendation of its use in surveillance mapping (Danso-Appiah et al. Reference Danso-Appiah, Minton, Boamah, Otchere, Asmah, Rodgers, Bosompem, Eusebi and De Vlas2016).
Prevalence (%) of Schistosoma mansoni according to each diagnostic test across five primary schools with 95% confidence intervals
Intensity of infection categories for Schistosoma mansoni by each examined diagnostic test across the five primary schools
aDuplicate faecal smears from two consecutive stools.
Empirical estimates of sensitivity (SS), specificity (SP), negative predictive value (NPV) and positive predictive value (PPV), Cohen's kappa for each diagnostic test against urine-CCA dipstick as ‘gold standard’
Subsequently, to tackle the inherent problems with diagnostic measurement error, we employed a LCA and full information maximum likelihood estimation (Table 4). LCA allows grouping of categorical data (in the current study not infected and infected from the diagnostic tests under examination) into latent classes indicating S. mansoni infection via a probability model. Given the well-known epidemiological landscape of Lake Albert region, such a model was designed to allow LCA estimated prevalence of S. mansoni to vary by school (Table 4). Through this approach, model-based estimates of sensitivity and specificity across diagnostic tests without assuming a gold standard were also obtained.
Latent class analysis (LCA) estimates of sensitivity and specificity and LCA model of prevalence of Schistosoma mansoni by school with 95% CIs for each diagnostic method
The classification certainty of this model was evaluated through entropy; values of entropy near one indicate high certainty in classification while values near zero indicate low certainty (Celeux and Soromenho, Reference Celeux and Soromenho1996). LCA assumes the relationships between the observed variables (i.e. diagnostic tests in the current study) are accounted for by their class membership and thus conditioning on class membership (i.e. the disease status in the current study) such that if the model estimated disease status is misclassified by one test, the probability that it will be misclassified by another test will not be affected. We assessed this assumption by speculating the standardized residuals for each response pattern from the diagnostic tests as estimated from the LCA model. Further technical details of these models in the context of schistosomiasis have been described elsewhere and thus they are not repeated here (Ibironke et al. Reference Ibironke, Koukounari, Asaolu, Moustaki and Shiff2012). The LCA model was fitted using MPlus version 7.3 (Muthén and Muthén, Reference Muthén and Muthén1998–2012).
Results
Prevalence of intestinal schistosomiasis
A total data set was assembled from 258 children with a prevalence of intestinal schistosomiasis by each diagnostic test presented, see Table 1. Overall prevalence of intestinal schistosomiasis was: 44.1% (95% CI 38.0–50.2) by microscopy of duplicate Kato-Katz smears from two consecutive stools, 56.9% (95% CI 50.8–63.0) by urine-CCA dipstick, 67.4% (95% CI 61.6–73.1) by DNA-TaqMan® and 75.1% (95% CI 69.8–80.4) by SEA-ELISA.
The prevalence of infection at Runga and Walakuba was observed to be highest, exceeding 50% in all diagnostic tests, whereas prevalence of infection at Busingiro was lowest falling well short of 50% by any test, although pooling infection status upon being positive by any test revealed that just under half of the children attending this school could be considered ‘free’ from infection. For the total dataset, just over a quarter of children (n = 69) could be considered to have no evidence of intestinal schistosomiasis.
The geographical proximity of each of the five schools to Lake Albert shoreline is depicted in schematic in Fig. 1A; on-the-ground shortest distance to the lake shoreline can be ranked in the following order of Walakuba (0.2 km), Runga (0.4 km), Bugoigo (0.9 km), Biiso (9.4 km) and Busingiro (13.2 km). Notably, both Runga and Bugoigo schools are located for safety and convenience on slightly higher ground behind each village so as not to flood, which during wetter periods has detrimentally affected Walakuba in the past (J.R.S., personal observation). Whilst diagnostic comparisons are made on the basis of binary data, it is worth noting that infection intensity also varied by school setting, in that ‘heavy intensity’ infections or ‘strong positive’ by any test were particularly common at Runga but were rare at Busingiro, Table 2. As shown in Fig. 1B the changing prevalence by school for each method is clearly visible in that the prevalence of inferred from each diagnostic test typically followed a static ascending order or monotonic series of Kato-Katz, urine-CCA dipstick, DNA-TaqMan® and SEA-ELISA, although the relative position of the estimated prevalence by urine-CCA at Runga slightly exceeds SEA-ELISA and DNA-TaqMan®.
Empirical and LCA modelling of estimates of diagnostic performance
Assuming the urine-CCA as an arbitrary gold standard, the diagnostic performance for the three remaining tests is shown along with diagnostic accuracy and Cohen's kappa statistic, Table 3. The sensitivity of SEA-ELISA is the highest (96.6%) but also has the lowest specificity (53.2%), with the highest negative predictive value of all methods. By contrast, the sensitivity of Kato-Katz is the lowest (76.9%) but also has the highest specificity (99.1%), with the highest positive predictive value of all methods.
On the basis of LCA analysis the sensitivity and specificity of each method can be estimated on the basis of their latent class assignment which highlights the trade-off between diagnostic specificity (i.e. false positive) and sensitivity (i.e. false negative). In this analysis, sensitivity and specificity of SEA-ELISA and urine-CCA are broadly equivalent with DNA-TaqMan® appearing to have slightly lower sensitivity and specificity. Estimating the prevalence of infection by school with LCA, Table 4, reveals a lower prevalence than that on the basis of positivity by any test but follows the same static ascending order or monotonic series (Fig. 1B). It is evident that at Runga intestinal schistosomiasis is universal whereas at Busingiro around 9.6% of children are suspected of harbouring infections.
The LCA model generated similar sensitivity for SEA-ELISA and urine-CCA but was slightly lower for DNA-TaqMan®, Table 4. Kato-Katz was again shown through LCA to have the highest specificity among all the four tests. The specificity of 89.3% (95% CI 80.9–97.6) for the urine-CCA test was acceptable but for the SEA-ELISA and the DNA-TaqMan, specificities were less so and estimated to be 49.5% (95% CI 39.4–59.6) and 57.5% (95% CI 48.6–66.5), trending as with empirical calculations, see Table 3. Furthermore, LCA estimated infection prevalence of S. mansoni by the school to be lower than that on the basis of positivity by any test (for the latter see Fig. 1B). Nevertheless, both of these approaches suggested that intestinal schistosomiasis was universal at Runga, however, at Busingiro LCA estimated a prevalence of S. mansoni infection to be 9.6% (95% CI 9.0−18.4), much lower than that revealed by positivity upon any test. Finally, the entropy of the LCA model was estimated to be 0.921. This indicated a clear delineation of classes in the fitted model standardized residuals for each response pattern from the four diagnostic tests from this model were between −2 and 2, evidencing that local independence of the four diagnostic tests is not obviously violated.
Discussion
Owing to the complicated developmental and population biology of the schistosome within the mammalian host, it is well known that accurate detection of intestinal schistosomiasis by any biomarker can be problematic and has been the topic of at-length discussions previously (Bergquist et al. Reference Bergquist, Johansen and Utzinger2009, Reference Bergquist, Yang, Knopp, Utzinger and Tanner2015; Stothard et al. Reference Stothard, Stanton, Bustinduy, Sousa-Figueiredo, Van Dam, Betson, Waterhouse, Ward, Allan, Hassan, Al-Helal, Memish and Rollinson2014; Utzinger et al. Reference Utzinger, Becker, van Lieshout, van Dam and Knopp2015). Foremost, the insensitivity of the Kato-Katz, especially in the detection of light egg-patent infections or in patients with a recent history of PZQ treatment, is perhaps the most obvious obstacle to overcome (Kongs et al. Reference Kongs, Marks, Verle and Van der Stuyft2001; Koukounari et al. Reference Koukounari, Donnelly, Moustaki, Tukahebwa, Kabatereine, Wilson, Webster, Deelder, Vennervald and van Dam2013; Leuenberger et al. Reference Leuenberger, Nassoro, Said, Fenner, Sikalengo, Letang, Montresor, Zhou, Steinmann, Marti, Utzinger and Knopp2016).
Indeed, how we debate and assess the significance of egg-negative infections is changing alongside measuring morbidity associated with intestinal schistosomiasis which goes beyond what Kato-Katz assessments can offer (King, Reference King2015). Nevertheless, Kato-Katz can still be promoted as a field-applicable standalone and appropriate in high-endemic settings, as seen here in both Runga and Walakuba, where prevalence and intensity of infection were high. Nonetheless, Kato-Katz has several deficits when applied to lower transmission settings, as exemplified by the other schools sampled here and is more misleading perhaps than informative. To compensate, de Vlas et al. (Reference de Vlas, Gryseels, Vanoortmarssen, Polderman and Habbema1993) developed a useful corrective prevalence chart which took into account infection intensity; however, its uptake was not as good as anticipated (de Vlas et al. Reference de Vlas, Gryseels, Vanoortmarssen, Polderman and Habbema1993). It is also outside the scope of the present paper to discuss economic cost–benefit of faecal microscopy (Meheus et al. Reference Meheus, Burza, Becker, N'Goran, Sacko, Polman, Chappuis, Boelaert and Utzinger2015) other than that mobile microscopy with handheld devices offers some attractive cost-saving solutions for surveillance of intestinal schistosomiasis in high-endemic areas (Stothard et al. Reference Stothard, Kabatereine, Tukahebwa, Kazibwe, Mathieson, Webster and Fenwick2005; Bogoch et al. Reference Bogoch, Coulibaly, Andrews, Speich, Keiser, Stothard, N'Goran and Utzinger2014). However, as control programmes move forward towards elimination, the Kato-Katz methodology will be inappropriate and will be unable to provide sufficient quality epidemiological information for precision mapping of disease foci (Tchuente et al. Reference Tchuente, Rollinson, Stothard and Molyneux2017). The latter is pivotal in the local intensification of delivery of treatments and surveillance interventions to confirm interruption of transmission (Rollinson et al. Reference Rollinson, Knopp, Levitz, Stothard, Tchuente, Garba, Mohammed, Schur, Person, Colley and Utzinger2013; Stothard et al. Reference Stothard, Campbell, Osei-Atweneboana, Durant, Stanton, Biritwum, Rollinson, Ombede and Tchuem-Tchuente2017a). Indeed from the information reported here, we would suggest that control efforts in locations such as Busingiro should be intensified rather than reduced.
Of the remaining diagnostic methods, the diagnostic pros and cons of each method have been discussed elsewhere often using the ASSURED framework (Bergquist et al. Reference Bergquist, Johansen and Utzinger2009; Stothard et al. Reference Stothard, Stanton, Bustinduy, Sousa-Figueiredo, Van Dam, Betson, Waterhouse, Ward, Allan, Hassan, Al-Helal, Memish and Rollinson2014; Utzinger et al. Reference Utzinger, Becker, van Lieshout, van Dam and Knopp2015). DNA-TaqMan® methods are, however, increasingly gaining favour and offer a multiplex DNA-platform for co-detection of several neglected tropical diseases as well as many other infectious agents (Verweij and Stensvold, Reference Verweij and Stensvold2014); much more so than other any other current biomarker method can provide (ten Hove et al. Reference ten Hove, Verweij, Vereecken, Polman, Dieye and van Lieshout2008; Solomon et al. Reference Solomon, Engels, Bailey, Blake, Brooker, Chen, Chen, Churcher, Drakeley, Edwards, Fenwick, French, Gabrielli, Grassly, Harding-Esch, Holland, Koukounari, Lammie, Leslie, Mabey, Rhajaoui, Secor, Stothard, Wei, Willingham, Zhou and Peeling2012; Mejia et al. Reference Mejia, Vicuna, Broncano, Sandoval, Vaca, Chico, Cooper and Nutman2013; Easton et al. Reference Easton, Oliveira, O'Connell, Kepha, Mwandawiro, Njenga, Kihara, Mwatele, Odiere, Brooker, Webster, Anderson and Nutman2016). There also is the suggestion that DNA-TaqMan® could become an acceptable ‘gold’ standard (Meurs et al. Reference Meurs, Brienen, Mbow, Ochola, Mboup, Karanja, Secor, Polman and van Lieshout2015), and whilst we ultimately share some enthusiasm in this there are some impediments to discuss. Foremost, DNA-TaqMan® requires specialist equipment and is not currently amenable to point-of-contact settings although there is growing interest in the use of more field-friendly methods (Minetti et al. Reference Minetti, LaCourse, Reimer and Stothard2016), such as loop-mediated iso-thermal amplification (LAMP) (He et al. Reference He, Song, Xie, Liang, Yuan, Wu and Lv2016) and recombinase polymerase amplification (RPA) (Rosser et al. Reference Rosser, Rollinson, Forrest and Webster2015). Nonetheless, from our results here the DNA-TaqMan® has been somewhat outperformed upon consideration of Table 4. In our opinion, perhaps the most significant advantage of DNA-based platform is that DNA-TaqMan® assays can cross-over into environmental monitoring through detection of environmental (e)DNA and therefore broaden the vision of schistosomiasis control in general potentially uniting clinical and environmental surveillance (Rollinson et al. Reference Rollinson, Knopp, Levitz, Stothard, Tchuente, Garba, Mohammed, Schur, Person, Colley and Utzinger2013; Stothard et al. Reference Stothard, Campbell, Osei-Atweneboana, Durant, Stanton, Biritwum, Rollinson, Ombede and Tchuem-Tchuente2017a).
In the absence of a ‘gold’ standard diagnostic test and complexity of the changing epidemiological landscape in which tests are being applied in Uganda (Standley et al. Reference Standley, Adriko, Arinaitwe, Atuhaire, Kazibwe, Fenwick, Kabatereine and Stothard2010a, Reference Standley, Lwambo, Lange, Kariuki, Adriko and Stothardb; Adriko et al. Reference Adriko, Standley, Tinkitina, Tukahebwa, Fenwick, Fleming, Sousa-Figueiredo, Stothard and Kabatereine2014; Al-Shehri et al. Reference Al-Shehri, Stanton, LaCourse, Atuhaire, Arinaitwe, Wamboko, Adriko, Kabatereine and Stothard2016), our analysis presented in Table 3 postulated that urine-CCA dipsticks could be an ‘error-free’ standard which, in Table 4, was further explored by LCA. Here the probabilistic statistical model applied does not assume any ‘gold’ standard and therefore points towards the urine-CCA as having near-optimal diagnostic scores of sensitivity (99.1%) and specificity of (89.3%). Moreover, these scores are significantly better than those reported previously by empirical comparisons (Stothard et al. Reference Kabatereine, Tukahebwa, Kazibwe, Namwangye, Zaramba, Brooker, Stothard, Kamenka, Whawell, Webster and Fenwick2006) and illustrate how advances in statistical modelling developed elsewhere on urine-CCA dipsticks (Knopp et al. Reference Knopp, Corstjens, Koukounari, Cercamondi, Ame, Ali, de Dood, Mohammed, Utzinger, Rollinson and van Dam2015; Koukounari et al. Reference Koukounari, Donnelly, Moustaki, Tukahebwa, Kabatereine, Wilson, Webster, Deelder, Vennervald and van Dam2013) can provide a deeper insight into diagnostic score evaluations over and above simple empirical calculations (Colley et al. Reference Colley, Binder, Campbell, King, Tchuente, N'Goran, Erko, Karanja, Kabatereine, van Lieshout and Rathbun2013; Danso-Appiah et al. Reference Danso-Appiah, Minton, Boamah, Otchere, Asmah, Rodgers, Bosompem, Eusebi and De Vlas2016). Nonetheless a theoretical issue of adopting LCA-models exclusively is an assumption of independence of tests which, given the biological biomarkers employed here could be somewhat confounded; Kato-Katz detects eggs directly, DNA-TaqMan® measures Schistosoma-DNA in stool (presumably from excreted eggs) and SEA-ELISA detects antibodies to secreted egg-antigens, thus these three methods are somewhat interrelated to similar biomarkers of the egg itself although will have each have differing physical, biochemical and physiological components. However, the urine-CCA dipstick is less directly connected to egg-biomarkers for it utilizes carbohydrate-antigens released from feeding worms of either sex and hence offers an alternative biomarker appraisal. Since violations of the conditional independence assumption can lead to biased LCA estimates of accuracy and prevalence, performing and reporting checks of whether assumptions are met is essential which was why we compared LCA estimates of diagnostic performance with empirical ones, drawing conclusions for each of the diagnostic tests used. In addition, speculation of standardized residuals from the LCA model indicated that the assumption of local independence of the four diagnostic tests under examination was not obviously violated.
Over and above the routine diagnostic scores of sensitivity, specificity, negative and positive predictive values with or without LCA models, however, it is also necessary to further consider each diagnostic tool against the ASSURED criteria. This seeks to understand whether a diagnostic test can be used at scale and is ultimately useful in several clinical and epidemiological surveillance settings (Mabey et al. Reference Mabey, Peeling, Ustianowski and Perkins2004; Peeling et al. Reference Peeling, Mabey, Herring and Hook2006; Stothard and Adams, Reference Stothard and Adams2014). The roll-out of the urine-CCA test has been discussed previously (Stothard, Reference Stothard2009) and it is pleasing to see it become further endorsed at the policy level (Danso-Appiah et al. Reference Danso-Appiah, Minton, Boamah, Otchere, Asmah, Rodgers, Bosompem, Eusebi and De Vlas2016). The most desirable features of this test are its affordability, stable commercial production, the use of urine-sampling, the speed of test and a short time to obtain results which has a very pragmatic consideration for the end-user in this emphasis. All of the above potentially make dissemination of epidemiological results back to the local community obtained by the urine-CCA dipstick much quicker, which is vital to increase local ownership of preventive chemotherapy campaigns in future (Tchuente et al. Reference Tchuente, Rollinson, Stothard and Molyneux2017).
Concluding remarks
The study has shown that intestinal schistosomiasis continues to be a public health challenge on the shoreline of Lake Albert which now presents as a heterogenous epidemiological landscape of high- and low-transmission settings. A total of four diagnostic tests were each assessed regarding contemporary surveillance for intestinal schistosomiasis finding that Kato-Katz sampling is a satisfactory diagnostic standalone in high-transmission settings but in low-transmission settings should be augmented or replaced by urine-CCA dipsticks. DNA-TaqMan® appears suitable in both endemic settings though is only implementable if resources permit. In low-transmission settings, SEA-ELISA remains the method of choice to evidence an absence of infection. In the dearth of a diagnostic ‘gold’ standard for intestinal schistosomiasis, LCA offered useful computations of diagnostic performance between tests.
Acknowledgements
We thank the children and teachers who took part in this survey; to the VCD field team stationed at Bugoigo Camp for their help during fieldwork and assistance of John Archer and Francesca Poole. JRS and HA-S would like to thank Jaco Verweij and Lisette van Lieshout for sharing their technical skill and advice on helminth diagnostics. We thank David Lambillotte of IVD-diagnostics for a donation of the SEA-ELISA tests used here. We are also grateful to the British Society for Parasitology for helping to support the work of HA-S and support the Autumn Symposium on multi-disciplinarity of parasitology. JRS is Director of COUNTDOWN, a DFID supported implementation consortium.
Financial support
The research was funded by Ministry of Health Uganda, Liverpool School of Tropical Medicine and PhD training scholarship awarded to HA-S by Kingdom of Saudi Arabia. MCS holds an MRC-population health fellowship. This study also benefited directly from prior support from The Wellcome Trust as part of the Schistosomiasis in Mothers and Infants study (project 085440).


 Open access