







1. Introduction
In the natural world, in industry and in laboratory experiments, there are always junctions between pipes of different diameters, i.e. contractions or expansions or constrictions. In this paper, we consider the two-dimensional planar versions, which are kinder numerically and easier to analyse theoretically. The junctions are normally abrupt with sharp corners. Sharp corners are particularly problematic for numerical studies of viscoelastic fluids, so sometimes the corners are rounded. We consider instead a slowly varying geometry, which is even kinder numerically, and which permits considerable theoretical progress.
The principal concern for viscoelastic fluids flowing through a contraction is the formation of long recirculating eddies upstream of the contraction; see Boger (Reference Boger1987). In these eddies, fluid might continue a chemical reaction or might change temperature. Should there then be a fluctuation in the driving pressure, fluid might be expelled from these eddies, producing an undesirable non-uniform output from the contraction. Due to our slowly varying geometry, we have not seen any recirculating eddies in all the cases that we have studied.
Instead of recirculating upstream eddies, our principal concern will be the pressure drop driving the fluid through the contraction. Because viscoelastic stresses can be slow to relax downstream of the contraction, it is necessary to consider an extended geometry of the contraction with sufficiently long entrance and exit sections. The effect of the contraction is then measured by a so-called ‘Couette correction’, which is the pressure drop over the extended geometry minus the pressure drop of a Newtonian viscous fluid over the entrance and exit sections, using a Newtonian fluid with the viscosity equal to that of the viscoelastic fluid at zero shear-rate, all suitably non-dimensionalised.
For the choice of viscoelastic fluid, we consider the Oldroyd-B model fluid. It is the simplest combination of a viscous stress and an elastic stress. There are many other possibilities. Before investigating those more complicated possibilities, it is useful to find the response of the simplest model. More than finding the response, we seek to understand why the model responds in the way that it does. One can then contemplate what is needed from the more complicated alternative models.
The pressure drop of a viscoelastic fluid flowing through a contraction has been studied before, in experiments with polymer solutions and in numerical solutions for the Oldroyd-B and other model fluids. Studying experimentally the flow of Boger and Newtonian fluids with the same shear viscosity through axisymmetric and planar orifices (large contractions with no exit channel), Binding & Walters (Reference Binding and Walters1988) found in their figure 16 that the pressure drop increased linearly with the flow rate up to a critical flow, beyond which the Boger fluid required higher pressures.
In a pair of experimental papers, Cartalos & Piau (Reference Cartalos and Piau1992a,Reference Cartalos and Piaub) studied the flow through an axisymmetric constriction of moderately dilute solutions of polyacrylamide and of polyethylene oxide dissolved in viscous solvents. Figure 6 of the first paper shows the pressure drop increasing linearly with the flow rate, then increasing more rapidly before increasing linearly again. In figures 7(b) and 8(b) of the second paper, the pressure drop divided by the value for a purely viscous fluid is shown to increase by an order of magnitude. There is an interesting discussion after equation (23) in Cartalos & Piau (Reference Cartalos and Piau1992a) of an advantage of the constriction geometry that, because the normal stresses relax downstream to their upstream values, there is no difference between the pressure difference and the difference of the full stress including pressure, viscous and elastic stresses. We shall return to this issue in § 3.5.
In another pair of experimental papers, Rothstein & McKinley (Reference Rothstein and McKinley1999, Reference Rothstein and McKinley2001) used a polystyrene Boger fluid in an axisymmetric 4 : 1 : 4 constriction. In figure 7 of the first paper, the pressure drop divided by the value for a purely viscous fluid is shown to increase by a factor of 3 by a Deborah number  $De=6$, and then level off. A similar increase was found in figure 4 of the second paper for different constriction ratios of 2 and 8.
In finite-element simulations of an Oldroyd-B fluid with rather coarse meshes for an abrupt planar 4 : 1 contraction, Keunings & Crochet (Reference Keunings and Crochet1984) find in their figure 12 that the Couette correction decreases for  $0\le De\le 0.5$. These simulations were extended to $De=20$ in figure 4 of Debbaut, Marchal & Crochet (Reference Debbaut, Marchal and Crochet1988), with a fairly linear decrease in the Couette correction. Before their figure 4, the authors note that a long downstream section of some 250 radii in length is required to calculate the Couette correction reliably to $De=30$. We shall take up this problem in § 4 on the exit channel. Alves, Oliveira & Pinho (Reference Alves, Oliveira and Pinho2003) made some particularly accurate simulations of a planar 4 : 1 contraction with a clear linear decrease of the Couette correction in their figure 5 up to $De=5$. Finally, Binding, Phillips & Phillips (Reference Binding, Phillips and Phillips2006) found in their figure 7 that the normalised excess pressure drop decreased linearly for a contraction, decreased linearly although less for a constriction, and increased linearly just a little for an expansion, all with rounded corners and $De<1$. There are many other numerical works, with planar and axisymmetric geometries, and for other rheological equations of state.
Our own numerical and theoretical results in this paper find the same behaviour of a decrease in the pressure drop for an Oldroyd-B fluid flowing through a contraction. Thus the experiments with polymer solutions find an increase in the pressure drop, while numerical solutions for the Oldroyd-B fluid find a decrease. This contradiction has led to a good number of numerical studies with alternative model fluids, ones with more dissipation. We comment on this issue in our conclusions, in § 7. It is our theoretical results, particularly those for high Deborah numbers, that allow us to understand the cause of the behaviour, and so suggest suitable refinements of the Oldroyd-B model.
There have been many applications of lubrication theory to non-Newtonian flows. Tichy & Modest (Reference Tichy and Modest1980) studied a squeeze-film geometry using part of the constitutive equation for a second-order fluid. They also made an expansion in a small Deborah number  $De\ll 1$, so that the tension in the streamlines appeared only as a correction. Ro & Homsy (Reference Ro and Homsy1996) studied Hele-Shaw and dip-coating flows using an Oldroyd-B fluid. They also made an expansion in a small Deborah number $We/Ca^{1/3}\ll 1$. Going to the first correction, they explored only the second-order fluid behaviour. Zhang, Matar & Craster (Reference Zhang, Matar and Craster2002) studied surfactant spreading on a thin film using an Oldroyd-B fluid. They solved their lubrication equations (24)–(32), again by an expansion in a small Deborah number $We\ll 1$, going to the first correction. Ahmed & Biancofiore (Reference Ahmed and Biancofiore2021) studied a slider bearing using an Oldroyd-B fluid. They solved their lubrication equations (3) numerically, and found the first correction in an expansion in a small Deborah number $\epsilon \,Wi\ll 1$. Boyko & Stone (Reference Boyko and Stone2022) studied a slowly varying contraction using an Oldroyd-B fluid. They solved numerically the full governing equations, before making the lubrication approximation, for two narrow geometries. They also made an expansion in a small Deborah number, finding the first and second corrections for the flow, and using a reciprocal theorem, the third correction for the pressure drop. In this paper, we shall solve numerically and asymptotically the lubrication equations for an Oldroyd-B fluid at large Deborah numbers, in a regime where the non-Newtonian behaviour is not a small correction. Large non-Newtonian effects within lubrication theory have been consider previously, by Sykes & Rallison (Reference Sykes and Rallison1997a,Reference Sykes and Rallisonb). They studied a suspension of fibres in a slowly varying channel and in a journal bearing.
2. Governing equations
2.1. Oldroyd-B
The Oldroyd-B model fluid is the simplest viscoelastic fluid, combining a simple viscous stress and a simple elastic stress:
 \begin{equation*} {\boldsymbol{\sigma}} =-p\boldsymbol{I} + 2\mu_0\boldsymbol{e} + G\boldsymbol{A}, \end{equation*}
where  $\mu _0$ is a viscosity, $\boldsymbol {e}$ is the strain-rate of the flow, $G$ is an elastic modulus, and $\boldsymbol {A}$ is the deformation of the microstructure. The viscosity $\mu _0$ will be called the ‘solvent viscosity’, as it occurs in the bead-and-spring model of dilute polymer solutions. The microstructure deforms due to velocity differences in the flow as represented by the velocity gradient ${\boldsymbol {\nabla }}\boldsymbol {u}$, and simultaneously relaxes to the isotropic state on a relaxation time $\tau$:
 \begin{equation*} \frac{{\rm D}\boldsymbol{A}}{{\rm D} t} = \boldsymbol{A}\boldsymbol{\cdot}{\boldsymbol{\nabla}}\boldsymbol{u} + {\boldsymbol{\nabla}}\boldsymbol{u}^{\rm T}\boldsymbol{\cdot}\boldsymbol{A} - \frac{1}{\tau}\,(\boldsymbol{A} - \boldsymbol{I}). \end{equation*}
The left-hand side and first two terms of the right-hand side are the so-called upper-convective time derivative  $\mathop{\boldsymbol{A}}\limits^{\nabla}$ of the Oldroyd-B equation, appropriate for fibrous microstructures. A modified right-hand side $-\boldsymbol {A}\boldsymbol {\cdot }{\boldsymbol {\nabla }}\boldsymbol {u}^{\rm T} - {\boldsymbol {\nabla }}\boldsymbol {u}\boldsymbol {\cdot }\boldsymbol {A}$ corresponds to the lower-convective time derivative $\mathop{\boldsymbol{A}}\limits^{\triangle}$, which produces the Oldroyd-A equation, appropriate to disk-like microstructures.
The simple fluid model has just three parameters,  $\mu _0$, $G$ and $\tau$, to be fitted to experimental data. It represents fairly well many aspects, but not all, of the flow behaviour of some polymer solutions, such as Boger fluids. For these two reasons, the Oldroyd-B equation is a sensible choice for numerical calculations of flows. Finally, the elastic-dumbbell model of polymer solutions is governed by the Oldroyd-B equation.
In a uniform steady simple shear flow 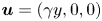 $\boldsymbol {u}=(\gamma y,0,0)$, the Oldroyd-B fluid has viscous-like shear stresses
 \begin{equation*} \sigma_{xy} = \sigma_{yx} = (\mu_0 + G\tau)\gamma.\end{equation*}
In the steady state, the microstructural deformation  $A_{xy} = \gamma \tau$ should be thought of as the deformation-rate $\gamma$ multiplied by the time $\tau$ of how long the material can remember being deformed before it relaxes. With the steady deformation proportional to the shear-rate $\gamma$, both the elastic and viscous shear stresses are proportional to $\gamma$, with the combination described by an effective viscosity $\mu _* = \mu _0 +G\tau$. We shall call this effective viscosity the steady shear viscosity of the Oldroyd-B fluid.
In addition to shear stresses, there are so-called normal stresses
 \begin{equation*} \sigma_{xx} =-p + 2G(\gamma\tau)^2,\quad \sigma_{yy} = \sigma_{zz} =- p. \end{equation*}
The difference  $\sigma _{xx}-\sigma _{yy} = 2G(\gamma \tau )^2$ corresponds to an elastic tension in the streamlines. In order for this tension in the streamlines to play a role in the lubrication dynamics, it is necessary for the normal stresses to be much larger than the shear stresses. We see that this is possible if the Weissenberg number $We = \gamma \tau$ is very large. We shall need $We$ to be as large as the ratio of the length to the width of the contraction. There is a question of whether the common experimental Boger fluids keep a quadratic variation in shear-rate of the normal stresses at the high shear-rates that we consider theoretically.
To help us to understand the response of the Oldroyd-B fluid as it flows through a contraction, it is useful to consider the start up and shut down of a simple shear flow  $\boldsymbol {u} = (\gamma (t)\,y,0,0)$, where
 \begin{equation*} \gamma(t) = \begin{cases} 0 & \text{for}\ t<0,\\ \gamma_1 & \text{for}\ 0 \le t < t_1, \\ 0 & \text{for}\ t_1 \le t, \end{cases} \end{equation*}
with the duration of the shear much longer than the relaxation time,  $t_1\gg \tau$. The shear stress response is
 \begin{equation*} \sigma_{xy}(t) = \begin{cases} 0 & \text{for}\ t<0,\\ \mu_0\gamma_1 + G\gamma_1\tau(1 - \exp({-t/\tau})) & \text{for}\ 0 \le t < t_1, \\ G\gamma_1\tau \exp({-(t-t_1)/\tau}) & \text{for}\ t_1 \le t. \end{cases} \end{equation*}
We see that when the shearing is switched on, there is an immediate viscous stress  $\mu _0\gamma _1$. As the microstructure begins to deform, an elastic component of the stress builds up. After a few relaxation times $t \gg \tau$, the deformation reaches the equilibrium value $\gamma _1\tau$, which is the deformation-rate $\gamma _1$ times the memory time $\tau$, and the shear stress takes a steady value $(\mu _0+G\tau )\gamma _1$. When the shearing is switched off at $t_1$, the viscous component $\mu _0\gamma _1$ immediately drops out, while the elastic component relaxes over several relaxation times.
The system of stresses in a simple shear flow can be understood by considering the deformation of a microstructure composed of fibres that deform like material line-elements. A fibre parallel to the flow,  $\boldsymbol {\delta \ell } = (\delta \ell,0,0)$, will move with the flow without change in size or orientation. A fibre perpendicular to the flow,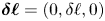 $\boldsymbol {\delta \ell } = (0,\delta \ell,0)$, will shear to $(\delta \ell \gamma t, \delta \ell, 0)$, i.e. the component perpendicular to the flow remains unchanged, while a component parallel to the flow grows linearly in time.
The microstructure in an Oldroyd-B fluid is described by a second-order tensor  $\boldsymbol {A}$. We think of this tensor as the tensor product of two vector fibres. Thus $A_{xx}=1$ corresponds to two fibres of unit length parallel to the flow, which are unchanged in the simple shear flow, so $A_{xx}=1$ remains constant. On the other hand, $A_{yy}=1$ corresponds to two fibres perpendicular to the flow, each of which will develop in the simple shear components parallel to the flow, $A_{xy}=A_{yx} = \gamma t$, while leaving the component perpendicular to the flow, $A_{yy}=1$, unchanged. Finally, these shear components $A_{xy}$ and $A_{yx}$ correspond to one fibre parallel and one fibre perpendicular. Through the shear, the perpendicular fibres develop components parallel to the flow, so producing $A_{xx} = 1 + 2(\gamma t)^2$.
The above discussion is for a uniform steady simple shear. While the flow through a contraction flow is a shearing flow with one layer of fluid sliding over another, it is not steady in the Lagrangian view moving with the fluid. As the flow accelerates, a fibre in the direction of the flow will stretch proportional to the increase in velocity. (In a steady flow, a material line-element evolves according to  $\boldsymbol {u}\boldsymbol {\cdot }{\boldsymbol {\nabla }}\delta {\boldsymbol {\ell }} = \delta {\boldsymbol {\ell }}\boldsymbol {\cdot }{\boldsymbol {\nabla }}\boldsymbol {u}$. If the fibre $\delta {\boldsymbol {\ell }}$ starts parallel to $\boldsymbol {u}$, then the solution is $\delta {\boldsymbol {\ell }}\propto \boldsymbol {u}$.) Thus we can expect the component of $\boldsymbol {A}$ in the direction of the flow, corresponding to two fibres parallel to the flow, to increase in proportion to the square of the velocity. As fibres parallel to the flow stretch, fibres perpendicular to the flow must compress by the same proportion in order to conserve mass in a planar flow. (Axisymmetric flows would differ at this point.) Thus we can expect the component of $\boldsymbol {A}$ perpendicular to the flow to decrease proportional to the square of the velocity, while the shearing components of $\boldsymbol {A}$, corresponding to one fibre parallel and one fibre perpendicular, should be unchanged as the flow accelerates. Note that this discussion of the deformation of the microstructure has ignored its relaxation.
The previous paragraph gives the basis of the high- $De$ analysis in § 3.4.
The idea that the microstructure stretches like a material line-element in regions where the relaxation is negligible was suggested by Rallison & Hinch (Reference Rallison and Hinch1988) in § 5.2 when considering how dumbbells behave in rapid sink flows. This stretching was expressed by Hinch (Reference Hinch1993) at the beginning of § 3 as  $\boldsymbol {A} = f(\psi )\,\boldsymbol {u}\boldsymbol {u}$, where $f$ is constant along a streamline, when considering flow around a sharp corner. Keiller (Reference Keiller1993a) added in his equation (18) the shear components, when improving a numerical method for entry flows. Finally, Renardy (Reference Renardy1994) in his equation (3) gave a decomposition of the deformation for steady planar flows into three components, parallel, shear and perpendicular to the flow. We shall return to this decomposition much later, in § 6.3.
2.2. Lubrication equations
We consider a flow in the  $x$-direction through a planar contraction starting at $x=0$ and finishing at $x=\ell$. The width of the channel is $2h(x)$, with a straight centreline $y=0$ and rigid boundaries at $y = \pm h(x)$. There is a short inlet section in $x<0$ with a constant width $2h(0)$, and a long outlet section in $x>\ell$ with a constant width $2h(\ell )$. For the channel to be slowly varying, the width is taken to be much smaller than the length:
 \begin{equation*} \epsilon = h(0)/\ell \ll 1. \end{equation*}
We shall work only to leading order in  $\epsilon$, and not exhibit where any correction terms can occur. A second non-dimensional parameter of the geometry is the contraction ratio
 \begin{equation*} H = h(0)/h(\ell). \end{equation*}
In our numerical studies, we shall take  $H = 2^{1/2}$, $2$,
$2$,  $2^{3/2}$ and $4$. Between each case in this sequence, the shear-rate doubles and the normal stresses quadruple.
In the standard lubrication scalings, we non-dimensionalise the distance  $x$ along the channel by the length $\ell$ of the contraction, and the distance $y$ across the channel as well as the width $h(x)$ by the width of the inlet $h_0= h(0)$. With a volume flux $2Q$, we non-dimensionalise the component $u$ of the flow along the channel by $Q/h_0$, and the much smaller component of the flow across the channel by $Q/\ell$. Time $t$ is non-dimensionalised by the residence time in the contraction $\ell h_0/Q$, and pressure $p$ by the pressure drop of a Newtonian viscous fluid with the solvent viscosity $\mu _0$ by $\mu _0 Q \ell /h_0^3$.
With these scalings, a non-dimensional parameter arises that measures the elasticity:
 \begin{equation*} c = G\tau/\mu_0. \end{equation*}
In the bead-and-spring model of dilute polymer solutions, this  $c$ would be the concentration of the polymers. For most of the numerical studies, we shall take $c=1$, which would not qualify as dilute.
We shall ignore inertia. This means taking the appropriate reduced Reynolds number to be negligibly small:
 \begin{equation*} Re = \rho Q h_0/\mu_0 \ell \ll 1, \end{equation*}
where  $\rho$ is the density of the fluid.
A final non-dimensional parameter is needed to measure the relaxation time  $\tau$ in the constitutive equation. In most flows, there is no difference between a Weissenberg number and a Deborah number. An exception is in lubrication flows. The Weissenberg number $We = Q\tau /h_0^2$ measures the relaxation time compared with the local shear-rate, which we shall not use. As discussed in the previous section § 2.1, we need the Weissenberg number to be as large as $\epsilon ^{-1}$, in order to bring the tension in the streamlines into the leading-order dynamics. For this reason, we use the Deborah number
 \begin{equation*} De = \epsilon\,We = Q\tau/\ell h_0. \end{equation*}
This Deborah number is the ratio of the relaxation time to the residence time in the contraction.
In order to promote the non-Newtonian tension in the streamlines to a leading-order role, we scale differently the different components of the deformation of the microstructure:  $A_{yy}$ by $\epsilon ^0$, $A_{xy}$ by $\epsilon ^{-1}$, and $A_{xx}$ by $\epsilon ^{-2}$.
With these non-dimensionalisations, the governing equations become the following. The conservation of mass is
 \begin{equation*} {\frac{\partial u}{\partial x}} + {\frac{\partial v}{\partial y}} = 0. \end{equation*}
As in all thin-film flows, the  $y$-component of the momentum equation gives at leading order that the pressure is constant across the flow, i.e. $p=p(x,t)$. The conservation of momentum in the $x$-direction is then
 \begin{equation*} 0 =- \frac{{\rm d} p}{{\rm d}\kern0.06em x} + {\frac{\partial ^2u}{\partial y^2}} +\frac{c}{De}\left({\frac{\partial A_{xx}}{\partial x}} + {\frac{\partial A_{xy}}{\partial y}}\right)\!. \end{equation*}
Finally, the Oldroyd-B equations are
 \begin{equation*} \begin{aligned}
&\left({\frac{\partial }{\partial t}} + u\,{\frac{\partial
}{\partial x}} + v\,{\frac{\partial }{\partial y}}\right)
A_{xx} -2eA_{xx} - 2\gamma_1A_{xy} =-\frac{1}{De}\,A_{xx}, \notag\\
&\left({\frac{\partial }{\partial t}} +
u\,{\frac{\partial }{\partial x}} + v\,{\frac{\partial
}{\partial y}}\right) A_{xy} -\gamma_2A_{xx}\ \ -
\gamma_1A_{yy} =-\frac{1}{De}\,A_{xy}, \notag\\
&\left({\frac{\partial }{\partial t}} + u\,{\frac{\partial
}{\partial x}} + v\,{\frac{\partial }{\partial y}}\right)
A_{yy} -2\gamma_2A_{xy} +2eA_{yy}
=-\frac{1}{De}\,(A_{yy}-1), \end{aligned}
\end{equation*}
\begin{equation*} \begin{aligned}
&\left({\frac{\partial }{\partial t}} + u\,{\frac{\partial
}{\partial x}} + v\,{\frac{\partial }{\partial y}}\right)
A_{xx} -2eA_{xx} - 2\gamma_1A_{xy} =-\frac{1}{De}\,A_{xx}, \notag\\
&\left({\frac{\partial }{\partial t}} +
u\,{\frac{\partial }{\partial x}} + v\,{\frac{\partial
}{\partial y}}\right) A_{xy} -\gamma_2A_{xx}\ \ -
\gamma_1A_{yy} =-\frac{1}{De}\,A_{xy}, \notag\\
&\left({\frac{\partial }{\partial t}} + u\,{\frac{\partial
}{\partial x}} + v\,{\frac{\partial }{\partial y}}\right)
A_{yy} -2\gamma_2A_{xy} +2eA_{yy}
=-\frac{1}{De}\,(A_{yy}-1), \end{aligned}
\end{equation*}where the shear-rates and extension-rate are
 \begin{equation*} \gamma_1 = {\frac{\partial u}{\partial y}}, \quad \gamma_2 = {\frac{\partial v}{\partial x}}, \quad e = {\frac{\partial u}{\partial x}} =- {\frac{\partial v}{\partial y}}. \end{equation*}
These governing equations are equivalent to those written down before in the papers cited at the end of § 1. Compared with those earlier works, we have not included negligibly small terms in the small  $\epsilon$, and have used a microstructural representation of the Oldroyd-B rheology. Note that the scaled $A_{xx}$ relaxes to $\epsilon ^2$, which is neglected in the first of the Oldroyd-B equations. Note that in lubrication approximations, the hoop-stress is neglected, so there can be no purely elastic instability due to curved streamlines.
2.3. Curvilinear coordinates
For numerical calculations, it is convenient to map the geometry of the contraction onto a unit square
 \begin{equation*} 0 \le x \le 1,\quad 0 \le \eta=\frac{y}{h(x)} \le 1. \end{equation*}
The coordinate lines  $x=\rm {const.}$ and $\eta =\rm {const.}$ are not orthogonal in the $xy$-plane, due to the slope $h'(x)$. Transforming partial differential equations is much easier with orthogonal curvilinear coordinates. Because the slope of the boundary is $O(\epsilon )$ small in the slowly varying geometry, only a small displacement in the $x$-direction is necessary to create an orthogonal system
 \begin{equation*} x(\xi,\eta) = \xi + \epsilon^2 \tfrac14 (h^2(\xi))'(1-\eta^2) + O(\epsilon^4),\quad y(\xi,\eta) = h(\xi)\,\eta.\end{equation*}
 In the previous subsection, we used  $u$ for the downstream $x$-component of velocity, and $v$ for the cross-stream $y$-component. Henceforth, we change to use $u$ for the velocity in the downstream $\xi$-direction, and $v$ for the flow in the cross-stream $\eta$-direction. There is a negligible $O(\epsilon ^2)$ difference between the flow $u$ in the $\xi$- and $x$-directions. However, the flow in the $y$-direction is greater by $uh'$ than the flow $v$ in the $\eta$-direction, because the small slope $h'$ is multiplied by a large downstream velocity $u$. In a similar way, we shall use $A_{11}$, $A_{12}$ and $A_{22}$ for the components of the microstructure in the $\xi \xi$-, $\xi \eta$- and $\eta \eta$-directions. As with the velocity, there is a negligible $O(\epsilon ^2)$ difference between $A_{11}$ and $A_{xx}$, and $O(1)$ differences between the other curvilinear and Cartesian components.
In these curvilinear coordinates, the governing equations become for mass and momentum
 $$\begin{gather} \frac1{h}\,{\frac{\partial (hu)}{\partial x}} + \frac1{h}\,{\frac{\partial v}{\partial \eta}} = 0, \end{gather}$$
 $$\begin{gather}0 =- \frac{{\rm d} p}{{\rm d}\kern0.06em x} + \frac{1}{h^2}\,{\frac{\partial ^2u}{\partial \eta^2}} + \frac{c}{De}\left(\frac{1}{h}\,{\frac{\partial (hA_{11})}{\partial x}} + \frac{1}{h}\,{\frac{\partial A_{12}}{\partial \eta}}\right)\!, \end{gather}$$
and for Oldroyd-B
 $$\begin{align}\left({\frac{\partial }{\partial t}} + u\,{\frac{\partial }{\partial x}} + \frac{v}{h}\,{\frac{\partial }{\partial \eta}}\right) A_{11} -2eA_{11} - 2\gamma_1A_{12} &=-\frac{1}{De}\,A_{11}, \end{align}$$
 $$\begin{align}\left({\frac{\partial }{\partial t}} + u\,{\frac{\partial }{\partial x}} + \frac{v}{h}\,{\frac{\partial }{\partial \eta}}\right) A_{12} -\gamma_2A_{11} \ \ - \gamma_1A_{22} &=-\frac{1}{De}\,A_{12}, \end{align}$$
 $$\begin{align}\left({\frac{\partial }{\partial t}} + u\,{\frac{\partial }{\partial x}} + \frac{v}{h}\,{\frac{\partial }{\partial \eta}}\right) A_{22} -2\gamma_2A_{12} +2eA_{22} &=-\frac{1}{De}\,(A_{22}-1), \end{align}$$
with shear-rates and extension-rate
 \begin{equation} \gamma_1 = \frac{1}{h}\,{\frac{\partial u}{\partial \eta}},\quad \gamma_2 = h\,{\frac{\partial }{\partial x}}\left(\frac{v}{h} \vphantom{\frac{\partial }{\partial t}}\right)\!,\quad e = {\frac{\partial u}{\partial x}} =- \frac{1}{h}\,{\frac{\partial v}{\partial \eta}}- \frac{uh'}{h}. \end{equation}
There are boundary and inlet conditions. On the velocity, we impose no-slip on the upper rigid boundary,
 \begin{equation} u = v = 0\quad \text{on}\ \eta = 1, \end{equation}
and symmetry across the centreline,
 \begin{equation} {\frac{\partial u}{\partial \eta}} = v = 0\quad \text{on}\ \eta = 0. \end{equation}
The constitutive equation is hyperbolic and requires knowledge of the microstructural state at the entry. We assume a Poiseuille flow in the straight entry channel, and the microstructure is in the steady state of the simple shear there:
 \begin{equation} u = \frac{3}{2h}\,(1-\eta^2),\quad A_{22} = 1,\quad A_{12} =-3\,De\,\eta/h^2,\quad A_{11} = 18\,De^2\,\eta^2/h^4, \end{equation}
with  $h=1$ at the entry. The factor $3/2$ in the velocity ensures that the volume flux is $1$ in the half-width of the channel $0\le \eta \le 1$.
The vanishing of the cross-stream velocity  $v$ on the centreline and upper boundary means that the downstream volume flux is constant along the contraction, and we have chosen to normalise this flux to be unity:
 \begin{equation*} h \int_0^1 u\,{\rm d}\eta = 1,\quad \text{independent of $x$.}\end{equation*}
Maintaining the flux to be constant sets the local value of the pressure gradient. The last expression can be twice integrated by parts. Using the boundary conditions (2.5) and (2.6), we have
 \begin{equation*} -h\int_0^1 \frac12\,(1-\eta^2)\,{\frac{\partial ^2u}{\partial \eta^2}}\,{\rm d}\eta = 1.\end{equation*}
Substituting the expression for  $\partial ^2u/\partial \eta ^2$ from the momentum equation (2.2) and performing a couple of integrals, we find an expression for the pressure gradient:
 \begin{equation} \frac{{\rm d} p}{{\rm d}\kern0.06em x} =-\frac{3}{h^3} + \frac{c}{h\,De} \int_0^1\left(\frac32\,(1-\eta^2)\,{\frac{\partial (hA_{11}) }{\partial x}} + 3\eta A_{12}\right){\rm d}\eta. \end{equation}
An important advantage of the lubrication approximation is that the pressure is determined locally with no need to solve a numerically expensive Poisson problem.
2.4. Numerical method
The contraction runs from  $x=0$ to $x=1$ in the non-dimensionalisation. A short entry channel and a long exit channel, both of constant width, are added to the contraction. There is no upstream influence in the governing physics (2.1) to (2.3), so theoretically no entry channel is required. However, it is convenient for coding the numerical method and for controlling the effects of a small numerical diffusion to have a short entry. On the other hand, the exit channel must be long to allow the elastic stresses to relax to their steady values. We shall discuss in § 4.1 how long the exit channel must be, but typical values range from $x_\infty =5$ to $x_\infty =20$. A single simple shape is used for the contraction. To allow second-order numerical accuracy, a smooth shape is used with vanishing slope at the start and end:
 \begin{equation} h(x) = \begin{cases} 1 & \text{for }{-0.5} < x < 0, \\ 1- (1-H^{-1})x^2(2 - x)^2 & \text{for }0< x < 1,\\ H^{-1} & \text{for }1 < x < x_\infty. \end{cases} \end{equation}
Here,  $H$ is the contraction ratio, the ratio of the entry to exit widths. This shape is shown in figure 3 for $H=2$.
The numerical approach is at each instant to solve for the flow  $(u,v)$ given the instantaneous values of the elastic stress $A_{11}$, $A_{12}$ and $A_{22}$, and then to use this flow to time step the elastic stresses until they reach a steady state.
Given the elastic stresses and the pressure gradient from (2.8), the momentum equation (2.2) is integrated with respect to  $\eta$, starting at the centreline $\eta =0$ where $\partial u/\partial \eta = 0$, to find the shear-rate $\partial u/\partial \eta$. This shear-rate is then integrated with respect to $\eta$, starting at the upper boundary $\eta =1$ where $u=0$, to find the velocity $u$. Note that these integrations at each downstream section are independent of one another. Finally, with $u(x,\eta )$ known, the cross-stream velocity $v$ is found by integrating the mass conservation (2.1) with respect to $\eta$, starting at the centreline where $v=0$.
Given the flow  $u(x,\eta )$ and $v(x,\eta )$, the Oldroyd equations (2.3) are time-stepped to find the microstructure $A_{11}$, $A_{12}$ and $A_{22}$ at the next time step. For initial conditions of the microstructure, we take the expressions in (2.7) corresponding to a steady uniform Poiseuille flow in a channel of width $h(x)$.
Equispaced finite differences are used. Second-order spatial central differencing is used, except for the  $u$ advection, which is first-order upwinded because downstream advection is important at high Deborah numbers. Upwinding is not used for the small $v$ advection. When calculating some fluxes, a second-order correction is applied to produce a fourth-order result for the flux. The time stepping is made by first-order forward differencing. Typical values of the grid size and time step are $\delta x=0.0208$, $\delta \eta = 0.0333$ and $\delta t = 10^{-3}$. Random spot checks are made to confirm an accuracy of around three figures. Run times are around 15 seconds on a laptop, considerably faster than solving the full non-lubrication equations by finite elements. At high Deborah numbers, a numerical instability occurred, which could be delayed by decreasing $\delta \eta$ while keeping $\delta x$ fixed, as suggested by Keiller (Reference Keiller1992b). Also, for stability, a smaller $\delta t$ was needed at very small Deborah numbers $De$. The time to come to a steady state was typically $t=5$, shorter for small Deborah numbers, and longer for high Deborah numbers with long exit channels.
3. Results for contraction
3.1. Pressure drop
First, we study the pressure drop across the contraction, from  $x=0$ to ${x=1}$. Recall that the pressure drop has been non-dimensionalised by $\mu _0 Q\ell /h_0^3$. In the next section, we shall consider the important pressure drop in the exit channel after the contraction. In subsequent sections we shall study an expansion and a constriction.
In lubrication theory, the pressure is constant at leading order across the flow. Hence the pressure drop across the contraction is simply
 \begin{equation} \Delta p = p(x=0) - p(x=1). \end{equation}
In our theoretical and numerical calculations, the pressure drop is therefore unambiguous. It is less clear, however, what experiments measure. One can use flush-mounted wall pressure transducers, which would measure the above pressure drop. In a flow between two large baths, one might think that the pressure drop between the two baths is the difference between the stress averaged across the section:
 \begin{equation*} \left[-p + \frac{c}{De}\int_0^1 A_{11} \,{\rm d}\eta\right]_{x=0}^{x=1}.\end{equation*}
Alternatively, one might note the greater out-flux of elastic energy, and then subtract this to obtain the dissipative part of the pressure drop:
 \begin{equation*} \left[- p - \frac{c}{De}\int_0^1 \frac32\,(1-\eta^2)\,\frac12\,A_{11} \,{\rm d}\eta\right]_{x=0}^{x=1}. \end{equation*}
We shall return to the question of which pressure drop in § 3.5.
The pressure drop across the contraction for a Newtonian fluid with unit viscosity is
 \begin{equation} \Delta p_1 = \int_0^1 \frac{3}{h^3(x)}\,{{\rm d}\kern0.06em x}. \end{equation}
Table 1 gives the numerical values for  $\Delta p_1$ for the four contraction ratios $H$ and the geometry (2.9) used in this paper. At $H=1$, $\Delta p_1 = 3$. At high contraction ratios, $\Delta p_1 \sim (9{\rm \pi} \sqrt {2}/32)H^{5/2}$. For $H=4$, this expression gives 40.0 in place of the 48.2 in the table.
The pressure drops (non-dimensionalised by  $\mu _0Q\ell /h^3_0$) $\Delta p_1$ and $\Delta p_2$ defined by (3.2) and (3.6) across the contraction section for various contraction ratios $H>1$, and across an expansion with expansion ratios $1/H>1$. The pressure drop $\Delta p_3$ defined by (6.2) is across a constriction.

At low Deborah numbers, the Oldroyd-B fluid has a Newtonian behaviour with a viscosity  $(1+c)$, and hence will have a pressure drop at $De=0$ of $(1+c)\,\Delta p_1$. In figure 1, we plot $\Delta p$, the pressure drop (3.1), relative to this value at $De=0$. The numerical results of the lubrication theory of this paper have been tested in figure 1 against full two-dimensional finite-element calculations using the code of Boyko & Stone (Reference Boyko and Stone2022) for contraction ratios $2$ and $2^{3/2}$, and a small value $\epsilon =0.02$ of the parameter measuring the slow variation of the geometry. We note that the pressure drop is typically 30 % less for the Oldroyd-B fluid.
Pressure drop  $\Delta p$ across the contraction section divided by its Newtonian value $(1+c)\,\Delta p_1$, as a function of the Deborah number $De$, for $c=1.0$. The four curves are for different contraction ratios, $H= 2^{1/2}$, $2$,
$2$,  $2^{3/2}$ and $4$. The points are results from two-dimensional finite-element calculations for $H=2$ and $2^{3/2}$ with $\epsilon =0.02$.

3.2. Low Deborah numbers
Boyko & Stone (Reference Boyko and Stone2022) have given an asymptotic analysis for small  $De$. At $O(De)$, the Oldroyd-B fluid has a second-order fluid behaviour, so the flow remains unchanged by the theorem of Tanner & Pipkin (Reference Tanner and Pipkin1969):
 \begin{equation*} u = \frac{3}{2h(x)}\,(1 - \eta^2) + O(De^2),\quad v = O(De^2). \end{equation*}
Solving the microstructure equations (2.3) iteratively for  $De\ll 1$, we have
 \begin{align*}
A_{22} &\sim 1 - De\,2e, \\
A_{12} &\sim De\,\gamma_1 + De^2\,(-2e\gamma_1 - u\gamma_1'), \\
A_{11} &\sim De^2\,2\gamma_1^2,
\end{align*}
\begin{align*}
A_{22} &\sim 1 - De\,2e, \\
A_{12} &\sim De\,\gamma_1 + De^2\,(-2e\gamma_1 - u\gamma_1'), \\
A_{11} &\sim De^2\,2\gamma_1^2,
\end{align*}with the shear-rates and extension-rate (2.4a–c) becoming
 \begin{equation*} \gamma_1 = \frac1{h}\,{\frac{\partial u}{\partial \eta}} =- \frac{3\eta}{h^2},\quad e = {\frac{\partial u}{\partial x}} =- \frac{h'}{h}\,u, \quad \gamma_1' =-2\,\frac{h'}{h}\,\gamma_1. \end{equation*}
Evaluating the momentum equation (2.2),
 \begin{equation*} \frac{{\rm d} p}{{\rm d}\kern0.06em x} \sim- \frac{3(1+c)}{h^3} - c\,De\,\frac{18h'}{h^5}. \end{equation*}
Note that there is no variation in  $\eta$ in this expression for the pressure gradient, as required by the theorem of Tanner & Pipkin (Reference Tanner and Pipkin1969). Integrating, we obtain the estimate of the pressure drop at low Deborah numbers:
 \begin{equation} \Delta p \sim (1+c)\,\Delta p_1 -\tfrac92 c\,De\,(H^4 - 1). \end{equation}
 In figure 2, we replot the data in figure 1 now as the reduction in the pressure drop divided by the geometric factor  $(H^4-1)$ in order to test this asymptotic result (3.3). We see good agreement for $De<0.1$, and significant deviation by $De=0.2$. There is some hint of a linear decrease at $De>0.4$. Boyko & Stone (Reference Boyko and Stone2022) give in their (4.11) and (4.14) two further terms in the asymptotic expansion for the pressure drop. These two extra terms double the range of good agreement, but offer no suggestion of the important linear regime at higher $De$. We gain confidence in the numerical code for the lubrication approach from this agreement with the low-Deborah-number asymptotics, along with the early agreement with results from full two-dimensional finite-element calculations in figure 1.
The difference between the pressure drop  $\Delta p$ and its Newtonian value $(1+c)\,\Delta p_1$, divided by $(H^4-1)$, as a function of the Deborah number $De$, for $c=1.0$. The four curves are for the contraction ratios $H = 2^{1/2}$, 2, $2^{3/2}$ and $4$. The black line is the low- $De$ asymptotic result $-\frac {9}{2}c\,De$.

3.3. Streamwise development
To probe deeper what lies behind the changes in pressure drop, we first look at the velocity profiles along the channel. In figure 3, the velocity  $u(x,\eta )$ is plotted horizontally as a function of $y=h(x)\,\eta$ vertically, at a series of downstream positions $x$ in the extended range $-0.1667< x<2.0$, with the contraction in $0< x<1$. For comparison, the parabolic profiles with the same flux are also plotted. In the entrance section, $x<0$, the velocity is exactly parabolic. In the exit section, $x>1$, the velocity rapidly becomes parabolic, being only 0.5 % different at $x=1$, for the contraction ratio $H=2$. In the contraction section, the velocity deviates from parabolic by at most 5.7 %. While the theorem of Tanner & Pipkin (Reference Tanner and Pipkin1969) gives no change in the velocity profile at $O(De)$, the Deborah number of figure 3 is $De=0.5$, which is some way beyond the linear regime $De<0.1$.
Velocity profiles along the flow, for  $c=1.0$, $De=0.5$ and $H= 2$. Recall that $x$ and $y$ were non-dimensionalised differently, by $\ell$ and $h(0)$, respectively.

The velocity is slightly faster near the upper boundary, and slightly slower near the centreline. The speed up near the boundary is caused by the tension in the streamlines. The tension vanishes on the centreline and increases towards the boundary. The tension also increases as the channel narrows. It is the larger tension at the end of the contraction that pulls the fluid to be faster next to the boundary. With the flux fixed, the velocity near the centreline has to be slower to compensate.
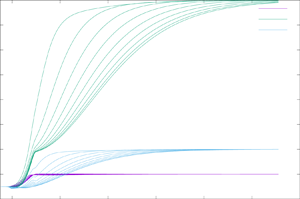
A consequence of the velocity profiles being nearly parabolic is that the lines  $\eta = \textrm {const.}$ are nearly the streamlines. In figure 4, we plot the variations along lines of constant $\eta$, which should be a good approximation to variations along a streamline. The exit channel has been extended to $x=11$. In purple, we plot as a function of downstream position $x$ the velocity relative to its value at the entrance, i.e. $u(x,\eta )/u(0,\eta )$. This ratio starts at $1$ at the entrance, increases in the contraction section $0< x<1$, and takes the value $2$ in the exit channel. Because the velocity profiles are very nearly parabolic, there is little variation between the lines of constant $\eta$.
Streamwise variations on constant  $\eta = 0.1\ \text{in steps of}\ 0.1\ \text{to}\ 0.9$ of velocity $u$, elastic normal stress $NS$, and elastic contribution to the shear stress $SS$; all scaled by their entry values, for $H= 2$, $De=0.5$, $c=1.0$.

In green and in blue, we plot in the same way the elastic normal stress  $A_{11}$ and the elastic shear stress $A_{12}$ relative to their values at the entrance, i.e. we plot $A_{**}(x,\eta )/A_{**}(0,\eta )$. For the contraction ratio $H=2$, the velocity should double, the shear stress quadruple, and the normal stress increase by a factor of 16, when they relax to the steady state downstream in the exit channel. The highest curves in the figure correspond to streamlines near to the upper boundary, the lowest curves near to the centreline. Near to the boundary, the flow is slow, so that fluid travels a shorter distance during the relaxation time. Near the centreline, the fluid needs to travel a distance of approximately $\Delta x =8$ in the exit channel before attaining 95 % of the steady state.
The need for a long exit channel for stress relaxation means that there is little relaxation in the contraction section for this Deborah number  $De=0.5$. This observation is the key to the high $De$ asymptotics below.
By the end of the contraction at  $x=1$, the velocity has doubled, the shear stress has not changed from its entry value (at least away from the boundary), and the normal stress has quadrupled. Much of the increase in the stresses to their eventual steady values occurs in the long exit channel. We need to examine the stresses at the end of the contraction, at $x=1$, and the extent to which they are suppressed relative to their eventual relaxed values far downstream, (2.7) with $h=1/H$.
We plot in figure 5(a) the normal stress  $A_{11}$ at $x=1$ divided by its value given by (2.7), with $h=1/H$ as a function of $y$ across the flow for five different Deborah numbers. In the centre of the flow, $0\le y <0.35$, the normal stresses are a quarter of their eventual values, independent of the Deborah number for $De>0.3$. For the contraction ratio considered, $H=2$, the normal stresses eventually increase by a factor of 16 from their value at the start of the contraction. Being suppressed by a quarter means that they have increased by a factor of 4 from the start. Four is the square of the contraction ratio $H=2$. Similar figures, not shown, for contraction ratios $H=2^{1/2}$ and $2^{3/2}$ find that the normal stresses increase by factors of 2 and 8, respectively, within the contraction, i.e. by a factor of $H^2$ in all cases.
Cross-stream variations of normal stress at end of the contraction at  $x=1$. Normal stresses at the end of the contraction, divided by eventual relaxed value far downstream in exit channel, (a) for the full width as a function of $y$, and (b) for the boundary layer as a function of $(y-0.5)\,De$, for $De = 0.1 \ \text{in steps of}\ 0.1\ \text{to}\ 0.5$, contraction ratio $H= 2$, and $c=1.0$. The solid black lines are $H^{-2}=0.25$.

Near the upper boundary, the flow is slow, so that the normal stresses have longer during their transit through the contraction to approach their fully relaxed values. They are therefore less suppressed compared with the core of the flow, and not suppressed at all on the boundary where the velocity vanishes. Figure 5(b) replots the data multiplying the distance from the boundary by the Deborah number. We see a universal boundary layer once  $De>0.1$. The thickness of the boundary layer is $\delta y=0.04/De$. The boundary layer will give small corrections to our estimate of the pressure drop.
Returning to the increase of the normal stresses by the factor of only  $H^2$ by the end of the contraction, we recall the discussion at the end of § 2.1, which suggested that the tension in the streamlines should increase with the square of an accelerating velocity if relaxation was ignored. We test this in figure 6 by plotting $A_{11}(x,\eta )/u^2(x,\eta )$ divided by its value at the entrance $A_{11}(0,\eta )/u^2(0,\eta )$ as a function of $x$, the distance along the flow, for the central half of the flow, $0<\eta <0.5$. To a good approximation, we see $A_{11}\propto u^2$. The slight drop in the curves in figure 6 of the normal stress divided by $u^2$ is because $\eta = \textrm {const.}$ is only approximately the streamline.
Streamwise variations on constant  $\eta = 0.1\ \text{in steps of}\ 0.1\ \text{to}\ 0.5$ of velocity $u$, elastic normal stress $NS$, and normal stress divided by the square of the velocity $NS/u^2$; all scaled by their entry values, for $H= 2$, $De=0.5$ and $c=1.0$.

3.4. High Deborah numbers
Figure 4 showed that at  $De=0.5$ the stress mostly relaxed in the exit channel, i.e. there was little relaxation in the contraction itself. Moreover, with no relaxation, the elastic shear stress $A_{12}(x,\eta )$ remained equal on the streamlines to its value at the entrance, $-3\,De\,\eta$. Figure 6 showed that at $De=0.5$ the elastic normal stress $A_{11}(x,\eta )$ increases along the streamlines from its value at the entrance $18\,De^2\,\eta ^2$ in proportion to the square of the increase in the velocity, i.e. $\propto h^{-2}(x)$, at least away from the boundary. These results were anticipated at the end of § 2.1. We thus have for sufficiently high Deborah numbers, such as $De>0.3$,
 \begin{equation} A_{12} = -3\,De\,\eta \quad\text{and}\quad A_{11} = \frac{18\,De^2\,\eta^2}{h^2(x)}. \end{equation}
Substituting these into the expression (2.8) for the pressure gradient gives
 \begin{equation*} \frac{{\rm d} p}{{\rm d}\kern0.06em x} =- \frac{3}{h^3} - \frac{3c}{h} - \frac{18c\,De\,h'}{5h^3}. \end{equation*}
The three terms on the right-hand side come, respectively, from the solvent viscosity, the elastic shear stresses and the elastic normal stresses. Integrating gives
 \begin{equation} \Delta p = \Delta p_1 + c\,\Delta p_2 - \frac{9c\,De}{5}\,(H^2-1). \end{equation}
Here  $\Delta p_1$ was defined in (3.2) and tabulated in table 1. The second term is
 \begin{equation} \Delta p_2 = \int_0^1\frac{3}{h(x)}\,{{\rm d}\kern0.06em x}, \end{equation}
also tabulated in table 1. At  $H=1$, $\Delta p_2 = 3$. At high contraction ratios, $\Delta p_2 \sim (3{\rm \pi} \sqrt {2}/4)H^{1/2}$. For $H=4$, this expression gives 6.664 in place of the 6.249 in the table.
At low Deborah number, the elastic shear stresses make a contribution  $c\,\Delta p_1$. At high Deborah number, their contribution is reduced to $c\,\Delta p_2$, because the residence time in the contraction is insufficient for the stress to attain its eventual steady state. The final term from the normal stresses gives a decrease in the pressure drop, which is linear in the Deborah number. The stronger tension in the streamlines at the end of the contraction pulls the flow through the contraction, so reducing the need for pressure to push the flow through.
The expressions for the elastic stresses (3.4a,b) are applicable in the central fast part of the flow and not near the boundary. In a boundary layer, the stresses are larger,  $A_{11}=O(De^2\,H^4)$ and $A_{12}=O(De\,H^2)$. The thickness of the boundary layer was found in figure 5(b) to be $O(1/De)$. The contributions of the two stresses to the integral (2.8) will therefore be $O(H^4/De)$ and $O(H^2/De)$, which are both small compared with terms in (3.5).
We test the prediction (3.5) for the pressure drop at high Deborah number by plotting in figure 7 the pressure drop  $\Delta p$ minus the contributions $\Delta p_1 + c\,\Delta p_2$, all divided by the geometry factor $(H^2-1)$, as a function of the Deborah number $De$. Results for the different contraction ratios collapse onto the same curve, decreasing linearly for high Deborah numbers $De>0.5$. The slope of the line is not quite the $-\frac 95 c$ predicted. The cause of the discrepancy has been identified as due to the small change in the flow from the parabolic profile that occurs when $c=1.0$. Figure 8 shows that as the concentration $c$ is decreased from 1.0 the asymptote approaches $-\frac 95\,De$.
A test of the high- $De$ asymptotic result (3.5). The pressure drop $\Delta p$ minus $\Delta p_1 + c\,\Delta p_2$ divided by $(H^2-1)$, for $c=1.0$ and $H = 2^{1/2}$, $2$,
$2$,  $2^{3/2}$ and $4$. The solid black line is $-\frac {9}{5}c\,De$.

The effect of concentration. Plotted as a function of the Deborah number is  $(\Delta p - \Delta p_1 - c\,\Delta p_2)/(c(H^2-1))$, for $c=4,2,1,0.5,0.25,0.05$ and for $H=2$. The solid black line is $-\frac {9}{5}\,De$.

3.5. Energy fluxes and dissipation
We postponed discussion of which pressure drop might be measured in different experiments. There is also a paradox to be resolved that the work done by the reduced pressure drop produces an efflux of elastic energy while the viscous dissipation would seem to remain unchanged if the velocity profile continued to be parabolic.
We form the mechanical energy equation by multiplying the lubrication approximation of the momentum equation (2.2) by the velocity  $u$, and integrating over a control volume of the contraction, $0\le x\le 1$ and $0\le \eta \le 1$. After integrating some terms by parts, we obtain
 \begin{gather*} 0 = p(0) - p(1)- \int_0^1\int_0^1 \left(\frac{1}{h}\,{\frac{\partial u}{\partial \eta}}\right)^2h\,{\rm d}\eta \,{{\rm d}\kern0.06em x} \\ +\frac{c}{De}\left(\left[\int_0^1 uA_{11}h\,{\rm d}\eta\right]_{x=0}^1 - \int_0^1\int_0^1\left({\frac{\partial u}{\partial x}}\,A_{11} +\frac{1}{h}\,{\frac{\partial u}{\partial \eta}}\,A_{12}\right)h \,{\rm d}\eta\,{{\rm d}\kern0.06em x}\right)\!. \end{gather*}
The two pressure terms are in effect multiplied by the unity volume flux, so is the rate of working by the pressure forces against the flow. The first integral is the rate of dissipation by the shear flow for the solvent viscosity. The next term is the rate of working of the normal stresses against the flow at the entrance and exit. The final integral is the rate of working against the two elastic stresses in the interior. Now, these terms describing the working against the elastic stresses occur, doubled, as the last two terms on the left-hand side of the Oldroyd-B equation (2.3a) for  $A_{11}$. Hence integrating (2.3a) over the control volume, using the conservation of mass (2.1) and integrating by parts, we have
 \begin{gather*} \int_0^1\int_0^1{\frac{\partial }{\partial t}}\left(\frac12\,A_{11}\right) h \,{\rm d}\eta \,{{\rm d}\kern0.06em x} + \left[\int_0^1 u\,\frac12\,A_{11} h\,{\rm d}\eta \right]_{x=0}^1 \\ - \int_0^1\int_0^1\left({\frac{\partial u}{\partial x}}\,A_{11} +\frac{1}{h}\,{\frac{\partial u}{\partial \eta}}\,A_{12}\right)h \,{\rm d}\eta \,{{\rm d}\kern0.06em x} =- \int_0^1\int_0^1\frac{1}{De}\,\frac12\,A_{11} h\,{\rm d}\eta \,{{\rm d}\kern0.06em x}. \end{gather*}
Here  $\frac 12 A_{11}$ is the local elastic energy density when multiplied by $c/De$ in our non-dimensionalised lubrication approximation. The four terms in the above equation say that (i) the elastic energy in the contraction changes in time due to (ii) an influx of elastic energy at the entrance and exit, (iii) working by the flow against the elastic stresses, and (iv) dissipation through stress relaxation. Combining the mechanical energy equation with the above elastic energy equation, we have
 \begin{align} & p(0) - p(1) +\frac{c}{De}\left[\int_0^1 uA_{11}h\,{\rm d}\eta\right]_{x=0}^1 \nonumber\\ &\quad =\frac{c}{De}\left[\int_0^1 u\,\frac12\,A_{11} h\,{\rm d}\eta \right]_{x=0}^1 + \frac{c}{De}\int_0^1\int_0^1{\frac{\partial }{\partial t}}\left(\frac12\,A_{11}\right) h \,{\rm d}\eta\,{{\rm d}\kern0.06em x} \nonumber\\ &\qquad + \int_0^1\int_0^1 \left(\frac{1}{h}\,{\frac{\partial u}{\partial \eta}}\right)^2h\,{\rm d}\eta \,{{\rm d}\kern0.06em x} + \frac{c}{De}\int_0^1\int_0^1\frac{1}{De}\,\frac12\,A_{11} h\,{\rm d}\eta \,{{\rm d}\kern0.06em x}. \end{align}
The left-hand side represents the rate of working against the pressure and the normal stresses at the entrance and exit of the channel. This input of energy can go to an out-flux of elastic energy or an increase in locally stored elastic energy in the first two terms on the right-hand side. The final two terms on the right-hand side represent the dissipation of mechanical energy by the shear flow for the solvent viscosity and the dissipation of elastic energy by stress relaxation. It should be noted that, while the dissipation by the shear flow for the solvent viscosity will change little if the velocity profile changes little, the dissipation by stress relaxation can change significantly as the elastic stresses change. It should also be noted that the rate of working against the normal stresses is twice the out-flux of elastic energy.
In the low- $De$ limit, the working against the normal stresses at the entrance and exit is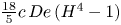 $\frac {18}{5}c\,De\,(H^4-1)$, while the out-flux of elastic energy is half this. The dissipation by the shear flow for the solvent viscosity is $\Delta p_1$, while the dissipation of the elastic energy by stress relaxing is $c\,\Delta p_1$. Corrections $O(De)$ to these leading-order estimates of the dissipation are required to estimate correctly the pressure drop (3.3).
In the high- $De$ limit, the working against the normal stresses at the entrance and exit is $\frac {18}{5}c\,De\,(H^2-1)$, while the out-flux of elastic energy is half this. The dissipation for the solvent viscosity remains $\Delta p_1$, while the dissipation from stress relaxation becomes $c\,\Delta p_2$. Combining these estimates gives the pressure drop (3.5).
4. Exit channel for contraction
4.1. Stress relaxation
Figure 4 in § 3.3 shows that most of the relaxation of the stress occurs in the exit channel, and takes a long distance. We study stress relaxation in this subsection. Debbaut et al. (Reference Debbaut, Marchal and Crochet1988) noted in some finite-element calculations that a long downstream section of some 250 radii in length was required to calculate the Couette correction reliably at  $De=30$. Keiller (Reference Keiller1993b) examined the spatial decay of steady perturbations of plane Poiseuille flow for the Oldroyd-B equation, finding continuous spectra of eigenvalues. Far downstream, the stress relaxed exponentially on a length scale of the maximum velocity multiplied by the relaxation time.
In figure 9 we plot the decay of the difference between the pressure gradient  $\textrm {d} p/{\textrm {d}\kern 0.06em x}$ and its eventual steady value $-3(1+c)H^3$ as a function of distance downstream for various contraction ratios and Deborah numbers. The log-linear plot shows an exponential approach to the steady value. Scaling the distance with the local Deborah number $H\,De$ brings the curves parallel, corresponding to a decay on a length scale $\frac 32 H\,De$. This is the result above of Keiller (Reference Keiller1993b). To obtain better than two-figure accuracy in the Couette correction, one must therefore extend the exit channel to $7H\,De$. This estimate of the necessary length of the exit channel of $210$ for $H\,De=30$ is consistent with the 250 of Debbaut et al. (Reference Debbaut, Marchal and Crochet1988).
Relaxation of the pressure gradient in the exit channel. The difference between the pressure gradient  $\textrm {d} p/{\textrm {d}\kern 0.06em x}$ and its final steady value $- 3(1+c)H^3$ as a function of the distance downstream $x$ divided by the local Deborah number, $H\,De$, for $De=0.3$ with $H= 2^{1/2}, 2, 2^{3/2}$, and for $De=0.5$ with $H=2$. The black line is $1000\exp (-2x/(3H\,De))$.

Knowing that the pressure gradient approaches its steady value exponentially with a known exponential rate, one can shorten the numerical length of the exit channel and add a simple extrapolation to the Couette correction. This reduction of the computation was not employed because the calculations took less than a minute on a laptop.
4.2. Pressure drop
To calculate the pressure drop in the exit channel, we return to the expression (2.8) for the pressure gradient. This expression can be integrated from the start of the exit channel at  $x=1$ to some distance down the channel, to $x=L$. Because the width of the channel, $h(x)= 1/H$, is constant in the exit section, it can be taken outside the partial derivative, outside the integral, and then cancelled, to yield
 \begin{equation*} \Delta p = \frac{3(L-1)}{h^3} - \frac{c}{De} \int_0^1 \frac32\,(1-\eta^2)\,[A_{11}]_1^L\,{\rm d}\eta - \frac{c}{De\,h}\int_0^1 3\eta \left(\int_1^L A_{12}\,{{\rm d}\kern0.06em x}\right){\rm d}\eta.\end{equation*}
Thus we need only the starting and finishing values of  $A_{11}$, and the integral down the channel of $A_{12}$. Note that we do not set $h=1/H$ in the first half of this subsection, because we shall use the same analysis for the exit of the constriction where $h=1$.
While the shear stress term  $A_{12}$ is $O(De)$ smaller than the normal stress $A_{11}$, its relaxation takes place over a long $O(De)$ distance, so its contribution to the pressure drop is of a similar magnitude. We need the Oldroyd-B equations for how $A_{12}$ relaxes down the channel.
At this stage we make an approximation that the velocity has the same constant parabolic profile all the way down the exit channel; see figure 3. This approximation is asymptotically correct in the low concentration limit  $c\ll 1$.
With  $u$ independent of $x$, the cross-flow component of velocity vanishes, $v=0$. The Oldroyd-B equations needed, (2.3c) and (2.3b), are then
 \begin{align*}
u\,{\frac{\partial A_{22}}{\partial x}} &= -\ \kern0.12em\frac{1}{De}\,(A_{22}-1),\\
u\,{\frac{\partial A_{12}}{\partial x}} &= \frac{1}{h}\,{\frac{\partial u}{\partial \eta}}\,A_{22} \,-\, \frac{1}{De}\,A_{12}.
\end{align*}
\begin{align*}
u\,{\frac{\partial A_{22}}{\partial x}} &= -\ \kern0.12em\frac{1}{De}\,(A_{22}-1),\\
u\,{\frac{\partial A_{12}}{\partial x}} &= \frac{1}{h}\,{\frac{\partial u}{\partial \eta}}\,A_{22} \,-\, \frac{1}{De}\,A_{12}.
\end{align*}
While these are simple to solve, we do not need the evolution of the relaxation, we just need an integral. Integrating down the flow, using  $u$, and so $\partial u/\partial \eta$, are constant along the flow,
 \begin{align*}
u\,[A_{22}]_1^L
&= -\ \kern0.12em\frac{1}{De}\int_1^L(A_{22}-1)\,{{\rm d}\kern0.06em x},
\\ u\,[A_{12}]_1^L
&=\frac{1}{h}\,{\frac{\partial u}{\partial \eta}}\left(L-1
+ \int_1^L(A_{22}-1)\,{{\rm d}\kern0.06em x}\right) \,-\,\frac{1}{De}\int_1^LA_{12}\,{{\rm d}\kern0.06em x}.
\end{align*}
\begin{align*}
u\,[A_{22}]_1^L
&= -\ \kern0.12em\frac{1}{De}\int_1^L(A_{22}-1)\,{{\rm d}\kern0.06em x},
\\ u\,[A_{12}]_1^L
&=\frac{1}{h}\,{\frac{\partial u}{\partial \eta}}\left(L-1
+ \int_1^L(A_{22}-1)\,{{\rm d}\kern0.06em x}\right) \,-\,\frac{1}{De}\int_1^LA_{12}\,{{\rm d}\kern0.06em x}.
\end{align*}
Hence the required integral of  $A_{12}$ is
 \begin{equation*} \int_1^L A_{12}\,{{\rm d}\kern0.06em x} =-De\,u\,[A_{12}]_1^L + \frac{1}{h}\,{\frac{\partial u}{\partial \eta}}\left(De\,(L-1) -De^2\,u\,[A_{22}]_1^L\right)\!. \end{equation*}
Substituting the expressions for the flow  $u$ and the shear-rate $\partial u/\partial \eta$, we have an expression for the pressure drop in the exit channel:
 \begin{align} \Delta p &=
\frac{3(1+c)(L-1)}{h^3} - \frac{c}{De}\int_0^1
\frac32\,(1-\eta^2)\,[A_{11}]_1^L\,{\rm
d}\eta \nonumber\\ &\quad +
\frac{c}{h^2}\int_0^1\frac92\,\eta(1-\eta^2)\,[A_{12}]_1^L\,{\rm
d}\eta - \frac{c\,De}{h^4}\int_0^1\frac{27}{2}\,\eta^2(1-\eta^2)\,[A_{22}]_1^L\,{\rm
d}\eta.
\end{align}
\begin{align} \Delta p &=
\frac{3(1+c)(L-1)}{h^3} - \frac{c}{De}\int_0^1
\frac32\,(1-\eta^2)\,[A_{11}]_1^L\,{\rm
d}\eta \nonumber\\ &\quad +
\frac{c}{h^2}\int_0^1\frac92\,\eta(1-\eta^2)\,[A_{12}]_1^L\,{\rm
d}\eta - \frac{c\,De}{h^4}\int_0^1\frac{27}{2}\,\eta^2(1-\eta^2)\,[A_{22}]_1^L\,{\rm
d}\eta.
\end{align}
This result is valid for all  $De$. It assumes that the velocity profile takes a constant parabolic form.
At the far end of the exit channel, we have the steady Poiseuille values for all  $De$:
$De$:
 \begin{equation*} A_{11} = \frac{18\,De^2}{h^4(L)}\,\eta^2, \quad A_{12} =-\frac{3\,De}{h^2(L)}\,\eta, \quad A_{22} = 1. \end{equation*}
In the low- $De$ limit, § 3.2 gives
 \begin{equation*}
[A_{22}]_1^L = O(De^2),\quad
[A_{12}]_1^L =
O(De^3)\quad\text{and}\quad
[A_{11}]_1^L = O(De^4),
\end{equation*}
\begin{equation*}
[A_{22}]_1^L = O(De^2),\quad
[A_{12}]_1^L =
O(De^3)\quad\text{and}\quad
[A_{11}]_1^L = O(De^4),
\end{equation*}
using our smooth geometry  $h(x)$ with zero slope at the end of the contraction, $h'(1)=0$. Hence the pressure drop is little changed from the steady Poiseuille value:
 \begin{equation*} \Delta p = 3(1+c)(L-1)H^3 + O(De^3). \end{equation*}
In the high- $De$ limit, we have (3.4a,b) at the start of the exit channel,
 \begin{equation*} A_{11} = \frac{18\,De^2}{h^2(1)}\,\eta^2, \quad A_{12} = -3\,De\,\eta, \quad A_{22} = h^2(1), \end{equation*}
so
 \begin{equation} \Delta p = {3(1+c)(L-1)}{H^3} - \tfrac{36}{5}c\,De\,(H^4-H^2). \end{equation}
There are equal contributions of  $18/5$ from the normal and elastic shear stresses. The normal stresses are stronger far downstream compared with the entry to the exit channel. These normal stresses pull the fluid along, so requiring less pressure to drive the flow. The shear stress is below the steady Poiseuille value, so exerts less resistance until relaxed, again requiring less pressure drop. The shear stress contribution of $18/5$ is made up of two equal parts, arising from $A_{12}$ and $A_{22}$. In the contraction at high $De$,
$De$,  $A_{12}$ remains constant while $A_{22}$ is squashed by the same factor of $H^2$ that $A_{11}$ is stretched.
At high  $De$, the net rate of working against the normal stresses at the beginning and end of the exit channel is $\frac {18}{5}c\,De\,(H^4-H^2)$, and the net out-flux of elastic energy is half this. Stress relaxation is, however, more complicated in the exit channel, and contributes more to the pressure drop.
The expressions (3.4a,b) used above are for the elastic stresses at high  $De$ in the fast central part of the flow. Near to the boundary, there is a layer of thickness $O(1/De)$ with larger normal and shear stresses. Examining the integrals in (4.1), we see that the boundary layer will contribute only small corrections $O(cH^4/De)$.
Combining the pressure drop across the contraction (3.5) with the extra pressure drop from the stresses relaxing in the exit channel (4.2) at high  $De$, we predict the total extra pressure drop (non-dimensionalised by $\mu _0Q\ell /h^3_0$)
 \begin{equation} \Delta p = \Delta p_1 + c\,\Delta p_2 - \frac{9 c\,De}{5}\,(H^2- 1)(4H^2+1). \end{equation}
To test this prediction, we plot in figure 10 the numerically calculated pressure drop across the contraction and exit channel minus the first two terms in (4.3), and then rescaled by  $(H^2-1)(4H^2+1)$.
The extra pressure drop through a contraction including the extra from the exit channel minus the first two terms in (4.3), i.e.  $\Delta p - \Delta p_1 - c\,\Delta p_2$, scaled by $(H^2 - 1)(4H^2+1)$, for $c=1$ and $H = 2^{1/2}$, $2$,
$2$,  $2^{3/2}$ and $4$. The black line is the high- $De$ prediction $-\frac {9}{5}c\,De$.

The curves in figure 10 for each of the four contraction ratios seem to be straight lines with the predicted slope  $-\frac {9}{5}c$ and with offsets varying between 0 and 0.2. Other than a possible small reduction in the slope in $De<0.1$, the high- $De$ prediction (4.3) seems to be applicable for all $De$. We note that at low $De$, the exit channel contributes only an $O(De^3)$ correction, while the pressure drop through the contraction (3.3) varies as $-4.5 c\,De\,(H^4-1)$. This low- $De$ variation differs little from the $-7.2c\,De\,(H^4-H^2)$ from the exit channel at high $De$. At high $De$, the exit channel contributes a greater reduction in the pressure drop than the contraction itself, by a factor $4H^2$.
With the viscoelastic change in the pressure drop (4.3) decreasing linearly with the Deborah number, there must be a worry of the total pressure drop becoming negative above a critical Deborah number. That would yield a mechanical instability. Fortunately, the reduction  $7.2cH^4\,De$ attains 90 % of this value only at a distance $3.5H\,De$ down the exit channel, over which distance the Newtonian pressure drop is $10.5(1+c)H^4\,De$. Hence the total pressure drop cannot become negative.
5. Expansion
A distinguishing feature of viscoelastic liquids is the formation of recirculating eddies upstream of an abrupt contraction, with only small corner eddies seen with simple Newtonian viscous liquids. Expansions are different to contractions. A Newtonian viscous liquid will form recirculating eddies downstream of an abrupt expansion, an inertial effect at non-small Reynolds numbers. Beyond a Reynolds number of order 100, the eddies become unstable and the flow loses its symmetry (Fearn, Mullin & Cliffe Reference Fearn, Mullin and Cliffe1990). Experimental studies of viscoelastic liquids have concentrated on the change of these downstream eddies with Deborah and Reynolds numbers (Townsend & Walters Reference Townsend and Walters1994). We have not seen any recirculation eddies in our slowly varying geometry with inertialess dynamics.
Numerical studies have also concentrated on the downstream eddies. Some papers have given a few results for the change in the pressure drop resulting from viscoelasticity. Finite-element calculations for the upper-convected Maxwell (commonly known as UCM) fluid in a 1 : 4 abrupt expansion by Missirlis, Assimacopoulos & Mitsoulis (Reference Missirlis, Assimacopoulos and Mitsoulis1998) show an increase in the pressure drop from 14.4 in figure 9(b) for  $De=0$, to 34.9 in figure 10(b) for $De=1.2$, and to 59.2 in figure 11(b) for $De=3.0$, all at Reynolds number $Re=0.1$. Oliveira (Reference Oliveira2003) shows in figure 18 a higher Fanning friction factor for a FENE-CR model fluid in a 1 : 3 expansion with moderate Reynolds numbers $Re<100$. As described in the Introduction, Binding et al. (Reference Binding, Phillips and Phillips2006) show in their figure 7 that the relative pressure drop decreases for a 4 : 1 contraction, decreasing less for a 4 : 1 : 4 constriction, and increasing a little for a 1 : 4 expansion, all linear variations and all with $De<1$, for an Oldroyd-B fluid. Finally, Poole et al. (Reference Poole, Alves, Oliveira and Pinho2007) show in their figure 5 a normalised extra pressure drop increasing linearly in $De<1.5$ for an Oldroyd-B fluid flowing through an abrupt 1 : 3 expansion.
Our earlier expressions (3.3) for the pressure drop across a contraction at low  $De$, and (3.5) at high $De$, along with our result (4.2) for the pressure drop in the exit channel following a contraction, were all derived for contractions with $H>1$ but are equally valid for expansions with $H<1$, where $H = h(0)/h(1)$ is the ratio of the width of the channel at the beginning of the section to that at the end. Moreover, the physical mechanisms behind those expressions are unchanged between contractions and expansions.
But there are significant differences. First, all the terms multiplying the Deborah number  $De$ change sign when changing from $H>1$ to $H<1$. This means that the linear decrease with $De$ of the pressure drop through a contraction changes to a linear increase of pressure drop through an expansion. Second, when $4H^2<1$, the contribution to the change in the pressure drop from the exit channel is less than that from the expansion section.
Table 1 gives values of  $\Delta p_1$ and $\Delta p_2$ for expansion ratios $H<1$. For large expansion ratios, $H\ll 1$, $\Delta p_1 \sim (9{\rm \pi} \sqrt {2}/32)H^{1/2}$ and $\Delta p_2 \sim (3{\rm \pi} \sqrt {2}/4)H^{1/2}$. For $H=\frac {1}{4}$, these asymptotic formulae give $0.625$ and $1.666$, respectively, instead of the numerical values $0.608$ and $1.427$ in the table.
In figure 11, we test the prediction of (4.3). Other than an unpredicted offset of 0.5, the numerical results for the four expansion ratios follow the prediction well.
The pressure drop through an expansion including the extra from the exit channel minus the first two terms in (4.3), i.e.  $\Delta p - \Delta p_1 - c\,\Delta p_2$, scaled by $(1 - H^2)(4H^2+1)$, for $c=1$ and $H^{-1} = 2^{1/2}$, $2$,
$2$,  $2^{3/2}$ and $4$. The black line is the high- $De$ prediction $\frac {9}{5}c\,De$.

The main mechanism causing the increase in pressure drop is the higher tension in the streamlines at the start of the expansion compared with far down the exit channel. The tension at the entrance must be overcome, requiring higher pressures to push the flow through the expansion. The elastic shear stresses are also higher in the expansion compared with their relaxed values far down the exit channel, and these higher shear stresses require a greater pressure.
6. Constriction
By constriction we mean a contraction followed by an expansion back to the original entry width. It has sometimes been called a contraction–expansion. The experiments by Cartalos & Piau (Reference Cartalos and Piau1992a,Reference Cartalos and Piaub) and by Rothstein & McKinley (Reference Rothstein and McKinley1999, Reference Rothstein and McKinley2001) described in the Introduction all used a constriction. They found an increase in the pressure drop. Pérez-Camacho et al. (Reference Pérez-Camacho, López-Aguilar, Calderas, Manero and Webster2015) found in their figure 9 little change in the pressure drop up to a critical Deborah number, and an increase thereafter, for a Boger fluid flowing through axisymmetric constrictions with various ratios of constriction. Using Lagrangian finite elements for a 4 : 1 : 4 constriction with rounded corners, Szabo, Rallison & Hinch (Reference Szabo, Rallison and Hinch1997) found in their figure 6 a decrease in the pressure drop for an Oldroyd-B fluid. As described in the Introduction, Binding et al. (Reference Binding, Phillips and Phillips2006) also found a decrease.
For our computations, we use the smooth contraction of (2.9) from  $x=0$ to $x=1$ followed by a mirror-symmetric expansion from $x=1$ to $x=2$ using the same middle formula in (2.9), with the width returning to the original $h=1$ in the long exit channel. The ratio of the widths is therefore $H\,:\,1\,:\,H$. Figure 12 plots the pressure drop relative to the value at $De=0$, i.e. $2\,\Delta p_1\,(1+c)$. The extra contribution from relaxation in the exit channel is included. The pressure drop decreases, typically by 20 %, before levelling off to a plateau at high Deborah number.
The pressure drop through a constriction, including the extra contribution from the exit channel, relative to its Newtonian value  $2\,\Delta p_1\,(1+c)$, as a function of the Deborah number, for $c=1$ and $H = 2^{1/2}$, $2$,
$2$,  $2^{3/2}$ and $4$.
$4$.

6.1. Low  $De$
$De$

In (3.3), we gave an expression for the  $O(De)$ reduction in the pressure drop at low $De$. It involves the difference between the width of the channel at the beginning and end of the flow. This difference vanishes for a constriction, so there should be no change in the pressure drop at $O(De)$. Boyko & Stone (Reference Boyko and Stone2022) gave two further terms in an expansion for small $De$ in their (4.11) and (4.14). The structure of these further terms suggests that the reduction in the pressure drop across a constriction should be an even function of $De$, should be proportional to $(H^4-1)$, where $H$ is the constriction ratio, and should depend on the effective Deborah number for the narrowest width, $De\,H$. In figure 13, we plot the reduction in the pressure drop with this scaling as a function of $De\,H$. We see that the results for different constriction ratios follow the same quadratic variation in $De\,H<0.2$. The pressure drops in figure 13 are for just the constriction, not including the contribution from the exit channel, and they continue to decrease at the higher $De$ plotted. This should be contrasted with the levelling off of the pressure drops when the contribution from the exit channel is included in figure 12. This difference is clearest in the case $H=2^{1/2}$.
The low Deborah number behaviour through a constriction. The scaled reduction in the pressure drop through just the constriction,  $(\Delta p - 2(1+c)\Delta p_1)/(H^4-1)$, as a function of the effective Deborah number at the narrowest point $De\,H$, for $c=1$ and $H = 2^{1/2}$, $2$,
$2$,  $2^{3/2}$ and $4$.
$4$.

6.2. Problems at high $De$

Our theory for high  $De$ worked well in the contraction and the expansion, giving good predictions for $De>0.3$. The constriction is not so kind, possibly requiring $De>20$ for good predictions.
The high- $De$ theory above was based on the observation in figure 6 that there was little relaxation in the contraction. Without relaxation, the microstructure $A_{11}$ varies along the accelerating streamlines in proportion to the square of the velocity, while $A_{22}$ varies with the inverse of the square of the velocity, and $A_{12}$ remains constant along the streamline. Applying those variations to a constriction, one would predict that
(i) the normal stresses are symmetric about the minimum gap and so contribute nothing to the pressure drop;
(ii) the elastic shear stresses contribute as in the contraction and in the expansion;
(iii) from (i) and (ii), the total pressure drop should be
$2(\Delta p_1 + c\,\Delta p_2)$;(iv) at the end of the constriction, all the stresses return to their values at the start, so the exit channel contributes nothing.

However, we have already seen from comparing figures 12 and 13 that the exit channel does contribute significantly.
In figure 14, we revisit the streamwise variations of the microstructure in figure 6 now plotted through the constriction from  $x=0$ to $x=2$. Only the streamlines in the central core $0\le \eta \le 0.6$ are included. In the first contraction part from $x=0$ to $x=1$, the normal stresses increase by a factor of just over $H^2=4$, corresponding approximately to the square of the increase in the velocity, the elastic shear stresses start approximately constant but are beginning to increase by $x=1$, and $A_{22}$ drops to only 0.5 at $x=1$ rather than the inverse of the square of the velocity $0.25$. In the second expansion part from $x=1$ to $x=2$, there are clear signs of relaxation. The normal stresses do not return to their entry values but end at least 50 % higher, while the elastic shear stresses and $A_{22}$ end at twice their entry values.
Streamwise variations on constant  $\eta = 0.1\ {\rm in\ steps\ of}\ 0.1\ {\rm to}\ 0.6$ of the elastic normal stress $NS$, elastic contribution to the shear stress $SS$, and $A_{22}$, all scaled by their entry values, for $H= 2$, $De=0.5$, $c=1.0$.

It should be noted that the Deborah number was defined to be the ratio of the residence time from  $x=0$ to $x=1$ to the relaxation time. Now that the constriction extends to $x=2$, the effective Deborah number has been halved, from $De=0.5$ to $De=0.25$ in figure 14, so that it should not be unexpected that relaxation can no longer be neglected.
The higher normal stresses at the end of the constriction compared with the entry reduce the pressure drop through the constriction. However, those same higher normal stresses at the end of the constriction compared with far downstream in the exit channel lead to a compensating increase in the pressure drop through the exit channel. On the other hand, the higher (i.e. higher in magnitude, as they are negative) elastic shear stresses at the end of the constriction increase the pressure drop in both the constriction and the exit channel. Finally, (4.1) shows that  $A_{22}$ starting at the exit channel with values exceeding those far downstream also leads to an increase in the pressure drop. For $De=0.5$ and independent of the constriction ratio $H= 2, 2^{3/2}, 4$, approximately 60 % of the extra pressure drop in the exit channel comes from the normal stresses, 25 % from the elastic shear stresses, and 15 % from $A_{22}$.
There are two problems to constructing a theory to predict the behaviour at high  $De$ in a constriction. First, the leading $O(De)$ effect in the contraction and expansion came from the normal stresses, and this effect vanishes in the constriction. Therefore, we are considering corrections to the leading-order theory, and these are more subtle. Within the constriction, our high- $De$ theory gives a first correction from the elastic shear stress not having time to build up to the higher values, predicting a pressure drop $2(\Delta p_1 + c\,\Delta p_2)$ at high $De$ compared with $2(1+c)\,\Delta p_1$ at low $De$. For $De=0.5$ and $H=2$, this predicts a 30 % reduction in the pressure drop, whereas our numerical calculations give only a 19 % reduction. Clearly, second and further corrections must be contributing at the not-so-large $De=0.5$. While the leading-order $O(De)$ term from normal stresses dominated, these correction terms lead to small offsets, as observed in figures 10 and 11.
The second problem comes from  $A_{22}$. So far, it has made only an incidental appearance in the calculation of the relaxation of stresses in the exit channel, and we have not yet discussed its role, which was minor in the contraction and expansion, but becomes major in the constriction. The microstructure $A_{22}$ corresponds to two fibres perpendicular to the flow. In an accelerating flow without relaxation, each fibre is compressed as the streamlines come together, so $A_{22}$ varies with the inverse of the square of the velocity. But in a constriction, relaxation cannot be ignored. A shearing of the microstructure $A_{22}$ produces the shear component $A_{12}$. Thus the larger than expected values of $A_{22}$ at the end of the constriction produce larger shear stresses, and hence a larger pressure drop in the exit channel.
6.3. An asymptotic theory for high Deborah numbers
The high- $De$ theory presented so far was based on physical insights. Such an approach is sufficient for the leading-order terms. For the correction terms, we need a more organised asymptotic approach.
Progress can be made in the low- $c$ limit, where the velocity profile remains parabolic with a local magnitude proportional to $1/h(x)$. In our curvilinear coordinates, the cross-stream component of the velocity then vanishes. This removes several terms in the Oldroyd-B equations. The flow, shear-rate and extension-rate become
 \begin{equation*}u(x,\eta) = \frac{F(\eta)}{h(x)},\quad \gamma(x,\eta) = \frac{f(\eta)}{h^2(x)}\quad \text{and}\quad e(x,\eta) =-\frac{h'\,F(\eta)}{h^2(x)}, \end{equation*}
with
 \begin{equation*}F(\eta) = \tfrac32(1-\eta^2) \quad\text{and}\quad f(\eta) =-3\eta. \end{equation*}
Using the known leading-order behaviour, we make a multiplicative substitution
 \begin{equation*}A_{11} = 2\,De^2\,f^2h^{-2}b_{11},\quad A_{12} = De\,f\kern0.06em b_{12}, \quad A_{22} = h^2 b_{22}. \end{equation*}
The Oldroyd-B equations (2.3) then become
 \begin{align} F\,{\frac{\partial
b_{11}}{\partial x}}
&=-\frac{h}{De}\,(b_{11}-b_{12}),\quad\ \,\text{with}\
b_{11}(0) = 1, \nonumber\\ F\,{\frac{\partial
b_{12}}{\partial x}}
&=-\frac{h}{De}\,(b_{12}-b_{22}),\quad\ \,\text{with}\
b_{12}(0) = 1, \nonumber\\ F\,{\frac{\partial
b_{22}}{\partial x}} &=-\frac{h}{De}\left(b_{22}
-\frac{1}{h^2}\right)\!,\quad\text{with}\ b_{22}(0) = 1,
\end{align}
\begin{align} F\,{\frac{\partial
b_{11}}{\partial x}}
&=-\frac{h}{De}\,(b_{11}-b_{12}),\quad\ \,\text{with}\
b_{11}(0) = 1, \nonumber\\ F\,{\frac{\partial
b_{12}}{\partial x}}
&=-\frac{h}{De}\,(b_{12}-b_{22}),\quad\ \,\text{with}\
b_{12}(0) = 1, \nonumber\\ F\,{\frac{\partial
b_{22}}{\partial x}} &=-\frac{h}{De}\left(b_{22}
-\frac{1}{h^2}\right)\!,\quad\text{with}\ b_{22}(0) = 1,
\end{align}
similar to the equations given by Renardy (Reference Renardy1994). These are valid for arbitrary  $De$. For $De\gg 1$ and in the central core of the flow where $F(\eta )\gg 1/De$, we solve iteratively for
 \begin{align*}b_{22} &= 1 +
\frac{1}{De\,F}\,I_1 -
\frac{1}{(De\,F)^2}\,I_2 + \frac{1}{(De\,F)^{3}}\,I_3
+O((De\,F)^{-4}),\\ b_{12} &= 1 +
\frac{1}{(De\,F)^2}\,I_2
-
\frac{1}{(De\,F)^{3}}\,I_3 + O((De\,F)^{-4}),\\ b_{11}
&=1 +
\frac{1}{(Dev\,F)^{3}}\,I_3 + O((De\,F)^{-4}),
\end{align*}
\begin{align*}b_{22} &= 1 +
\frac{1}{De\,F}\,I_1 -
\frac{1}{(De\,F)^2}\,I_2 + \frac{1}{(De\,F)^{3}}\,I_3
+O((De\,F)^{-4}),\\ b_{12} &= 1 +
\frac{1}{(De\,F)^2}\,I_2
-
\frac{1}{(De\,F)^{3}}\,I_3 + O((De\,F)^{-4}),\\ b_{11}
&=1 +
\frac{1}{(Dev\,F)^{3}}\,I_3 + O((De\,F)^{-4}),
\end{align*}where
 \begin{gather} I_1 =
\int_0^x\frac{1-h^2(x')}{h(x')}\,{{\rm d}\kern0.06em
x}',\quad I_2 = \int_0^x h(x')\int_0^{x'}
\frac{1-h^2(x'')}{h(x'')}\,{{\rm d}\kern0.06em
x}''\,{{\rm d}\kern0.06em x}' \notag\\ \text{and}\quad
I_3 = \int_0^x h(x')\int_0^{x'} h(x'')\int_0^{x''}
\frac{1-h^2(x''')}{h(x''')}\,{{\rm
d}\kern0.06em x}'''\,{{\rm d}\kern0.06em x}''\,{{\rm
d}\kern0.06em x}'. \notag
\end{gather}
\begin{gather} I_1 =
\int_0^x\frac{1-h^2(x')}{h(x')}\,{{\rm d}\kern0.06em
x}',\quad I_2 = \int_0^x h(x')\int_0^{x'}
\frac{1-h^2(x'')}{h(x'')}\,{{\rm d}\kern0.06em
x}''\,{{\rm d}\kern0.06em x}' \notag\\ \text{and}\quad
I_3 = \int_0^x h(x')\int_0^{x'} h(x'')\int_0^{x''}
\frac{1-h^2(x''')}{h(x''')}\,{{\rm
d}\kern0.06em x}'''\,{{\rm d}\kern0.06em x}''\,{{\rm
d}\kern0.06em x}'. \notag
\end{gather}
Using these expressions in (2.8) for the pressure gradient in the constriction from  $x=0$ to $x=2$, we find that the pressure drop through the constriction itself is
 \begin{equation*} \Delta p = 2(\Delta p_1 + c\,\Delta p_2) + O(De^{-1}). \end{equation*}
The correction comes from the boundary layer next to the wall,  $\eta = 1 - O(De^{-1})$. Using the expressions evaluated at $x=2$ in (4.1) for the extra pressure drop from relaxation in the exit channel, we find
 \begin{equation*} \Delta p = c\,\Delta p_3 + O(De^{-1}), \end{equation*}
with again the correction coming the boundary layer next to the wall. Here
 \begin{equation} \Delta p_3 = 3\int_0^2 \frac{1-h^2(x)}{h(x)}\,{{\rm d}\kern0.06em x}, \end{equation}
whose values are given in table 1. Note that while  $A_{22}$ differs from its equilibrium value far downstream by only $O(1/De)$, the long $O(De)$ relaxation distance produces an $O(1)$ effect in the pressure drop. Hence the pressure drop across the constriction, plus the extra contribution from relaxation in the exit channel, is predicted to be
 \begin{equation} 2\,\Delta p_1 + 2c\,\Delta p_2 + c\,\Delta p_3 . \end{equation}
 In figure 15, we plot, as a function of the Deborah number, the pressure drop including the extra contribution from the exit channel minus the above predicted result, all scaled by  $H^{3/2}$. The scaling is arbitrary, chosen to bring the curves together. If our predictions were correct, the curves should plateau to zero at high $De$. They seem to plateau, but not to zero. For a constriction ratio $H=2$, the pressure drop reduces by 13 % from $De=0$ to $De=0.5$, see figure 12, whereas we predict a 20 % reduction; and for the larger constriction ratio $H=4$, the pressure drop reduces by 28 %, whereas we predict 39 %. We cannot explain this discrepancy. It may be that $De=0.5$ is not sufficiently high. It may be that $c=1$ is not small, and the velocity profile changes significantly.
The high Deborah number behaviour through a constriction. The scaled pressure drop, including the extra drop from the exit channel,  $(\Delta p - 2(\Delta p_1 + c\,\Delta p_2) -c\,\Delta p_3)/H^{3/2}$ as a function of $De$, for $c=1$ and $H = 2^{1/2}$, $2$,
$2$,  $2^{3/2}$ and $4$.
$4$.

As an initial investigation into the discrepancy, we have examined the contribution of the relaxation of  $A_{22}$ to the pressure drop in the exit channel. We calculate $A_{22}(x,\eta )$ at $x=2$ by integrating numerically the low- $c$ Oldroyd-B equation (6.1) along the flow from $x=0$ to $x=2$ at fixed $\eta$. Then integrating across the flow, we evaluate the last integral in (4.1) for the pressure drop in the exit channel. The results are plotted in figure 16 as a function of $1/De$ for four different constriction ratios. We see that as $1/De\to 0$, all curves tend to the predicted values of $\Delta p_3$ given in table 1. However, a large value $De=20$ is required to come within 10 % of the high- $De$ limit. At $De=0.5$, the values are typically only 15 % of the limit values. Our numerical method for solving the lubrication equations struggles beyond $De=1$, so we are currently unable to access the high $De$ needed to study the constrictions further.
The contribution of  $A_{22}$ to the extra pressure drop in the exit channel following a constriction as a function of $1/De$, for constriction ratios $H=2^{1/2}$, $2$,
$2$,  $2^{3/2}$ and $4$. The horizontal lines are the limiting values $\Delta p_3$ given in table 1.

7. Conclusions
Using a lubrication approximation, we have examined the flow of an Oldroyd-B fluid through three slowly varying geometries. We found numerically that for contractions, the pressure drop is lower than for a Newtonian viscous fluid with the same steady-state viscosity (figure 1), while for expansions, the pressure drop is higher (figure 11). In both cases, the change tended to a linear increase with Deborah number. For constrictions, the pressure drop reduced to a plateau value (figure 12). These behaviours were first found by finite-element calculations for abrupt versions of the three geometries, respectively by Keunings & Crochet (Reference Keunings and Crochet1984), Missirlis et al. (Reference Missirlis, Assimacopoulos and Mitsoulis1998) and Szabo et al. (Reference Szabo, Rallison and Hinch1997), and later confirmed by others. In particular, Binding et al. (Reference Binding, Phillips and Phillips2006) included results for all three geometries.
The advantage of the slowly varying geometry is the possibility of making a simple asymptotic analysis for high Deborah numbers, with the predictions (3.5) for the contraction and the expansion, and (6.3) for the constriction. These predictions seem to work well for  $De>0.4$. The analysis was based on the neglect of stress relaxation, as seen in figure 4. The asymptotic approach exposed the mechanism behind the response. Higher normal stresses, or tensions in the streamlines, pull the flow in the direction of the narrowest point, thereby requiring less pressure to push through a contraction, and more pressure for an expansion. This effect is linear in the Deborah number. In addition, the elastic shear stresses take time to build up to their new steady values, which means that they are lower in a contraction and higher in an expansion. This effect in the contraction or expansion is independent of the Deborah number, and has the same sign as the normal stress effect. However, the relaxation of the shear stresses in the exit channel takes place over a long $O(De)$ distance, which increases the magnitude of the effect to be linear in $De$.
$De$.
Experiments find a behaviour different to that of the numerical studies, both the finite-element calculations and our lubrication results. Binding & Walters (Reference Binding and Walters1988) found that a greater pressure was needed for Boger fluids to flow through an orifice (a large contraction with no exit channel). Cartalos & Piau (Reference Cartalos and Piau1992a,Reference Cartalos and Piaub) and Rothstein & McKinley (Reference Rothstein and McKinley1999, Reference Rothstein and McKinley2001) all found higher pressure drops for Boger fluids flowing through constrictions (with long exit channels). All the experimental geometries had abrupt changes in diameter, and the flows had upstream recirculating eddies. There have been no experiments with the slowly varying geometry of our study.
It seems likely that the Oldroyd-B fluid model does not represent well the flow of Boger fluids through contractions, expansions and constrictions. Note, to the contrary, that Keiller (Reference Keiller1992a) was able to predict well four experiments with extensional flows of the M1 fluid using an Oldroyd-B equation with parameters  $\mu _0$, $G$ and $\tau$ fitted to shear data. There is, however, limited extension in the contractions, expansions and constrictions. These flows are dominated by shear flow with a small extensional component. A modification that includes some form of extra dissipative stress may be necessary. The two mechanisms, of larger normal stresses pulling the fluid through the narrowest gap, and the elastic shear stresses needing time to achieve their steady values are, however, robust and would come with most constitutive equations for an elastic liquid.
A number of alternative constitutive equations that include extra dissipation have been studied already. We discuss two possibilities that have a microstructural basis. Szabo et al. (Reference Szabo, Rallison and Hinch1997) investigated a finite extensible nonlinear elastic (FENE) model fluid in an abrupt 4 : 1 : 4 constriction, finding in their figure 6 that the pressure drop reduced with the Deborah number to a minimum and then began to increase, becoming greater than the Newtonian viscous value at  $De = 9$ for the limit of extensibility $L=5$. This unrealistic combination of large Deborah number and small extensibility is because the maximum stretch available in an abrupt constriction is small, and to achieve the maximum, one must start stretching well before the narrowest point. More realistic values are, however, possible in our slowly varying geometry. The high shear-rate, rather then the extensional component, will stretch to the finite extensibility limit when the Weissenberg number is large, $O(L)$. If this is to occur when the Deborah number is $O(1)$, then one needs the finite extensibility to be comparable to the inverse of the parameter measuring the slow variation of the geometry, i.e. $L=O(1/\epsilon )$. The effect of the finite extensibility in a shear flow is to change the normal stresses from increasing quadratically with the Deborah number to increasing linearly as $\sqrt {2}\epsilon L\,De\,\vert \gamma \vert$. Ignoring extensional aspects of the flow in a contraction, this would have made the pressure drop reduce to a plateau when $De=O(\epsilon L)$, rather than decrease linearly in the Deborah number. However, the extensional part of the flow probably plays a significant dissipative role, because the fully stretched microstructure could behave like a rigid-rod suspension with a high $O(cL^2)$ extensional viscosity. For a rigid-rod suspension flowing through an orifice, Mongruel & Cloitre (Reference Mongruel and Cloitre1995) found in their figure 3 that the pressure drop increased with the concentration of the rods.
In the start up of an extensional flow, the FENE model fluid predicts a growing elastic stress that suddenly switches to a plateau dissipative stress as the extensibility limit is reached. Experimental fluids seem to have a more gradual transition. Using a ‘kinks model’ to study how a random polymer chain gradually unfolds in an extensional flow, Hinch (Reference Hinch1994) found in figure 12 the build up of fully stretched internal segments. This lead to the suggestion, in the final equation of the paper, of a modified form of the stress, with an elastic stress not multiplied by the nonlinear spring strength, and with a dissipative stress  $2\mu _2(\boldsymbol {A}\!:\!\boldsymbol {E})\boldsymbol {A}$ proportional to the instantaneous strain-rate. It would be interesting to explore the flow of the FENE model and this modification through a slowly varying contraction. Two other issues to explore in the future are the axisymmetric version of our two-dimensional planar study, and a calculation of the change of the velocity profile from the low- $c$ parabolic form.
Funding
E.B. acknowledges support from grant no. 2022688 from the US–Israel Binational Science Foundation (BSF). H.A.S. acknowledges support from grant no. CBET-2246791 from the US National Science Foundation (NSF).
Declaration of interests
The authors report no conflict of interest.


 Open access

