


Introduction
The elderly population is increasing day by day and its ratio to the general population of the world is 9 %. In addition, it is reported that this rate will increase in the projection studies, and it is expected to be 16 % in 2050(1,2) . This increase in the elderly population, together with age-related degenerative changes, causes limitations in physical, mental and/or social functions that negatively affect the quality of life as a result of acute and/or chronic diseases(Reference Calderón-Larrañaga, Vetrano and Welmer3).
Age-Related Macular Degeneration (AMD), a clinical condition characterised by pigmentary and atrophic changes in the macula and progressive decrease in central visual acuity, is a neurodegenerative disease with multifactorial risk factors that selectively affect the macular region of the retina, especially in individuals over 50 years of age. It is stated as the third main cause of progressive bilateral visual loss(Reference Paulus and de Jong4–Reference Wong, Su and Li6).
Nutrition is effective in all stages of life, from the beginning to the end of life, on metabolic pathways, and on oxidative processes that can play a key role on the basis of many diseases(Reference Lean7). It has been stated that oxidative stress, which is effective in metabolic processes, is also involved in the aetiology of Age-Related Eye Diseases (AREDs)(Reference Ung, Pattamatta and Carnt8). When the studies in the literature are examined, it is seen that the pathology most associated with nutrition and antioxidant nutrients among AREDs is AMD(Reference McCusker, Durrani and Payette9–Reference Chiu, Shen and Venkatakrishnan12).
Food Frequency Questionnaires (FFQs) are commonly used nutritional habits assessment tools in epidemiological studies investigating the relationship between dietary intakes and disease or risk factors. These questionnaires consist of three main components: a list of foods, frequency of consumption and portion size(Reference Piermarocchi, Tognetto and Piermarocchi13). The FFQ which is used in AREDs was developed based on version 2.1 of the American National Cancer Institute Health Habits and History Questionnaire. Since age-related macular degeneration pathology is associated with antioxidant foods, this questionnaire was developed based only on foods rich in antioxidant content(Reference Rodrigo, Aranceta and Salvador14).
In our country, an increase in AREDs is expected due to the increase in the elderly population, and there is no nutrition-specific FFQ in AREDs. In the present study, we aimed to bring this AREDS FFQ, which was developed for AREDs in the USA, to the literature by conducting a Turkish validity and reliability study and used in AMD patients. For the validity evaluation of this frequency, the dietary record, which is stated to be a gold standard method for determining energy and nutrient intake, was used(Reference Bijani, Esmaili and Ghadimi15). Therefore, in the present study, it was aimed to evaluate the validity of the frequency using the Dietary Records (DRs).
Method
Study group
The study sample comprises male and female volunteers aged 50 years and over, who refer to a university hospital ophthalmology department between April and August 2019, were diagnosed with AMD by the relevant physician, and did not undergo any ocular surgery other than cataracts. Individuals with diabetes mellitus, those who could not provide communication coordination and did not agree to take part in the study were not included in the study. In the first stage of the study design, 110 individuals were included. However, ten individuals with missing data in their DRs were excluded from the study, and the study was completed with 100 individuals.
Study design
The research comprises five stages. In the first stage, the National Eye Institute (NEI), a sub-unit of the American National Institute of Health (NIH), was contacted via e-mail regarding the use of the FFQ, and permission was obtained for the use of the questionnaire. Following this, translation and adaptation work was carried out. In the second stage of the research, a pilot application was carried out, and the final version of the questionnaire to be applied was determined. In the pilot study, the difficulties encountered by applying the translated FFQ to the individuals were recorded, and attention was paid to these issues while questioning the individuals. In the third stage, a general information form, including socio-demographic characteristics, was presented to the individuals. In addition to these, anthropometric measurements, including the body weight and height of individuals, were taken by the researcher. The researchers performed the measurements of weight using a Tanita BC532 device and height measurements using a stadiometer in accordance with their techniques(Reference Lohman, Roche and Martorell16). Body Mass Index (BMI) values of individuals were calculated with the equation of body weight (kg)/height (m2). The BMI data were evaluated according to World Health Organization (WHO)'s classification(17).
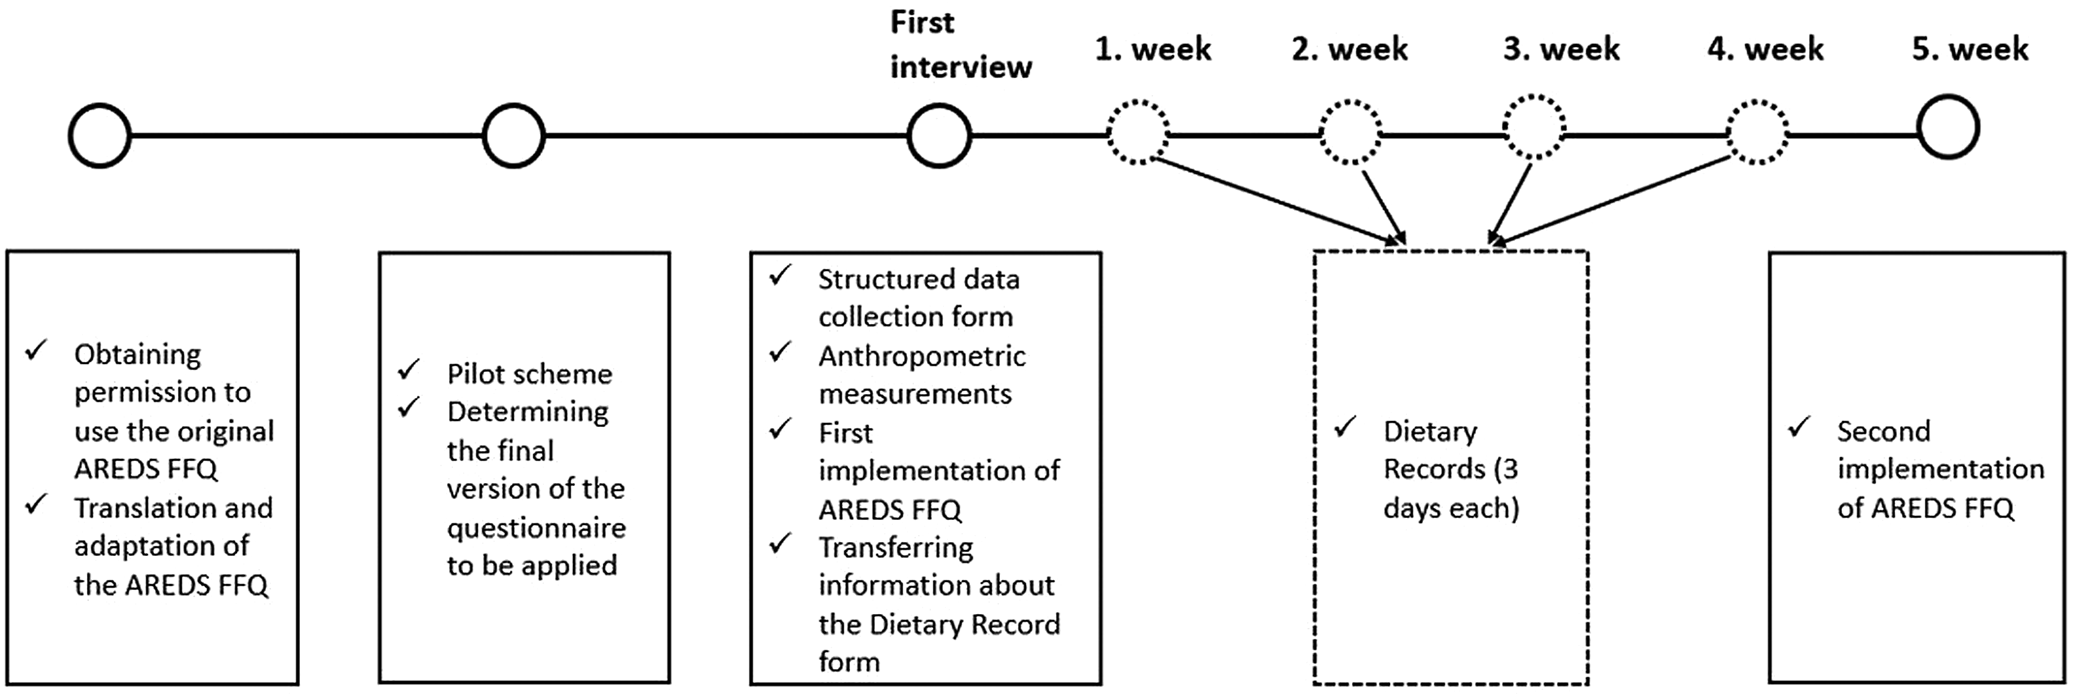
Again, at this stage, adapted AREDS FFQ was applied to the individuals by the face-to-face interview method. In the fourth stage of the study, 12 d of DR were taken from the individuals over 4 weeks, including 3-d DR on two consecutive weekdays and one weekend day. If the individual does not have self-efficacy in nutrition (lack of vision, illiteracy, lack of kitchen scale), we contacted the person who is interested in nutrition. The data on the person who takes care of the patient's nutrition were obtained from the patient or the patient's companion. In the last stage, adapted AREDS FFQ was applied to the individuals for the second time. The study design is presented in Fig. 1.
Study design: The original form of AREDS FFQ was obtained from NEI and translation and adaptation studies were performed. A pilot study was conducted to determine how long the survey would take on average, and a practice was created on how to ask about food consumption. In the first interview, the general information of the individuals was questioned with a structured questionnaire and anthropometric measurements of the individuals were taken. In addition, the first application of AREDS FFQ was carried out and it was explained how to get DR (3 days * 4 weeks). In the last week, AREDS FFQ was reapplied and the study was completed.
Adaptation study of the AREDS FFQ
To determine the validity and reliability of the AREDS FFQ in Turkey, the original questionnaire was translated into Turkish by two dietitians with a good command of English firstly. While the original version of the scale included eight subtitles (fruits and juices, breakfast foods, vegetables, red meat-fish-poultry-lunch items, breads-snacks-spreads, dairy products, sweets and beverages) and ninety foods and beverages, two foods (liverwurst and cooked verelas-grits) that were not used in the Turkish population were excluded in this study. For the foods consumed by the Turkish society, an expert opinion, who specialised in nutrition and dietetics, was taken, and the ingredient of chilli with beans was changed to dry beans and chickpeas, the ingredient containing lentils to other legumes, and sweet potato to beet. In the inquiry regarding the consumption of yogurt, the expression ‘frozen’ was removed from the substance content. Peaches-apricots were questioned not as canned but as compote, and meat products such as salami, bacon and chops were questioned based on animals consumed in Turkish society, not pork. In addition, red hot pepper paste, which is consumed in Turkish society, was added to the item in which the red chilli sauce was questioned. The final version of the FFQ is different from the original format, two items were removed, and nine items were changed. As a result, the FFQ form adapted to Turkish society includes eight subheadings and eighty-eight foods. These subheadings are the same as the original.
Foods were evaluated by individuals in nine categories, ranging from ‘never or less than once a month’ to ‘twice a day or more’, according to the means consumption frequency of the last year. The frequency of the subheading of beverages differs from the nutrients and was evaluated in nine categories ranging from ‘never or less than once a month’ to ‘6 or more per day’. Portion sizes and nutrients stated in the original have been adapted for this study according to the portion sizes sold in the market and Turkey Food Based Dietary Guidelines 2015(18). The foods determined according to the consumption of the Turkish society and their medium weights were photographed by the researcher, and these photographs were used when questioning the consumption frequency of the individuals. For each food, the means serving size was also recorded as ‘small’, ‘medium’ or ‘large’. Medium portion sizes are specified in the survey, with a small portion representing a medium portion size of 0⋅5 or less, and a large portion representing a medium portion size of 1⋅5 or more. A pilot study was conducted with a group of five people to determine how well the questionnaire items were understood. The last form of the questionnaire was given with the corrections from the feedback.
Evaluation of data
The Nutrition Information System (NIS) 8.0 full version program was used to analyse the energy and nutrient intake of 12-d DR and the adapted format of the ‘AREDS FFQ’(19). By entering the adapted ‘AREDS FFQ’ and the 12-d DR data of the individuals the means daily, the antioxidant capacity of the diet was also calculated in mmol/100 g using two different methods. Since the antioxidant content of each food is not included in the NIS program, the missing data were recorded in the database based on the medians of the results of the study published by Carlsen et al. (Reference Carlsen, Halvorsen and Holte20). Dietary total antioxidant capacity was calculated using these data (By entering the antioxidant nutrients in the specified 100 g of the foods, the antioxidant content in the amounts of the foods consumed by the individuals was calculated.). The lutein + zeaxanthin contents of every food are not included in the NIS program. Thus, the United States Department of Agriculture (USDA) database was used to complete the missing data on the lutein + zeaxanthin content of foods(21). For foods that cannot be found exactly, products that are similar in content were processed into the NIS database, and calculations were made.
The results of the adapted ‘AREDS FFQ’, which was applied for the second time for everyone, were calculated in the same way to evaluate the reproducibility. Since the results received from AREDS FFQ-1 and AREDS FFQ-2 are the same, AREDS FFQ 1/2 is given as a single data in the tables (ICC = 1).
Statistical analysis
The statistical analysis stage of this study was prepared using IBM SPSS 22 software. Frequency analysis, descriptive statistical data analysis, normality tests, statistical hypothesis tests, repeated measurement analyses and fit tests were used. Paired samples t test was used to compare the means of normally distributed data for dependent groups. Parametric tests were chosen for mean comparisons since quantitative measurements provided the normal distribution condition. χ 2 was used in the analysis of qualitative data to evaluate whether the difference between the observed and expected frequencies was significant. It was accepted that there was a difference between the groups for the values determined as P < 0⋅05. In the study, the compatibility levels of FFQ and DR scales were evaluated with the Pearson Correlation Coefficient (PCC) and Bland–Altman graphical approach.
Results
The distribution of demographic characteristics of the individuals in the research is given in Table 1. Accordingly, 52 % of the individuals participating in the study are male, and 48 % are female. Of these individuals, 88 % are over 65 years old, 72 % are married and 23 % are smokers.
Evaluation of demographic characteristics and anthropometric measurements of individuals

BMI, Body Mass Index.
The range of individuals regarding BMI classification was also evaluated, and it was determined that 50⋅0 % of both men and women were overweight, 28⋅8 % of men and 43⋅7 % of women were obese (Table 1).
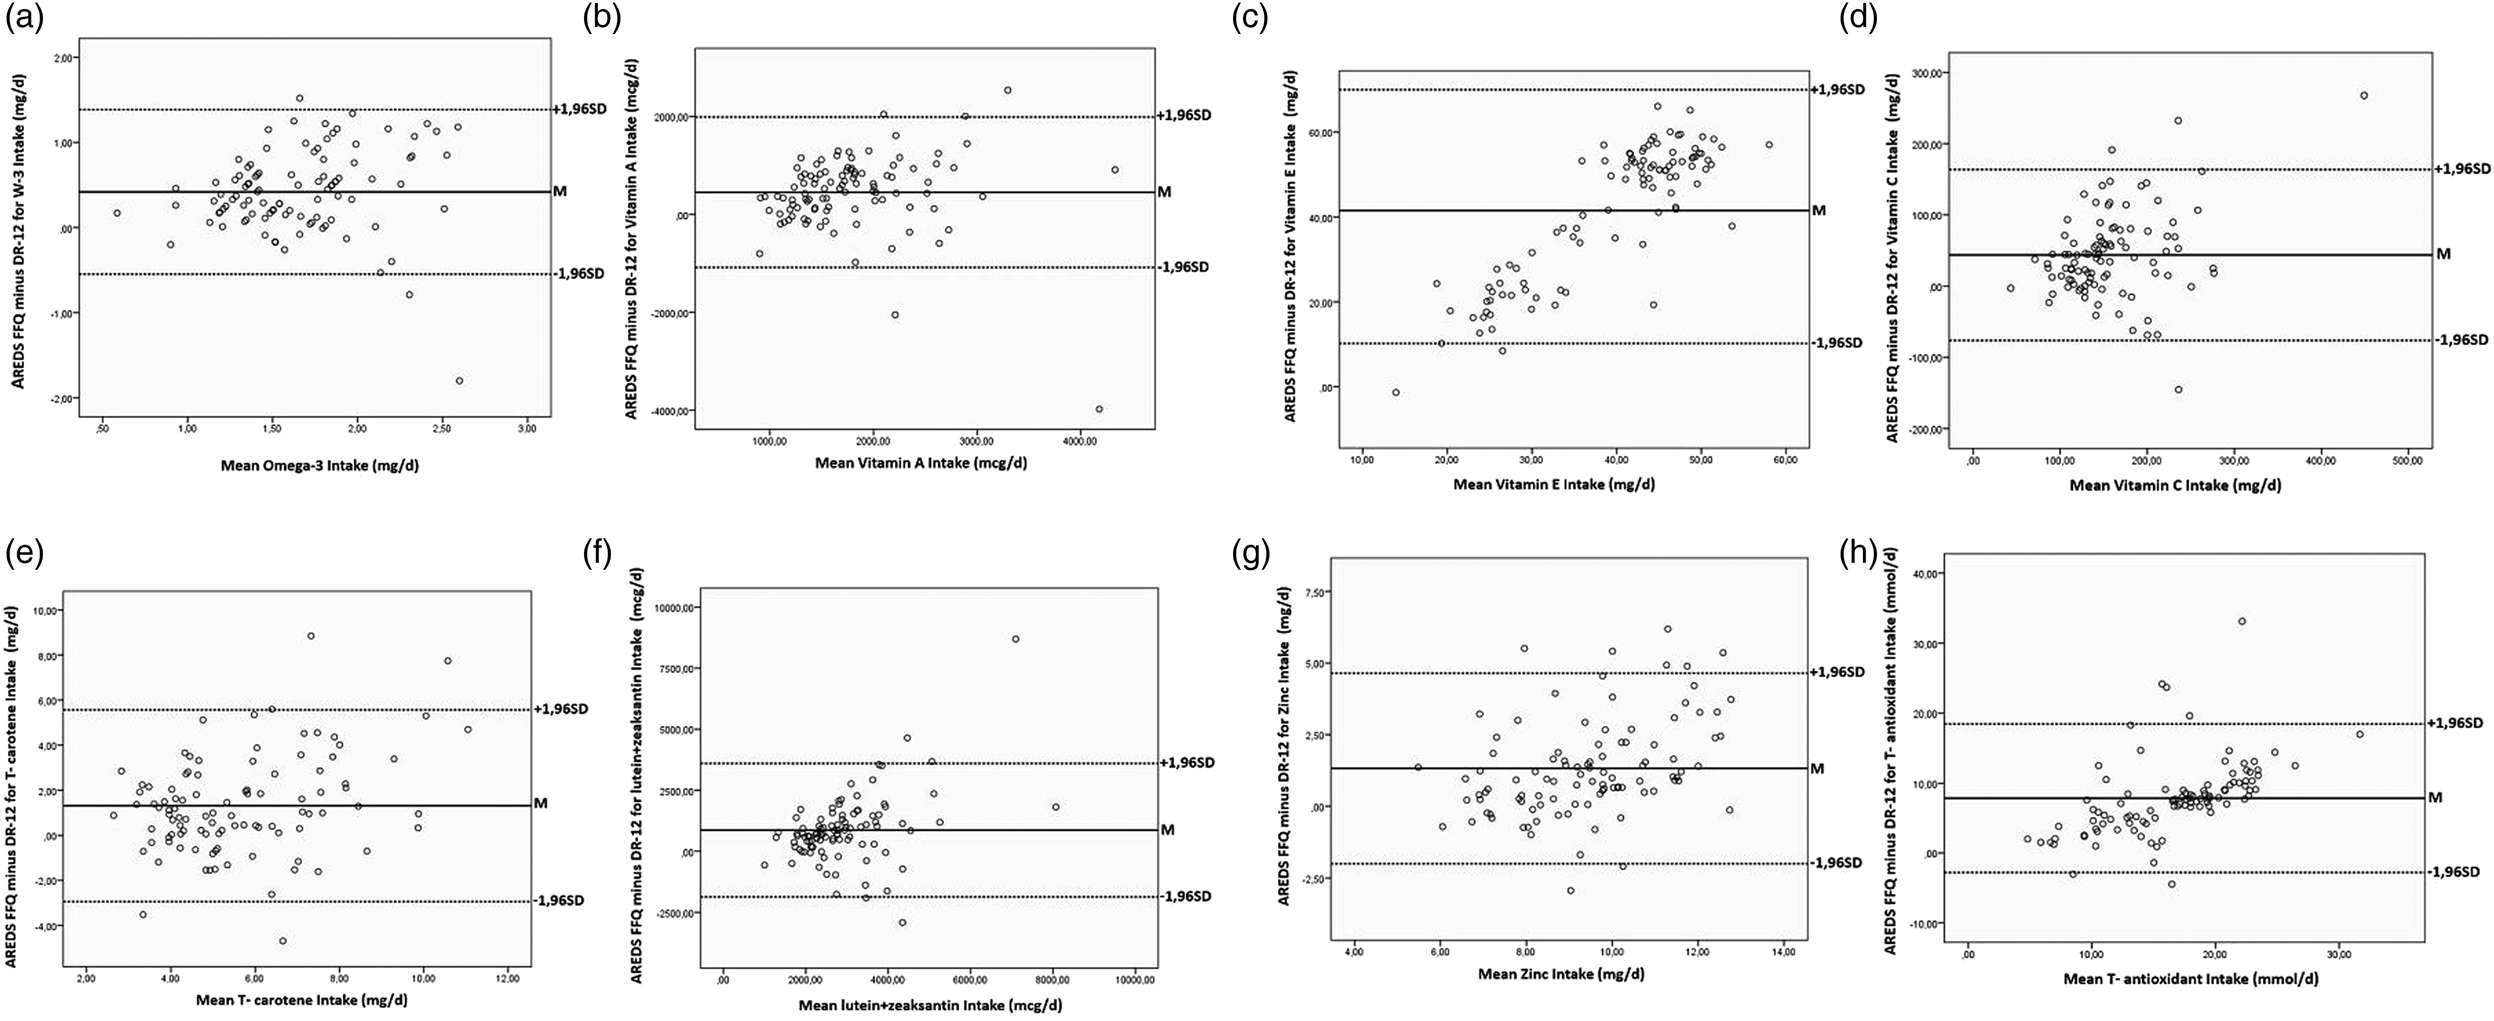
The results of AREDS FFQ-1 and 2, which we applied at 4-week intervals to test the reliability, were the same (ICC = 1). Data, obtained from AREDS FFQ 1/2, and DR, were analysed based on Bland–Altman's graphical approach to PCC to evaluate the compatibility between the two methods. The correlation coefficient of the two methods for omega 3, Vitamin A, total carotene, Vitamin C and zinc intake is moderately compatible (r Omega 3 = 0⋅455, r VitA = 0⋅516, r Totalcarotene = 0⋅509, r VitC = 0⋅492, r Zinc = 0⋅657) (Table 2). These nutrients were observed that 95 % of the data were within the limits of agreement (Fig. 2(a)–(c) and (f)).
Bland–Altman graphs of omega 3, antioxidant nutrients and total antioxidant capacity: This figure is intended to determine the fit between the two methods (AREDS FFQ and DR). (a) Omega 3 (mg/gün): The mean of Bland–Altman difference is 0⋅418, and the limits of agreement are between (−0⋅548) and (1⋅385). (b) Vitamin A (mcg/gün): The mean Bland–Altman difference is 450 427, and the fit limits are between (−1 085 212) and (1 986 066). (c) T-Carotene (mg/gün): The average of the Bland–Altman difference is 1⋅312, and the limits of agreement are between (−2⋅945) and (5⋅570). (d) Lutein + Zeaksantin (mcg/gün): The mean Bland–Altman difference is 864 138, and the fit limits are between (−1 866 07) and (3 594 345). (e) Vitamin E (mg/gün): The mean Bland–Altman difference is 41⋅533, and the fit limits are between (10⋅215) and (72⋅851). (f) Vitamin C (mg/gün): The mean of the Bland–Altman difference is 43 585, and the agreement limits are between (−76 381) and (163 551). (g) Zinc (mg/gün): The mean of the Bland–Altman difference is 1322, and the agreement limits are between (−2⋅002) and (4646). (h) T-Antioxidant (mg/gün): The mean of the Bland–Altman difference is 7⋅838, and the agreement limits are between (−2773) and (18 451). The Bland–Altman graphical approaches showed that 95 % of the data is within the limits of agreement, and the scattering is concentrated around the mean (T-carotene, total carotene; T-antioxidants, total antioxidants).
The validity statistics of the AREDS FFQ according to the dietary record components

d, mean difference; AREDS FFQ, Age-Related Eye Diseases Study Group Food Frequency Questionnaire.
The correlation coefficient between the two methods of lutein + zeaxanthin, Vitamin E, and daily total antioxidant intake reported moderate association (r lutein + zeaxanthin = 0⋅457, r VitE = 0⋅536, r Totalantioxidant = 0⋅630) (Table 2). The Bland–Altman graphical approaches showed that 95 % of the data was within the limits of agreement, and the scattering was concentrated around the mean (Fig. 2(d), (e) and (h)).
Table 2 presents the validity statistics of AREDS FFQ according to DR components. According to these results, the means of omega 3, antioxidant nutrients (vitamin A, total carotene, lutein + zexanthin, vitamin E, vitamin C, zinc) and dietary antioxidant capacity obtained from AREDS FFQ 1/2 were statistically significantly higher than the means of DR (P paired sample t test <0⋅05). The PCC, obtained from AREDS FFQ 1/2 and DR, was related to nutrients and dietary antioxidant capacity. The PCC of all values showed a moderate relationship between the two methods.
Discussion
Today, in parallel with the increase in life expectancy at birth, it is emphasised that long life is accompanied by the quality of life and health is much more important than life expectancy. In this context, the primary goal in old age is given as ‘preservation of the quality of life’(Reference Talarska, Tobis and Kotkowiak22). Depending on aging, some functional changes occur in the eye with other organs. These changes negatively affect the quality of life of the elderly(Reference Pelletier, Rojas-Roldan and Coffin23). Age is a proven risk factor for AMD(Reference Armstrong and Mousavi24). In the present study, which was planned for patients aged 50+ years and AMD, individuals aged 65 years and over were the majority.
Studies that consider gender as a risk factor for AMD are controversial(Reference Jonas, Cheung and Panda-Jonas25–Reference Winkler, Brandl and Grassmann27). In a review, the female gender was a risk factor for the prevalence of AMD, while the meta-analysis found no difference between the genders in terms of AMD risk(Reference Jonas, Cheung and Panda-Jonas25,Reference Zetterberg26) . One study indicated that the female gender was a risk factor and underlined that this may be because of the longer life expectancy in women than in men(Reference Zetterberg26). In the present study, the distribution of individuals by gender was similar (52 % male, 48 % female). A study that assessed socio-demographic parameters as potential risk factors for AMD emphasised that marital status was associated with AMD(Reference Chatziralli, Mitropoulos and Niakas28). Some argue that this is because if the person lives with someone, that individual receives assistance in accessing health services, thus enabling the diagnosis of the disease(Reference Chatziralli, Mitropoulos and Niakas28). Most of the individuals (72 %) were married in our research, which supports the study mentioned above.
Studies have reported that smoking is effective in oxidative stress, which is involved in the pathogenesis of AMD(Reference Velilla, García-Medina and García-Layana29,Reference Venza, Visalli and Oteri30) . A case-control study concluded that smoking is a primary risk factor affecting the development of AMD(Reference La Torre, Pacella and Saulle31). In the present study, one-fifth of the individuals were smokers (23 %). This rate is similar to both the Turkey Nutrition and Health Survey-2017 and the study above(32). An article brought to the literature by Delcourt et al. (Reference Delcourt, Cristol and Tessier33) reported that individuals who smoked in the past and are currently smoking are also at high risk of AMD. In the present study, the distribution of individuals who have smoked and quit before was examined, it was observed that this rate was higher (34 %) than the current smoking rate. Considering the rates of current and former smokers, smoking may affect the development of AMD.
One study stated that the risk of AMD increases as the BMI value increases. Individuals evaluated as obese according to BMI value have a faster progression of AMD (RR = 2⋅2)(Reference Seddon34). However, there are also studies in the literature in which there is no statistically significant relationship between BMI and AMD(Reference Munch, Linneberg and Larsen35,Reference Jaisankar, Swaminathan and Roy36) . In the present study, when individuals according to gender were evaluated, it was identified that according to BMI values, half of both men and women were overweight, and 36⋅0 % of the whole sample were obese. These results obtained from the patient group with AMD were in line with the studies revealing the relationship between BMI and AMD.
Although dietary assessment methods rarely represent dietary habits, DRs are considered the gold standard because they can provide relatively accurate quantitative information about an individual's actual consumption(Reference Bijani, Esmaili and Ghadimi15). DRs, in which weight measurements of foods are made, are widely used and accepted as a suitable reference method for the validation of FFQ(Reference Cade, Burley and Warm37). In studies conducted with individuals aged 65 and over, it has been reported that individuals in this age group have acceptable levels of compliance and completion of DR(Reference Bates, Prentice and Cole38,Reference Hughes, Smithers and Gay39) . In our study conducted in line with these results, individuals were asked to measure the weight of the foods consumed, but this could not be achieved (lack of vision, illiteracy and lack of kitchen scale), so the amount consumed was tried to be estimated most accurately with the help of the photographs taken by the researcher and the detailed explanation of the researcher.
It was determined that the test–retest application results of AREDS FFQ were the same. This result may be due to questioning by excluding seasonal variation and the fact that elderly individuals’ food consumption is generally stable. The primary purpose of the FFQ used in AREDS is to determine the intake of nutrients that can also show antioxidant properties. Only PCCs were presented in the findings of the study, in which the questionnaire was developed(Reference Chiu, Milton and Klein40–Reference Kuriniji, Gensler and Milton42). For this reason, some evaluations made for the validity and reliability study could not be compared with other data and were only interpreted, considering the statistical method applied. In the present study, PCCs for omega 3, antioxidant nutrients and total antioxidant intake were found between 0⋅40 and 0⋅69, which indicates moderate agreement (P-values of these nutrients are <0⋅001).
It was determined that the means of omega 3, antioxidant nutrients and total antioxidant intake obtained from the FFQ used in AREDs were higher than the means obtained from the DRs (P < 0⋅01). In the literature, the means gained from the AREDS FFQ of macronutrients (including omega 3) are higher than the means received from the DR; thus, it has been reported that micronutrient values vary(Reference Kuriniji, Gensler and Milton42–Reference Rothenberg46).
In the present study, omega 3 (EPA + DHA) intake obtained with AREDS FFQ (1⋅9 ± 0⋅49) was determined to be higher than the studies in the literature(Reference Chiu, Chang and Zhang47,Reference Seddon, Rosner and Sperduto48) . When the compatibility studies between the two methods of omega 3 intakes were examined, separate results were achieved for EPA and DHA, and these PCCs (r EPA = 0⋅35; r DHA = 0⋅32) were found to be lower than those in the present study (r = 0⋅455, P < 0⋅001)(Reference Chiu, Milton and Klein40,Reference Kuriniji, Gensler and Milton42) . The fact that the region where the study was carried out is by the sea can explain the high fish consumption and therefore the high amount of omega 3. In addition, the original study only looked at correlations for EPA and DHA, not total omega 3. Since these components are not listed separately in the NIS database, total omega 3 was taken into consideration. It is thought that this situation may also affect the result.
In the study by Seddon et al. (Reference Seddon, Ajani and Sperduto49) (34 971⋅4 mcg), PCC (r = 0⋅516) was lower than the correlation coefficient obtained from the study of the AREDS group (r VitA = 0⋅9)(Reference SanGiovanni, Chew and Clemons41,Reference Kuriniji, Gensler and Milton42) . Since β-cryptoxanthin, lycopene and β-carotene values are very limited in databases where nutritional content is analysed, they were not evaluated separately, but total carotene intake was taken into consideration. Compared with the study data (27⋅3 mg) published by Seddon et al. (Reference Seddon, Ajani and Sperduto49), it was concluded that carotenoid intakes (6⋅3 mg) in the present study were lower. In terms of total carotene intakes, it was determined that there was a moderate relationship between both methods (r = 0⋅509, P < 0⋅001). It was determined that lutein + zeaxanthin intakes (x̄ = 3349⋅6 ± 152⋅83 mcg) in this study were higher than the value determined by Chiu et al. (Reference Chiu, Chang and Zhang47) (third quintiles) (x̄ = 1511⋅08 ± 781⋅37; 1668⋅17 ± 1059⋅23 mcg). It was determined that the agreement between the two methods showed a moderate level, and the coefficient of agreement in our study was higher than the value published by Chiu et al. (Reference Chiu, Milton and Klein40) and similar to the value published by the AREDS group(Reference SanGiovanni, Chew and Clemons41) (r = 0⋅457; r Chiuetal = 0⋅24; r AREDS = 0⋅6, respectively).
It was concluded that Vitamin E intakes in the present study were higher than those from the study in which dietary intake was determined by AREDS FFQ(Reference Chiu, Chang and Zhang47). When the compatibility studies on the validity of AREDS FFQ in the literature are examined, it can be seen that the coefficient of agreement (r = 0⋅428, P < 0⋅001) related to vitamin E in our study is higher than both the value published by the AREDS group(Reference SanGiovanni, Chew and Clemons41,Reference Kuriniji, Gensler and Milton42) and the value published by Chiu et al. (Reference Chiu, Milton and Klein40) (r = 0⋅428; r Chiuetal = 0⋅26; r AREDS = 0⋅1). While in previous studies, a negligible low correlation was found between the two methods for Vitamin E, a moderate correlation was found between the two methods in this study (r = 0⋅40–0⋅69, P < 0⋅001).
Compared with the data (Third quintiles = 101⋅3; 106⋅3) evaluating the dietary intake of Vitamin C with AREDS FFQ, it was observed that the mean intake of Vitamin C in the present study was higher(Reference Chiu, Chang and Zhang47). It was determined that the PCC determined for Vitamin C and the correlation coefficients determined in other studies were similar (r = 0⋅492, P < 0⋅001). A moderate correlation regarding Vitamin C intake was found between the two methods applied in all studies (r = 0⋅40–0⋅69)(Reference Chiu, Milton and Klein40–Reference Kuriniji, Gensler and Milton42).
Zinc intake means are like the data received by the same FFQ in the literature(Reference Rothenberg46). PCC shows a moderate agreement between DR and AREDS FFQ (r = 0⋅657, P < 0⋅001). While the zinc correlation coefficient was not included in the AREDS group, it was determined in another study that the relevant PCC showed a low-level relationship between the two methods (r Chiuetal = 0⋅38)(Reference Chiu, Milton and Klein40). It has been reported that the PCC between the FFQ and reference measurements is higher in the questionnaires administered by the researcher than in the self-administered questionnaires(Reference Cade, Burley and Warm37). This explains that the PCC between the two methods applied in this study is higher than the studies in the literature.
There is no study in the literature evaluating dietary total antioxidant capacity with AREDS FFQ. In the study conducted by Arslan et al. (Reference Arslan, Kadayifçilar and Samur50) in Turkey, in which the total antioxidant capacity value was determined via another FFQ, it was identified that the total antioxidant capacity of the cases with AMD was lower than our study. In our study, the agreement between the two methods of total antioxidant intake was moderate (r = 0⋅630).
When the correlation coefficients obtained from our study were evaluated, although an absolute correlation was not mentioned, it was concluded that FFQ could also be used for Turkish adults since it was similar to the correlation coefficients in the study in which it was developed (in some higher, for example, omega 3). Bringing this scale, which is rich in antioxidant nutrients, and is used in AREDS, to Turkish society and filling the gap in this field in our country is the main strength of the research. In addition, in order to achieve the closest result with the FFQ, in which one-year food consumption is questioned, 12-d DRs for 3 days–4 weeks make this study unique. However, there are of course some limitations. One of our limitations is not evaluating the relationship between plasma antioxidant levels and dietary antioxidant intake levels. In addition, as with all nutrients, it is necessary to determine the number of many carotenoids such as lutein + zeaxanthin, beta-cryptoxanthin and lycopene, which are associated with AMD, in the content of foods consumed in our country. The fact that the relevant items were drawn in the USDA database represents another limitation.
Conclusion and recommendations
Considering the PCC values and the Bland–Altman graphical approach, the AREDS FFQ adapted to Turkish adults is appropriate to determine the dietary intake levels of antioxidant nutrients. The concordance (correlation coefficients) obtained in this study were found to be similar to the study in which the questionnaire was developed (in some higher, for example, omega 3). Based on these results, the AREDS FFQ, adapted to Turkish adults, is a suitable tool for determining the dietary intake levels of antioxidant nutrients. However, as stated in the added limitations, the lack of a database of foods in our country for carotene v. levels in foods may have affected the results.
It is predicted that this FFQ, which can be completed more quickly than DR, can be used in epidemiological studies, especially on AREDs. In the present study, it is thought that the antioxidant nutrient intake of individuals can be determined with the FFQ used in AREDs with high antioxidant nutrient content and adapted to the Turkish society, and the risk of AMD development and progression can be reduced by providing relevant interventions.
To reveal the relationship between antioxidant nutrients and AMD more clearly, there is a need for comprehensive studies in which a control group is added, and the serum total antioxidant capacity of individuals is examined.
Acknowledgements
We are thankful to the National Eye Institute in the units of the American National Institutes of Health for their support in the first step of our study by forwarding the original format of AREDS FFQ to us. We thank Gazi University Academic Writing Application and Research Center for proofreading the article.
Ş. A. (Corresponding author): Conceptualisation, methodology, software, validation, investigation, resources, data curation, writing and visualisation preparation. E. K. (Co-author): Conceptualisation, methodology, software, validation, resources, data curation, writing – review and editing and supervision.
There is no support for this research.
The authors declare that they have no known competing financial interests or personal relationships that could have appeared to influence the work reported in this paper.
This study was conducted according to the guidelines laid down in the Declaration of Helsinki and all procedures involving research study participants were approved the numbered 77082166-302.08.01 and dated 31/12/2018 by Gazi University Ethics Commission. Written (or Verbal) informed consent was obtained from all subjects/patients. Verbal consent was witnessed and formally recorded.


 Open access