


With approximately 2·5 billion people involved in smallholder farming(1), opportunities for agriculture to influence human diets have long been a focus of international development efforts. Multiple pathways linking agriculture and nutrition have been described(2), yet evidence to demonstrate nutritional impacts of agricultural programmes has historically been limited(Reference Girard, Self and McAuliffe3–Reference Webb and Kennedy5). A review based on a global mapping study of current agriculture-nutrition research(Reference Hawkes, Turner and Waage6) attributed inappropriate selection of outcome indicators as contributing to a lack of empirical evidence to demonstrate impact within the time frames and sample sizes of current projects(Reference Herforth and Ballard7). Instead, indicators of improved food access, food consumption and dietary adequacy are proposed to be closer to the plausible measurable impact pathways for agricultural programmes than changes in child stunting, which has multiple non-dietary causes(Reference Leroy and Frongillo8).
There is a risk that the complexity of assessing diets may be overlooked within interdisciplinary research teams, where there are often competing priorities for project resources and where expectations for impact may differ. Quantitative assessments of dietary intake are time-intensive and require highly specialised skills within a field team(Reference Coates, Colaiezzi and Bell9). Alternative approaches relate to measures of dietary diversity, whereby the number of different food groups or individual food items consumed over a given reference period is recorded(Reference Swindale and Bilinsky10–12). Dietary diversity may be assessed at the level of the household, where it is strongly associated with socioeconomic status and is considered a useful indicator of food security(Reference Hoddinott and Yohannes13), or the individual, as a proxy measure for the macro- and micronutrient adequacy of diets(12,Reference Ruel14) . A recent review of forty-six agriculture-nutrition projects employing dietary diversity indicators revealed a high degree of inconsistency in their use at a household level, including in the classification of food groups and interpretation of findings, and called for greater understanding and harmonisation in this area(Reference Verger, Ballard and Dop15).
The effectiveness of any method in documenting diets relies on an understanding of the full spectrum of food resources in a given setting and is aided by development of or access to existing locally adapted food lists. These may include non-cultivated plants, undomesticated animals and insects which are utilised to varying degrees according to demographic, sociocultural and seasonal influences(Reference Termote, Raneri and Deptford16). Of particular importance in rural communities which rely on rainfed agriculture are the fluctuations in food access and dietary quality which occur over the course of a year. Vulnerable households face a risk of food shortage between the depletion of 1 year’s cereal stocks and the harvest of crops the following year(Reference da Costa, Lopes and Ximenes17). Temporal variation may also be seen in access to nutrient-rich foods, due to variation in productivity and disease patterns amongst extensively-managed livestock(Reference Mwai, Hanotte and Kwon18), and limited options for preservation of fruits and vegetables in rural settings(Reference Faber and Laubscher19). This potentially marked variation in food access and dietary quality is not captured in cross-sectional surveys, including national survey data, such as Demographic and Health Surveys. Estimates of the accuracy of dietary assessments in low-income countries are limited and may face challenges associated with cultural and linguistic differences, a heightened power imbalance between investigators and participants and unfamiliarity with processes of and motivations for data collection(Reference Molyneux, Wassenaar and Peshu20). Innovative technologies, such as wearable cameras, offer value in enhancing the quality, objectivity and efficiency of data collection, but their feasibility and validity in rural settings in low-income countries remain under investigation.
The present study involved the development, application and evaluation of a picture-based research tool, to enable contemporaneous respondent-recording of data on food consumption within households in rural communities, for a single 24-h recall period each month over an extended period. If shown to be feasible and valid, such a tool would facilitate prospective collection of dietary data at multiple time-points over the course of a research or development project – for example, to reflect seasonal variation or evaluate programmatic impact – with substantially lower investment of financial and human resources. The present paper presents the feasibility and relative validity of this innovative approach for assessing household dietary diversity over time in four villages of central Tanzania. It is a sub-study of a study aiming to develop pictorial tools to (1) document dietary diversity at a household level and (2) quantify volumes of cows’ milk collected and sold. An associated research project (Strengthening food and nutrition security through family poultry and crop integration in Tanzania and Zambia (‘Nkuku4U’); funded by the Australian Centre for International Agricultural Research) establishing village chicken vaccination programmes and providing training and resources to improve crop diversity, production and storage was conducted in the same communities prior to the present study, between May 2014 and May 2018(Reference Alders, Aongola and Bagnol21,Reference de Bruyn, Thomson and Darnton-Hill22) .
Methods
Study area and sampling
The study was conducted in four rural communities in Manyoni District, Singida Region in the semi-arid Central Zone of Tanzania. Eligibility criteria for inclusion in the study were that households currently kept at least one lactating cow, either owned by the household or kept on a long-term basis for other households, and the family intended to remain within the study area for 12 months. Listings of eligible households were compiled, drawing on (a) those participating in the previous Nkuku4U study, based on a community-wide census, (b) those recorded as cattle-keeping households at the village office and (c) additional households known to local enumerators. Random selection was used to select thirty households in each of the four villages (n 120). With a two-sided significance of 0·05 and a power of 0·8, the inclusion of 101 households in analyses presented in this paper (Fig. 1) is adequate to detect an effect size of 0·40 standard deviations in Household Dietary Diversity Scores (HDDS) between dietary assessment methods under investigation. This calculation is based on an overall mean HDDS of 6·68 (sd 1·43) within the study sample and corresponds to a detectable intermethod difference of 0·57 in the HDDS.
Number of households enrolled in the study via random selection and number completing activities within the baseline study. The three methods of dietary assessment evaluated within this article are marked.

Ethical approval
The present study was conducted according to the guidelines laid down in the Declaration of Helsinki. Study design, protocols and research tools were approved by the University of Greenwich’s Research Ethics Committee (UREC/17.5.5.11) and endorsed by the Tanzanian National Institute for Medical Research ethics committee (NIMR/HQ/R.8a/Vol. IX/1690). A printed participant information statement was provided to all participating households at the commencement of the study. To accommodate varying levels of literacy, all documents were read aloud to study participants by enumerators and informed consent was given via a signature or thumb print. Unique identifying codes were used on all research tools to maintain anonymity of completed records.
Data collection
Questionnaire
Male and female enumerators were recruited from the community and trained to administer a semi-structured questionnaire to a representative member from each enrolled household. A household was defined as a group of people living together and sharing food from the same pot, for at least 3 d of each week for the previous 6 months(Reference Alkire, Meinzen-Dick and Peterman23). This definition seeks to encompass individuals who share resources and make common budget and expenditure decisions. The questionnaire included questions on household composition, level of formal education, assets and livelihood strategies, crops cultivated in the previous agricultural season, livestock ownership, cattle management and cows’ milk production. Printed survey questionnaires and training sessions were in Swahili, but enumerators were encouraged to use Kigogo, the language of the predominant local language group, as appropriate.
Pictorial record charts
Pictorial record charts to document dietary diversity at a household level were developed using open-access images, adapted to reflect food resources in the study setting, and Swahili text. The list of pictured food items was informed by prior dietary surveys of mothers and children, performed at 6-month intervals through the Nkuku4U project. Two rounds of pre-testing were conducted, in July 2018 and September 2018, to evaluate picture recognition, chart layout and participant engagement with the tool. Both black-and-white and colour pictures were evaluated during pre-testing. Colour was identified to be an important element in food item recognition, and a full-colour version of the pictorial chart was used in the present study. An English version of the finalised tool is included as online Supplementary Material S1. The household member responsible for food preparation was selected as the primary respondent for the research tool. Training was conducted with single or groups of two to three participants in late October and early November 2018, using a participatory approach and based on a standardised training plan. This was led by a native Swahili speaker, with translation to Kigogo where appropriate, and general support from the principal investigator (J. de B.). For one ‘recording day’ (the day following training during the baseline study and the first day of each month thereafter), respondents were asked to use a cross or shading to mark pictures corresponding to all items consumed by one or more members of their household within the home or prepared for consumption outside the home on that day.
Five representatives from the study area (including three women) were hired as ‘Community Assistants’, to facilitate baseline activities, provide local language translation and coordinate monthly data collection using the pictorial record charts. These were selected from a group of eight local people who had worked in a similar capacity with the previous Nkuku4U project. Suitable candidates were identified in consultation with local leaders, with the requirements of adequate literacy and numeracy, demonstrated reliability and being well-respected within the community. Following the baseline study, each Community Assistant was responsible for managing data collection from approximately thirty participating households in a single village (with two Community Assistants allocated to one particular village, due to large geographic distances between households). The role involved (a) distributing charts on the last day of each month; (b) providing additional training on picture recognition and the nature of the task, as required; (c) returning 2 d later to collect completed or uncompleted charts and (d) recording any confusion or challenges encountered on the day of data collection. A monthly allowance was provided to Community Assistants on delivery of charts to a designated contact person at the district council. Charts were scanned and uploaded into a secure online repository, for data entry, cleaning and analysis by the principal investigator.
Interview-based 24-h food recall
During the first data collection period, participants were visited the day following the recording day by the principal investigator, a Tanzanian research assistant and a Community Assistant. The completed pictorial record chart was received, and before reviewing its contents, the research assistant conducted a conventional interview-based household-level 24-h food recall (H24HR). This was done with the same household member who had completed the pictorial chart, using the previous day as the reference period. The ‘open recall’ method of data collection was followed, in which probing questions were used to assist the informant in recalling all items consumed by one or more household members within the home, or prepared for consumption outside the home, and identifying ingredients of mixed dishes(12). A two-step approach required the enumerator to first write all foods and ingredients mentioned and then, at the end of the interview, to circle each item from a list and pass through the list to probe for items not mentioned.
After completion of the interview, discrepancies between enumerator- and participant-recorded data were identified. Differences between the two records were discussed, including items missing from one or other of the records, and a separate record was made of the ‘reconciled data’. This has not been included in intermethod comparisons, but is presented in summaries of the percentage of households consuming specific food groups and food items, alongside the methods under investigation (Table 3). A second H24HR was conducted on a different, non-consecutive day to test whether pictorial data collection may have influenced recall in the interview-based assessment. This was done within 5 d of application of the pictorial chart: beforehand for half the households, and afterwards for the remaining half, to account for biases related to the chronology of data collection.
Data and statistical analysis
HDDS were calculated from the total number of food groups recorded, using a set of twelve food groups: (A) cereals; (B) roots and tubers; (C) vegetables; (D) fruits; (E) meat, poultry and offal; (F) eggs; (G) fish and seafood; (H) pulses, legumes and nuts; (I) milk and milk products; (J) oils and fats; (K) sugar and honey and (L) miscellaneous items(Reference Swindale and Bilinsky10,Reference Kennedy, Ballard and Dop11) . For each household, HDDS was calculated for each of the three assessments:
(1) Participant-completed pictorial record charts;
(2) Interview-based recall for the same time period;
(3) Interview-based recall for an alternative time period.
Descriptive statistics were used to characterise the study population, at household and individual levels. Median HDDS and proportions of households recording consumption of foods, by group and by item, were calculated for each of the three methods. Separate Wilcoxon signed-rank tests were used to evaluate differences between:
(a) alternative methods applied for the same recall period (i.e. methods 1 and 2, above) and
(b) the same method applied for different recall periods (i.e. methods 2 and 3).
For the two methods of dietary assessment applied for the same recall period, Cohen’s κ tests were run to test the significance and level of intermethod concordance in documenting consumption of food groups and food items. This sought to validate the novel approach of participant-completed pictorial charts against the conventional approach of interview-based recall. Use of κ coefficients has enabled correction for the amount of intermethod agreement which might be expected to occur due to chance. This is a common approach in studies where a ‘gold standard’ reference measurement is not available, and the prevalence (i.e. consumption of a given food group or item) is unknown(Reference Feinstein and Cicchetti24).
In a second component of the analysis, McNemar’s test for related groups was used to evaluate group-level differences in the percentage of households recorded as having consumed food groups and food items using the H24HR method: following participant-completion of the pictorial charts (method 2) v. on an alternative day (method 3). This sought to explore whether the task of chart completion may have prompted recall of more food items the following day, compared with an interview conducted at another point in time. Differences were considered significant at P < 0·05. All analyses were conducted using SPSS Statistics (version 25).
Results
Completion rate
Of a total of 120 households selected for participation in the study, 98·3 % completed the baseline questionnaire (Fig. 1). Pictorial record charts were distributed to and training conducted for 113 households (94·2 %) between late October and early November 2018. Of 109 households available for a follow-up visit on the day immediately following the recording day, 96·3 % (i.e. 84·2 % of those recruited to the study) had completed the chart (Fig. 1). Four charts were excluded from further analysis due to a fundamental misunderstanding of the task (e.g. definition of the recording period).
Characteristics of the study population
The mean age of questionnaire respondents was 46·2 years, 60·2 % were female and 94·1 % identified with the Gogo language group (Table 1). The large majority of household heads were male. Households ranged in size from two to seventeen, with a median of six household members. Approximately one-quarter of households included a breast-feeding woman, and close to three-quarters included a child under 5 years of age. Almost all households included a person who was currently attending or had previously attended school, which was predominantly primary school (Table 1).
Overview of study population and primary respondent for pictorial record charts, according to baseline questionnaire responses
(Mean values and standard deviations; percentages; medians and interquartile ranges)
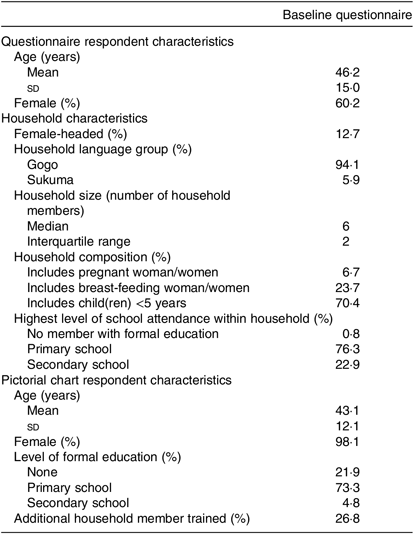
Pictorial record chart respondents
The majority of primary respondents were female, with a mean age of 43·1 years (Table 1). Most had attended primary school, although just over one-fifth had never attended school. During training of individual households for use of the pictorial record chart, a number of individuals were identified with limited or no reading ability, despite some years of school attendance. In just over one-quarter of households, therefore, an additional household member joined the training session for the pictorial chart, to provide support if requested by the primary respondent (Table 1). This included children who were currently or had previously attended school (n 19), another family member (n 4), husband (n 4) or neighbour (n 2).
Feasibility of longitudinal data collection
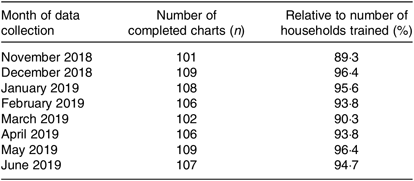
Analyses presented in this paper relate to the first application of the novel tool, alongside two separate H24HR assessments conducted in November 2018. Following this validation exercise, a high percentage of pictorial charts was successfully collected over the 8-month period of the study. Of the 113 households trained, 62·8 % completed charts for all 8 months and 27·4 % completed charts for 7 months. Levels of successful completion ranged from 89·3 % in the first month (November 2018) to 96·4 % in seventh month (May 2019). There was no evidence of a decline in response rates over the 8-month period (Table 2).
Number of completed pictorial record charts over 8 months of application and percentage relative to number of households trained (n 113)
Household Dietary Diversity Scores
For the two methods applied for the same recall period, both resulted in a median HDDS of 7; however, a Wilcoxon signed-rank test determined pictorial charts to be associated with significantly higher HDDS than H24HR for the same period (z = −2·576, P = 0·01). Of the two methods, thirty-seven households recorded a higher score using pictorial charts and seventeen households using H24HR. For forty-seven participants, the same score was recorded through both methods. Separate analysis considered the H24HR applied for the two different recall periods. A median HDDS of 7 was recorded for interviews conducted following participant-completion of pictorial charts and a median score of 6 for interviews during a separate recall period. A Wilcoxon signed-rank test identified a significantly higher median HDDS of one food group when the H24HR method was used following participant-recording of data (z = −4·78, P < 0·001), compared with the same method applied separately to pictorial charts.
Intermethod concordance in documenting foods for same recall period
Table 3 presents the percentage of households recording consumption of (a) food groups and (b) food items based on reconciled results and using pictorial record charts and H24HR for the same recall period. Items recorded by three or fewer households, based on reconciled results, have been excluded. Cohen’s κ tests of concordance between the two methods gave significant results for nine of the twelve food groups. There was high agreement between methods in the recording of white roots and tubers, fruits, milk, oil and fats and sweets (κ = 0·67–0·77); moderate levels for fish and seafood, and pulses, legumes and nuts (κ = 0·49–0·59) and fair levels for meat, poultry and offal and eggs (κ = 0·27–0·40). For the remaining three groups, a known paradox of the κ statistic was encountered whereby despite a high level of agreement between methods, the level of concordance was low due to imbalanced marginal distributions(Reference Feinstein and Cicchetti24,Reference Shankar and Bangdiwala25) .
Percentage of households reporting consumption of (a) food groups and (b) food items based on reconciled results and via two different methods applied for the same recall period
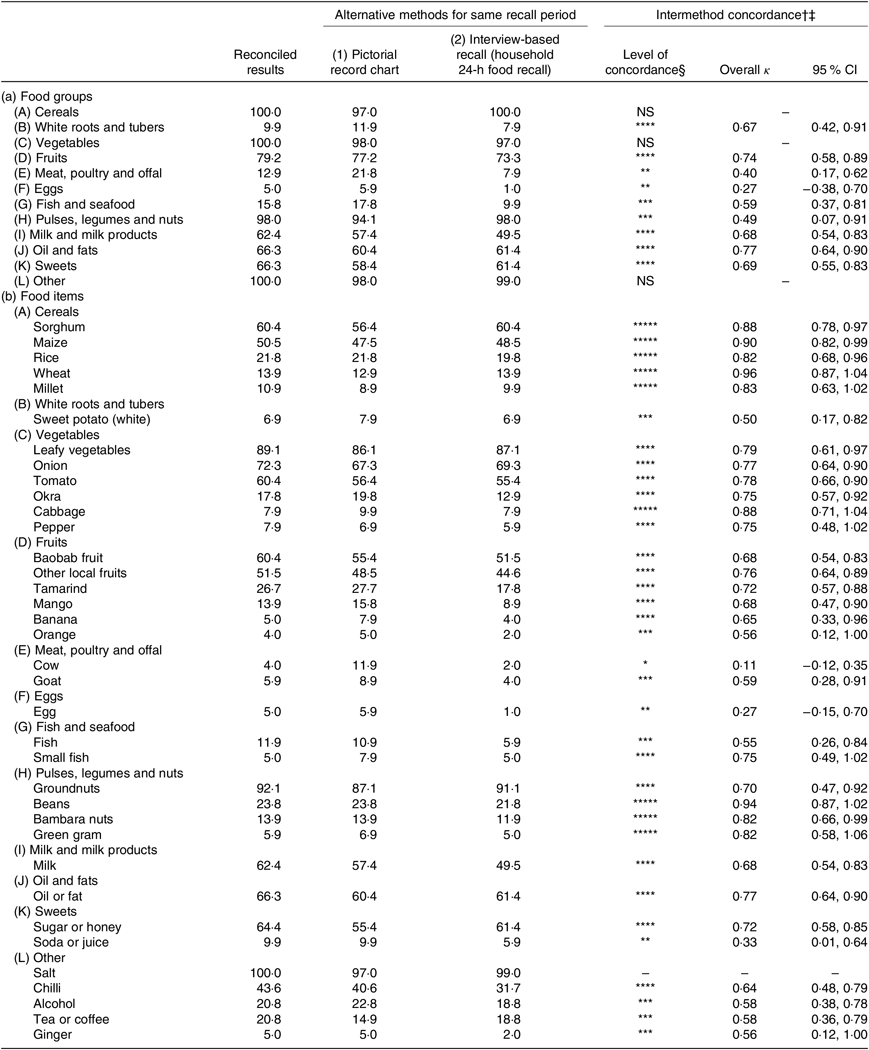
† NS, non-significant test result. All other test results are highly significant (P < 0·001).
‡ Cohen’s κ test.
§ The level of intermethod concordance is given. Asterisks indicate the level of concordance: very good (*****), good (****), moderate (***) and fair (**) and poor (*)(Reference Altman26).
For individual food items, very high agreement was evident for all cereals and almost all pulses, legumes and nuts. Both methods documented wild fruits, including baobab, tamarind and other local fruits, as being the most commonly consumed fruits in this population, with high levels of concordance (κ = 0·68–0·76). Market-sourced fruits, such as mango, banana and orange, were less commonly consumed, and intermethod agreement was moderate to high (κ = 0·56–0·68); however, recording of these items was consistently higher in charts than in interviews. With the exception of cows’ milk, reported by about half of all households, animal source foods were infrequently consumed. All animal source foods were more commonly recorded by pictorial charts than by H24HR. This difference was most prominent for cows’ meat (11·9 % v. 2·0 %), which demonstrated poor intermethod concordance (κ = 0·11). During follow-up visits, this discrepancy was determined to be large due to the confusion between pictorial representations of cows’ milk and meat.
Comparison of interview-based data collection for alternative recall periods
Based on population-level assessments for related groups, significant differences were identified in the recording of four food groups (Table 4a) and ten food items (Table 4b) in interviews for different recall periods. In each case, consumption was recorded for significantly greater numbers of households using H24HR conducted the day following pictorial chart completion (method 2), compared with the same method applied during an alternative recall period (method 3). These included a 2-fold difference in the recording of baobab fruit (P < 0·01), a 3-fold difference for okra (P = 0·049) and a 4-fold difference for bambara nuts (P = 0·035). The most prominent variation was seen for local, non-cultivated fruits other than baobab fruit and tamarind, which were recorded in 44·6 % of interviews following pictorial chart completion and in only 5·0 % of interviews for an alternative recall period (P < 0·001). Significant variation was also identified in the recording of tomato (P = 0·021), groundnuts (P = 0·041), milk (P = 0·043), chilli (P = 0·043) and alcohol (P = 0·001). At a food group level, these differences translated to significantly higher numbers of households recording white roots and tubers (P = 0·039), fruits (P < 0·001), pulses, legumes and nuts (P = 0·002) and milk products (P = 0·043) using H24HR following pictorial chart completion, compared with an alternative recall period.
Percentage of households reporting consumption of (a) food groups and (b) selected food items via interview-based recall: following pictorial chart completion and on an alternative day*
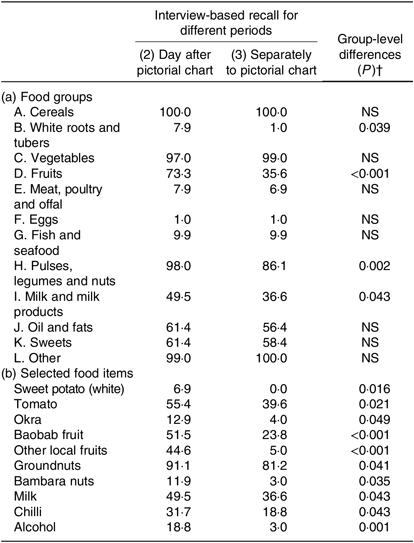
* The level of significance of group-level differences are given for (a) all food groups and (b) food items for which recording differed significantly between methods.
† McNemar’s test for related groups.
Discussion
Seasonal variation in food security and dietary adequacy has been demonstrated in both urban(Reference Becquey, Delpeuch and Konate27) and rural settings(Reference Sibhatu and Qaim28,Reference Abizari, Azupogo and Nagasu29) in low-income countries, yet the recording of diets at multiple time-points across a year is typically limited by the resource-intensive nature of conducting these assessments. The present study has evaluated a novel approach to collect household dietary diversity data, using a participant-recorded pictorial chart method that allows respondents with little or no formal education to prospectively record the data. The results show it is feasible to collect information using this tool over an extended period of time, with support from trained local community representatives and limited on-the-ground involvement of a research team. Over an 8-month period, 62·8 % of the respondents successfully completed all eight pictorial charts and 96·4 % of respondents completed at least six of the eight records. To achieve these high completion rates, it was important to provide adequate training and adapt the tool to meet respondent needs. For example, pictures were not easily recognised by all study participants, independent of their ability to read the accompanying text. Levels of recognition varied between household respondents, and training sessions of up to approximately 90 min were required to build a common understanding of what each picture represented. Furthermore, years of school attendance or participants’ reading ability cannot be used to predict performance because factors such as poor vision and low-level lighting in rural settings also presented challenges in chart completion. The training of a ‘support person’ in approximately one-quarter of households was important to achieving high response rates.
Overall, our results show a moderate to high level of agreement(Reference Altman26) when comparing data collected using this novel approach with data from traditional H24HR. Median HDDS obtained using these alternative methods were equal. While very high to high levels of agreement were seen for many individual food items, but concordance varied between groups and items. It was noted that several nutrient-rich foods, including all animal-source foods, market-sourced fruits and soft drinks, were recorded by a greater number of households using pictorial charts than through interviews. Future qualitative research is needed to offer insight into participants’ willingness to disclose information about consumption of high-value items to local enumerators in low-income food-deficit settings and to explore the potential for participant-recording of such foods using pictorial charts to reflect aspirations rather than actual diets. Additionally, although the person responsible for food preparation served as the primary respondent for both methods evaluated in the present study, it is possible that the involvement of additional household members in chart completion – either by recording or through discussions with the primary respondent – may result in a greater number of consumed items being captured compared with a recall interview with a single informant.
The second aspect of analysis has tested the possibility that interview-based recall may be aided by the task of chart completion. This involved comparing diets documented for the same households at two separate time points, within an approximately 2-week period. Food consumption is therefore not expected to be identical, but variation at a population level is considered likely to relate to methodology rather than variation in access, availability or utilisation of food resources. The median HDDS recorded using interviews on the day immediately following participant-recording of data was one point higher than that via interviews conducted separately to the charts. Significant intermethod differences were seen in the recording of local non-cultivated fruits, ingredients of mixed dishes (such as okra, prepared with leafy vegetables, or bambara nuts, prepared with maize), condiments added at the time of eating (such as chilli) and items consumed by some but not all household members (such as alcohol). In all cases, these items were more commonly recorded on the day following participant-recording of data. It is suggested that the task of chart completion may increase respondents’ consciousness of foods consumed during the time period in question and may improve the accuracy of recall during subsequent H24HR assessments. Providing pictorial charts to households on the day before a recall interview has been recommended as part of an interactive 24-h recall for assessing the adequacy of Fe and Zn intakes(Reference Gibson and Ferguson30), although the use of such charts in rural settings has not been validated. Alternative explanations for intermethod variation include the potential for the prospective recording of data to have altered food consumption during the recall period or for factors unrelated to methodology to have resulted in true differences in diets on the days in question.
Limitations of the present study have included a modest sample size, validation of the novel tool against alternative methods rather than observational data and the timing of validation as part of the tool’s first application. Given the proposed role of pictorial charts in collecting longitudinal dietary data, further research is needed to understand whether data validity may increase over time, as respondents become more familiar with picture recognition and the task of chart completion, or decrease, as levels of interest in study involvement wane. Continuing high levels of participation in the present study suggests a promising outlook, in terms of the willingness for households to engage with this form of data collection over the course of a project. It is acknowledged that the principal investigator’s history of working in these communities and existing relationships with community-based data supervisors may have positively influenced households’ acceptance of this novel tool. Future qualitative research should explore participants’ experiences of dietary assessment, including ease of recall, time burden and feelings about disclosure of information. There is also scope for future research to evaluate how this method may be used to evaluate dietary diversity at an individual level (e.g. for women of reproductive age or young children) or in peri-urban or urban areas where a wider range of food items may be accessed through markets.
As dietary diversity indicators continue to offer insight into the impact of agriculture on diet quality and nutrition, there is value in a tool which enables foods consumed at a household or individual level to be recorded with greater frequency than is currently possible in most studies. Preliminary results from the present study suggest the contemporaneous nature of data collection using these charts (whereby household informants record items consumed on the day in question), and the use of visual prompts may aid in effectively capturing information on food consumption using subsequent interview-based recall. As a standalone method applied at multiple time-points, the accuracy of pictorial record charts will require an adequate investment of time to develop local food lists, depict items effectively and train household respondents and support persons. It is also essential to recruit competent and reliable community-based supervisors to oversee the data collection process and ensure that their role is understood to be only to remind participants when to collect the data and to collect completed pictorial charts, without helping participants to fill in the forms.
Acknowledgements
The authors thank Sophia Bundala, Msafiri Kalloka (Tanzania Veterinary Laboratory Agency), Geofrey Kiswaga (Manyoni District Council, Tanzania) and Community Assistants for their important role in project implementation and Stephen Young (Natural Resources Institute, UK) for his assistance with statistical analyses.
This work was funded by the UK Department for International Development through the Postdoctoral Fellowships on Innovative Methods and Metrics for Agriculture and Nutrition Actions (IMMANA Fellowships). Additional financial support for fieldwork was received from the McKnight Foundation.
The authors’ contributions are as follows: J. de B. conceptualised the study, developed research tools, conducted fieldwork, data entry, analysis and interpretation and wrote the manuscript; E. F. and J. M. provided guidance on study design, approaches to analysis and interpretation of findings and critical review of manuscript drafts. All authors read and approved the final version of the manuscript.
There are no conflicts of interest.
Supplementary material
For supplementary material referred to in this article, please visit https://doi.org/10.1017/S0007114519002587


 Open access