

Consumption of EPA and fish oil (consisting of EPA and DHA) has been reported to reduce inflammation(Reference Calder1–Reference Perez-Matute, Perez-Echarri and Martinez5) and improve cardiovascular risk factors(Reference Grimsgaard, Bonaa and Hansen6–Reference Yokoyama, Origasa and Matsuzaki9), and possibly improve insulin sensitivity(Reference Storlien, Baur and Kriketos10, Reference Rossi, Lombardo and Lacorte11). These effects suggest that chronic supplementation with EPA and fish oil might potentially delay or prevent the onset of type 2 diabetes mellitus (T2DM).
Many of the beneficial effects attributed to EPA and fish oil intake, including the potential to improve insulin sensitivity, appear to be related to a reduction of inflammation via two main pathways. First, chronic consumption of fish oil and EPA results in greater membrane phospholipid EPA content at the expense of arachidonic acid(Reference Calder1). Arachidonic acid is the precursor to multiple inflammatory eicosanoid products, whereas EPA is a poor substrate for eicosanoid production, and EPA-derived eicosanoids are generally less bioactive(Reference Jump12). Secondly, EPA has been shown to activate PPAR-mediated suppression of NF-κB, a potent activator of inflammatory mediators(Reference Plutzky13–Reference Ziouzenkova and Plutzky15). Inflammation is believed to play a crucial role in the onset and progression of T2DM, as expanding adipocytes secrete increasing amounts of inflammatory mediators, such as IL-6 which stimulates hepatic C-reactive protein (CRP) release, potentially impairing insulin signalling(Reference Yudkin, Stehouwer and Emeis16, Reference Tataranni and Ortega17).
In addition to their impact on inflammation, EPA and fish oil consumption has been reported to lower circulating lipids in rodents and human subjects(Reference Grimsgaard, Bonaa and Hansen6, Reference Woodman, Mori and Burke7, Reference Rossi, Lombardo and Lacorte11, Reference Mori, Burke and Puddey18). This action is mediated in part by activation of PPAR-α (the pharmaceutical target for fibrates) and γ (the pharmaceutical target for thiazolidinediones). Activation of PPAR-γ by EPA and fish oil-derived fatty acids has been shown to increase secretion of the adipocyte hormone, adiponectin(Reference Itoh, Suganami and Satoh3, Reference Perez-Matute, Perez-Echarri and Martinez5, Reference Rossi, Lombardo and Lacorte11, Reference Havel19, Reference Neschen, Morino and Rossbacher20). Adiponectin promotes improvement of insulin sensitivity and has potential lipid-lowering effects, in part by activating adenosine monophosphate-activated protein kinase and increasing fatty acid oxidation(Reference Havel19). PPAR-γ agonists may also act to lower circulating lipids by expanding subcutaneous adipose depots for fatty acid storage(Reference Semple, Chatterjee and O'Rahilly21).
While the cardioprotective effects of marine-derived lipids as nutritional supplements are becoming increasingly clear, no studies have addressed the efficacy of EPA or fish oil in the prevention T2DM. Some studies in rodent models have demonstrated improved insulin sensitivity during fish oil treatment(Reference Rossi, Lombardo and Lacorte11, Reference D'Alessandro, Lombardo and Chicco22); however, other studies in rodents(Reference Holness, Greenwood and Smith23, Reference Holness, Smith and Greenwood24) and clinical studies in healthy subjects and patients with T2DM have demonstrated that neither EPA nor fish oil improves insulin sensitivity or lower plasma glucose(Reference Kabir, Skurnik and Naour4, Reference Woodman, Mori and Burke7, Reference Holness, Smith and Greenwood24–Reference Mostad, Bjerve and Bjorgaas27). Therefore, we sought to determine whether EPA or fish oil can delay or prevent the onset of diabetes and/or lower circulating lipids and markers of inflammation in UC Davis (UCD)-T2DM rats, a rat model of T2DM with polygenic adult-onset obesity and insulin resistance, and inadequate β-cell compensation(Reference Cummings, Digitale and Stanhope28). Furthermore, we sought to determine whether there are differences between the chronic effects of EPA and fish oil supplementation by examining the two treatment groups in parallel and providing the same amount of n-3 fatty acids (as EPA or as EPA+DHA) in both groups.
Methods
Animals and diets
The UCD-T2DM rat model was produced by crossing obese Sprague–Dawley rats prone to adult-onset obesity and insulin resistance(Reference Stanhope, Kras and Moreno-Aliaga29, Reference Stanhope, Sinha and Graham30) with Zucker diabetic fatty lean rats that have intact leptin signalling, but a defect in pancreatic β-cell insulin gene transcription(Reference Griffen, Wang and German31). This cross resulted in a new rat model that develops polygenic adult-onset obesity and diabetes in both sexes with rats exhibiting insulin resistance, impaired glucose tolerance and eventual β-cell decompensation(Reference Cummings, Digitale and Stanhope28). These rats develop diabetes when fed a standard low-fat rodent chow diet and also demonstrate a later age of diabetes onset than other rodent models of T2DM, such as the Zucker diabetic fatty rat, making them highly suitable for diabetes prevention studies(Reference Cummings, Digitale and Stanhope28, Reference Bergeron, Yao and Woods32).
Rats were housed in hanging wire cages in the animal facility in the Department of Nutrition at the University of California, Davis, and maintained on a 12 h light–dark cycle. Food intake and body weight were measured three times a week. Non-fasting blood glucose was monitored every week with a glucose meter (One-Touch Ultra, LifeScan, Milpitas, CA, USA) at 13.00–14.00 hours. Diabetes onset was defined as a non-fasted blood glucose value above 11·1 mmol/l (2000 mg/l) on two consecutive weeks(Reference Faeh, Minehira and Schwarz26). All rats were followed until 1 year of age or for 4 months after the onset of diabetes. The experimental protocols were approved by the University of California, Davis Institutional Animal Care and Use Committee.
Starting at 1 month of age, male animals were divided into three groups: control (n 20), EPA (n 15) and fish oil (n 17). Purified ethyl-all-cis-5,8,11,14,17-icosapentaenoate (Mochida Pharmaceutical Company, Shizuoka, Japan) or fish oil (18 % EPA, 12 % DHA; Jedwards, Quincy, MA, USA) was mixed with ground rodent chow (no. 5012; PMI Nutrition International LLC, Brentwood, MO, USA) to provide a dose of 1 g EPA/kg body weight per d or 3 g fish oil/kg body weight per d. In order to provide the specified per kg body weight dose, the amount of EPA or fish oil in the diet was gradually increased until 4 months of age, the time at which the animals had reached a relatively stable adult body weight. At 4 months of age, the EPA-supplemented diet contained 21 mg EPA/g of diet, and the fish oil-supplemented diet contained 13 mg EPA plus 8 mg DHA/g of diet. All the diets were supplemented with safflower oil to equalise the fat content of the three diets. The percentage energy from fat, protein and carbohydrate was 27, 23 and 50 %, respectively. The fatty acid composition of the diet is shown in Table 1. Baseline body weights in all the groups were 110 (sd 2) g. Blood samples were collected from the tail after a 12 h fast each month up to 8 months of age for the measurement of glucose, insulin, TAG, NEFA, total cholesterol, adiponectin and leptin. Plasma CRP was measured at baseline and at 4 months of age.
Experimental diet composition

Assays
Plasma glucose and cholesterol were measured using enzymatic colorimetric assays (Thermo DMA Louisville, CO, USA). Plasma TAG and NEFA were measured using enzymatic colorimetric assays (L-type TG H kit, NEFA Microtiter C kit; Wako Chemicals, Inc., Richmond, VA, USA). Plasma insulin, leptin and adiponectin were measured using rodent/rat-specific RIA (Millipore, St Charles, MO, USA). Plasma CRP was measured using ELISA (BD Biosciences, San Jose, CA, USA).
Statistics and data analysis
Data are presented as means with their standard errors. Statistical analyses were performed using GraphPad Prism 4.00 for Windows (GraphPad Software, San Diego, CA, USA). Diabetes onset was analysed by log-rank testing of Kaplan–Meier survival curves up to 10 months of age. Longitudinal data were compared by two-factor repeated-measures ANOVA (time and treatment) followed by post hoc analysis with Bonferroni's multiple comparison test. One-factor ANOVA was used to analyse data assessed at a single time point. One animal from the control group and one animal from the fish oil-supplemented group became diabetic at too early an age to allow collection of blood samples up to 8 months of age and therefore were included in incidence analysis, but not in the longitudinal analyses. Differences were considered significant at P < 0·05.
Results
Effect of EPA and fish oil supplementation on type 2 diabetes mellitus onset, body weight and energy intake
There were no significant differences in the age of onset of diabetes or diabetes incidence between the three treatment groups (Fig. 1). Average ages of diabetes onset up to 1 year of age were 6·7 (sd 0·6), 6·0 (sd 0·6) and 6·0 (sd 0·8) months in the control, EPA-treated and fish oil-treated groups, respectively. Diabetes incidence was 85, 87 and 88 % in the control, EPA-treated and fish oil-treated groups, respectively. Energy intake did not differ significantly between treatment groups in the first 5 months of treatment (Fig. 2(a)). Starting at 6 months of age, fish oil-treated animals were consuming somewhat more energy than control animals (P < 0·05). However, when prediabetic and diabetic animals were analysed separately, the average energy intake between 6 and 7 months of age did not differ among groups, and all diabetic animals consumed significantly more energy than prediabetic animals (P < 0·001) (Fig. 2(b)). At 6 months of age, 56 % of fish oil-treated animals were diabetic, whereas 26 % of control animals were diabetic. Previously reported data demonstrate that UCD-T2DM rats develop progressive glucosuria and decreases in the circulating insulin and leptin concentrations after diabetes onset(Reference Cummings, Digitale and Stanhope28). Thus, following T2DM onset, animals increased their food intake to compensate for the energy lost from glucosuria, an effect that is probably mediated by the decreases in insulin and leptin(Reference Cummings, Digitale and Stanhope28). There were no differences in body weight between treatment groups (Fig. 2(c)).
Kaplan–Meier analysis of diabetes incidence in control (n 20), EPA-supplemented (n 15) and fish oil (FO)-supplemented (n 17) animals. Values were not significant by log-rank testing of Kaplan–Meier curves. ![]() , Control;
, Control; ![]() , EPA;
, EPA; ![]() , FO.
, FO.

Energy intake (metabolisable energy) (a) and body weight (c) in control (n 19), EPA-supplemented (n 15) and fish oil (FO)-supplemented (n 16) animals. ††† Mean values were compared using two-factor (time and treatment) repeated-measures ANOVA (P < 0·001). * Mean values were significantly different when compared with fish oil by Bonferroni's post test (P < 0·05). Average energy intake (b) between 6 and 7 months of age in prediabetic control (n 13), EPA-supplemented (n 5) and fish oil-supplemented (n 6) animals, and diabetic control (n 6), EPA-supplemented (n 10) and fish oil-supplemented (n 10) animals. ††† Mean values were compared using one-factor ANOVA (P < 0·0001). *** Mean values were significantly different when compared with values in prediabetic animals by Bonferroni's post test (P < 0·001). –○–, Control; –●–, EPA; △, FO.

Effect of EPA and fish oil supplementation on fasting plasma glucose, lipids, hormones and C-reactive protein
Fasting plasma glucose concentrations did not differ between groups (Fig. 3(a)). However, fasting plasma glucose concentrations tended to increase in the fish oil–supplemented and EPA-supplemented groups starting at 7 months of age. This trend was due to the higher incidence of diabetes in the fish oil-treated and EPA-treated groups compared with the control group. At 7 months of age, 37 % of control animals were diabetic, whereas 67 and 56 % of EPA-supplemented and fish oil-supplemented animals were diabetic, respectively. Fasting plasma insulin concentrations did not differ between groups; however, animals supplemented with fish oil tended to have lower fasting plasma insulin concentrations than control animals after 4 months of treatment (Fig. 3(b)).
Fasting plasma glucose (a) and insulin (b) concentrations in control (n 19), EPA-supplemented (n 15) and fish oil (FO)-supplemented (n 16) animals. –○– Control; –●–, EPA; △, FO.

Fish oil supplementation lowered fasting plasma TAG concentrations compared with control ( − 39 (sd 7) % at 4 months of age) (Fig. 4(a)). Overall, EPA supplementation did not significantly lower fasting plasma TAG concentrations compared with control animals. However, EPA supplementation lowered fasting plasma TAG concentrations in diabetic animals ( − 45 (sd 3) %) at 4 months of age compared with 4-month-old diabetic control animals (P < 0·001, control: n 4, fish oil: n 6). EPA supplementation lowered fasting plasma NEFA concentrations by 23 (sd 5) % compared with control at 4 months of age (P < 0·05) (Fig. 4(b)). Fish oil supplementation significantly lowered fasting plasma cholesterol concentrations throughout the sampling period ( − 22 (sd 4) % at 4 months of age) (Fig. 4(c)). EPA supplementation also lowered fasting plasma cholesterol concentrations ( − 19 (sd 4) % at 4 months of age).
Fasting plasma TAG (a), NEFA (b) and cholesterol (c) concentrations in control (n 19), EPA-supplemented (n 15) and fish oil (FO)-supplemented (n 16) animals. Mean values were significantly different by two-factor ANOVA: †P < 0·05, ††P < 0·01, †††P < 0·001. Mean values were significantly different from those of the control group by Bonferroni's post test: *P < 0·05, **P < 0·01, ***P < 0·001. –○–, Control; –●–, EPA; △, FO.

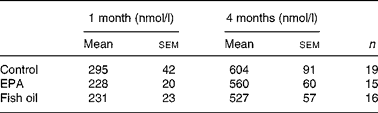
Fasting plasma adiponectin and leptin concentrations did not differ between groups over the course of the study (Fig. 5(a) and (b)). Fasting plasma CRP concentrations did not differ between groups at 4 months of age (Table 2).
Fasting plasma adiponectin (a) and leptin (b) concentrations in control (n 19), EPA-supplemented (n 15) and fish oil (FO)-supplemented (n 16) animals. –○–, Control; –●–, EPA; △, FO.

(Mean values with their standard errors)
Discussion
Previous studies investigating the effects of EPA and fish oil have demonstrated the anti-inflammatory(Reference Calder1, Reference Yaqoob and Calder33) and cardioprotective properties for these supplements(Reference Grimsgaard, Bonaa and Hansen6–Reference Yokoyama, Origasa and Matsuzaki9). However, evidence that fish oil or EPA increases insulin sensitivity and improves glucose tolerance has been conflicting(Reference Woodman, Mori and Burke7, Reference Mori, Burke and Puddey18, Reference Montori, Farmer and Wollan25, Reference Mostad, Bjerve and Bjorgaas27). Results from the present study indicate that while chronic supplementation with EPA (1 g/kg body weight per d) or fish oil (3 g/kg body weight per d) for more than 8 months lowers circulating lipids (TAG, NEFA and cholesterol), neither treatment delays the onset of diabetes in UCD-T2DM rats.
Similar to previous results from studies in animals and in human subjects, energy intake, body weight and circulating leptin were not affected by EPA or fish oil supplementation(Reference Kabir, Skurnik and Naour4, Reference Grimsgaard, Bonaa and Hansen6, Reference Holness, Greenwood and Smith23, Reference Mostad, Bjerve and Bjorgaas27, Reference Raclot, Groscolas and Langin34–Reference Neschen, Morino and Dong36). In some rodent studies, decreases in body weight have been reported during EPA and fish oil treatment, which the authors attributed, in part, to increases in circulating leptin(Reference Perez-Matute, Perez-Echarri and Martinez5, Reference Rossi, Lombardo and Lacorte11). However, these results have not been replicated in a number of other studies in rodents or human subjects(Reference Kabir, Skurnik and Naour4, Reference Grimsgaard, Bonaa and Hansen6, Reference Holness, Greenwood and Smith23, Reference Mostad, Bjerve and Bjorgaas27, Reference Raclot, Groscolas and Langin34–Reference Neschen, Morino and Dong36).
Neither EPA nor fish oil supplementation affected fasting plasma glucose or insulin concentrations, suggesting that these supplements did not affect insulin sensitivity in the UCD-T2DM rat model of diabetes. These findings are in agreement with previous studies in rodents(Reference Holness, Greenwood and Smith23, Reference Neschen, Morino and Dong36) and several clinical studies in patients with T2DM, in which no improvements of glycaemic control, circulating insulin or insulin sensitivity were observed during treatment with fish oil(Reference Montori, Farmer and Wollan25, Reference Annuzzi, Rivellese and Capaldo37). In some clinical studies, insulin sensitivity and glycaemic control actually worsened during fish oil treatment, despite marked improvements in circulating lipids(Reference Woodman, Mori and Burke7, Reference Vessby and Boberg38–Reference Dunstan, Mori and Puddey40). One possible explanation for a lack of improvement of glycaemic control with EPA or fish oil supplementation is that EPA and fish oil may increase hepatic glucose output by increasing hepatic free fatty acid oxidation and decreasing hepatic glucose oxidation, as would be predicted by changes in the Randle glucose–fatty acid cycle(Reference Randle41). This is supported by the data generated by Holness et al. (Reference Holness, Greenwood and Smith23), reporting decreased insulin-mediated suppression of endogenous glucose production and impaired glucose-stimulated insulin secretion in animals fed a diet supplemented with EPA and DHA. Furthermore, Mostad et al. (Reference Mostad, Bjerve and Bjorgaas27) reported decreased glucose utilisation, measured with euglycaemic clamps, in patients with T2DM supplemented with fish oil.
Both EPA and fish oil supplementation substantially lowered circulating lipids in prediabetic and diabetic animals. n-3 Fatty acids have been suggested to lower circulating lipids by their interactions with several nuclear receptors, including the liver X receptor, hepatocyte nuclear factor-4α, farnesol X receptor and the PPAR(Reference Davidson8). n-3 Fatty acids have been shown to decrease de novo lipogenesis through inhibition of sterol-regulatory-element-binding protein-1c(Reference Pawar, Botolin and Mangelsdorf42) and to increase fatty acid oxidation in liver and muscle through activation of PPAR-α(Reference Berge, Madsen and Vaagenes43, Reference Blaschke, Takata and Caglayan44) and by down-regulating hepatocyte nuclear factor-4α, resulting in a increased flux of glucose to glycogen(Reference Pegorier, Le May and Girard45). Together, these effects favour fatty acid oxidation over fatty acid storage as TAG. Interestingly, it appeared that fish oil more potently lowered circulating TAG than did EPA in prediabetic animals. The differential effect of EPA and fish oil treatment on circulating lipids in UCD-T2DM rats is supported by the previous studies in which the TAG-lowering effect of DHA (present in fish oil) was reported to be greater than that of EPA in healthy and hyperlipidaemic men(Reference Grimsgaard, Bonaa and Hansen6, Reference Mori, Burke and Puddey18). The transient nature of the decreases in circulating NEFA and TAG with EPA and fish oil treatment can be attributed to increasing diabetes incidence at older ages, as we have previously reported that fasting plasma TAG decreases and fasting plasma NEFA increases after diabetes onset in the UCD-T2DM rat(Reference Cummings, Digitale and Stanhope28).
Fatty acids in fish oil, such as EPA and DHA, have been shown to activate PPAR-γ resulting in increased adiponectin production and secretion(Reference Neschen, Morino and Rossbacher20). Adiponectin is secreted from adipocytes and promotes insulin sensitivity, in part, by stimulating the oxidation of ectopic TAG via activation of adenosine monophosphate-activated protein kinase in liver and skeletal muscle(Reference Havel19, Reference Long and Zierath46). However, we did not observe a significant increase in circulating adiponectin concentrations during EPA or fish oil supplementation, similar to previous human studies(Reference Lara, Economou and Wallace47, Reference Kratz, Swarbrick and Callahan48). Thus, increased adiponectin production does not appear to contribute to the lipid-lowering effects of EPA and fish oil treatment observed in the present study.
While plasma CRP concentrations were slightly (approximately 8–12 %) lower in EPA-supplemented and fish oil-supplemented animals, this trend did not reach significance, suggesting that EPA and fish oil do not effectively reduce inflammation in UCD-T2DM rats, or that higher doses may be required. Interestingly, there have been conflicting reports on the effect of EPA or fish oil treatment on markers of inflammation in individuals with diabetes, suggesting that the effects of these supplements to reduce inflammation may be at least partially dependent on metabolic status and thus requires further investigation(Reference Itoh, Suganami and Satoh3, Reference Kabir, Skurnik and Naour4, Reference Gillam, Noto and Zahradka49). This lack of an anti-inflammatory effect may also, in part, explain the lack of effect of EPA or fish oil supplementation to delay diabetes onset, as inflammation is known to promote the development of insulin resistance and diabetes(Reference Yudkin, Stehouwer and Emeis16, Reference Tataranni and Ortega17).
Despite the widespread use of both fish oil and EPA supplements, this is the first study to investigate the potential for EPA and fish oil to delay or prevent the development of T2DM in the UCD-T2DM rat model of type 2 diabetes. The data indicate that EPA and fish oil supplementation do not delay diabetes onset, nor do they affect body weight, plasma glucose or insulin concentrations. Thus, these results do not provide evidence to support the use of EPA and fish oil for the prevention of T2DM. However, the results do confirm that EPA and fish oil are useful in the management of hyperlipidaemia, a common co-morbidity of T2DM.
Acknowledgements
We thank Hong-Duc Ta and Sunhye Kim for their extensive help with animal care and monitoring. We would also like to thank Susan Bennett, Cheryl Phillips and the Meyer Hall Animal Facility for excellent animal care. B. P. C., K. L. S., J. L. G., S. C. G. and P. J. H. developed and characterised the UCD-T2DM rat model used for the study. K. L. S., J. L. G., S. C. G. and P. J. H. designed and obtained funding for the study; B. P. C., K. L. S. and J. L. G. conducted the experiments; B. P. C., K. L. S., J. L. G. and P. J. H. analysed the data; B. P. C., K. L. S. and P. J. H. wrote the manuscript; B. P. C. and P. J. H. had primary responsibility for final content. All authors read and approved the final manuscript. The present project was supported by a National Institutes of Health (NIH) grant (AT002993). Dr Havel's laboratory also receives support from NIH grants (R01 HL075675, R01 HL091333, AT002599, AT003645) and the American Diabetes Association. B. P. C., K. L. S., J. L. G., S. C. G. and P. J. H. have no conflicts of interest.


