





Obesity is a metabolic disease characterised by excessive body fat that is more likely to impair health and increase morbidity and mortality(Reference Sirimi and Goulis1,Reference Wilson and Messaoudi2) . It is defined using BMI, which is calculated as weight in kilograms divided by the square of height in metres. Maternal obesity is determined based on pre-pregnancy BMI or that measured at the first antenatal care (ANC) visit if pre-pregnancy information is not available(Reference Vitner, Harris and Maxwell3–8). The WHO divided BMI values of adults into underweight (less than 18·5), normal weight (18·5–24·9), overweight (25·0–29·9) and obesity (30·0 and more)(Reference Leddy, Power and Schulkin9–Reference Mission, Marshall and Caughey13).
The BMI in the first trimester closely reflects pre-pregnancy weight status, as maternal weight does not change dramatically during early pregnancy. This first-trimester BMI is used as a proxy measure for pre-pregnancy weight status. However, using BMI to classify maternal obesity during pregnancy and the postpartum period has some serious limitations. There is a significant increase in total body water during pregnancy(Reference Catalano and Shankar14). However, there are no BMI reference standards that account for pregnancy-related weight gain. The pre-pregnancy weight and height must be known to calculate the BMI of pregnant women(15,Reference Miele, Souza and Calderon16) . Calculating BMI beyond the first trimester is less reflective of pre-pregnancy weight status due to the naturally incurred pregnancy-related weight gain(Reference Barber, Rankin and Heslehurst17). However, it is common for pregnant women to seek ANC late, usually in the second or third trimester in low- and middle-income countries(Reference Miele, Souza and Calderon16,Reference Babu, Das and Lobo18–Reference Vasundhara, Hemalatha and Sharma22) . The first ANC visit in the first trimester of pregnancy is estimated to be 58·6 % worldwide, whereas it was 48·1 % in developing countries and 24 % in low-income countries(Reference Miele, Souza and Calderon21). These issues warrant questions on the feasibility, effectiveness and reliability of using the BMI to assess maternal obesity and its risk of an adverse pregnancy(Reference Fakier, Petro and Fawcus19–Reference Miele, Souza and Calderon21,Reference van Hoorn, de Wit and van Rossem23) .
Hence, there is a need for other reliable tools to assess the nutritional status of women seeking ANC for the first time in second- and third-trimester pregnancies. A simpler mid-upper arm circumference (MUAC) that correlates with BMI can serve as a surrogate for BMI for faster nutritional screening in pregnant women in low- and middle-income countries(Reference Miele, Souza and Calderon16,Reference Fakier, Petro and Fawcus19,Reference Miele, Souza and Calderon21,24–Reference Tang, Chung and Dong26) . MUAC is a reliable proxy for pre-pregnancy body fat, making it a popular, feasible choice and a good indicator of maternal nutritional status during pregnancy(Reference Babu, Das and Lobo18,Reference Shrivastava, Agrawal and Giri27–Reference Jeminusi and Sholeye29) . It would eliminate the need for calibrated weight scales, height charts and BMI calculations for pregnant women(Reference Babu, Das and Lobo18,Reference Fakier, Petro and Fawcus19) . Moreover, MUAC has crucial properties as a screening indicator, including simplicity, acceptability, low cost, objectivity and quantitative-ness(Reference Tang, Chung and Dong26).
There are no globally accepted MUAC values for identifying pregnant women with maternal obesity(Reference Tang, Chung and Dong26). There seems to be a wide difference in MUAC according to the population, age of pregnant women and gestational week for the overweight/obesity category(Reference Miele, Souza and Calderon21,Reference Okereke, Okeke and Anyaehie30) . Hence, it would be difficult to recommend a MUAC cut-off value suitable for all settings(Reference Cashin and Oot31). Therefore, the optimal MUAC cut-off points may need to be determined and validated for individual countries based on context-specific cost–benefit analyses to determine maternal overweight and obesity(Reference Miele, Souza and Calderon21,Reference Vasundhara, Hemalatha and Sharma22,24,32,Reference Suresh, Jain and Kaul33) . Although MUAC is identified by the WHO as a marker for assessing the nutritional status of pregnant women, data on its validity and optimal cut-off points for assessing overweight and obesity among pregnant women in the Ethiopian context are lacking. Therefore, this study aimed to validate MUAC as a reliable alternative screening tool to BMI for detecting maternal overweight and obesity and to develop optimal cut-off values for pregnant women.
Methods and materials
Study area, designs and population
This ambispective cohort study, which incorporates both retrospective data collection from existing records and prospective follow-up of participants, was conducted in public hospitals in Dire Dawa, Harar and Jigjiga City, Eastern Ethiopia, from August 2023 to April 2024. The ambispective cohort design facilitated the availability of maternal anthropometric measurements from both early pregnancy (obtained retrospectively from medical records) and late pregnancy (collected prospectively), enabling the assessment of measurements across gestation. All singleton pregnant women who started ANC before 16 weeks of gestation and attended delivery service at these hospitals were selected and followed until discharge. Those pregnant women with missing early weight, height and MUAC in the prenatal card, previous two or more deliveries given by caesarean sections, a physical deformity that affects the height and weight measurement and physician diagnoses of psychiatric morbidity were excluded.
Sample size determination and sampling procedure
The sample size was determined using the Buderer formula for the diagnostic accuracy test study(Reference Buderer34). Buderer’s formula is used for sample size calculation in diagnostic accuracy studies at the required absolute precision level for sensitivity, specificity and AUC separately(Reference Negida, Fahim and Negida35–Reference Zaidi, Waseem and Ansari37). The expected sensitivity and specificity are defined based on the estimates from previous studies(Reference Miele, Souza and Calderon21).
Sample size required for sensitivity: $n = \;{{Z_{\alpha /2}^2SN\left( {1 - SN} \right)\;} \over {{\epsilon ^2}\left( P \right)}}$
Sample size required for specificity: $n = \;{{Z_{\alpha /2}^2Sp\left( {1\; - \;Sp} \right)} \over {{\epsilon ^2}\left( {1\; - \;P} \right)}}$
where $Z_{\alpha /2}^2$
is a standard normal value at the level of 5 % and 95 % confidence levels, SN is the anticipated sensitivity (95 %), Sp is the anticipated specificity (91 %), P is the prevalence of maternal obesity among pregnant women (18·5 %)(Reference Asefa and Nemomsa38), and
$Z_{\alpha /2}^2$
is a standard normal value at the level of 5 % and 95 % confidence levels, SN is the anticipated sensitivity (95 %), Sp is the anticipated specificity (91 %), P is the prevalence of maternal obesity among pregnant women (18·5 %)(Reference Asefa and Nemomsa38), and $\epsilon$
is the required absolute precision on either side of the sensitivity (0·05 %).
$\epsilon$
is the required absolute precision on either side of the sensitivity (0·05 %). $n\;for\;sensitivity = \;{{\;1\cdot{{96}^2}\times0\cdot095\left( {1-0\cdot95} \right)\;} \over {0\cdot{{03}^2}\left( {0\cdot185} \right)}}= \;\approx1096$ $n\;for\;specificity = \;{{\;1\cdot{{96}^2}\times0\cdot091\left( {1-0\cdot91} \right)\;} \over {0\cdot{{03}^2}\left( {1-0\cdot185} \right)}}=429$
Hence, assuming a sensitivity of 95 %, a specificity of 91 %(Reference Miele, Souza and Calderon21), a prevalence of overweight/obesity, 18·5 % among pregnant women in Harar(Reference Asefa and Nemomsa38), and a 3 % margin of error, the minimum sample size required is 1096. Finally, adding a 1·5 design effect, 10 % non-respondent rate and 15 % lost-to-follow-up rate, the final sample size for the study is 1918. However, because this study was part of a larger study(Reference Tola, Assefa and Oljira39), pregnant women with both early- and late-pregnancy MUAC measurements were included. Therefore, 2502 pregnant women were included in this analysis.
One-stage cluster sampling was used to select pregnant women in this study. The total sample size was proportionally distributed across all six public hospitals in Harar, Dire Dawa and Jigjiga cities, based on the number of pregnant women in delivery services at each hospital. The source population is estimated from the 12-month reports of pregnant women attending the delivery units of the selected hospitals in Harar, Dire Dawa and Jigjiga cities. Then, the average number of pregnant women who attended services per collection period (8 months) was calculated. All pregnant women who met the inclusion criteria and visited the selected public hospitals for delivery services during the study period were recruited.
Recruiting participants and data collection
All women with singleton pregnancies admitted to the labour and delivery unit of the selected hospital during the study period were assessed for eligibility. Data collectors approached pregnant women face-to-face and invited them to participate. Those pregnant women who agreed to participate consented and were enrolled. The data collectors reviewed the ANC records of the enrolled women to retrieve the necessary information, primarily early-gestational weight, height and MUAC.
Six trained and experienced health professionals collected data using a standard, pretested and structured questionnaire. The data collectors and supervisors were trained for 2 d on data collection and the ethical aspects of the research. The principal investigator and three trained supervisors with relevant experience supervised the data collection. Standard Operating Procedures (SOPs) were followed for each measurement to ensure the quality and reliability of anthropometric measurements.
Maternal body composition was evaluated for all pregnant women included in the study. At ANC booking, the maternal height, weight and MUAC are measured and recorded as part of routine care by trained healthcare providers following standard national guidelines. During data abstraction, the completeness and plausibility of recorded values were checked, and inconsistent or implausible measurements were excluded. Only anthropometric measurements obtained during early pregnancy (less than 16 weeks of gestation) were included to minimise variability.
In addition, the current maternal anthropometric measurements, weight and MUAC were measured just before the pregnant woman gave birth. Each anthropometric measurement was conducted twice. A third measurement was taken if the difference between the first two measures was greater than 0·5 units. The average of the two values obtained was reported.
The weight of the pregnant woman was measured using a digital scale while wearing her usual clothes, with shoes off and without any objects in her pockets. The scales are set to standard (zero) before the next measurement is taken and are regularly checked using a known, fixed weight. The measurement was taken with a precision of 100 g (to the nearest 0·1 kg). The same scale was used to weigh all the study participants in each hospital.
MUAC was measured using a flexible, non-stretchable measuring tape, while the women were in a sitting or standing position, with arms hanging loosely at the sides, palms facing inwards, at the marked midpoint of the upper left arm. The tape was placed gently but firmly around the arm to avoid compression of soft tissue in the left arm at the midpoint of the acromion process (bony protrusion on the shoulder) and the olecranon process (the point of the elbow). The left arm was bent at the elbow to 90 degrees, with the upper arm held parallel to the body. When the tape is in the correct position on the arm and at the correct tension, the measurement is read to the nearest 0·1 cm and recorded. The data collectors read the measurement to the nearest 0·1 cm after ensuring the tape was correctly positioned on the arm with the appropriate tension and recorded it immediately.
Operational definitions
BMI was calculated by taking pregnant women’s weight (in kilograms) divided by the square of their height (in metres). The WHO BMI category was used to classify the BMI status of pregnant women within 16 weeks of gestation at their first ANC visit. Based on the results of BMI, the pregnant woman was categorised into four groups: underweight (BMI < 18·5 kg/m2), normal weight (BMI range of 18·5–24·9 kg/m2), overweight (BMI range from 25 to 29·9 kg/m2) and obese (BMI range from ≥ 30 kg/m2)(40–Reference Blomberg43).
The AUC is a summary metric of the receiver operating characteristic (ROC) curve that reflects the ability of a test to distinguish between diseased and non-diseased individuals, with the following classification: excellent (0·9–1), good (0·8–0·9), fair (0·7–0·8), poor (0·6–0·7) and fail (0·5–0·6). A test with AUC values above 0·80 is generally considered clinically useful(Reference Çorbacıoğlu and Aksel44).
Sensitivity was calculated as the likelihood of women categorised as overweight/obese by MUAC and BMI from the total women classified as overweight/obese by BMI: TP/(TP + FN)(Reference Monaghan, Rahman and Agudelo45).
Specificity was calculated as the likelihood of pregnant women categorised as non-overweight/non-obese by MUAC and BMI from the total non-overweight/non-obese women by BMI: TN/(TN + FP)(Reference Monaghan, Rahman and Agudelo45).
Positive predictive value (PPV) was calculated as the proportion of true positives from all pregnant women with positive test results for overweight and obese by MUAC: TP/(TP + FP)(Reference Monaghan, Rahman and Agudelo45).
Negative predictive value (NPV) was calculated as the proportion of true negatives from all pregnant women with negative test results for overweight and obese by MUAC: TN/(TN + FN)(Reference Monaghan, Rahman and Agudelo45).
Positive likelihood ratio was calculated as the probability that overweight/obese pregnant women tested positive by MUAC to the probability that non-overweight/non-obese pregnant women tested positive: true positive/false positive => sensitivity/(1 – specificity). As a general rule, an LR+ greater than 10 shows that a test reliably discriminates between people who do and do not have the disease(Reference Ranganathan and Aggarwal46).
The negative likelihood ratio was calculated as the probability that overweight/obese pregnant women tested negative by MUAC, divided by the probability that non-overweight/non-obese pregnant women tested negative: false negative/true negative => (1-sensitivity)/specificity. As a general rule, an Likelihood Ratio (LR) less than 0·1 shows that a test reliably discriminates between people who do and do not have the disease(Reference Ranganathan and Aggarwal46).
Accuracy was calculated as the ratio of the sum of true positives and true negatives by MUAC to the total number of pregnant women included in the study: (TP + TN)/Total participants.
Data processing and analysis
Data were entered into Epi Info version 7 and imported into Stata version 18.0 for analysis. The normality of MUAC and BMI was assessed before the main analysis using histograms, quantile plots, Kernel density estimates, skewness and kurtosis tests and the Shapiro–Wilk test. Similarly, linear relationships between BMI and MUAC were evaluated using a scatter plot and Pearson’s correlation coefficient. Scatter plots with fitted linear regression lines were generated to evaluate the association between MUAC and BMI in women during early and late pregnancy. A simple linear regression analysis was performed to determine the strength and statistical significance of the association between BMI and MUAC.
The ROC curve was plotted with sensitivity (true positives) v. false-positive rate (1 – specificity) for MUAC cut-offs to evaluate the accuracy of MUAC in identifying maternal overweight and obesity compared with the gold standard (BMI). This ROC curve was plotted to assess the performance of MUAC measures in predicting maternal BMI across all possible cut-off points for underweight, optimal, overweight and obesity. The optimal MUAC cut-off point was determined using the highest Youden index (J = sensitivity + specificity − 1) that represents the best optimal threshold (cut-off) measures based on the largest vertical distance between the ROC and diagonal curves. A Youden index (J) of 1 indicates a perfect test, while 0 represents a non-informative test(Reference Pandey and Jain47). To assess the precision of these thresholds, 95 % CI were determined using non-parametric bootstrapping with 1000 replications. This approach accounts for sampling variability and provides robust estimates of the uncertainty surrounding each optimal cut point.
The AUC with 95 % CI was determined to evaluate the overall performance of MUAC in diagnosing maternal overweight and obesity. The AUC represents the trade-off between the correct identification of high-risk (overweight/obese) women (sensitivity) and the accurate identification of low-risk (non-overweight/obese) women (specificity). A higher AUC indicates a more accurate diagnosis of overweight and obesity, with an AUC of 1 indicating perfect discrimination. MUAC cut-off point was determined using the curve coordinates, and 2 × 2 tables were created for each BMI cut-off to cross-tabulate MUAC measurements. The discriminatory ability and predictive value of each MUAC cut-off point were assessed using sensitivity, specificity, PPV, NPV, positive and negative likelihood ratios and correctly classified percentage, with 95 % CI, against the corresponding BMI cut-off. MUAC values were selected according to BMI references. A P-value < 0·05 was considered statistically significant.
Ethical considerations
The research project proposal was approved and cleared by the Institutional Health Research Ethics Review Committee (IHRERC) of the College of Health and Medical Sciences (CHMS), Haramaya University (ref. no. IHRERC/045/2023). A formal letter of cooperation from the university was submitted to the Regional Health Bureaus and respective hospitals for permission. Permission and a voluntary, informed, written and signed consent were obtained from the heads of the hospital. The objectives, significance, benefits and risks of the study, as well as its procedural details, were explained to the study participants. A voluntary, informed, written and signed consent was obtained from each pregnant woman in the study before conducting the interview and measurements. To ensure confidentiality, the respondent’s name was not written on the questionnaire. The Standards for Reporting Diagnostic Accuracy (STARD) 2015 statement, which provides a thirty-item checklist to guide reporting, is used to report the findings of this study (online Supplementary Table 1).
Result
Anthropometric and background characteristics of pregnant women
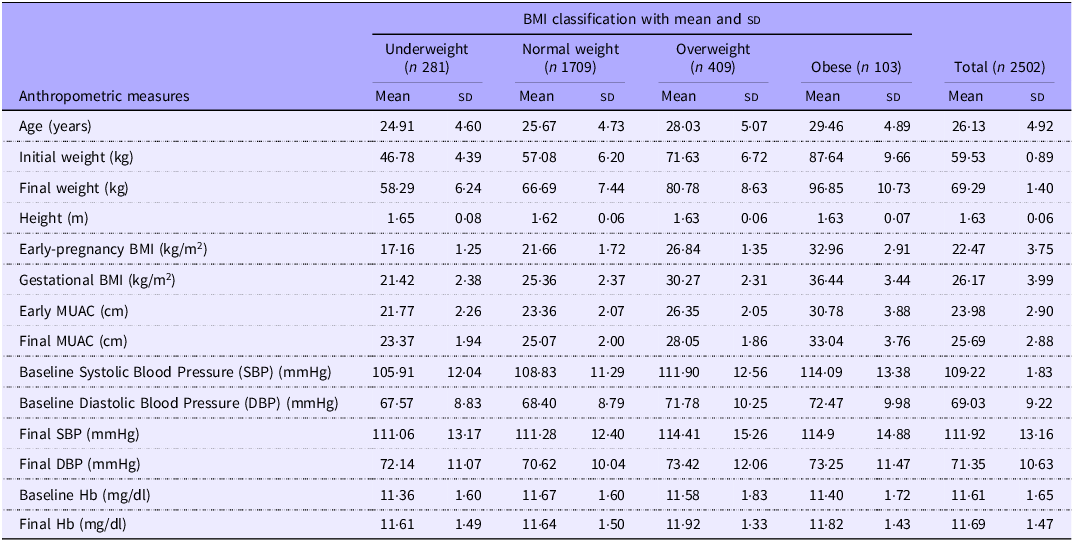
Of the 2553 eligible pregnant women, fifty-one did not have early-pregnancy MUAC recorded in their medical records. Hence, data from 2502 pregnant women included in this study showed that 281 (11·23 %) were underweight, 1709 (68·31 %) had a normal weight, 409 (16·35 %) were overweight and 103 (4·12 %) were obese. The mean age was 26·13 (sd 4·92) years, slightly higher among the obese and overweight groups. Early-pregnancy mean weight and height were 59·53 kg (sd 10·89) and 1·63 m (sd 0·06), respectively. The mean BMI increased from 22·47 kg/m2 (sd 3·75) in early pregnancy to 26·17 kg/m2 (sd 3·99) in late pregnancy. The mean MUAC was also slightly increased from 23·98 cm (sd 2·90) to 25·69 cm (sd 2·88). The median increase in MUAC from early to late pregnancy was 1·5 cm (interquartile range: 1·0–2·0 cm). There was a statistically significant increase in MUAC across gestation (Wilcoxon signed-rank test, z = 42·14, P < 0·001). Late-pregnancy MUAC was significantly higher than early-pregnancy MUAC, with 91·7 % of participants exhibiting higher late-pregnancy values compared with early-pregnancy measurements. Obese and overweight women had higher baseline BP compared with the normal and underweight groups (Table 1).
Background and anthropometric values (mean and sd) of pregnant women attending ANC and delivery service at public hospitals of urban areas in Eastern Ethiopia, 2023 (n 2502)

Table 1. Long description
The table presents anthropometric measures and BMI classifications of pregnant women attending antenatal care and delivery services in urban areas of Eastern Ethiopia. It includes data for 2502 women categorized into four BMI groups: Underweight (281 women), Normal weight (1709 women), Overweight (409 women), and Obese (103 women). The table has 12 rows and 9 columns. The columns are labeled as follows: Anthropometric measures, Underweight (n 281) with Mean and SD, Normal weight (n 1709) with Mean and SD, Overweight (n 409) with Mean and SD, Obese (n 103) with Mean and SD, and Total (n 2502) with Mean and SD. The rows include Age (years), Initial weight (kg), Final weight (kg), Height (m), Early-pregnancy BMI (kg/m2), Gestational BMI (kg/m2), Early MUAC (cm), Final MUAC (cm), Baseline SBP (mmHg), Baseline DBP (mmHg), Final SBP (mmHg), Final DBP (mmHg), Baseline Hb (mg/dl), and Final Hb (mg/dl). Each cell contains the mean and standard deviation (SD) values for the respective anthropometric measures and BMI classifications.
ANC, antenatal care; MUAC, mid-upper arm circumference.
Relationship between BMI and mid-upper arm circumference
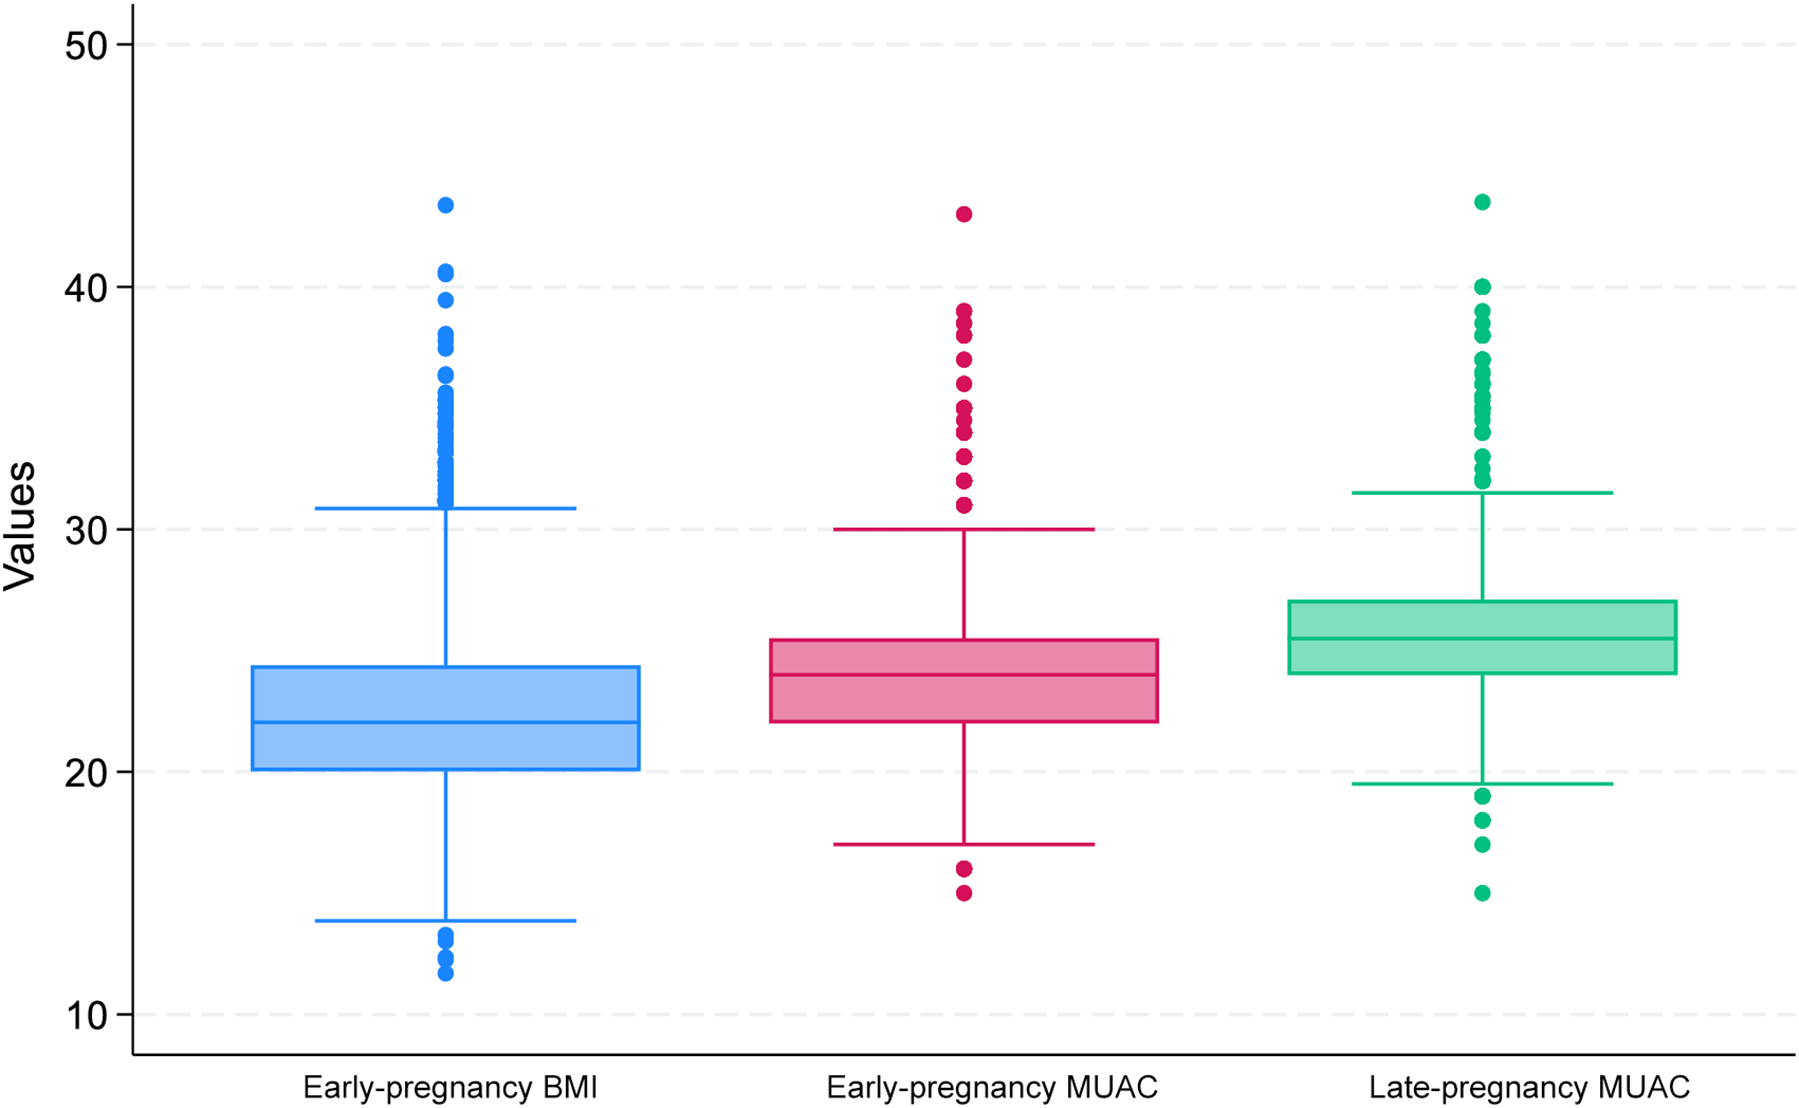
The distribution of BMI, early-pregnancy MUAC and late-pregnancy MUAC is presented in Figure 1.
Box plot of BMI, early-pregnancy MUAC and late-pregnancy MUAC among pregnant women attending public hospitals of urban areas in Eastern Ethiopia, 2023. MUAC, mid-upper arm circumference.

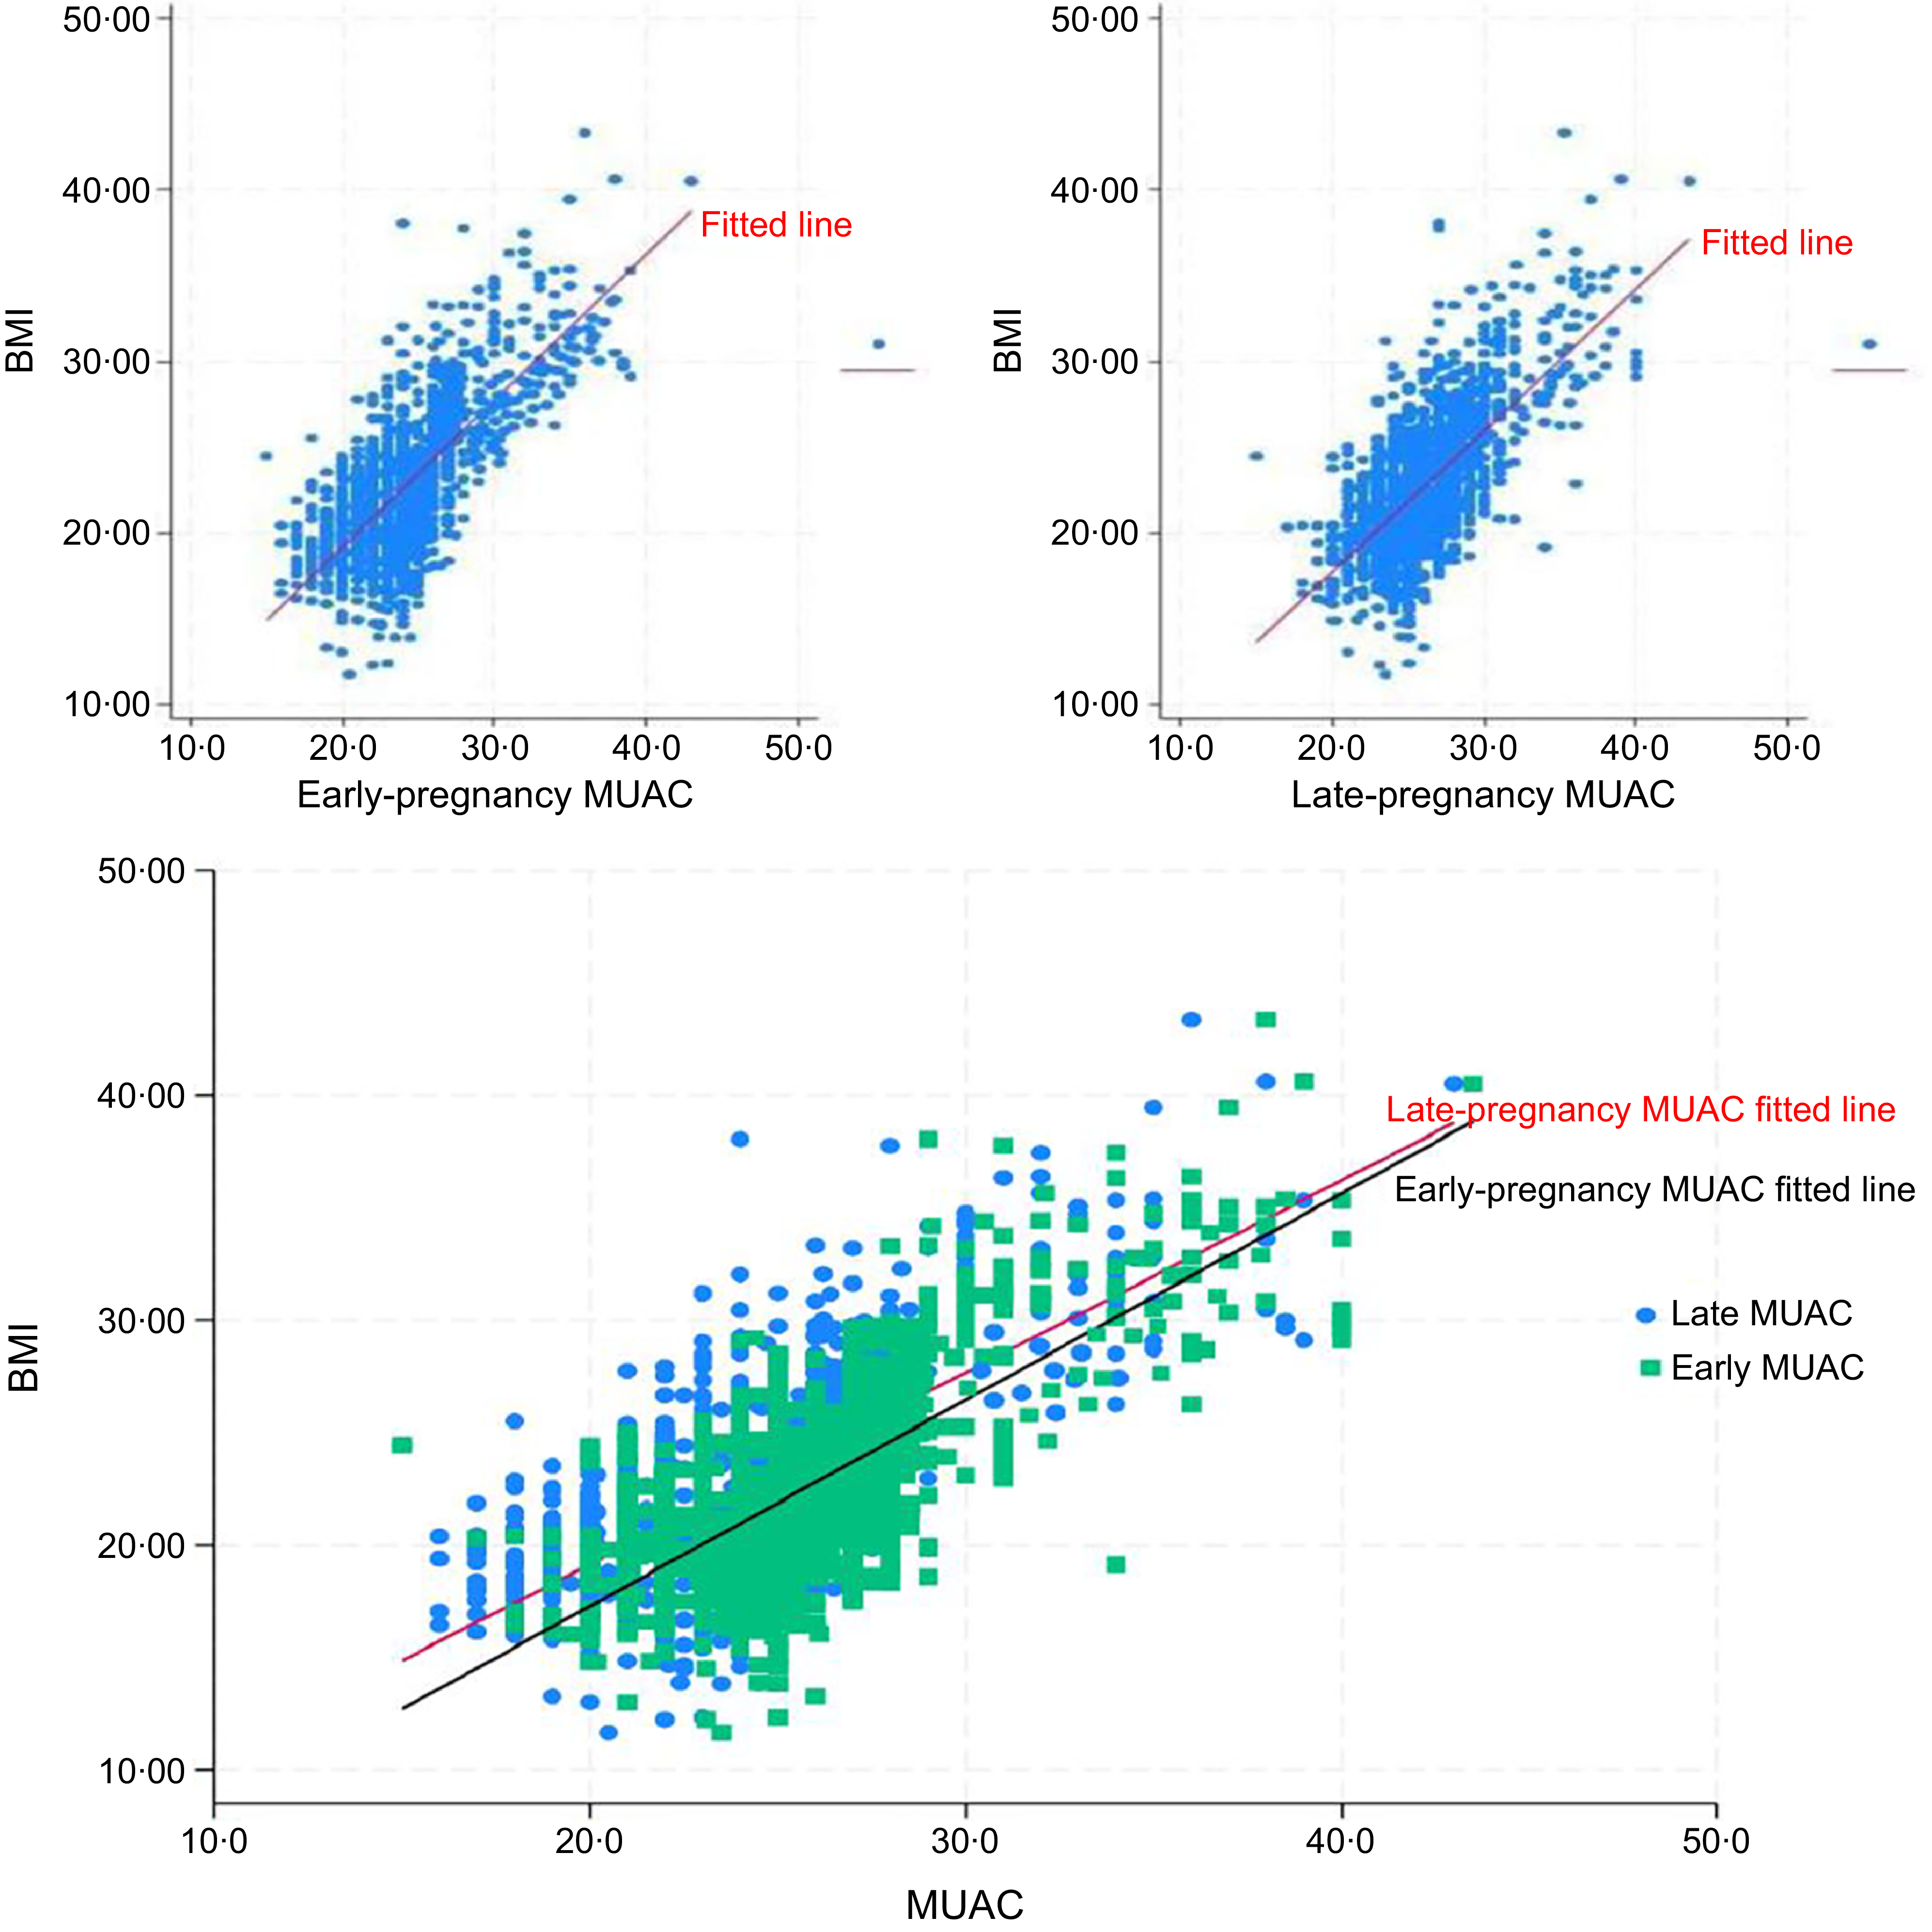
Early-pregnancy BMI showed a moderate positive linear correlation with early-pregnancy MUAC (r 0·69, P < 0·0001) and late-pregnancy MUAC (r 0·72, P < 0·0001) among pregnant women in Eastern Ethiopia. A simple linear regression model also demonstrated a positive linear relationship between BMI and MUAC during early and late pregnancy. The regression equations were BMI = 1·09 + 0·89 × MUAC (cm) for early pregnancy and BMI = –1·69 + 0·94 × MUAC (cm) for late pregnancy. The regression coefficient for BMI and early-pregnancy MUAC was 0·89 (95 % CI 0·85, 0·93; P < 0·001), while for late-pregnancy MUAC, it was 0·94 (95 % CI 0·90, 0·98; P < 0·001). This indicated that, on average, each 1 cm increase in early-pregnancy MUAC corresponds to a 0·89 kg/m2 increase in BMI, and each 1 cm increase in late-pregnancy MUAC corresponds to a 0·94 kg/m2 increase in BMI (Figure 2).
Scatterplot of correlation between BMI and MUAC during early and late pregnancy among pregnant women in Eastern Ethiopia, 2023. MUAC, mid-upper arm circumference.

Diagnostic accuracy of mid-upper arm circumference using receiver operating characteristic curve analysis
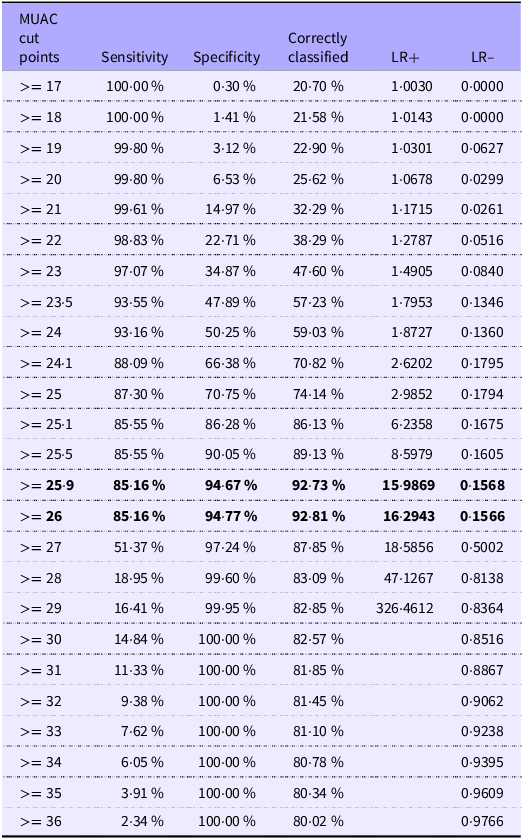
The accuracy of MUAC in identifying maternal overweight and obesity was assessed using ROC curves and the AUC. Youden’s index was used to determine optimal MUAC cut-off points for detecting maternal overweight and obesity in early and late pregnancy. These cut-off points were selected based on the highest combination of sensitivity and specificity relative to standard BMI cut-off points. Tables 2–5 present MUAC cut-off values for screening maternal overweight and obesity in early and late pregnancy.
Sensitivity, specificity, correctly classified and likelihood ratios for positive and negative tests for different values of MUAC for detecting maternal overweight during early pregnancy among pregnant women, 2023

Table 2. Long description
The table presents data on the sensitivity, specificity, correctly classified, and likelihood ratios for positive and negative tests for different values of MUAC for detecting maternal overweight during early pregnancy. The table has 22 rows and 6 columns. The columns are labeled MUAC cut points, Sensitivity, Specificity, Correctly classified, LR+, and LR-. Each row provides values for these columns corresponding to different MUAC cut points. The table includes specific values for sensitivity, specificity, correctly classified, LR+, and LR- for each MUAC cut point. The boldface in the table highlights the optimal MUAC cut-off points based on Youdens index, which balances sensitivity and specificity.
MUAC, mid-upper arm circumference.
Bold values indicate the optimal MUAC cut-off selected based on the best overall diagnostic performance.
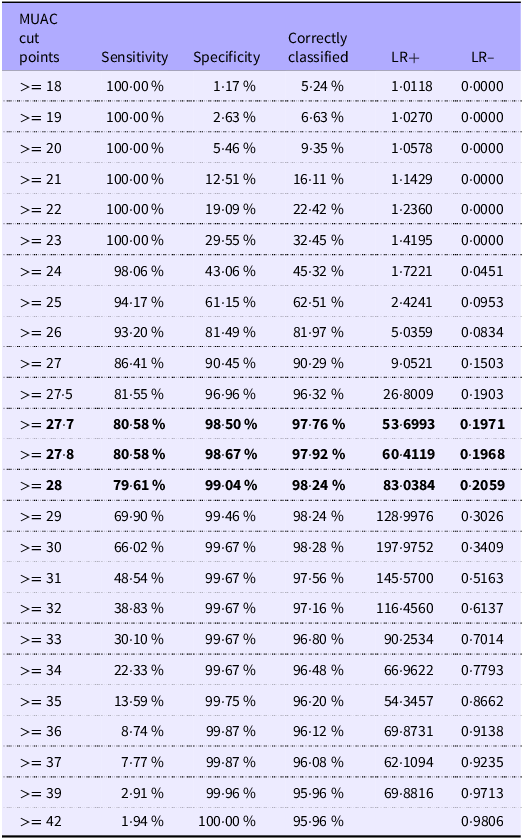
Sensitivity, specificity, correctly classified and likelihood ratios for positive and negative tests for different values of MUAC for detecting maternal obesity during early pregnancy among pregnant women, 2023

Table 3. Long description
The table presents data on sensitivity, specificity, correctly classified, and likelihood ratios for positive and negative tests for different values of MUAC for detecting maternal obesity during early pregnancy among pregnant women. It has 26 rows and 5 columns. The columns are labeled MUAC cut points, Sensitivity, Specificity, Correctly classified, LR+, and LR-. Each row provides values for these columns corresponding to different MUAC cut points ranging from 18 to 42. The table includes specific percentages and ratios for each cut point, showing how sensitivity and specificity change with different MUAC values.
MUAC, mid-upper arm circumference.
Bold values indicate the optimal MUAC cut-off selected based on the best overall diagnostic performance.
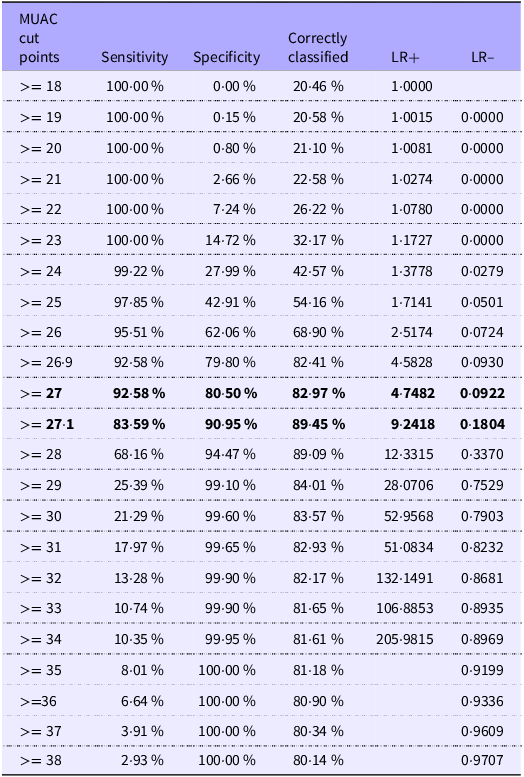
Sensitivity, specificity, correctly classified and likelihood ratios for positive and negative tests for different values of MUAC for detecting maternal overweight during late pregnancy among pregnant women, 2023

Table 4. Long description
The table has 22 rows and 5 columns. The columns are labeled MUAC cut points, Sensitivity, Specificity, Correctly classified, and LR with sub-columns LR+ and LR-. The rows list different MUAC cut points starting from 18 to 38 and their corresponding values for Sensitivity, Specificity, Correctly classified, LR+, and LR-. Row 1: MUAC cut points, 18; Sensitivity, 10000 percent; Specificity, 000 percent; Correctly classified, 2046 percent; LR+, 10000; LR-, 0000. Row 2: MUAC cut points, 19; Sensitivity, 10000 percent; Specificity, 015 percent; Correctly classified, 2058 percent; LR+, 10015; LR-, 00000. Row 3: MUAC cut points, 20; Sensitivity, 10000 percent; Specificity, 080 percent; Correctly classified, 2110 percent; LR+, 10081; LR-, 00000. Row 4: MUAC cut points, 21; Sensitivity, 10000 percent; Specificity, 266 percent; Correctly classified, 2258 percent; LR+, 10274; LR-, 00000. Row 5: MUAC cut points, 22; Sensitivity, 10000 percent; Specificity, 724 percent; Correctly classified, 2622 percent; LR+, 10780; LR-, 00000. Row 6: MUAC cut points, 23; Sensitivity, 10000 percent; Specificity, 1472 percent; Correctly classified, 3217 percent; LR+, 11727; LR-, 00000. Row 7: MUAC cut points, 24; Sensitivity, 9922 percent; Specificity, 2799 percent; Correctly classified, 4257 percent; LR+, 13778; LR-, 00279. Row 8: MUAC cut points, 25; Sensitivity, 9785 percent; Specificity, 4291 percent; Correctly classified, 5416 percent; LR+, 17141; LR-, 00501. Row 9: MUAC cut points, 26; Sensitivity, 9551 percent; Specificity, 6206 percent; Correctly classified, 6890 percent; LR+, 25174; LR-, 00724. Row 10: MUAC cut points, 269; Sensitivity, 9258 percent; Specificity, 7980 percent; Correctly classified, 8241 percent; LR+, 45828; LR-, 00930. Row 11: MUAC cut points, 27; Sensitivity, 9258 percent; Specificity, 8050 percent; Correctly classified, 8297 percent; LR+, 47482; LR-, 00922. Row 12: MUAC cut points, 271; Sensitivity, 8359 percent; Specificity, 9095 percent; Correctly classified, 8945 percent; LR+, 92418; LR-, 01804. Row 13: MUAC cut points, 28; Sensitivity, 6816 percent; Specificity, 9447 percent; Correctly classified, 8909 percent; LR+, 123315; LR-, 03370. Row 14: MUAC cut points, 29; Sensitivity, 2539 percent; Specificity, 9910 percent; Correctly classified, 8401 percent; LR+, 280706; LR-, 07529. Row 15: MUAC cut points, 30; Sensitivity, 2129 percent; Specificity, 9960 percent; Correctly classified, 8357 percent; LR+, 529568; LR-, 07903. Row 16: MUAC cut points, 31; Sensitivity, 1797 percent; Specificity, 9965 percent; Correctly classified, 8293 percent; LR+, 510834; LR-, 08232. Row 17: MUAC cut points, 32; Sensitivity, 1328 percent; Specificity, 9990 percent; Correctly classified, 8217 percent; LR+, 1321491; LR-, 08681. Row 18: MUAC cut points, 33; Sensitivity, 1074 percent; Specificity, 9990 percent; Correctly classified, 8165 percent; LR+, 1068853; LR-, 08935. Row 19: MUAC cut points, 34; Sensitivity, 1035 percent; Specificity, 9995 percent; Correctly classified, 8161 percent; LR+, 2059815; LR-, 08969. Row 20: MUAC cut points, 35; Sensitivity, 801 percent; Specificity, 10000 percent; Correctly classified, 8118 percent; LR+, 09199; LR-, 09199. Row 21: MUAC cut points, 36; Sensitivity, 664 percent; Specificity, 10000 percent; Correctly classified, 8090 percent; LR+, 09336; LR-, 09336. Row 22: MUAC cut points, 37; Sensitivity, 391 percent; Specificity, 10000 percent; Correctly classified, 8034 percent; LR+, 09609; LR-, 09609. Row 23: MUAC cut points, 38; Sensitivity, 293 percent; Specificity, 10000 percent; Correctly classified, 8014 percent; LR+, 09707; LR-, 09707.
MUAC, mid-upper arm circumference.
Bold values indicate the optimal MUAC cut-off selected based on the best overall diagnostic performance.
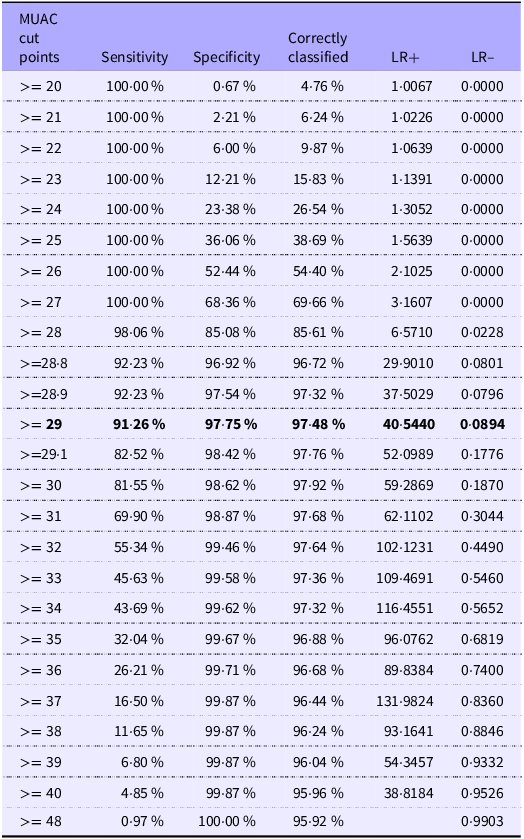
Sensitivity, specificity, correctly classified and likelihood ratios for positive and negative tests for different values of MUAC for detecting maternal obesity during late pregnancy among pregnant women, 2023

Table 5. Long description
The table presents data on sensitivity, specificity, correctly classified, and likelihood ratios for positive and negative tests for different values of MUAC for detecting maternal obesity during late pregnancy among pregnant women. The table has 28 rows and 6 columns. The columns are labeled MUAC cut points, Sensitivity, Specificity, Correctly classified, LR+, and LR-. Each row provides values for these columns corresponding to different MUAC cut points. For example, Row 1: MUAC cut points >= 20, Sensitivity 100.00 percent, Specificity 0.67 percent, Correctly classified 4.76 percent, LR+ 1.0067, LR- 0.0000. Row 2: MUAC cut points >= 21, Sensitivity 100.00 percent, Specificity 2.21 percent, Correctly classified 6.24 percent, LR+ 1.0226, LR- 0.0000. Row 3: MUAC cut points >= 22, Sensitivity 100.00 percent, Specificity 6.00 percent, Correctly classified 9.87 percent, LR+ 1.0639, LR- 0.0000. Row 4: MUAC cut points >= 23, Sensitivity 100.00 percent, Specificity 12.21 percent, Correctly classified 15.83 percent, LR+ 1.1391, LR- 0.0000. Row 5: MUAC cut points >= 24, Sensitivity 100.00 percent, Specificity 23.38 percent, Correctly classified 26.54 percent, LR+ 1.3052, LR- 0.0000. Row 6: MUAC cut points >= 25, Sensitivity 100.00 percent, Specificity 36.06 percent, Correctly classified 38.69 percent, LR+ 1.5639, LR- 0.0000. Row 7: MUAC cut points >= 26, Sensitivity 100.00 percent, Specificity 52.44 percent, Correctly classified 54.40 percent, LR+ 2.1025, LR- 0.0000. Row 8: MUAC cut points >= 27, Sensitivity 100.00 percent, Specificity 68.36 percent, Correctly classified 69.66 percent, LR+ 3.1607, LR- 0.0000. Row 9: MUAC cut points >= 28, Sensitivity 98.06 percent, Specificity 85.08 percent, Correctly classified 85.61 percent, LR+ 6.5710, LR- 0.0228. Row 10: MUAC cut points >= 28.8, Sensitivity 92.23 percent, Specificity 96.92 percent, Correctly classified 96.72 percent, LR+ 29.9010, LR- 0.0801. Row 11: MUAC cut points >= 28.9, Sensitivity 92.23 percent, Specificity 97.54 percent, Correctly classified 97.32 percent, LR+ 37.5029, LR- 0.0796. Row 12: MUAC cut points >= 29, Sensitivity 91.26 percent, Specificity 97.75 percent, Correctly classified 97.48 percent, LR+ 40.5440, LR- 0.0894. Row 13: MUAC cut points >= 29.1, Sensitivity 82.52 percent, Specificity 98.42 percent, Correctly classified 97.76 percent, LR+ 52.0989, LR- 0.1776. Row 14: MUAC cut points >= 30, Sensitivity 81.55 percent, Specificity 98.62 percent, Correctly classified 97.92 percent, LR+ 59.2869, LR- 0.1870. Row 15: MUAC cut points >= 31, Sensitivity 69.90 percent, Specificity 98.87 percent, Correctly classified 97.68 percent, LR+ 62.1102, LR- 0.3044. Row 16: MUAC cut points >= 32, Sensitivity 55.34 percent, Specificity 99.46 percent, Correctly classified 97.64 percent, LR+ 102.1231, LR- 0.4490. Row 17: MUAC cut points >= 33, Sensitivity 45.63 percent, Specificity 99.58 percent, Correctly classified 97.36 percent, LR+ 109.4691, LR- 0.5460. Row 18: MUAC cut points >= 34, Sensitivity 43.69 percent, Specificity 99.62 percent, Correctly classified 97.32 percent, LR+ 116.4551, LR- 0.5652. Row 19: MUAC cut points >= 35, Sensitivity 32.04 percent, Specificity 99.67 percent, Correctly classified 96.88 percent, LR+ 96.0762, LR- 0.6819. Row 20: MUAC cut points >= 36, Sensitivity 26.21 percent, Specificity 99.71 percent, Correctly classified 96.68 percent, LR+ 89.8384, LR- 0.7400. Row 21: MUAC cut points >= 37, Sensitivity 16.50 percent, Specificity 99.87 percent, Correctly classified 96.44 percent, LR+ 131.9824, LR- 0.8360. Row 22: MUAC cut points >= 38, Sensitivity 11.65 percent, Specificity 99.87 percent, Correctly classified 96.24 percent, LR+ 93.1641, LR- 0.8846. Row 23: MUAC cut points >= 39, Sensitivity 6.80 percent, Specificity 99.87 percent, Correctly classified 96.04 percent, LR+ 54.3457, LR- 0.9332. Row 24: MUAC cut points >= 40, Sensitivity 4.85 percent, Specificity 99.87 percent, Correctly classified 95.96 percent, LR+ 38.8184, LR- 0.9526. Row 25: MUAC cut points >= 48, Sensitivity 0.97 percent, Specificity 100.00 percent, Correctly classified 95.92 percent, LR+ 0.9903, LR- 0.9903.
MUAC, mid-upper arm circumference.
Bold values indicate the optimal MUAC cut-off selected based on the best overall diagnostic performance.
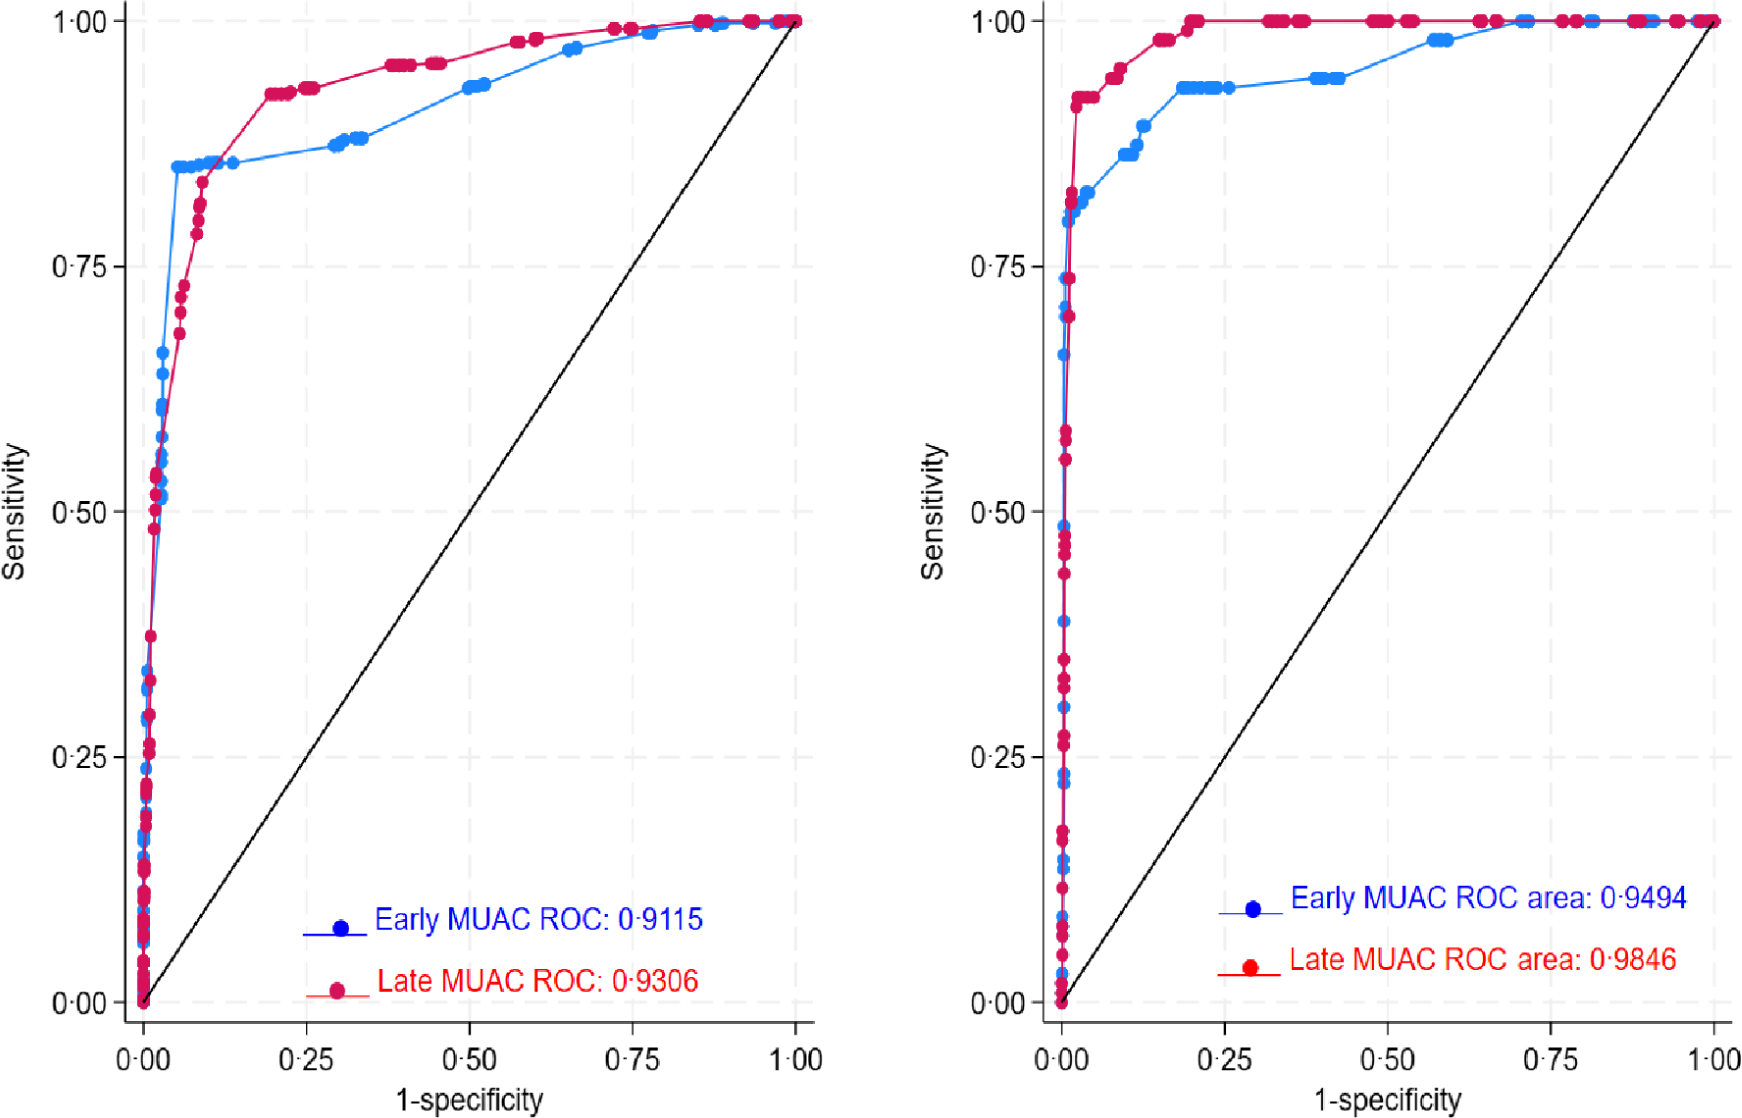
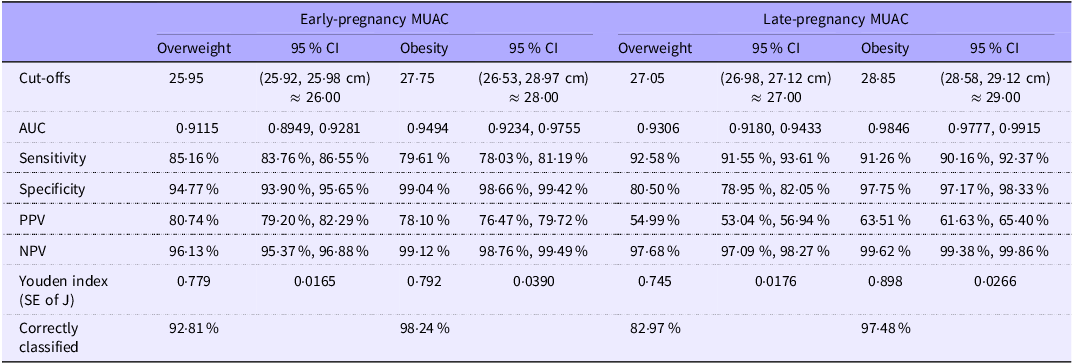
The ROC curve analysis showed that MUAC can be used as a screening tool for detecting maternal overweight and obesity during both early and late pregnancy with high sensitivity and specificity. The AUC for MUAC against BMI-defined overweight was excellent in women in early pregnancy (0·9115; 95 % CI 0·8949, 0·9281) and late pregnancy (0·9306; 95 % CI 0·9180, 0·9433). Based on the Youden index, the optimal MUAC cut-offs to identify maternal overweight were 25·95 cm (95 % CI of 25·92, 25·98 cm; Youden index: 0·779) during early pregnancy and 27·05 cm (95 % CI 26·98, 27·12 cm; Youden index: 0·745) during late pregnancy. These cut-off points yielded high diagnostic performance. For early-pregnancy overweight classification, sensitivity was 85·16 % (95 % CI 83·76 %, 86·55 %), specificity 94·77 % (95 % CI 93·90 %, 95·65 %), PPV 80·74 % (95 % CI 79·20 %, 82·29 %) and NPV 96·13 % (95 % CI 95·37 %, 96·88 %). For late-pregnancy overweight classification, sensitivity was 92·58 % (95 % CI 91·55 %, 93·61 %), specificity 80·50 % (95 % CI 78·95 %, 82·05 %), PPV 54·99 % (95 % CI 53·04 %, 56·94 %) and NPV 97·68 % (95 % CI 97·09 %, 98·27 %).
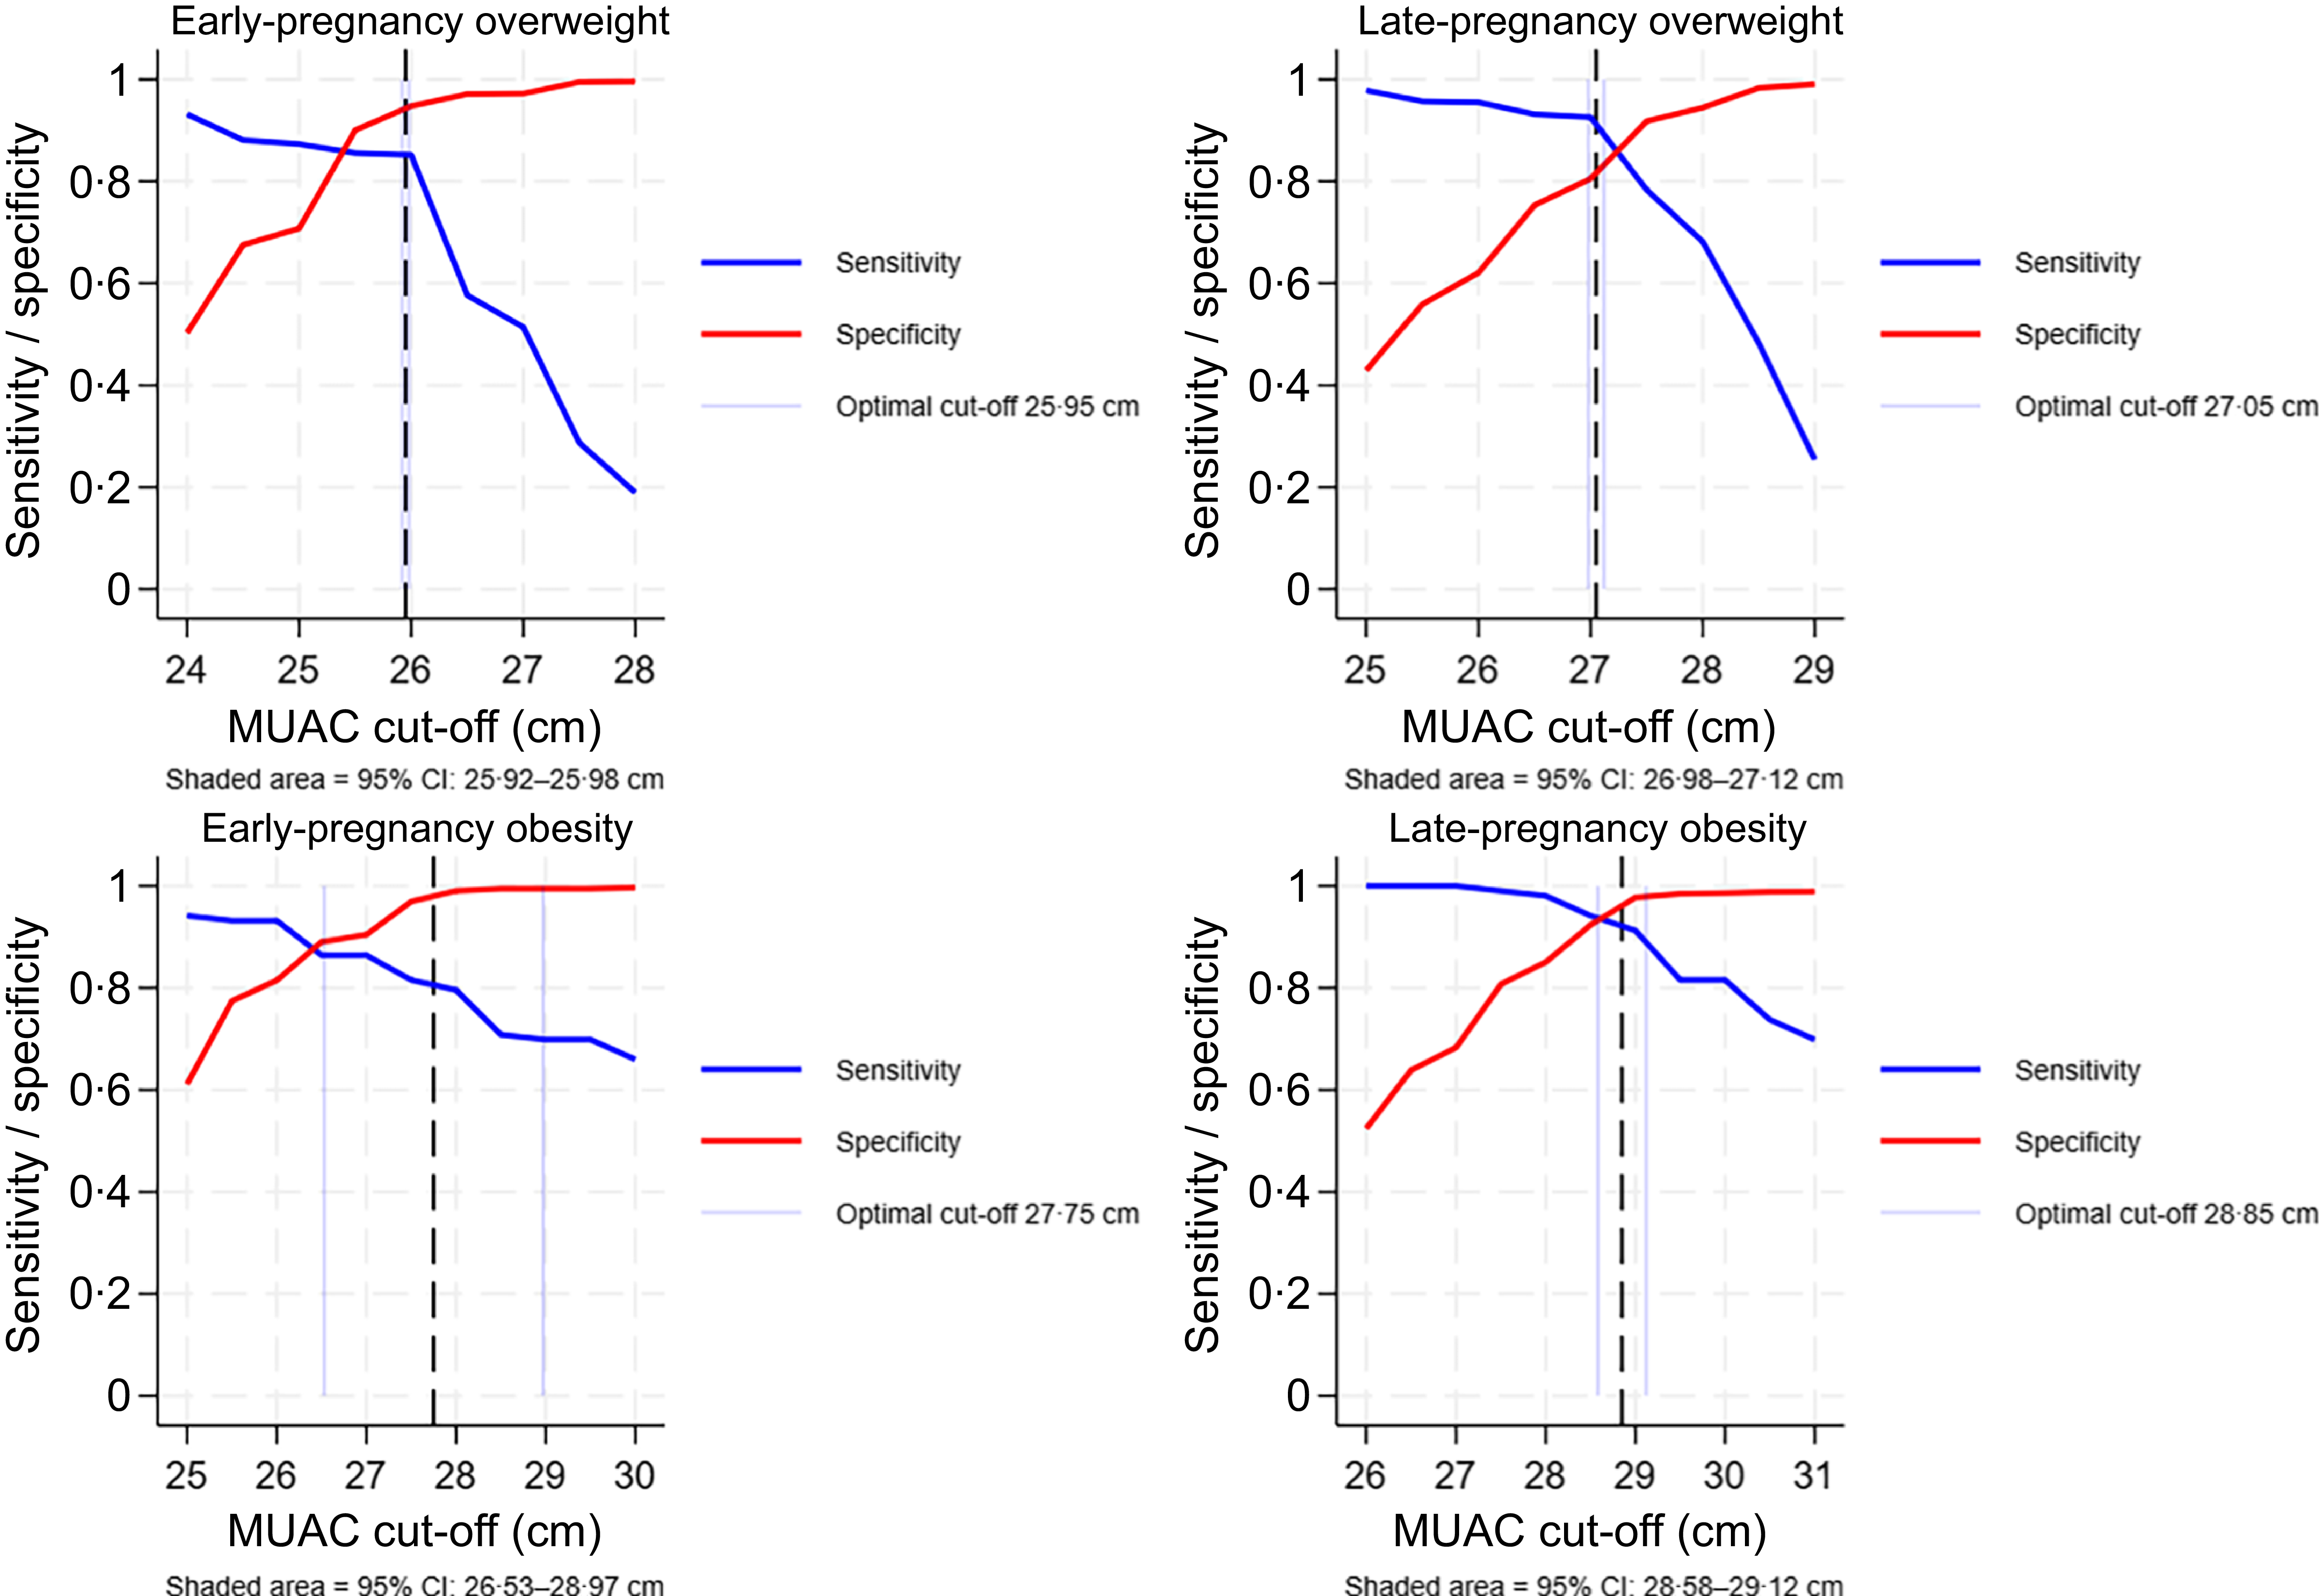
Moreover, the AUC for MUAC against BMI-defined obesity was excellent in women during early pregnancy (0·9494; 95 % CI 0·9234, 0·9755) and late pregnancy (0·9846; 95 % CI 0·9777, 0·9915). According to the Youden analysis, the best MUAC cut-off to detect maternal obesity among pregnant women was 27·75 cm (95 % CI 26·53, 28·97 cm; Youden index: 0·792) during early pregnancy and 28·85 cm (95 % CI 28·58, 29·12 cm; Youden index: 0·898) during late pregnancy. Early-pregnancy obesity classification showed sensitivity 79·61 % (95 % CI 78·03 %, 81·19 %), specificity 99·04 % (95 % CI 98·66 %, 99·42 %), PPV 78·10 % (95 % CI 76·47 %, 79·72 %) and NPV 99·12 % (95 % CI 98·76 %, 99·49 %). Late-pregnancy obesity classification demonstrated sensitivity 91·26 % (95 % CI 90·16 %, 92·37 %), specificity 97·75 % (95 % CI 97·17 %, 98·33 %), PPV 63·51 % (95 % CI 61·63 %, 65·40 %) and NPV 99·62 % (95 % CI 99·38 %, 99·86 %). Based on the narrow CI and minimal variation in sensitivity and specificity within ±0·2 cm of the optimal values, clinically practical rounded cut points of 26 cm for early overweight, 28 cm for late overweight, 27 cm for early obesity and 29 cm for late obesity were proposed (Figure 3, Table 6). Figure 4 illustrated the sensitivity and specificity curves across MUAC values, with the 95 % CI around the optimal cut points. The curves demonstrate a gradual trade-off between sensitivity and specificity near the optimal thresholds, with high accuracy maintained across MUAC values of approximately 26–28 cm.
ROC curve and respective AUC of the performance of early and late-pregnancy MUAC in detecting maternal overweight and obesity among pregnant women in Eastern Ethiopia, 2023. ROC, receiver operating characteristic; MUAC, mid-upper arm circumference.

Figure 3. Long description
Two receiver operating characteristic (ROC) curves are presented side by side. Each ROC curve compares the performance of early and late-pregnancy mid-upper arm circumference (MUAC) in detecting maternal overweight and obesity. Panel A: The ROC curve on the left shows the performance of early MUAC with a ROC area of 0.9115 and late MUAC with a ROC area of 0.9306. The x-axis represents 1-specificity, ranging from 0.00 to 1.00, and the y-axis represents sensitivity, also ranging from 0.00 to 1.00. The early MUAC data is represented by a blue line with circular markers, while the late MUAC data is represented by a red line with circular markers. Panel B: The ROC curve on the right shows the performance of early MUAC with a ROC area of 0.9494 and late MUAC with a ROC area of 0.9846. The x-axis represents 1-specificity, ranging from 0.00 to 1.00, and the y-axis represents sensitivity, also ranging from 0.00 to 1.00. The early MUAC data is represented by a blue line with circular markers, while the late MUAC data is represented by a red line with circular markers.
Diagnostic performance of MUAC on detecting maternal overweight and obesity among pregnant women attending public hospitals of urban areas in Eastern Ethiopia, 2023

Table 6. Long description
The table compares the diagnostic performance of Mid-Upper Arm Circumference (MUAC) for detecting maternal overweight and obesity in early and late pregnancy. It has 8 rows and 12 columns. The columns are labeled as Early-pregnancy MUAC Overweight, 95 percent CI, Obesity, 95 percent CI, Late-pregnancy MUAC Overweight, 95 percent CI, Obesity, and 95 percent CI. The rows are labeled as Cut-offs, AUC, Sensitivity, Specificity, PPV, NPV, Youden index (SE of J), and Correctly classified. Each row provides specific values and confidence intervals for the respective diagnostic metrics. The table shows detailed data on the performance of MUAC in detecting maternal overweight and obesity during different stages of pregnancy.
MUAC, mid-upper arm circumference; PPV, positive predictive value; NPV, negative predictive value.
A trade-off between sensitivity and specificity of MUAC cut-offs for identifying overweight and obesity in early and late pregnancy, with 95 % CI for optimal thresholds, 2023. MUAC, mid-upper arm circumference.

Figure 4. Long description
The image contains four line graphs. Each graph shows the sensitivity and specificity of mid-upper arm circumference (MUAC) cut-offs for identifying overweight and obesity in early and late pregnancy. Panel A: Early-pregnancy overweight. The x-axis represents MUAC cut-off in centimeters ranging from 24 to 28. The y-axis represents sensitivity and specificity ranging from 0 to 1. The blue line indicates sensitivity, and the red line indicates specificity. The optimal cut-off is marked at 25.95 cm. Panel B: Late-pregnancy overweight. The x-axis represents MUAC cut-off in centimeters ranging from 25 to 29. The y-axis represents sensitivity and specificity ranging from 0 to 1. The blue line indicates sensitivity, and the red line indicates specificity. The optimal cut-off is marked at 27.05 cm. Panel C: Early-pregnancy obesity. The x-axis represents MUAC cut-off in centimeters ranging from 25 to 30. The y-axis represents sensitivity and specificity ranging from 0 to 1. The blue line indicates sensitivity, and the red line indicates specificity. The optimal cut-off is marked at 27.75 cm. Panel D: Late-pregnancy obesity. The x-axis represents MUAC cut-off in centimeters ranging from 26 to 31. The y-axis represents sensitivity and specificity ranging from 0 to 1. The blue line indicates sensitivity, and the red line indicates specificity. The optimal cut-off is marked at 28.85 cm.
Comparison of nutrition status classification by BMI and mid-upper arm circumference using receiver operating characteristic curves
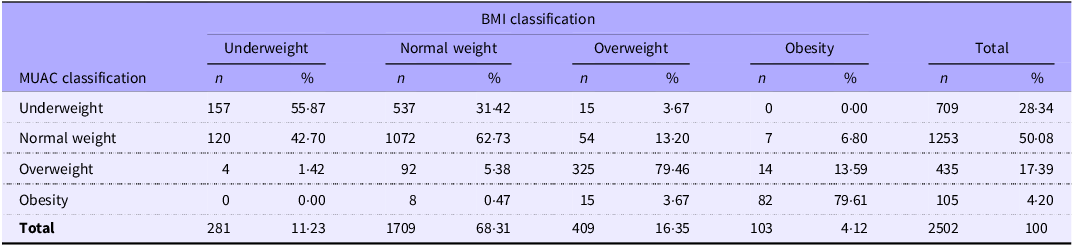
The global accuracy of MUAC cut-off points was assessed to classify the nutritional status of pregnant women in comparison to the standard BMI cut-offs, that is, < 18·5 kg/m2 (underweight), 18·5–24·9 kg/m2 (normal weight), 25–29·9 (overweight) and > 30 kg/m2 (obesity) using ROC curve analysis. MUAC showed very good estimates of the classification of the nutritional status of pregnant women during both early and late pregnancy. During early pregnancy, this MUAC classification was very good in identifying both overweight and obese. Among women with overweight by BMI, 325 (79·46 %) were correctly classified as overweight by MUAC. Similarly, among women with obesity by BMI, 82 (79·61 %) were correctly classified as obese by MUAC. However, among 281 underweight women, 120 (42·7 %) were misclassified as normal weight by MUAC. Among normal-weight women (n 1709), 537 (31·4 %) were misclassified as underweight by MUAC (Table 7).
Nutritional status classification by MUAC in comparison with BMI classification using ROC curve analysis of pregnant women during early pregnancy at Eastern Ethiopia, 2023

Table 7. Long description
A table comparing nutritional status classifications by MUAC and BMI among pregnant women. The table has five rows and five columns. The columns are labeled as MUAC classification, Underweight, Normal weight, Overweight, Obesity, and Total. The rows are labeled as Underweight, Normal weight, Overweight, Obesity, and Total. Each cell contains values for ’n’ and ’%’. Row 1: Underweight, Underweight n 157, Underweight % 55.87, Normal weight n 537, Normal weight % 31.42, Overweight n 15, Overweight % 3.67, Obesity n 0, Obesity % 0.00, Total n 709, Total % 28.34. Row 2: Normal weight, Underweight n 120, Underweight % 42.70, Normal weight n 1072, Normal weight % 62.73, Overweight n 54, Overweight % 13.20, Obesity n 7, Obesity % 6.80, Total n 1253, Total % 50.08. Row 3: Overweight, Underweight n 4, Underweight % 1.42, Normal weight n 92, Normal weight % 5.38, Overweight n 325, Overweight % 79.46, Obesity n 14, Obesity % 13.59, Total n 435, Total % 17.39. Row 4: Obesity, Underweight n 0, Underweight % 0.00, Normal weight n 8, Normal weight % 0.47, Overweight n 15, Overweight % 3.67, Obesity n 82, Obesity % 79.61, Total n 105, Total % 4.20. Row 5: Total, Underweight n 281, Underweight % 11.23, Normal weight n 1709, Normal weight % 68.31, Overweight n 409, Overweight % 16.35, Obesity n 103, Obesity % 4.12, Total n 2502, Total % 100.
MUAC, mid-upper arm circumference; ROC, receiver operating characteristic.
Percentages are column percentages based on BMI classification
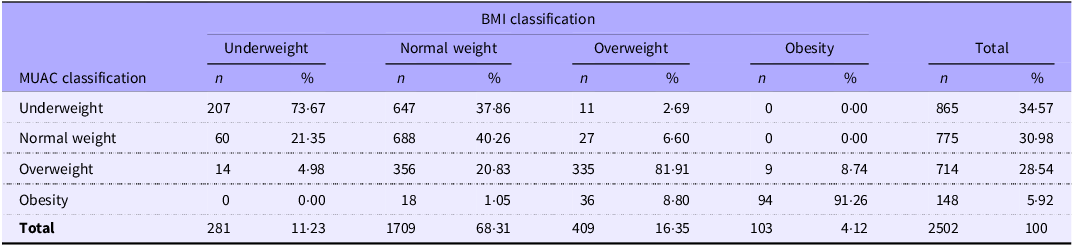
Similarly, the MUAC classification was outstanding in identifying underweight, overweight and obese during late pregnancy. Among underweight women by BMI, 207 (73·67 %) were correctly classified by MUAC. Among overweight women, 335 (81·91 %) were correctly classified, and among obese women, 94 (91·26 %) were correctly classified. Misclassification was most notable among normal-weight women, of whom 647 (37·9 %) were classified as underweight by MUAC, and among overweight women, of whom 356 (20·8 %) were classified as normal weight (Table 8).
Nutritional status classification by MUAC in comparison with BMI classification using ROC curve analysis of pregnant women during late pregnancy at Eastern Ethiopia, 2023

Table 8. Long description
The table compares nutritional status classification by MUAC and BMI among pregnant women during late pregnancy. It has five rows and six columns. The columns are labeled as MUAC classification, BMI classification, Underweight, Normal weight, Overweight, Obesity, and Total. The rows are labeled as Underweight, Normal weight, Overweight, Obesity, and Total. Row 1: Underweight, Underweight, 207, 73.67, 647, 37.86, 11, 2.69, 0, 0.00, 865, 34.57. Row 2: Normal weight, 60, 21.35, 688, 40.26, 27, 6.60, 0, 0.00, 775, 30.98. Row 3: Overweight, 14, 4.98, 356, 20.83, 335, 81.91, 9, 8.74, 714, 28.54. Row 4: Obesity, 0, 0.00, 18, 1.05, 36, 8.80, 94, 91.26, 148, 5.92. Row 5: Total, 281, 11.23, 1709, 68.31, 409, 16.35, 103, 4.12, 2502, 100.
MUAC, mid-upper arm circumference; ROC, receiver operating characteristic.
Percentages are column percentages based on BMI classification.
Discussion
This study aimed to validate MUAC as a reliable alternative to BMI for screening for maternal overweight and obesity during pregnancy. It found that the optimal MUAC cut-offs for identifying maternal overweight were 25·95 cm in early pregnancy and 27·05 cm in late pregnancy. Similarly, the best MUAC cut-offs to detect maternal obesity were 27·75 cm in early pregnancy and 28·85 cm in late pregnancy.
Our study demonstrated a positive linear relationship between BMI and MUAC measurements taken during early (r 0·69, P < 0·0001) and late pregnancy (r 0·72, P < 0·0001) among pregnant women in Eastern Ethiopia. This significant association between BMI and MUAC was also found in previous studies in different parts of the world(Reference Fakier, Petro and Fawcus19,Reference Miele, Souza and Calderon21,Reference Soren and Sahu28,Reference Okereke, Okeke and Anyaehie30,Reference Suresh, Jain and Kaul33,Reference Mishra, Bhatia and Nayak48,Reference Okereke, Anyaehie and Dim49) . These relationships and cut-off values vary by geographical region, with significant differences between developing and developed countries. A study in England and Ireland found that BMI is directly correlated with MUAC (r = 50·836)(Reference Cooley, Donnelly and Walsh50). A study in Odisha, India, also indicated that a significant association was found between maternal baseline BMI and MUAC (r 0·57, P < 0·001)(Reference Mishra, Bhatia and Nayak48). Another study in South Africa also showed that the MUAC correlates strongly (r 0·92) with BMI in pregnancy at the booking visit, up to a gestation of 30 weeks(Reference Fakier, Petro and Fawcus19). A study in Nigeria also indicated that MUAC has a strong positive correlation with maternal BMI(Reference Okereke, Anyaehie and Dim49).
Previous studies also reported a positive correlation between early-pregnancy BMI and MUAC across different gestational ages. A cohort study conducted in Brazil revealed a strong correlation between BMI and MUAC across three stages of pregnancy with correlation coefficients of 0·872 in mid-pregnancy (19–21 weeks), 0·870 in the early third trimester (27–29 weeks) and 0·831 in late pregnancy (37–39 weeks)(Reference Miele, Souza and Calderon21). Similarly, a prospective observational study in New Delhi also found a positive, statistically significant correlation between first-trimester BMI and first-trimester MUAC (r 0·51, P < 0·001), second-trimester MUAC (r 0·62, P < 0·001) and third-trimester MUAC (r 0·56, P < 0·001)(Reference Chhillar, Puri and Sinha25). Similarly, a recent Sudanese cross-sectional study reported a significant positive correlation between BMI and MUAC among women in both early (r 0·734) and late (r 0·703) pregnancy(Reference Salih, Omar and AlHabardi51). In addition, MUAC showed a significant correlation with BMI during both early pregnancy (r 0·774, P < 0·001) and late pregnancy (r 0·806, P < 0·001) among Rwandan pregnant women(Reference Ali, AlHabardi and Adam52). Since MUAC has crucial properties as a screening tool, including simplicity, acceptability, low cost, objectivity and independence from gestational age, it can be used at any gestational age of pregnancy(Reference Tang, Chung and Dong26). Hence, a simpler MUAC can be used to assess nutritional status and screen pregnant women at risk, rather than BMI, in resource-limited field settings where undeveloped preconception care and late initiation of ANC are common, and functional weighing scales and stadiometers are not available(Reference Fakier, Petro and Fawcus19,Reference Chhillar, Puri and Sinha25,Reference Mishra, Bhatia and Nayak48) .
This study also found the regression equations expressing the relationships between BMI and MUAC: BMI = 0·89 (MUAC) + 1·09 during early pregnancy and BMI = 0·94 (MUAC)- 1·69 during late pregnancy. This implied that for each 1 cm increase in MUAC during early pregnancy, initial BMI increased by 0·89 kg/m2 units. According to this equation, the estimated BMI for a woman with an initial MUAC of 26·95 cm (≈27 cm) is 25 kg/m2. Similarly, for each 1 cm increase in late-pregnancy MUAC, initial BMI increased by 0·94 kg/m2 units. A woman with a MUAC of 28·4 cm during late pregnancy is estimated to have a BMI value of 25 kg/m2. This mathematical relationship has also been reported in previous studies. A study in England and Ireland stated that estimates of BMI may be calculated from the simple equation BMI = MUAC ± 2 among pregnant women(Reference Cooley, Donnelly and Walsh50). A study in Odisha, India, also indicated that the correlation equation was found to be BMI = 0·413 (MUAC) + 16·92(Reference Mishra, Bhatia and Nayak48). Similarly, the linear regression analysis of the study in South Africa showed that, on average, for every 1 cm unit change of MUAC, BMI increases by 1·27 kg/m2 units(Reference Fakier, Petro and Fawcus19).
Our study aimed to determine optimal MUAC cut-off points to identify maternal overweight and obesity in early and late pregnancy. Currently, there is no global MUAC cut-off for detecting maternal overweight and obesity. Establishing a universal MUAC cut-off value for assessing the nutritional status of pregnant women is challenging due to variations across geographical regions and between developing and developed countries(Reference Soren and Sahu28). Consequently, it is difficult to recommend a single universally applicable MUAC cut-off that would be appropriately discriminatory in all settings(Reference Cashin and Oot31). Therefore, it is advised that countries and programmes conduct cost–benefit analyses to adopt context-specific MUAC cut-offs(Reference Cashin and Oot31,32) . However, determining the optimal MUAC cut-off for assessing the nutritional status of pregnant women is complex, as it involves trade-offs among resource availability for interventions, intervention effectiveness and anticipated improvements in pregnancy outcomes. Generally, it is recommended that the MUAC cut-off with the highest sensitivity at or above a set minimum specificity (e.g. 70 %) would be preferable(Reference Tang, Chung and Dong26).
In this regard, this study revealed that MUAC values of 25·95 cm (95 % CI of 25·92, 25·98 cm) and 27·05 cm (95 % CI 26·98, 27·12 cm) were the optimal cut points for detecting maternal overweight during early and late pregnancy, respectively. These MUAC cut points for maternal overweight showed higher sensitivity (85·16 % v. 92·58 %), specificity (94·77 % v. 80·50 %), PPV (80·74 % v. 54·99 %) and NPV (96·13 % v. 97·68 %). The stability of sensitivity and specificity within ±0·2 cm of the optimal cut points supports the use of rounded thresholds that balance clinical practicality with high classification accuracy. These findings suggest that small variations in MUAC measurement near the proposed cut points do not substantially alter diagnostic performance. Hence, MUAC values greater than 26 cm during early pregnancy and 27 cm during late pregnancy would be good cut-offs for identifying maternal overweight among pregnant women from a practical perspective. Previous studies recommended similar values. Reports from India also showed that the MUAC value was greater than 26 cm for overweight(53). A study in South Africa showed that the MUAC cut-off for overweight among pregnant women was 27·10 cm, with a sensitivity of 93·4 %(Reference Fakier, Petro and Fawcus19). A facility-based unmatched case–control study in Bahir Dar City showed that the MUAC value greater than 25 cm is categorised as overweight and obese, where authors highlight that MUAC measurements between 28 cm and 39 cm are more capable of predicting complications such as pre-eclampsia(Reference Endeshaw, Abebe and Worku54). On the other hand, a cohort study in Brazil recommended slightly higher values: overweight can be diagnosed if MUAC is between 28·11–30·15 cm at mid-pregnancy (19–21 weeks) and 29·46–30·25 cm at late pregnancy (37–39 weeks). This study recommended that the MUAC cut-off value of 28·11 is a good value for identifying overweight(Reference Miele, Souza and Calderon21).
The current study also showed that the optimal cut-off points for MUAC in identifying maternal obesity during early pregnancy were 27·75 cm (95 % CI 26·53, 28·97 cm) and, during late pregnancy, 28·85 cm (95 % CI 28·58, 29·12 cm). These cut points also showed higher sensitivity (79·61 % v. 91·26 %), higher specificity (99·04 % v. 97·75 %), moderate PPV (78·10 % v. 63·51 %) and very high NPV (99·12 % v. 99·62 %). From a clinical and practical perspective, MUAC values greater than 28 cm during early pregnancy and 29 cm during late pregnancy would be good cut-offs for identifying maternal obesity among pregnant women. A similar value was recommended by a cross-sectional study in Sudan which showed that 28·0 cm is the best MUAC cut-off point for detecting obesity in early pregnancy (YI = 0·61; sensitivity = 76·0 %, specificity = 86·0 %), with a good predictive value (Area Under the Receiver Operating Characteristic Curve (AUROCC) = 0·89) and 29·0 cm in late pregnancy (YI = 0·67; sensitivity = 80·0 %, specificity = 87·0 %), with a good predictive value (AUROCC = 0·90)(Reference Salih, Omar and AlHabardi51). A study in Ethiopia also stated that MUAC > 28·0 cm is the optimal cut-off point to identify overweight women of reproductive age(Reference Shifraw, Selling and Worku55). In contrast, a cross-sectional study from Rwanda reported different optimal MUAC thresholds for obesity, with a higher cut-off in early pregnancy (≥ 29·5 cm: YI = 0·73, sensitivity = 0·92, specificity = 0·80) and a lower cut-off in late pregnancy (≥ 27·5 cm; YI = 0·62, sensitivity = 0·92, specificity = 0·71), both demonstrating good discriminatory performance(Reference Ali, AlHabardi and Adam52).
On the other hand, slightly higher MUAC values were recommended by other studies. A study in India indicated that MUAC higher than 29·2 cm(Reference Babu, Das and Lobo18) and 30 cm(53) could serve as a suitable method for obesity screening in pregnancy in public facilities. A Brazilian study stated that obesity can be diagnosed if MUAC is > 30·15 cm at mid-pregnancy (19–21 weeks) and > 30·25 cm at late pregnancy (37–39 weeks) per gestational week(Reference Miele, Souza and Calderon21). Similarly, the results of a study in South Africa showed that the MUAC cut-off for obesity was 30·57, which, rounded off to 31 cm for practical reasons, had a higher sensitivity (90 %) and PVP (90·9 %)(Reference Fakier, Petro and Fawcus19). A study in Malaysia recommended that the MUAC value of > 31 cm is for obesity in pregnant women(Reference Ng, Badon and Dhivyalosini56). A cross-sectional study in Nigeria indicated that the MUAC values of 33 cm might be reliable cut-off points for diagnoses of obesity throughout pregnancy(Reference Okereke, Anyaehie and Dim49).
This study had some limitations. Although it was a multicentre study conducted in public hospitals in urban areas, women from rural areas may not have been adequately represented. This study included only women who initiated ANC during early pregnancy, whereas most pregnant women in low- and middle-income countries, including Ethiopia, typically begin ANC during late pregnancy. Consequently, the findings may not be fully representative of all pregnant women in Eastern Ethiopia. The early-pregnancy weight, height and MUAC were retrieved from maternal medical records, which may raise concerns about data quality, as these measurements were not taken for research purposes and did not follow the strict standardised procedures we use. Additionally, because different data collectors and health professionals measured weight, height and MUAC, there is a possibility of inter-observer bias and measurement errors in this study. Moreover, although BMI is widely used and considered as a gold standard anthropometric measurement in low- and middle-income countries, it does not directly measure body fat composition. More precise methods such as skinfold thickness or bioelectrical impedance were not feasible in this study setting. Moreover, the optimal cut-offs were derived and evaluated in the same dataset, which may lead to optimistic performance estimates. These findings are exploratory and require external validation.
Conclusion
The screening characteristics (sensitivity, specificity and accuracy) of MUAC for detecting maternal overweight and obesity during both early and late pregnancy were outstanding. This study recommended that MUAC values of 26 cm for maternal overweight and 28 cm for maternal obesity are good cut-off values. These findings support the potential utility of MUAC as a simple, feasible alternative to BMI for identifying maternal overweight and obesity, particularly in contexts where accurate measurement of height and weight is challenging. Broader validation across diverse populations could facilitate the integration of MUAC into routine antenatal screening programmes, strengthening early identification and management of maternal overweight/obesity. The Federal Ministry of Health and Regional Health Bureaus should advocate for and support further validation studies using a nationally representative sample on the use of MUAC as a surrogate marker for maternal overweight and obesity across all stages of pregnancy.
Supplementary material
For supplementary material/s referred to in this article, please visit https://doi.org/10.1017/S0007114526107880
Acknowledgements
The authors would like to thank Haramaya University for providing us with funds that cover data collection expenses. The authors would like to express our heartfelt appreciation to the data collectors, supervisors, pregnant women, hospital staff working at the obstetric unit and heads of hospitals for their willingness and unreserved contribution to this study.
This study was supported by Haramaya University (grant number of HURG_2022_02_04_45). The funding primarily supported data collection activities.
A. T.: Conceptualisation-Lead, Data curation-Equal, Formal analysis-Equal, Funding acquisition-Equal, Investigation-Equal, Methodology-Equal, Project administration-Equal, Resources-Equal, Software-Lead, Visualisation-Equal, Writing – original draft-Lead and Writing – review and editing-Equal; T. G.: Conceptualisation-Equal, Funding acquisition-Equal, Investigation-Equal, Methodology-Equal, Project administration-Lead, Resources-Equal, Supervision-Equal, Validation-Equal and Writing – review and editing-Equal; L. O.: Conceptualisation-Equal, Investigation-Equal, Methodology-Equal, Project administration-Equal, Resources-Equal, Supervision-Equal, Validation-Equal and Writing – review and editing-Equal; T. G.: Conceptualisation-Equal, Methodology-Equal, Project administration-Equal, Resources-Equal, Supervision-Equal, Validation-Equal and Writing – review and editing-Equal; N. A.: Conceptualisation-Equal, Data curation-Equal, Formal analysis-Equal, Investigation-Equal, Methodology-Equal, Project administration-Lead, Software-Equal, Supervision-Lead, Validation-Equal and Writing – review and editing-Equal. All the authors read and approved the final manuscript. All authors took responsibility for the accuracy of the analysis and the contents of the article.
The authors declare that they have no known competing financial interests or personal relationships that could have appeared to influence the work reported in this paper.


 Open access

