Introduction
Long-term care (LTC) homes in Ontario are publicly funded facilities that provide access to 24-hour nursing and personal care, primarily to older adults who are unable to live independently in their own homes. In other Canadian provinces, these facilities may be known as personal care homes, nursing facilities, LTC facilities, special care homes, or residential care facilities for the aged. In the extant literature, this type of care setting is most commonly known as a nursing home.
In this descriptive study, we examined the effect of profit status and chain affiliation on staffing levels in Ontario’s LTC homes. The motivation for investigating these relationships stems from past empirical research on the use of health human resources in this setting, and their purported associations to outcomes of care. Since Ontario has the highest percentage of publicly funded for-profit (FP) facilities in Canada (Blomqvist & Busby, Reference Blomqvist and Busby2012), these observations are of particular relevance.
Existing Literature
Many studies have found that not-for-profit (NFP) nursing homes provide more hours of care, and employ a greater proportion of registered nurses (RNs) than FP nursing homes (Banaszak-Holl & Hines, Reference Banaszak-Holl and Hines1996; Berta, Laporte, & Valdmanis, Reference Berta, Laporte and Valdmanis2005; Berta, Laporte, Zarnett, Valdmanis, & Anderson, Reference Berta, Laporte, Zarnett, Valdmanis and Anderson2006; Bravo, Charpentier, Dubois, De Wals, & Émond, Reference Bravo, Charpentier, Dubois, De Wals and Émond1998; Comondore et al., Reference Comondore, Devereaux, Zhou, Stone, Busse and Ravindran2009; Harrington, Olney, Carrillo, & Kang, Reference Harrington, Olney, Carrillo and Kang2012; Harrington, Woolhandler, Mullan, Carrillo, & Himmelstein, Reference Harrington, Woolhandler, Mullan, Carrillo and Himmelstein2001; McGregor et al., Reference McGregor, Cohen, McGrail, Broemeling, Adler and Schulzer2005, Reference McGregor, Tate, Ronald, McGrail, Cox and Berta2010). This work has garnered particular attention because nurse staffing is often considered a proxy for the quality of resident care (Bostick, Reference Bostick2004; Schnelle et al., Reference Schnelle, Simmons, Harrington, Cadogan, Garcia and Bates-Jensen2004). Residents in FP nursing homes have been shown to experience higher rates of hospitalization and mortality, as well as more frequent visits to emergency departments than residents in NFP homes (Comondore et al., Reference Comondore, Devereaux, Zhou, Stone, Busse and Ravindran2009; Hillmer, Wodchis, Gill, Anderson, & Rochon, Reference Hillmer, Wodchis, Gill, Anderson and Rochon2005; McGregor et al., Reference McGregor, Tate, McGrail, Ronald, Broemeling and Cohen2006; McGregor et al., Reference McGregor, Abu-Laban, Ronald, McGrail, Andrusiek and Baumbusch2014; Shapiro & Tate, Reference Shapiro and Tate1995; Tanuseputro et al., Reference Tanuseputro, Chalifoux, Bennett, Gruneir, Bronskill and Walker2015). In the only national study on staffing in Canadian nursing homes (Berta et al., Reference Berta, Laporte, Zarnett, Valdmanis and Anderson2006), Ontario was found to have provided the fewest hours of RN care per resident day. In particular, FP facilities in this province had lower staffing levels than NFP and government-owned (i.e., municipal) facilities (Berta et al., Reference Berta, Laporte and Valdmanis2005).
Of course, other organizational attributes – beyond FP and NFP status – may also influence staffing levels within nursing homes. One attribute that has received less attention in the Canadian LTC literature is chain affiliation. A rising number of nursing homes across Canada and the United States are operating as members of multi-facility chains (Banaszak-Holl, Berta, Bowman, Baum, & Mitchell, Reference Banaszak-Holl, Berta, Bowman, Baum and Mitchell2002; Baum, Reference Baum1999; Light, Reference Light1986). Between 1971 and 2011, the number of chain-owned LTC homes in Ontario has increased eightfold, from 7 per cent (Baum, Reference Baum1999) to 56 per cent (see Table 1) of all operating facilities. Baum (Reference Baum1999) argued that the expansion of chain operations in Ontario’s LTC sector could be attributed to policy changes, intensified regulation of providers in this sector, and the current funding structure in this province; all of which favoured larger-scale operations. LTC homes that are owned and operated by a chain can benefit from economies of scale, which is manifested in formalized sharing of information, standardization of operational procedures, and preferential pricing from bulk purchasing of care supplies (Baum, Reference Baum1999). In health care markets where profit margins and supply are restricted by government policies – as is the case for LTC in Ontario – these economic advantages are especially pertinent to the survival of private-sector operators.
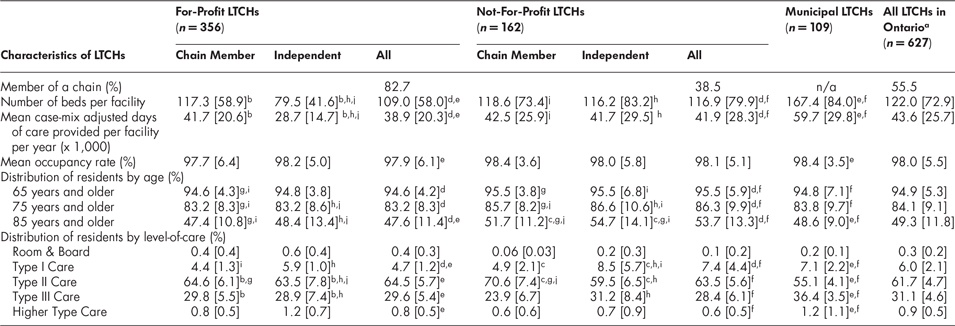
Profile of long-term care homes (LTCHs) in Ontario, by profit status and chain affiliation, 1996–1997 to 2010–2011

Standard deviations are presented in braces.
n/a = not applicable
a Includes facilities that were in operation for at least one year between 1996–1997 and 2010–2011 fiscal years
b Denotes a statistically significant difference between for-profit chain members and for-profit independent facilities at p < 0.05
c Denotes a statistically significant difference between not-for-profit chain members and not-for-profit independent facilities at p < 0.05
d Denotes a statistically significant difference between for-profit and not-for-profit facilities at p < 0.05
e Denotes a statistically significant difference between for-profit and public facilities at p < 0.05
f Denotes a statistically significant difference between not-for-profit and public facilities at p < 0.05
g Denotes a statistically significant difference between for-profit and not-for-profit chain members at p < 0.05
h Denotes a statistically significant difference between for-profit and not-for-profit independent facilities at p < 0.05
i Denotes a statistically significant difference between for-profit chain members and not-for-profit independent facilities at p < 0.05
j Denotes a statistically significant difference between not-for-profit chain members and for-profit independent facilities at p < 0.05
Existing research on the differences in staffing level and quality of care between chain-owned and independent nursing homes is not as extensive as studies on profit status, and the limited literature in this area does not offer a clear conclusion. Although standardization of good clinical practice across facilities in a chain may improve some resident outcomes, such as declines in the percentage of residents with pressure ulcers (Anderson, Weeks, Hobbs, & Webb, Reference Anderson, Weeks, Hobbs and Webb2003; Kamimura et al., Reference Kamimura, Banaszak-Holl, Berta, Baum, Weigelt and Mitchell2007), research from the United States has also found lower nurse staffing and a higher number of reported regulatory violations among chain operators (Harrington et al., Reference Harrington, Woolhandler, Mullan, Carrillo and Himmelstein2001, Reference Harrington, Olney, Carrillo and Kang2012; Kim, Harrington, & Greene, Reference Kim, Harrington and Greene2009a; Kim, Kovner, Harrington, Greene, & Mezey, Reference Kim, Kovner, Harrington, Greene and Mezey2009b; O’Neill, Harrington, Kitchener, & Saliba, Reference O’Neill, Harrington, Kitchener and Saliba2003).
Studies of nursing home chains in Canada are sparse and have presented equally equivocal conclusions. McGregor et al. (Reference McGregor, Tate, McGrail, Ronald, Broemeling and Cohen2006) examined the care outcomes among nursing home residents in British Columbia and did not find a difference in the hospitalization or mortality rates between FP sub-groups (i.e., between FP chain, FP multi-site, and FP single-site operators). However, statistically significant differences on the same set of measures were found between NFP sub-groups; specifically, single-site operators had higher hospitalization rates due to falls, pneumonia, and dehydration than NFP multi-site operators. In Ontario, while McGregor et al. (Reference McGregor, Cohen, Stocks-Rankin, Cox, Salomons and McGrail2011) observed a significantly higher rate of verified complaints from residents in FP chains compared to non-profit care providers, Keays, Wister, and Gutman (Reference Keays, Wister and Gutman2009) did not find a significant difference in the number of unmet operational standards by chain affiliation.
To our knowledge, staffing information by chain membership status has not been reported or published in Ontario.
Research Objective
Adding to the small collection of empirical research on staffing in the Canadian context (Berta et al., Reference Berta, Laporte and Valdmanis2005Footnote 1, Reference Berta, Laporte, Zarnett, Valdmanis and Anderson2006; McGregor et al., Reference McGregor, Cohen, McGrail, Broemeling, Adler and Schulzer2005Footnote 2), this article presents a longitudinal perspective of changes in staffing levels and the care needs of residents in Ontario’s LTC homes. Longitudinal data consists of repeated measures from the same service providers, allowing us to assess whether observed patterns, outcomes, or correlations are consistent over time. Taking advantage of data collected over 15 years (from years 1996–1997 to 2010–2011), we examined the effect of profit status and chain operation on staffing, controlling for variation in the residents’ case-mix. Results from this analysis can serve as the foundation for future empirical studies on health human resource planning, quality of care, and cost efficiencies in the LTC sector.
Method
Data
The Residential Care Facilities Survey (RCFS) is a longitudinal survey, annually administered by Statistics Canada to collect operational information from residential care providers across the country (Statistics Canada, 2012). Data collected through this survey may be used for program evaluation, policy development, budget planning, and research. The RCFS is the only data set with a national coverage of residential care facilities, and information on staffing within these settings.
Facilities included in our sample were RCFS respondents who have received funding from the Ontario Ministry of Health and Long-Term Care (MOHLTC) to provide nursing and personal care to their residents. This excludes other residential care providers who do not offer access to 24-hour nursing care, or who were not eligible to receive funding from the MOHLTC for providing residential care (e.g., rest homes, retirement homes, supportive housing, and apartments for seniors).
To ensure that our sample was representative of the facilities that were funded and regulated by the MOHLTC, we validated the RCFS data against information obtained from the MOHLTC (MOHLTC, 2011). Comparing the total number of beds reported in the RCFS to figures from the Ministry’s Health Data Branch,Footnote 3 our sample captured 90.9 per cent of FP, 96.4 per cent of NFP, and 99.8 per cent of municipal LTC beds that were in operation between 2007 and 2011. Unfortunately, we were unable to validate data collected prior to 2007 as this information was not available.
In total, 627 LTC homes were included in this analysis. All facilities in our sample were in operation and had completed the RCFS in at least one data collection period between the 1996–1997 and 2010–2011 fiscal years.
Definition of Variables
We examined three types of ownerships in this study. The RCFS (Statistics Canada, 2011) defines a proprietary or FP facility as any organization or corporation owned by a private entity operating for a profit. Private NFP homes are facilities owned and operated by a religious or charitable organization on a non-profit basis. Finally, municipal facilities are LTC homes that are owned and operated by any level of government (e.g., a city, county or municipal government, department of a provincial or territorial government, and/or federal department or agency). For our analysis, we have classified private NFP homes and municipal homes as distinct categories, which allowed us to compare the staffing levels between privately and publicly owned facilities operating on a non-profit basis.
Private FP and NFP homes were also characterized by their affiliation to a chain. Chain organizations are “collections of similar service [entities] … linked together by common ownership”, and where location is often the only difference between its members (Baum, Reference Baum1999). Regardless of the organization’s profit orientation, there seem to be advantages inherent to chain operations that have incentivized some facilities to adopt this structure. In our study, we defined chains as organizations with two or more LTC homes that shared the same business name and/or owner in a given data collection period. Facilities belonging to a chain were assigned a value of 1; independently operated homes were coded as 0. The smallest chain in our sample had two members, whereas the largest chain had 58 members in the 2010–2011 fiscal year.
The RCFS uses a level-of-care typology based on the hours and types of care that a resident requires (Statistics Canada, 2011). This scale was developed by Statistics Canada to ensure that consistent definitions were applied across jurisdictions and was used in this study as a measure of resident case-mix. Residents who receive room and board care in these facilities are expected to be relatively independent and require only minor supervision. Residents who receive Type I, Type II, and Type III Care require fewer than 90 minutes, between 1.5 to 2.5 hours, and greater than 2.5 hours of personal care per day, respectively. On top of personal support, Type II and Type III residents may also require access to 24-hour nursing and/or medical care. Residents who receive Higher Type Care (< 1% of residents in Ontario’s LTC homes) are those who have unstable health conditions and require substantially more nursing and/or medical care than do residents under Type III Care. These categories are described in detail in the survey’s official guide (Statistics Canada, 2011).
“Hours of care” was calculated by dividing the reported “total paid hours” for each type of staff by the number of resident care days provided in each data collection year. Total paid hours represents the sum of hours paid to all full-time, part-time, and casual employees who received salaries or wages from the facility. Staffing categories examined in our study include RNs, registered practical nurses (RPNs), health care aides (HCAs),Footnote 4 therapists,Footnote 5 and general services staff who provide administrative or operational support. Detailed descriptions of the types of direct care and support staff working in residential care facilities can be found in the survey’s official guide (Statistics Canada, 2011).
Access to RCFS data was approved by Statistics Canada, and our analysis was conducted at the Toronto Region Research Data Centre (Toronto RDC). This project received ethics approval from the University of Toronto Research Ethics Committee.
Analysis
Descriptive statistics presented in this article provide a summary of the differences in resident case-mix and staffing levels over 15 years (1996-1997 to 2010-2011). The results are presented at the provincial level, and then stratified by profit status and chain affiliation. To account for variations in staffing due to the heterogeneity in case-mix, we predicted adjusted values using a random effects estimator whereby the observed “hours of care” was regressed on the distribution of residents (by age, sex, and level of care), as well as the data collection year. Pairwise comparisons of means by profit status and chain affiliation were conducted using the Scheffe method.
Results
Table 1 presents a profile of the LTC homes operating in Ontario between 1996 and 2011 by profit status and chain affiliation. Approximately 95 per cent of individuals admitted to these facilities were over the age of 65, or required at least 1.5 hours of personal care per day (see Table 1).
There were more FP homes in Ontario than NFP and municipal homes combined. FP homes made up approximately 56.8 per cent of all operating facilities in the province, but they had fewer beds on average (p < 0.001). The majority of the FP operators (82.7%) were also members of a chain. In contrast, only 38.5 per cent of NFP homes belonged to a chain organization.
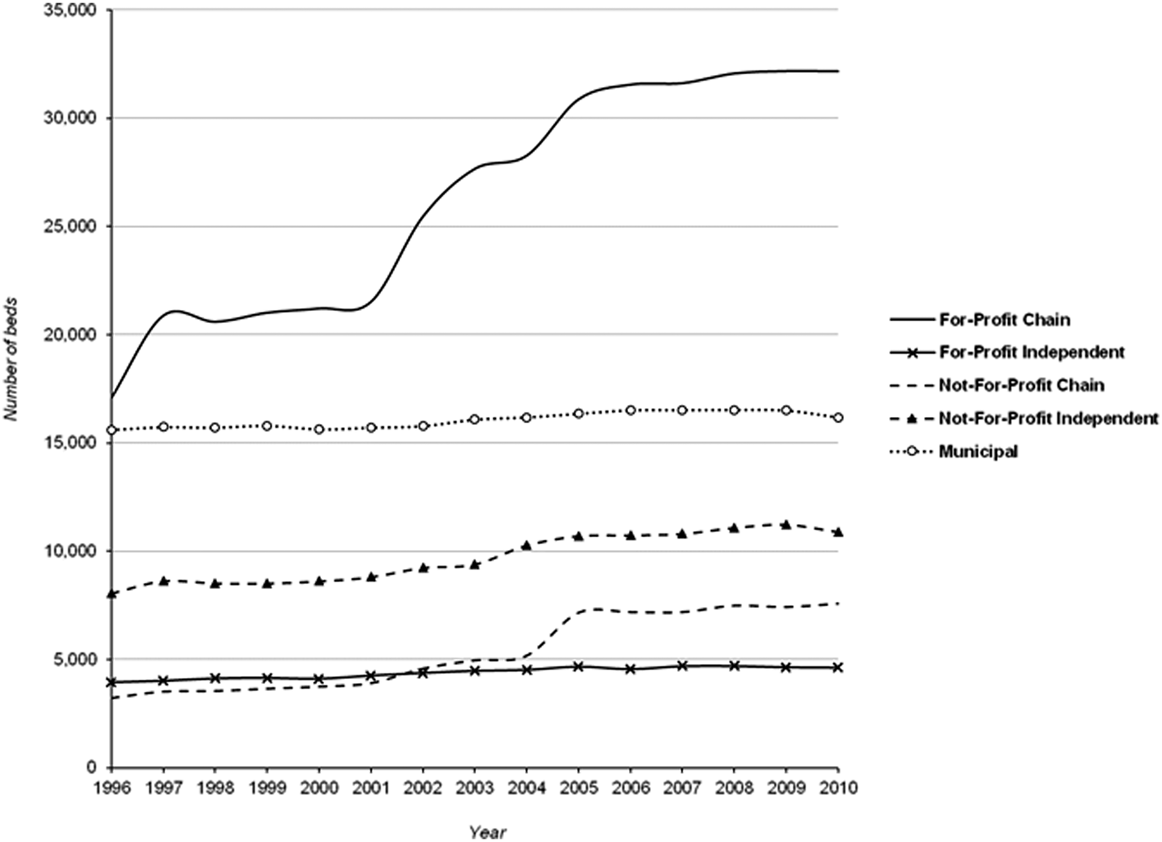
As shown in Figure 1, the number of LTC beds in this sector increased across all ownership types, with the largest increments observed in FP and NFP chain members. Since the 1996–1997 fiscal year, 15,080 LTC beds have been added to chain-owned FP homes, representing an increase of 88.3 per cent over 15 years. Across the same period, 4,354 beds were added to chain-owned NFP homes, corresponding to an increase of 134.6 per cent.
Distribution of LTC beds in Ontario, by profit status and chain affiliation
Resident Care Needs
Results from our pairwise comparison of means between the ownership categories suggest minor differences in the age distribution of the residents in these facilities and the level of care they required.
Distribution of Residents by Age
FP homes have a smaller percentage of residents over the age of 65 than do NFP (p < 0.001) and municipal homes (p = 0.670). Differences between chain members and independent homes operating under the same profit status were mostly non-significant. The only exception was in the proportion of residents over age 85 residing in NFP homes; independent NFP facilities had a higher percentage of residents who were over age 85 (by 3.0%) than did NFP chain members (p < 0.001).
Distribution of Residents by Level-of-Care
Less than 1 per cent of residents in Ontario’s LTC homes required only custodial care (i.e., room and board). The proportion of these residents did not differ significantly by profit status or chain affiliation (see Table 1).
Comparing the proportion of residents who received Type I Care across the ownership categories (see Table 1), FP homes had the smallest percentage of Type I Care residents (p < 0.001), and the difference between chain-owned and independent FP facilities was not statistically significant. NFP chain members had 3.6 per cent fewer residents at this care level than independent NFP homes (p = 0.001). In fact, independent NFP homes had a significantly larger percentage of residents requiring care at this level than other providers in this sector (p < 0.05). Overall, the number of Type I Care residents in Ontario’s LTC homes declined by 18.3 per cent between 1996 and 2011.
The majority of the residents (61.7%) required Type II Care (see Table 1). Compared to municipal LTC homes, Type II Care residents constituted a larger percentage of the care recipients in both FP and NFP facilities (p < 0.001). The proportions of Type II Care residents were also higher among chain-owned facilities, in comparison to their respective independent counterparts (p < 0.001). On the whole, the total number of residents requiring care at this level increased by 25.5 per cent between 1996 and 2011.
Approximately one third of residents in Ontario’s LTC homes received Type III Care (see Table 1), and the number of residents who required this level of care increased by 114 per cent between 1996 and 2011. Although municipal LTC homes had a smaller proportion of Type II Care residents within their facilities, they had a significantly greater proportion of Type III Care residents than did FP and NFP homes (p < 0.001).Footnote 6 There was also a higher percentage of Type III Care residents in chain-owned FP homes (p < 0.001), in comparison to their independent counterpart. The difference between chain-owned and independent NFP facilities was not statistically significant.
Between 1996 and 2011, the number of residents who required Higher Type Care increased by 164.3 per cent. However, LTC homes in Ontario have, on average, only one resident who required care at this level in any given year. The proportion of Higher Type Care residents in municipal LTC homes was significantly higher than both FP (p < 0.001) and NFP (p < 0.001) facilities. Differences by chain affiliation were not significant (see Table 1).
Staffing Levels
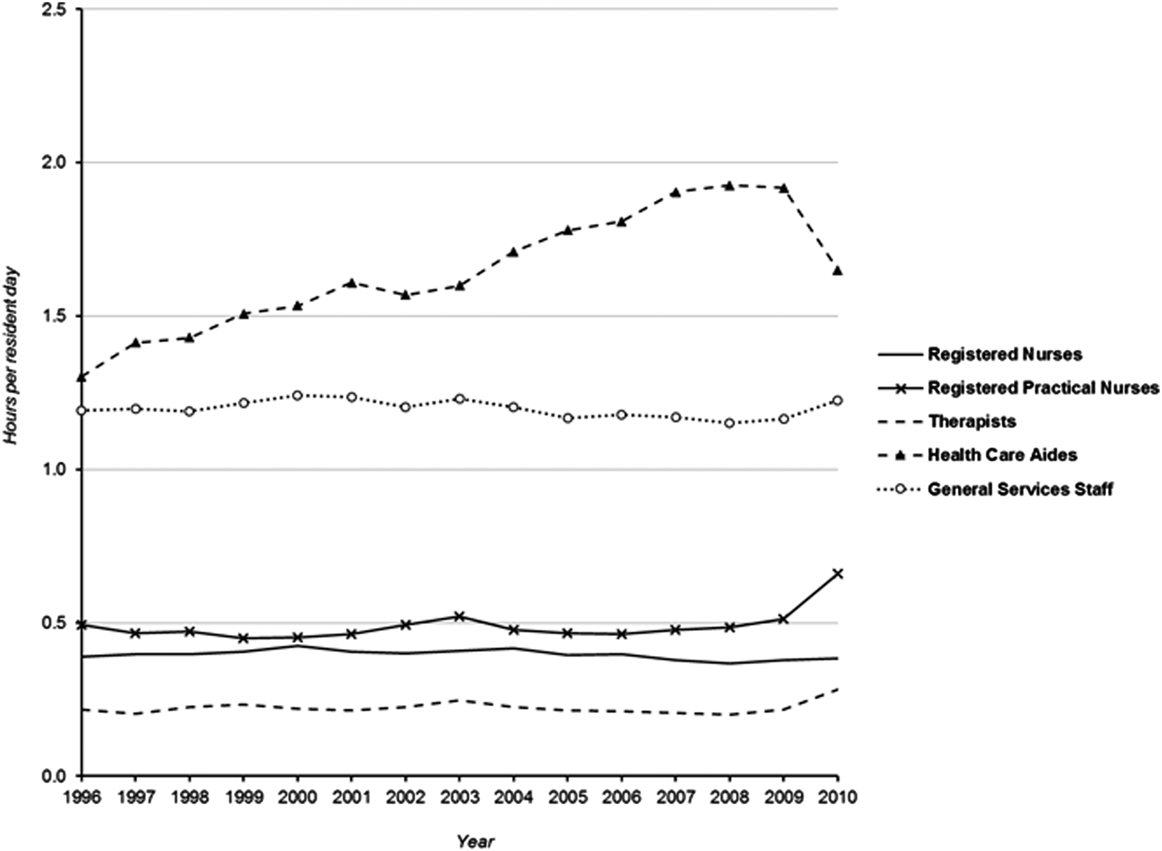
Table 2 presents the average staffing level by types of care personnel across the ownership categories. Figure 2 illustrates the annual change. Overall, the amount of care provided to residents in most staffing categories remained unchanged over our study period. The only notable difference was in the level of care provided by HCAs, which increased by 26.7 per cent.
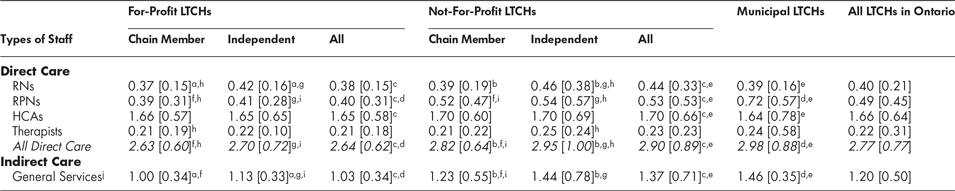
Staffing level in Ontario’s long-term care homes (LTCHs), mean hours of care per case-mix adjusted resident day, by profit status and chain affiliation, 1996–1997 to 2010–2011
Standard deviations are presented in parentheses. HCAs = health care aides; RNs = registered nurses; RPNs = registered practical nurses.
a Denotes a statistically significant difference between for-profit chain members and for-profit independent facilities at p < 0.05
b Denotes a statistically significant difference between not-for-profit chain members and not-for-profit independent facilities at p < 0.05
c Denotes a statistically significant difference between for-profit and not-for-profit facilities at p < 0.05
d Denotes a statistically significant difference between for-profit and public facilities at p < 0.05
e Denotes a statistically significant difference between not-for-profit and public facilities at p < 0.05
f Denotes a statistically significant difference between for-profit and not-for-profit chain members at p < 0.05
g Denotes a statistically significant difference between for-profit and not-for-profit independent facilities at p < 0.05
h Denotes a statistically significant difference between for-profit chain members and not-for-profit independent facilities at p < 0.05
i Denotes a statistically significant difference between not-for-profit chain members and for-profit independent facilities at p < 0.05
j Includes personnel involved in administration, housekeeping, laundry, maintenance, facility operation, facility security, etc.
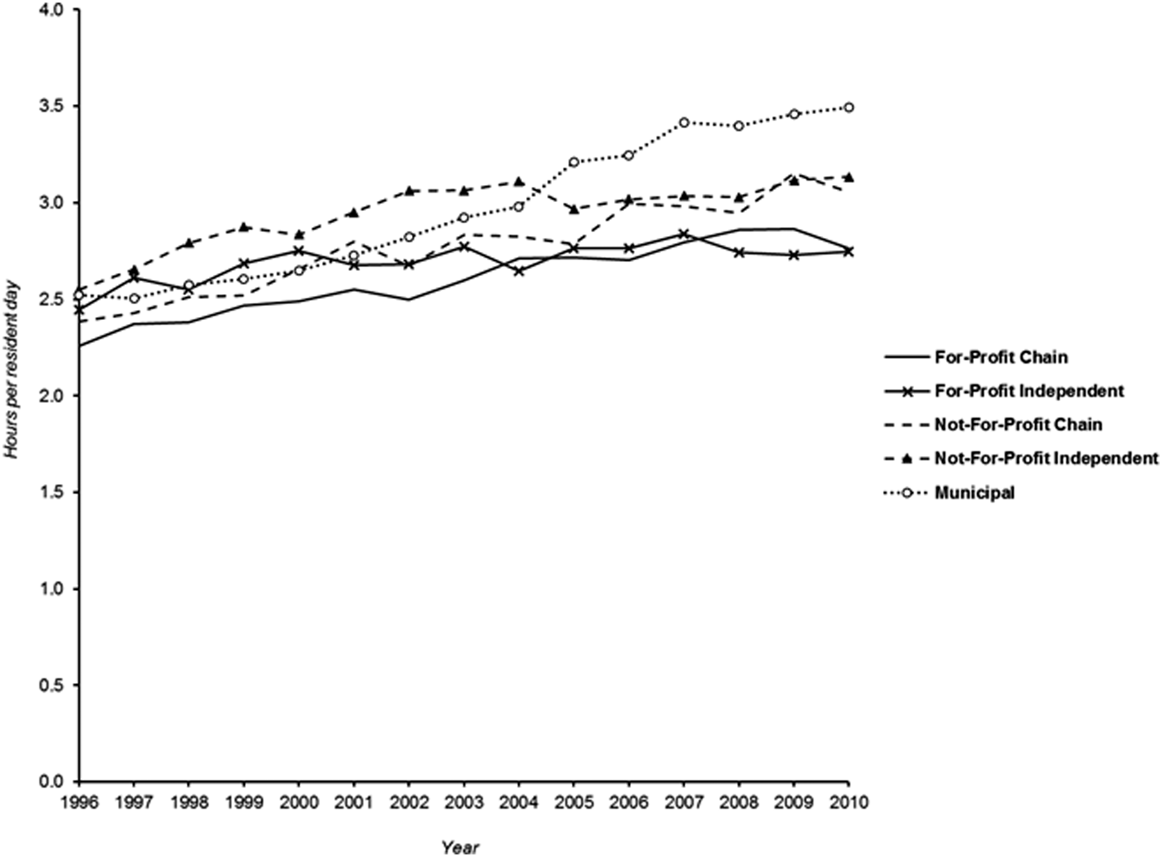
Hours of care per case-mix adjusted resident day, by types of staff
Combining the total hours of direct care provided by RNs, RPNs, HCAs, and therapists, we determined that residents in municipal facilities received 0.08 hours or 4.9 minutes more care per day than residents in NFP homes (p = 0.008). Compared to FP homes, residents in municipal facilities received an additional 0.34 hours or 20.5 minutes in direct care per day (p < 0.001). FP facilities – irrespective of chain affiliation – provided fewer hours of direct care than NFP facilities (p < 0.001).
FP chain members had the lowest staffing level in Ontario’s LTC sector, at 2.63 hours of direct care per resident, per day. This was not significantly different from independently operated FP homes, likely due to the convergence in staffing levels among facilities operating under the same profit status over time (see Figure 3). Although direct care staffing in independent NFP homes was significantly higher than in NFP chain members (p = 0.008), staffing levels between these facilities have also converged over time.
Hours of direct care per case-mix adjusted resident day, by profit status and chain affiliation
Registered Nurses
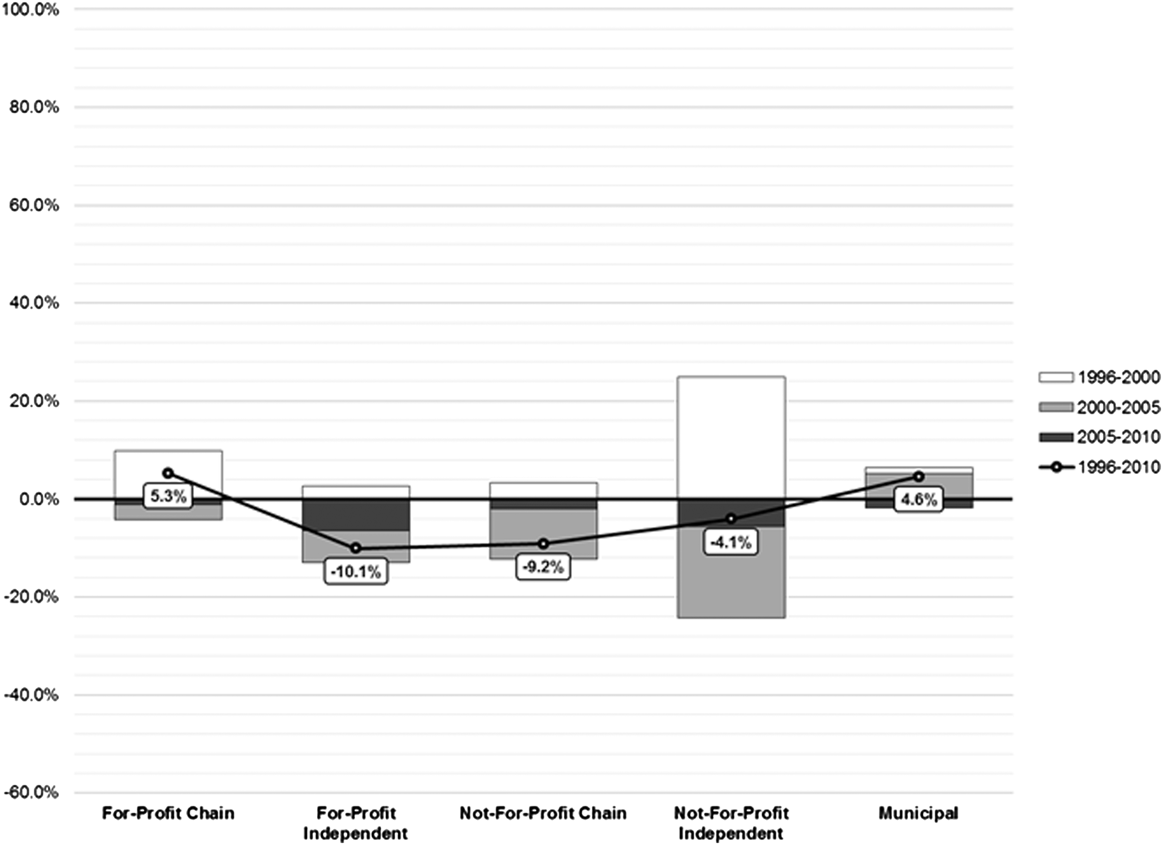
Inequalities in RN staffing levels across ownership categories were minimal. RNs in Ontario’s LTC homes provided approximately 0.40 hours or 23.8 minutes of care per resident day (see Table 2). FP chain members had the lowest RN staffing level among all operators, at 0.37 hours or 22.2 minutes per resident day. This was followed by NFP chain members and municipal homes, at 0.39 hours or 23.4 minutes per resident day each. Independent NFP homes had significantly higher RN staffing levels than other types of operators, at 0.46 hours or 27.6 minutes per resident day (p < 0.001). This is approximately equivalent to five additional minutes of RN care per resident day, in comparison to FP chains.
As shown in Figure 4, the hours of care provided by RNs in municipal homes and among FP chain members have increased by approximately 5 per cent (or 1.2 minutes per resident day) over our study period. Among other providers, RN staffing in Ontario’s LTC sector has declined in recent years. The largest decrements were observed among independently owned FP and NFP homes, by 2.6 and 1.5 minutes per resident day, respectively.
Change in hours of care by registered nurses per case-mix adjusted resident day, by profit status and chain affiliation
Registered Practical Nurses
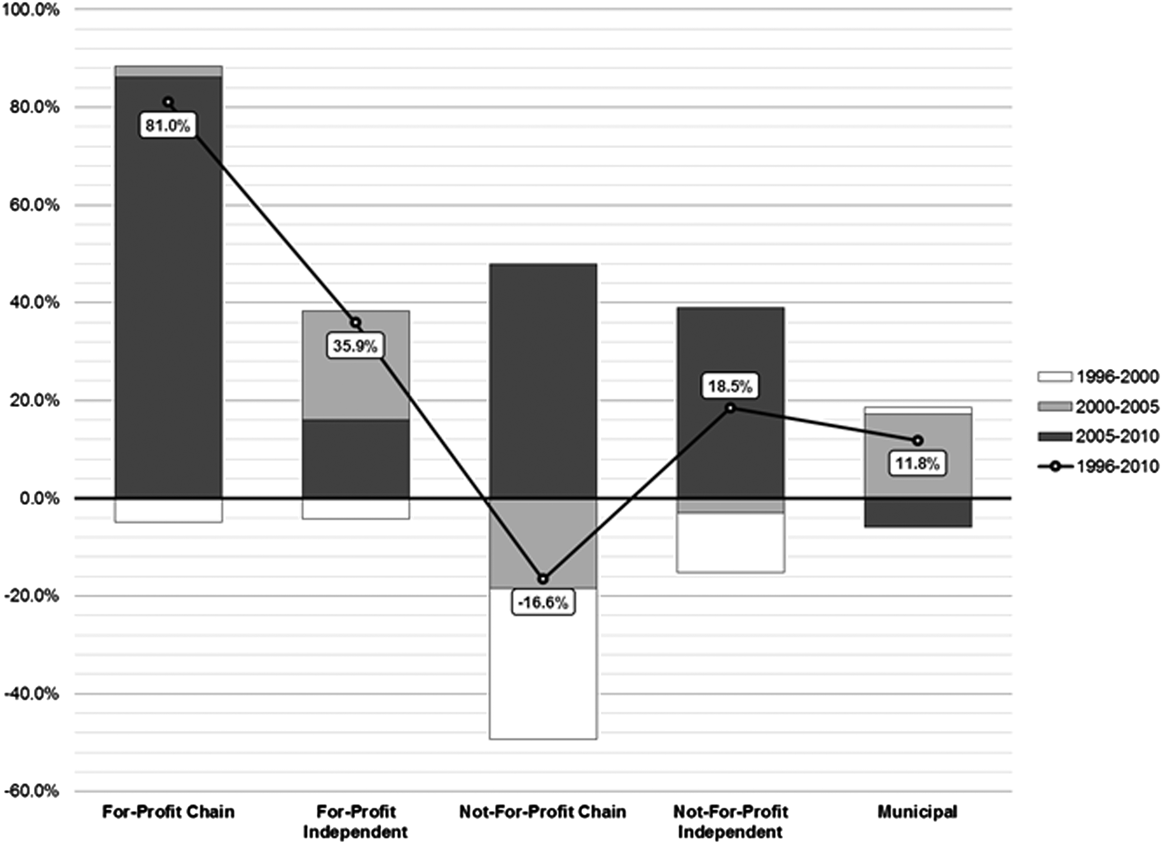
RPN staffing levels between the LTC homes demonstrated a greater divergence. Hours of care provided by RPNs was the highest among municipal LTC homes, at 0.72 hours or 43.2 minutes per resident day (p < 0.001). This was followed by NFP homes, at 0.53 hours or 31.9 minutes per resident day (see Table 2). Similar to RN staffing levels, FP chain members provided significantly fewer hours of RPN care than NFP and municipal LTC homes, at 0.39 hours or 23.4 minutes per resident day (p < 0.001). RPN staffing levels between chain-owned and independent homes operating under the same profit status did not differ significantly.
As shown in Figure 5, FP chain members experienced the greatest growth in RPN staffing over the 15-year period (by 81.0%, or 18.3 minutes per resident day). Despite this increase, the RPN staffing level in FP chains was still lower than other types of providers. Similarly, while RPN staffing rose by 35.9 per cent among independent FP homes, the level of care provided in these facilities remained lower than levels observed in NFP and municipal homes.
Change in hours of care by registered practical nurses per case-mix adjusted resident day, by profit status and chain affiliation
The level of RPN care declined by 16.6 per cent or 7.3 minutes per resident day among NFP chain members over the study period. In contrast, we observed an 18.5 per cent increase (equivalent to 6.1 minutes per resident day) in independent NFP homes.
Although the RPN staffing level in municipal LTC homes has also expanded over the 15-year interval, it has been gradually declining since 2003. Between 2003 and 2010, the average RPN staffing level among these providers dropped from 0.80 to 0.73 hours per resident day; this represents an overall reduction of 4.3 minutes per resident day in these facilities.
Health Care Aides
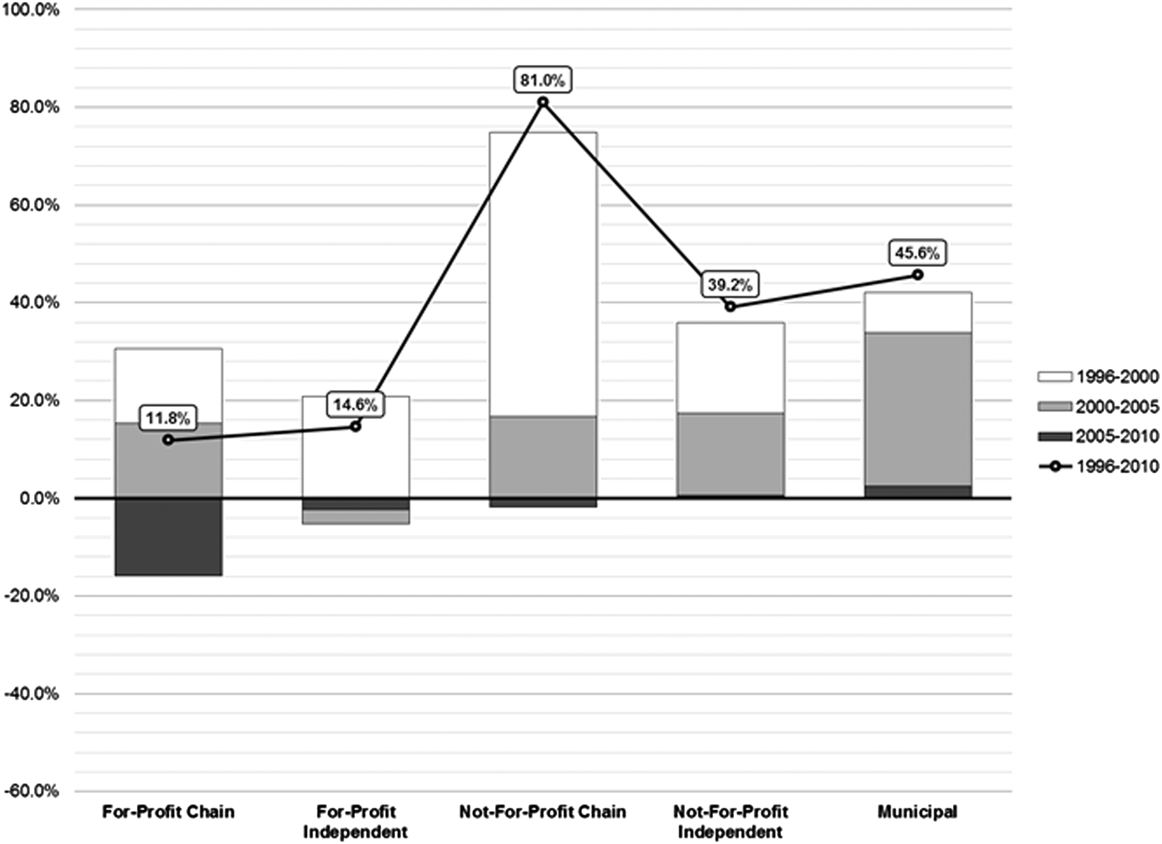
Across the province, HCAs provided an average of 1.66 hours of care per resident, per day. NFP homes had the highest HCA staffing in Ontario’s LTC sector; HCA staffing level in these facilities were, on average, 2.8 minutes higher than FP homes (p = 0.034) and 3.8 minutes higher than municipal homes (p = 0.016). However, the difference in the level of care provided by HCAs working in FP and municipal homes was not statistically significant. Differences between chain members and independently owned facilities operating under the same profit status were also not statistically significant.
Overall, HCA staffing level has increased in Ontario’s LTC sector (Figure 2). NFP chain members experienced the greatest growth in HCA staffing – from 0.99 hours per resident day in 1996 to 1.79 hours in 2010 (see Figure 6). This was followed by municipal LTC homes, which increased by 45.6 per cent, from 1.28 to 1.87 hours. Changes in HCA staffing in FP homes were less than 15 per cent.
Change in hours of care by health care aides per case-mix adjusted resident day, by profit status and chain affiliation
Therapists
Hours of care provided by therapists varied minimally between providers in Ontario’s LTC sector. The only statistically significant difference (p = 0.021) was between FP chain members and independently owned NFP homes; independent NFP homes provided 0.04 hours or 2.1 minutes of more therapeutic care per resident day than chain-owned FP homes. The provincial average was 0.22 hours or 13.4 minutes per resident day.
General Services Staff
Municipal LTC homes had the highest level of administrative and operational support in this sector. The level of support provided by general services staff in municipal LTC homes, which included RNs in administrative roles, was 1.46 hours per resident day (p < 0.001). Chain-owned FP and NFP facilities used, on average, four to eight fewer minutes of supportive services than their independent counterparts (p < 0.001).
Discussion
The results presented in this article raise important questions pertaining to how LTC is funded in Ontario and our capacity to meet the needs of those who receive care in this setting in the near future.
Summary of Findings
First, in light of our aging population, it was not surprising to have observed an increase in the level of care required by residents in Ontario’s LTC homes over time. However, the intensification of care needs may also be an artefact of the Aging at Home Strategy introduced in Ontario in 2007. The Aging at Home Strategy was an initiative launched by the McGuinty government to promote independent living among older Ontarians with less complex care needs, through increased investment in a wider range of publicly funded home and community services (Government of Ontario, 2013). Although this initiative has ensured that only the most frail are admitted into LTC homes, there has been no formal assessment of whether the direct care staff within these facilities were prepared, or sufficiently equipped, for these changes. Hence, as the needs of those who are cared for in these settings become more complex (Canadian Institute for Health Information [CIHI], 2011; CIHI, 2014), it is imperative that policy makers and researchers engage in ongoing evaluations of the adequacy of staffing levels in Ontario’s LTC homes.
Second, as the population ages, we expect residents in LTC homes to require more nursing care than before. However, changes in RN staffing levels were marginal despite the rising proportion of residents with greater care needs. In contrast, care provided by HCAs – also known as personal support workers (PSWs) in Ontario – experienced tremendous growth over the study period. This trend suggests that operators of LTC homes in Ontario were responding to the intensified care needs with augmented HCA support within their facilities. This observation is in line with findings from other Canadian studies, which have shown a rise in the number of care tasks delegated to health care support workers in LTC sectors across the country (Berta, Laporte, Deber, Baumann, & Gamble, Reference Berta, Laporte, Deber, Baumann and Gamble2013; Zeytinoglu, Denton, Brookman, & Plenderleith, Reference Zeytinoglu, Denton, Brookman and Plenderleith2014). Although HCAs working in this setting are better trained, and may be more prepared to meet the care needs of nursing home residents than before (Berta et al., Reference Berta, Laporte, Deber, Baumann and Gamble2013; Zeytinoglu et al., Reference Zeytinoglu, Denton, Brookman and Plenderleith2014), the impact of task shifting on the care outcomes of residents in these facilities is yet to be determined.
The lack of growth in RN care may be a reflection of the LTC homes’ predisposition to operate at the minimum level required by legislation, in the interest of curtailing operating costs. Studies from the United States offer some evidence of labour substitution in nursing homes, whereby more costly care personnel may be replaced by less expensive labour in order to generate the same volume of care within constrained budgets (Bowblis & Hyer, Reference Bowblis and Hyer2013; Chen & Grabowski, Reference Chen and Grabowski2015). A recent study by Hsu, Berta, Coyte, Rohit Dass, & Laporte (Reference Hsu, Berta, Coyte, Rohit Dass and Laporte2015) also offers some indication to labour substitution (between RPNs and HCAs) in Ontario’s LTC sector. Alternatively, operators may be restricted in their capacity to improve staffing levels, given recent declines in the number of nurses entering the LTC sector in Ontario (Alameddine et al., Reference Alameddine, Laporte, Baumann, O’Brien-Pallas, Croxford and Mildon2006). In all likelihood, both factors may have contributed to the lack of growth in RN care in this sector, and have some implications for the LTC homes’ capacity to increase RN care in this setting in the future.
Since 2007, there has been an observed increase in RPN care across the province. This trend may be a result of the Ontario government’s commitment to create new RPN positions in the LTC sector, specifically to address the rising demand for health care among older Ontarians (Government of Ontario, 2007). Despite the province-wide investment in RPN staffing, the uptake appears to be unevenly distributed across the ownership categories; residents in municipal facilities received nearly twice the amount of RPN care compared to residents in FP facilities. Moreover, the variation in RPN staffing levels across ownership categories have a strong influence over the observed differences in direct care staffing levels in this sector – as RN, HCA, and therapist staffing levels were similar among facilities operating under different ownerships.
In theory, profit status should not have a significant effect on staffing levels, once resident characteristics have been accounted for. Nursing and personal care provided in Ontario’s LTC homes are funded through case-mix adjusted per diem payments from the MOHLTC. Over the timeframe analysed in this study, the Ministry applied the Alberta Resident Classification System (ARCS) for categorizing residents into various dependency groups. Based on the average acuity within the facility, adjustments are made to the base per diem rate set by the Ministry. This process ensures that resources are allocated equitably and match the needs of the residents. However, as shown by the results of our study, variations in staffing by profit status continued to exist. This was a consistent finding across all staffing categories. Given the same per diem funding, municipal LTC homes were able to provide the highest volume of direct care in Ontario’s LTC sector, and homes that operated on a non-profit basis (i.e., by private NFP and municipal LTC homes) provided more care to their residents than FP facilities. Furthermore, we found that staffing levels also varied significantly by chain affiliation.
Our analysis revealed statistically significant differences in nurse staffing levels between chain-owned and independent LTC homes in Ontario. Similar to chain-owned nursing homes in the United States (Harrington et al., Reference Harrington, Olney, Carrillo and Kang2012), FP chain members in Ontario provided fewer hours of RN and RPN care than the provincial average. In addition, we also found lower RN and RPN staffing levels among chain-owned NFP homes, compared to independently owned NFP homes. On average, residents in municipal LTC homes received 20 minutes more direct care per day than those residing in chain-owned FP homes. Given that one of the advantages of chain operation is standardization of administrative processes, it was not surprising that chain-owned LTC homes used fewer hours of support services per resident day than their independent counterparts.
Policy Implications
Studies conducted in the United States have shown strong associations between higher direct care staffing levels and better health outcomes among nursing home residents (Bostick, Reference Bostick2004; Castle, Reference Castle2008; Harrington, Zimmerman, Karon, Robinson, & Beutel, Reference Harrington, Zimmerman, Karon, Robinson and Beutel2000; Konetzka, Stearns, & Park, Reference Konetzka, Stearns and Park2008; Schnelle et al., Reference Schnelle, Simmons, Harrington, Cadogan, Garcia and Bates-Jensen2004). Facilities with inadequate staffing are often unable to meet even the basic care needs of residents, such as providing at least one bath a week, sufficient changes of incontinent products, and regular assistance with mobility or other activities (Smith, Reference Smith2004). Prior research indicates that assisting a resident with toileting takes on average 8 minutes to complete (Schnelle, Sowell, Traughber, & Hu, Reference Schnelle, Sowell, Traughber and Hu1988), and feeding takes between 35 to 40 minutes per resident each meal (Simmons & Schnelle, Reference Simmons and Schnelle2006). Medication administration by RNs required approximately 62 minutes per 20 residents (Thomson et al., Reference Thomson, Gruneir, Lee, Baril, Field and Gurwitz2009). Therefore, we suspect the additional care provided in municipal homes may be associated with better health outcomes and quality of life among its residents, although we were unable to formally investigate this relationship using the RCFS data.
The findings presented in this article raise interesting questions about the roles of each type of staff within the LTC homes, and the dynamic between them. It is possible that, in the absence of regulated staffing standards (for RPNs and HCAs), facility operators may choose a less costly mix. Although the results presented here cannot directly speak to the impact of lower staffing levels on health outcomes of residents in Ontario’s LTC homes, or affirm that lower staffing levels were driven by the profit imperative of some operators, this study highlights the importance of examining chain affiliation in addition to profit status in the Canadian context. Moreover, to ensure that high-quality care is actually provided in this setting, there would need to be greater oversight of the outcomes of care and less focus on the isolated productivity of one or two types of care staff.
Limitations
Like other self-reported surveys, the RCFS is susceptible to response bias. However, validation of financial information reported in the RCFS against public accounts suggests that the information is consistent across sources (Hicks, Fortin, & Button, Reference Hicks, Fortin and Button2002). Second, the category of “other direct care” staff in the RCFS may include hours paid to nursing aides, health care aides, dieticians, counsellors, orderlies, social workers, graduate nurses, and chaplains. Since PSWs constitute the largest group of care personnel staffed in Ontario’s LTC homes (Armstrong & Daly, Reference Armstrong and Daly2004; Sharkey, Reference Sharkey2008), we believe the conclusion presented here is a reasonable representation of changes in this workforce. Finally, the administrative structure of the RCFS limited our ability to examine the relationship between staffing levels and health outcomes among residents in Ontario’s LTC homes. This shortcoming can be addressed in the future, through linkages of staffing and health administrative data. Unfortunately, with the termination of the RCFS in 2012 (Statistics Canada, 2012), the opportunities to explore these relationships may be limited.
Conclusion
Results presented in this article expand our understanding of the impact that organizational structure has on staffing in Ontario’s LTC homes. We observed significant differences in staffing levels and mix across FP, NFP, and municipal homes, and by chain ownership. Residents in municipal homes received, on average, 20 minutes more of direct care per day, compared to those residing in FP chain homes. Moreover, municipal operators were able to achieve this by providing more hours of RPN care than other types of operators, controlling for variation in the care needs of the residents in these facilities. Results presented in this article point to the need for a better understanding of care delivery models, and of how more effective staffing mix is achieved among some operators (e.g., municipal homes). Furthermore, Ontario is not the only jurisdiction that has witnessed a growing presence of chain organizations in its LTC sector. Our findings also recommend future research on the process by which resources and knowledge are transferred between component facilities within a chain, and examination of the impact of chain operation on other measures of quality of care.