


Introduction
Mesophotic coral ecosystems (MCEs) are zooxanthellate coral reefs widely considered to occur from between 30–40 m to at least 150 m depth (Puglise et al., Reference Puglise, Hinderstein, Marr, Dowgiallo and Martinez2009; Kahng et al., Reference Kahng, Copus and Wagner2014; Baker et al., Reference Baker, Puglise and Harris2016b). Deeper reefs are typically darker, colder and further offshore (Lesser et al., Reference Lesser, Slattery and Leichter2009). Recently, MCEs in the Caribbean have been recognized as their own distinct biological assemblage, characterized by the absence of shallow-specialist taxa and the presence of depth-generalists (Semmler et al., Reference Semmler, Hoot and Reaka2016; Laverick et al., Reference Laverick, Andradi-Brown and Rogers2017). The upper and lower boundaries of MCEs may therefore be considered variable, with distributions likely underpinned by physiological responses to the environment.
Photosynthetic scleractinian corals derive a significant portion of their energy from sunlight (Hatcher, Reference Hatcher1988). However, as depth increases, photosynthetically active radiation (PAR) declines (Sathyendranath & Platt, Reference Sathyendranath and Platt1988). The depth-generalist profile typical of mesophotic Scleractinia in the Caribbean (Semmler et al., Reference Semmler, Hoot and Reaka2016; Laverick et al., Reference Laverick, Andradi-Brown and Rogers2017) therefore poses a significant physiological challenge. Photosynthetic corals may increase their photosynthetic efficiency to accommodate changing light profiles (Anthony & Hoegh-Guldberg, Reference Anthony and Hoegh-Guldberg2003; Hennige et al., Reference Hennige, Smith, Perkins, Consalvey, Paterson and Suggett2008). This can be achieved through symbiont switching (Bongaerts et al., Reference Bongaerts, Carmichael, Hay, Tonk, Frade and Hoegh-Guldberg2015), increased symbiont densities (Bongaerts et al., Reference Bongaerts, Riginos, Hay, van Oppen, Hoegh-Guldberg and Dove2011) or pigment concentrations (Cohen & Dubinsky, Reference Cohen and Dubinsky2015; Borell et al., Reference Borell, Pettay, Steinke, Warner and Fine2016), changing growth form (Graus & MacIntyre, Reference Graus and MacIntyre1982), or even by modifying the reflective properties of the coral skeleton (Enríquez et al., Reference Enríquez, Méndez, Hoegh-Guldberg and Iglesias-Prieto2017) with differences noted between shallow and mesophotic taxa (Kahng et al., Reference Kahng, Hochberg, Apprill, Wagner, Luck, Perez and Bidigare2012). Additionally, scleractinian corals sit on a spectrum of mixotrophy, with variable rates of heterotrophic feeding (Palardy et al., Reference Palardy, Grottoli and Matthews2005). Heterotrophic subsidy may be used as a strategy to survive coral bleaching events, when the energy contribution from photosynthesis declines (Grottoli et al., Reference Grottoli, Warner, Levas, Aschaffenburg, Schoepf, McGinley, Baumann and Matsui2014). Heterotrophic subsidy, therefore, has also been recognized as a possible mechanism permitting the depth-generalist distribution of mesophotic hard corals (Alamaru et al., Reference Alamaru, Loya, Brokovich, Yam and Shemesh2009; Lesser et al., Reference Lesser, Slattery, Stat, Ojimi, Gates and Grottoli2010; Crandall et al., Reference Crandall, Teece, Estes, Manfrino and Ciesla2016). A third conceivable physiological adaptation to low light levels is a reduced metabolic rate, and so energy requirement (Davies, Reference Davies1980). Though mass specific respiration rates at rest (basal metabolic rates) appear remarkably consistent across biology (Suarez et al., Reference Suarez, Darveau and Childress2004; Makarieva et al., Reference Makarieva, Gorshkov, Li, Chown, Reich and Gavrilov2008), energy could be saved by reduced investment in reproduction (Feldman et al., Reference Feldman, Shlesinger and Loya2017; Shlesinger et al., Reference Shlesinger, Grinblat, Rapuano, Amit and Loya2018) or growth.
Pulse Amplitude Modulated (PAM) fluorometry is an established method for studying photochemistry (Schreiber, Reference Schreiber, Papageorgiou and Govindjee2004) and can be used to calculate a variety of metrics, such as photosynthetic efficiency and capacity, light-related stress, and other features (Jassby & Platt, Reference Jassby and Platt1976; Juneau et al., Reference Juneau, Green and Harrison2005). Further, the ratios of heavy to light nitrogen isotopes in coral tissue can provide a measure of heterotrophic feeding (Peterson & Fry, Reference Peterson and Fry1987), providing environmental differences are accounted for (Heikoop et al., Reference Heikoop, Risk, Lazier, Edinger, Jompa, Limmon, Dunn, Browne and Schwarcz2000; Baker et al., Reference Baker, Jordán-Dahlgren, Maldonado and Harvell2010). Discrimination between carbon isotopes is partly dependent on photosynthetic activity in the absence of feeding (Alamaru et al., Reference Alamaru, Loya, Brokovich, Yam and Shemesh2009); the translocation of carbon from the zooxanthellae symbionts to the coral host may be affected by depth and produce an isotopic signature (Muscatine et al., Reference Muscatine, Porter and Kaplan1989). However, lipid content may also affect bulk δ13C measurements (Alamaru et al., Reference Alamaru, Loya, Brokovich, Yam and Shemesh2009).
Stable isotope analyses and PAM fluorometry of a number of mesophotic Scleractinia, including Agaricia lamarcki (Crandall et al., Reference Crandall, Teece, Estes, Manfrino and Ciesla2016) and Montastraea cavernosa (Lesser et al., Reference Lesser, Slattery, Stat, Ojimi, Gates and Grottoli2010, Reference Lesser, Mazel, Phinney, Yentsch and Mazell2014; Crandall et al., Reference Crandall, Teece, Estes, Manfrino and Ciesla2016) in the Caribbean, and Favia favus (Alamaru et al., Reference Alamaru, Loya, Brokovich, Yam and Shemesh2009) and Stylophora pistillata (Alamaru et al., Reference Alamaru, Loya, Brokovich, Yam and Shemesh2009; Einbinder et al., Reference Einbinder, Mass, Brokovich, Dubinksy, Erez and Tchernov2009; Brokovich et al., Reference Brokovich, Ayalon, Einbinder, Segev, Shaked, Genin, Kark and Kiflawi2010; Nir et al., Reference Nir, Gruber, Einbinder, Kark and Tchernov2011; Cohen & Dubinsky, Reference Cohen and Dubinsky2015; Einbinder et al., Reference Einbinder, Gruber, Salomon, Liran, Keren and Tchernov2016) in the Red Sea, have revealed between-species variation in the changing rate of heterotrophy and photosynthetic efficiency with depth. However, there has been little effort to investigate intra-species variation between sites with different abiotic conditions, such as light levels and slope.
The relationship between these factors and the cellular physiology of corals across depth gradients has also yet to be examined in detail. The intracellular ratio between the secondary metabolites dimethylsulphoxide and dimethylsulphoniopropionate (DMSO:DMSP) has been previously used as an early indicator for cellular oxidative ‘stress’ in the cordgrass Spartina alterniflora (Husband & Kiene, Reference Husband and Kiene2007; McFarlin & Alber, Reference McFarlin and Alber2013) because of their role in cellular antioxidant cascades (Sunda et al., Reference Sunda, Kieber, Kiene and Huntsman2002). Since corals (and associated symbionts) harbour significant quantities of DMSP (Raina et al., Reference Raina, Tapiolas, Foret, Lutz, Abrego, Ceh, Seneca, Clode, Bourne, Willis and Motti2013; Burdett et al., Reference Burdett, Carruthers, Donohue, Wicks, Hennige, Roberts and Kamenos2014), it may be hypothesized that the DMSO:DMSP ratio is also a useful oxidative stress indicator for these organisms. Elevated DMSP concentrations have been observed coinciding with a stressful light environment for S. pistillata in the Red Sea (Borell et al., Reference Borell, Pettay, Steinke, Warner and Fine2016).
Here, we consider the physiology of the mesophotic depth-generalist scleractinian A. lamarcki, one of the dominant mesophotic taxa at our Caribbean study sites. A. lamarcki is a brooding species, which has shown limited symbiont switching around the mesophotic-shallow reef boundary (Bongaerts et al., Reference Bongaerts, Carmichael, Hay, Tonk, Frade and Hoegh-Guldberg2015). We sampled two sites down a continuous depth gradient to assess the consistency of physiological patterns with depth. We use techniques which have already been used to assess physiological change across the shallow-mesophotic depth gradient (Alamaru et al., Reference Alamaru, Loya, Brokovich, Yam and Shemesh2009; Einbinder et al., Reference Einbinder, Mass, Brokovich, Dubinksy, Erez and Tchernov2009; Lesser et al., Reference Lesser, Slattery, Stat, Ojimi, Gates and Grottoli2010; Crandall et al., Reference Crandall, Teece, Estes, Manfrino and Ciesla2016); PAM fluorometry, oxygen flux, stable isotope analyses, and also investigate trends in intracellular DMSP:DMSO ratios.
Materials and methods
Research site
Utila is one of the Honduran Bay Islands on the southern end of the meso-American barrier reef. A quantitative benthic description exists to a maximum depth of 85 m (Laverick et al., Reference Laverick, Andradi-Brown and Rogers2017). Of the five sites described, two are considered here: ‘The Maze’ on the north shore (TMA, N 16.112, W-86.949, WGS84 format) and ‘Little Bight’ on the south shore (LB, 16.079, W-86.929). Generally, south shore reefs are slopes ending in sand at ~45 m depth. In contrast, north shore reefs are typically walls extending deeper than 100 m. Though we do not have light data, the sites are known to have differing maximum depth ranges for A. lamarcki and the transition depths from shallow to mesophotic communities are known to be deeper at TMA than LB (Laverick et al., Reference Laverick, Andradi-Brown and Rogers2017).
Collection
Coral fragments were collected (permit number: ICF-261-16) by scuba divers using mixed gas closed circuit rebreathers during July 2015. During collection dives, A. lamarcki colonies were identified as plating and encrusting agariciid colonies with white, star-shaped polyps (Humann & Deloach, Reference Humann and Deloach2013). Species identity was verified by the alternation of long and short septo-costae following examination under a microscope in the field (Veron et al., Reference Veron, Stafford-Smith, Turak and DeVantier2016).
Sampled depths were from 10 to 45 m at the site LB and 16 to 60 m at TMA. These depths reflect the shallowest and deepest observed colonies of A. lamarcki at each site. We are confident the whole depth range of A. lamarcki was sampled for the following reasons. The lower limit of LB coincides with a sandy plain, and concurrent ecological studies at TMA, which reported no Scleractinia deeper than 85 m with maximum dive depths of 100 m (Laverick et al., Reference Laverick, Andradi-Brown and Rogers2017), did not report deeper incidences of A. lamarcki than sampled here. Additionally, roaming divers reported no A. lamarcki deeper than 60 m. Sampled coral colonies were >40 cm in diameter, to minimize damage to newly recruited colonies, and 5+ m from their nearest sampled neighbour to minimize the sampling of clones. All colonies were sampled as they were found, so long as they satisfied these selection criteria, with up to 12 colonies per 10 m vertical depth band. Half the samples were collected by swimming with the reef on the divers' left side from the dive site mooring buoy, half with the reef on the right side.
To sample a suitable colony, a thumb sized fragment was excised using a chisel from the plate margin. This was placed in a labelled zip-lock bag and stowed in a PVC tube that was opaque to light. Fragments were kept in the dark prior to analysis to mitigate light-associated stress during the divers' ascent. Once stowed, the fractured margin of the colony was lined with pre-mixed Milliput modelling putty to prevent infection or fouling (Downs, Reference Downs2011). The samples were returned to a temperature-controlled field lab and placed within an opaque plastic aquarium filled with water from the fore-reef. The aquaria were heated to 28°C (= ambient in situ temperature), aerated, and covered in four layers of plastic tarp to allow dark acclimation of fragments. Samples were acclimated in the dark for 12 h prior to analysis for photosynthetic characteristics and dissolved oxygen consumption.
Water (LB N = 4, TMA N = 18) and sediment samples (LB N = 14, TMA N = 24) were collected from both sites at 5, 15, 25, 40, and also at 55 and 70 m at TMA. These samples provide an environmental isotope signature for context when interpreting the trends in coral values (Heikoop et al., Reference Heikoop, Risk, Lazier, Edinger, Jompa, Limmon, Dunn, Browne and Schwarcz2000; Baker et al., Reference Baker, Jordán-Dahlgren, Maldonado and Harvell2010). Sediment was collected in sediment traps deployed on the reef for 4 weeks before the contents were drained and desiccated. Water was collected by scuba divers and poisoned in the lab with 10 µl of mercuric chloride solution per 12 ml of water, and stored without headspace in exetainer vials (Labco Ltd).
Laboratory methods
Oxygen incubations
Coral fragments were removed from their aquarium, in the dark, and isolated in 450 ml plastic chambers. Chambers were filled with fresh, unfiltered, seawater from the fore-reef in the same container, at the same time of day. The chambers were left for an hour, deemed a suitable time for generating a detectable signal after pilot tests. The lab was kept in darkness during the incubations. Water samples were taken at the beginning and end of the incubation. The change in dissolved oxygen (DO2) content was quantified using the same Fibox oxygen optode sensor spot system calibrated with a two-point calibration according to the manufacturer's instructions (PreSens Precision Sensing GmbH). The probe was held steady until the reading plateaued before recording. The change in dissolved oxygen during the incubation (ΔDO2) was standardized to 10 g of coral tissue, measured when later removed from the fragment (details below), and to the hour.
PAM fluorometry
Immediately after the oxygen incubation, Rapid Light Curves (RLCs) were conducted on the submerged, polyp-bearing side of the coral fragment using PAR levels of 2, 3, 5, 8, 12, 19, 37, 64, 110 µmol m−2 s−1 set on a Diving-PAM (Heinz Walz GmbH). The fibre optic was positioned 5 mm away from the coral surface using the Surface Holder attachment during all RLCs. PAR levels for the RLCs were chosen based on a balance between avoiding rapid light saturation of mesophotic fragments, whilst still achieving a detectable response from shallow fragments.
For RLCs a steady state is not reached during each light step (Ralph & Gademann, Reference Ralph and Gademann2005), unlike traditional light curves. Therefore, results from RLCs yield information on the actual, rather than optimal, photosynthetic state as suggested by traditional light curves (Ralph & Gademann, Reference Ralph and Gademann2005). Additionally, comparing RLCs from different species or under different environmental conditions should be conducted with care, as the irradiance absorption of a photosynthetic organism may change, affecting electron transport rates (Saroussi & Beer, Reference Saroussi and Beer2007; Einbinder et al., Reference Einbinder, Gruber, Salomon, Liran, Keren and Tchernov2016). Comparisons between sites and/or depths may therefore be affected by changes in the coral's irradiance absorption, such as changes in coral optics (Chalker et al., Reference Chalker, Dunlap and Oliver1983; Anthony & Hoegh-Guldberg, Reference Anthony and Hoegh-Guldberg2003; Wangpraseurt et al., Reference Wangpraseurt, Lichtenberg, Jacques, Larkum and Kühl2019), and have been taken into account when interpreting the PAM fluorometry results. Our results represent an integrated photosynthetic and bio-optical response, providing relative comparisons of the same species between sites. Variations are likely to have arisen in response to a varied environmental regime, thereby enabling comparison between sites, albeit without the capacity to identify if any observed changes are as a result of photosynthetic or bio-optical characteristics.
Stable isotope analyses
All stable isotope samples were prepared as described below before shipping to the UK for analysis at the NERC Life Sciences Mass Spectrometry Facility in East Kilbride. In the field, following RLCs, coral fragments were patted dry and their mass recorded. Surface coral tissue was removed using a Waterpik filled with seawater (Johannes & Wiebe, Reference Johannes and Wiebe1970). The mass of the air-dried skeleton was later recorded to allow the mass of coral tissue to be determined (= original mass – mass of bare skeleton). Air-dried skeleton was ground into a powder using a pestle and mortar and sealed in micro-centrifuge tubes. Coral slurry was left to settle and then pipetted into micro-centrifuge tubes. The tubes were centrifuged at 14,000 rpm for 60 s and the supernatant removed. This was repeated three times, topping with more slurry between spins to maximize material recovery. The resulting material was left standing for 10 h, in an aluminium tray under a sheet of glass in direct sunlight, to allow desiccation before storing at −20°C. Upon return to the UK these samples, and sediments, were further dried at 50°C overnight. We were unable to separate symbiont and host tissue in the field, we therefore interpret our results at the level of the holobiont, as has been done in similar studies (Crandall et al., Reference Crandall, Teece, Estes, Manfrino and Ciesla2016). When host and symbiont have been analysed independently, the results tend to show a shift in mean values between the two fractions, but similar relationships with increasing depth (Alamaru et al., Reference Alamaru, Loya, Brokovich, Yam and Shemesh2009; Einbinder et al., Reference Einbinder, Mass, Brokovich, Dubinksy, Erez and Tchernov2009; Lesser et al., Reference Lesser, Slattery, Stat, Ojimi, Gates and Grottoli2010).
Sediments and tissue samples (δ15N, δ13C)
Samples were weighed (0.7 mg for organic tissues, 5 mg for sediment) into tin capsules and loaded into an Elementar (Hanau, Germany) Pyrocube elemental analyser (EA) run in NC mode. Samples were combusted and gases purified such that N2 (for δ15N) and CO2 (for δ13C) were admitted consecutively into a Thermo (Bremen, Germany) Delta XP isotope ratio mass spectrometer (IRMS). The protocol loosely follows simultaneous nitrogen, carbon and sulphur analysis (Fourel et al., Reference Fourel, Martineau, Seris and Lécuyer2014) with the following deviations: we did not run for sulphur and so did not use a SO2 trap; oxidation and reduction reactors were cooler at 950 and 600°C respectively; the oxidation reactor was centrally filled with CuO as a catalyst, succeeded by a plug of silver wool filtering Cl species. Three standards were used to correct for linearity and drift of a range of δ15N and δ13C (Werner & Brand, Reference Werner and Brand2001; Newton, Reference Newton, Beauchemin and Matthews2010): a gelatine solution (GEL), a 13C-enriched alanine/gelatine solution (ALAGEL), and a 15N-enriched glycine/gelatine solution (GLYGEL). All standard solutions were dispensed into tin capsules and oven dried at 70°C prior to analysis. C and N abundance, and an independent evaluation of isotope ratio, was provided by four USGS40 standards (Qi et al., Reference Qi, Coplen, Geilmann, Brand and Böhlke2003). Measurement error of all four reference materials can be found in the supplementary information (Supplementary 1).
Dissolved inorganic carbon (DIC, δ13C)
Two drops of 103% phosphoric acid were added to exetainers (Labco Ltd), which were then flushed with helium. 1 ml of each water sample was added to the exetainer via a syringe through the septum. The phosphoric acid liberated gaseous CO2 from the sample into the headspace of the exetainer. Standards were treated differently as these were solid sodium bicarbonate and calcium carbonate powders (Waldron et al., Reference Waldron, Marian Scott, Vihermaa and Newton2014). Standards were loaded into dry exetainers with 1 ml of dilute phosphoric acid, ensuring the H3PO4 concentration was the same as for the samples. For both standards and samples, the headspace CO2 was dried in a Gas Bench (Thermo, Bremen, Germany) and the δ13C measured on a Thermo (Bremen, Germany) Delta V IRMS (Torres et al., Reference Torres, Mix and Rugh2005; Yang & Jiang, Reference Yang and Jiang2012).
Skeletal carbonates (δ13C)
δ13C of skeletal carbonates were analysed on an ‘Analytical Precision’ sampler/mass spectrometer (de Groot, Reference de Groot2008). 1 mg samples of each powdered coral skeleton were sealed in vacutainers and flushed with helium. Phosphoric acid was injected through the septum in excess by the autosampler. The reaction was left at 70°C for 20 min to liberate CO2 into the headspace. The resulting gas was analysed by the instrument's IRMS.
Dimethylated sulphur analyses
Approximately 1 mg of centrifuged tissue was diluted to 5 ml volume with MilliQ 18Ω water with 1 ml 10 M NaOH and stored in 20 ml chromatography vials (Fisher Scientific) sealed with Pharma-Fix septa (Fisher Scientific), to hydrolyse DMSP into DMS. Samples were stored in the dark and transported back to the University of St Andrews for analysis. The sample headspace was analysed by direct injection using an SRI-8610C gas chromatograph (GC) (SRI Instruments UK) fitted with a 15 m 5.0U MXT-1 capillary column (N2 carrier gas @ 8 psi, 45°C), and a sulphur-specific flame photometric detector (air pressure: 2 psi, H2 pressure: 27 psi, 150°C).
Samples were then analysed for DMSO concentration, using the reductase enzyme method (Hatton et al., Reference Hatton, Malin, McEwan and Liss1994). Samples were purged of DMS with N2 following addition of Tris-buffer and neutralization to pH 7.0. Where samples could not be analysed within 24 h of preparation, they were frozen (−20°C) until analysis. 2 ml of flavin mononucleotide solution was added to each vial and irradiated with 3 × 60 W bulbs for 1 h to catalyse the reaction of DMSO to DMS, following Hatton et al. (Reference Hatton, Malin, McEwan and Liss1994). Samples were left for 12 h to allow DMS equilibration in the vial headspace, before direct-injection GC analysis, as described above. All sample concentrations were quantified from DMSP standard calibration curves (DMSP standard from Research Plus Inc.). The limit of detection for both DMSP and DMSO samples was 1 µg S per 100 µl headspace injection; standard and sample precision was within 1%.
Statistical analyses
All statistical analyses and data manipulation were conducted in the programming language R (R-Core-Team, 2013). The minimum saturating irradiance (RLC[Ek]) and initial photosynthetic rate (RLC[alpha]) were calculated for each fragment by fitting rapid light curve (RLC) data to the equations of Jassby & Platt (Reference Jassby and Platt1976) in the package Phytotools (Silsbe & Malkin, Reference Silsbe and Malkin2015). Maximum Relative Electron Transport Rate (RLC[rETRmax]) was calculated as RLC[Ek]*RLC[alpha]. As the δ13C skeletal value attains an equilibrium with the environment (McConnaughey et al., Reference McConnaughey, Burdett, Whelan and Paull1997), and the difference to tissue δ13C represents a metabolic effect, we calculate a δ13C differential as δ13C tissue – δ13C skeleton. We rely on seawater δ13C DIC as an additional control for potential between site variation in δ13C sources, as it provides the basis for coral carbonate production (Allison et al., Reference Allison, Cohen, Finch, Erez and Tudhope2014).
Linearity, normality, heteroscedasticity and influential outliers were assessed using residual plots. Statistical tests were not used to assess these as the large number of data points caused spurious rejection of assumptions with high P values associated with only small deviations. Tests are robust to the assumption of homogeneity of variance across groups because of balanced sample sizes between sites. Data remained untransformed to ensure fair comparisons between tests.
In turn, RLC[Ek], RLC[alpha], RLC[rETRmax], change in dissolved oxygen during incubation (ΔDO2), tissue molar C:N, DMSO:DMSP, δ13C tissue differential, tissue δ15N, sediment δ15N, and seawater δ13C DIC were all fitted as the dependent variable of a linear model with depth as the independent variable, site as a grouping factor, and an interaction term. RLC[rETRmax], ΔDO2, tissue molar C:N, δ13C tissue differential, tissue δ15N were also fitted in the same way against DMSO:DMSP. For the δ13C tissue differential, tissue molar C:N was included as a control variable to account for possible fluctuations in lipid content. These models show the physiological profile of A. lamarcki with depth at Utila, in terms of photosynthesis, heterotrophy, respiration and oxidative stress:
 $$Y\; \sim \lpar {{\rm Depth}\; {\bf or}\; {\rm DMSO}:{\rm DMSP}} \rpar + {\rm Site} + {\rm interaction}$$
Additional models included:
 $${\rm Tissue}\; \delta 15N\; \sim r{\rm ETRmax} + {\rm Site} + r{\rm ETRmax}:{\rm Site}$$
 $$\delta 13{\rm C}\; {\rm differential}\; \sim {\rm Tissue}\; \delta 15{\rm N} + {\rm Tissue\;molar}\; {\rm C:N} + {\rm Site} \,\,{+\,\, {\rm Tissue}\; \delta 15{\rm N}:{\rm Site}}$$
Statistically significant model elements were detected with heteroscedastically constant variance using ‘Anova(white.adjust = HC3)’ (Long & Ervin, Reference Long and Ervin2000). The final data file can be found in the supplementary material (Supplementary 2).
Results
The changes in physiology recorded for A. lamarcki with increasing depth differ markedly between TMA and LB. A summary of ANCOVA results and model parameters are presented in Tables 1 and 2 respectively. Plots of environmental controls can be found in the supplementary material (Supplementary 3, Supplementary 4), as well as Residual plots (Supplementary 5). Residual plots revealed no systematic deviations from model assumptions. For analyses considering the δ13C tissue differential, molar C:N was included as an additional parameter to control for lipid content. Molar C:N did not vary with depth (F = 2.40, P = 0.12) or tissue δ15N (F = 8.94, P = 0.54).
ANCOVA results: values are reported as they appeared in computer outputs

P values <0.05 are in bold and followed by an *. LB, Site Little Bight; TMA, Site The Maze.
Model parameters. values are reported as they appeared in computer outputs
References to the residual plots in supplementary information for each model are under column ‘Residuals’. ‘Interpretation’ is a brief explanation of what the model represents. LB, Site Little Bight; TMA, Site The Maze.
During our sampling we did not encounter any intermediate, general colony-level, morphologies. Though morphological variation and change in growth form down depth gradients has been documented in some species of Scleractinia (Dustan, Reference Dustan1975; Amaral, Reference Amaral1994; Nir et al., Reference Nir, Gruber, Einbinder, Kark and Tchernov2011; Goodbody-Gringley & Waletich, Reference Goodbody-Gringley and Waletich2018), we observed only modest plasticity in growth form. At the extremes of A. lamarcki's depth range, within a given site, there was a tendency toward smaller encrusting colonies. Plating forms were most common between ~20–55 m depth.
Physiological variation with depth
Three coral measures significantly varied with depth: δ15N as a signal of heterotrophy (F = 19.38, P < 0.001), δ13C differential as a signal of long-term photosynthetic activity (F = 5.53, P = 0.02), and RLC[rETRmax] as an instantaneous measure of potential photosynthetic capacity (F = 8.46, P = 0.004). ΔDO2, molar tissue C:N, and DMSO:DMSP did not significantly vary with depth (Table 1). Mean values of tissue δ15N differed between sites for a given depth (F = 25.59, P < 0.001) – the mean at LB was 0.53‰ higher. Mean DMSO:DMSP values were 0.08 higher at TMA than LB (F = 4.23, P = 0.04). Differing slopes with depth were detected for RLC[rETRmax] and tissue δ15N (Figure 1) between sites (F = 8.87, P = 0.004; F = 14.13, P < 0.001, Table 1). We found potential photosynthetic capacity (RLC[rETRmax]) significantly declined with depth (Table 1), however, this appears to only be true at LB (Table 2, Figure 1). To further understand how photosynthetic profiles vary with depth, RLC[Ek] and RLC[alpha] were tested independently against depth, as RLC[rETRmax] is a composite of these two quantities. While RLC[alpha] significantly increased with depth, RLC[Ek] significantly decreased. Only RLC[Ek] returned a significant interaction term (Table 1), suggesting the observed differences in photosynthetic capacity with depth between the two sites were caused by differing RLC[Ek] values, i.e. the minimum saturating irradiance.
Principal physiological relationships of Agaricia lamarcki with depth across two sites: Linear models of bulk tissue δ15N, RLC[rETRmax] and the δ13C differential against depth. Shaded areas are the 0.95 confidence interval. Statistical assessment and model parameters can be found in Tables 1 and 2. LB, Site Little Bight; TMA, Site The Maze.

Environmental controls
No differences in environmental baselines were observed between the two sites. δ15N of sediment samples at LB and TMA (Supplementary 3) were collected as environmental baselines for comparison to changes in tissue values which may be affected by local enrichment (Heikoop et al., Reference Heikoop, Risk, Lazier, Edinger, Jompa, Limmon, Dunn, Browne and Schwarcz2000; Baker et al., Reference Baker, Jordán-Dahlgren, Maldonado and Harvell2010). Both the environmental signal and tissue showed a significant relationship with depth (Table 1). No significant difference was detected in mean δ15N of sediments between sites, though parameter estimates indicated mean δ15N was slightly enriched at LB compared with TMA (+0.36‰). Though this was not statistically significant (Table 1), this value is close enough to the difference in mean levels between sites for tissue δ15N that we conclude there is little biological meaning to the result. It is not believed that environmental patterns drive the relationship in the tissue since the gradients in tissue δ15N with depth are in opposing directions, whereas the environmental signal is consistently positive (Table 2). δ13C DIC of seawater (Supplementary 4) was collected and analysed as an environmental comparison to coral δ13C. Though DIC exhibits a statistically significant relationship with depth, this was in the opposite direction to the coral holobiont δ13C measurement, and the effect size was at least an order of magnitude lower at each site (Table 2). Similarly to the sediment data, no statistically significant site differences were detected in δ13C (Table 1); though LB had a mean δ13C 0.05‰ higher than TMA. These results suggest the trends we see between sites result from physiological variation, and not differing environmental baselines between sites.
Relationships between photosynthesis (RLC[rETRmax] and δ13C), inferred heterotrophy (δ15N) and stress (DMSO:DMSP)
We detect two statistically supported relationships between DMSO:DMSP and other physiological variables. Firstly a reduction in tissue molar C:N with increasing DMSO:DMSP (F = 4.16, P = 0.04). Secondly an effect of site on mean levels of tissue bulk δ15N (F = 18.25, P < 0.001), with higher δ15N values for a given DMSO:DMSP at LB than TMA (Table 1). With P = 0.051, a notable effect of DMSO:DMSP on mean levels of the δ13C tissue differential is identified, with higher δ13C values at TMA than LB (Table 1).
A significant site and depth interaction for RLC[rETRmax] and for tissue δ15N (Table 1, Figure 1) could be driven by two factors. Either, certain physiological relationships within the coral holobiont were not constant, or unmeasured sources of variation were confounded differently with depth at the two sites. To aid interpretation, tissue δ15N was plotted against RLC[rETRmax] (Figure 2) and statistically assessed, determining whether the physiological relationships remained constant between sites. Site affected mean values at the two sites, but only to the degree expected by the sediment control (Supplementary 3). There is no statistically supported relationship between RLC[rETRmax] and tissue δ15N (F = 1.79, P = 0.18, Table 1), nor a significant interaction.
Variation in inferred trophic level by photosynthetic capacity and inferred, in situ, photosynthetic activity of Agaricia lamarcki across two sites: Linear model of δ15N by RLC[rETRmax]. Linear model of δ13C differential by bulk tissue δ15N. Shaded areas are the 0.95 confidence interval. Statistical assessment and model parameters can be found in Tables 1 and 2. LB, Site Little Bight; TMA, Site The Maze.
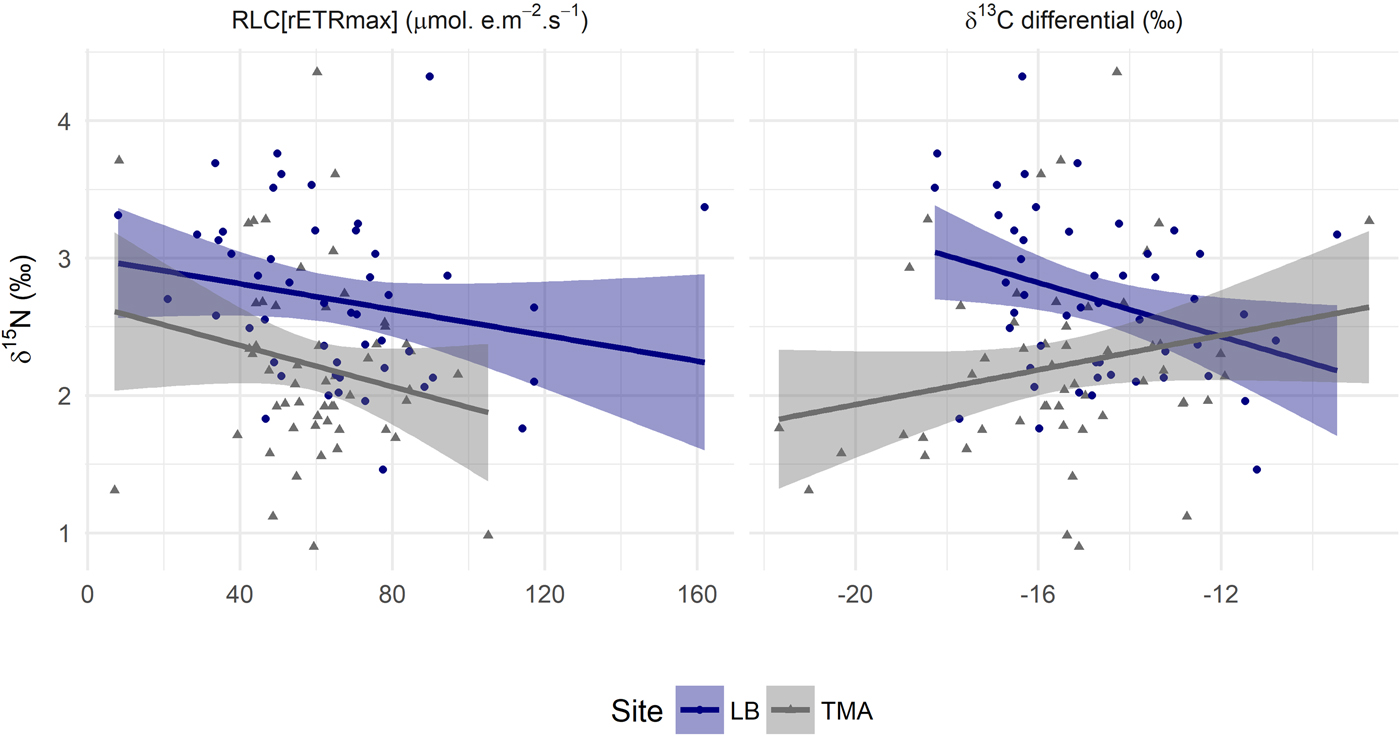
As there was, unexpectedly, no relationship between RLC[rETRmax] and tissue δ15N, we further explored the δ13C differential result. When controlling for variability in molar C:N, the difference in slope between LB and TMA δ13C with depth (Figure 1) was no longer statistically significant, P = 0.08 (Table 1). A relationship might be expected between photosynthetic parameters and the degree of heterotrophy, based on previous work (Alamaru et al., Reference Alamaru, Loya, Brokovich, Yam and Shemesh2009; Lesser et al., Reference Lesser, Slattery, Stat, Ojimi, Gates and Grottoli2010; Crandall et al., Reference Crandall, Teece, Estes, Manfrino and Ciesla2016). We therefore plot the δ13C differential against tissue δ15N (Figure 2) and statistically assessed the relationships. Whilst there was no overall relationship between the two variables, a significant interaction term (Table 1) revealed opposing gradients at the two sites and differing group means (Table 2).
Variability of physiological measures between sites
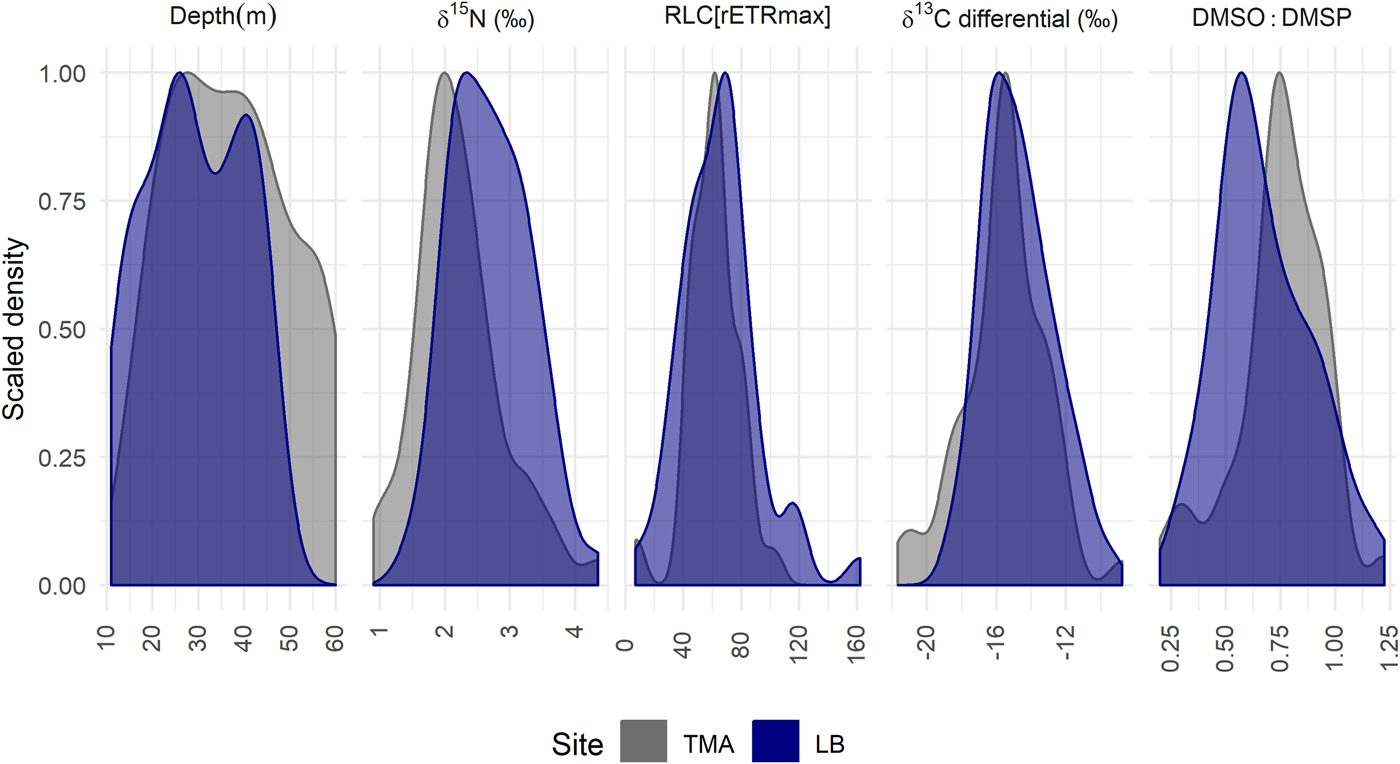
Despite differences in physiology with depth between LB and TMA, the probability distributions of parameter values are broadly comparable (Figure 3). If the physiological parameters in Figure 3 were linearly correlated with depth, we would expect the probability distributions to reflect the sampling effort with depth. The distributions at both sites return a modal value in close agreement and are more tightly grouped around this value than expected with sampling effort, despite sampling different depth ranges at the two sites. The exception is a shift in DMSO:DMSP between the two sites, consistent with the differences in mean levels detected by linear models (Table 1). The probability distribution for TMA is consistently narrower than for LB, despite TMA being sampled over a larger depth range which we would expect to necessitate greater physiological variation.
Probability distributions of select parameter values: The height of the curve indicates the relative probability of a particular parameter value. Each curve is scaled so 1 reflects the modal value within a site, the area under each curve sums to a probability of 1. The distributions from left to right show the sampled colonies with depth, values of bulk tissue δ15N, RLC[rETRmax], δ13C differential and DMSO:DMSP. If physiological parameters were correlated linearly with depth, we would expect distributions to be similar to those shown for sample collections depths. LB, Site Little Bight, TMA, Site The Maze.
Discussion
Agaricia lamarcki expresses site-specific physiological profiles with depth
This study aimed to assess the constancy of physiological patterns with depth between sites in the depth-generalist mesophotic coral, Agaricia lamarcki. We found clear site-specific trends, both in terms of PAM fluorometry and stable isotope analyses. At LB, A. lamarcki exhibited a reduction in potential photosynthetic capacity and an increase in heterotrophic feeding with depth (Figure 1). These patterns were absent at TMA, despite a wider vertical depth range. These observations highlight the variability of scleractinian physiology, and the importance of taking into consideration local/regional scale variation when attempting to generalize biological response. We have shown that the same species of coral will not necessarily behave in the same way down a depth gradient in different locations. Depth alone may therefore be an inappropriate proxy for physiological change through the mesophotic zone. We should instead consider more explicitly the role of the underwater light field when explaining mesophotic coral physiology (Lesser et al., Reference Lesser, Slattery and Mobley2018), and how this can interact with reef topography (Muir et al., Reference Muir, Wallace, Pichon and Bongaerts2018; Kramer et al., Reference Kramer, Eyal, Tamir and Loya2019).
The deepest colonies of A. lamarcki can be comparable to those more shallow
In addition to the trends in tissue δ15N and RLC[rETRmax], there were no detected trends in respiration (as inferred from ΔDO2), and no trend in the molar C:N ratio (Table 1, Supplementary 5). The lack of trend in respiration and molar C:N is of interest when taking into account the significant reduction in RLC[Ek] with depth (Table 2), which underpins a reduction in potential photosynthetic capacity (Figure 1). The change in RLC[Ek] clearly indicates that deeper A. lamarcki colonies are acclimated to lower light levels; they do not exhibit lower fat stores or rates of energy consumption at the light levels used in this study. This leads us to believe that the potential adaptation of deeper colonies may not prevent connectivity between shallow and mesophotic reefs and may permit a deep-water refuge for A. lamarcki at this location. This is supported by the lack of an observed effect of depth on the cellular oxidative stress indicator DMSO:DMSP, and by no impact of collection site on the survival of the same colonies sampled here during a transplant experiment (Laverick & Rogers, Reference Laverick and Rogers2018). A similar situation has been noted for E. paradivisa in the Red Sea (Eyal et al., Reference Eyal, Eyal-Shaham, Cohen, Tamir, Ben-Zvi, Sinniger and Loya2015). ΔDO2 in the dark, however, approximates basal metabolic rate which is expected to be largely constant (Suarez et al., Reference Suarez, Darveau and Childress2004; Makarieva et al., Reference Makarieva, Gorshkov, Li, Chown, Reich and Gavrilov2008). In situ measurements of net-photosynthesis year round are necessary to better understand the importance of respiration in balancing energy budgets with increasing depth.
Interpreting our stable isotope data, with respect to photosynthetic activity, comes with caveats. Coral growth rates can vary with increasing depth (Baker & Weber, Reference Baker and Weber1975), and this in turn can leave isotopic signals (Patzold, Reference Patzold1984). Further, coral growth rates can vary with light exposure, independent of changes in photosynthesis (Eyal et al., Reference Eyal, Cohen, Eyal-Shaham, Ben-Zvi, Tikochinski and Loya2019). Growth signals can also correlate with light exposure in skeletal carbon fractionation (Shimamura et al., Reference Shimamura, Irino, Oba, Xu, Lu, Wang and Toyoda2008). Further studies which could quantify the variation in A. lamarcki growth rates with depth would be valuable. This would allow the isotopic signatures of growth and photosynthesis to be disentangled but would also be helpful for demographic studies. For δ15N, symbiodinium growth rate does not affect nitrogen isotope fractionation (Muscatine & Kaplan, Reference Muscatine and Kaplan1994).
The observed negative relationship between C:N and DMSO:DMSP supports the role of tissue C:N as an indicator of holobiont health (Szmant & Gassman, Reference Szmant and Gassman1990) and further supports the use of DMSO:DMSP as an indicator of cellular stress (Husband & Kiene, Reference Husband and Kiene2007; McFarlin & Alber, Reference McFarlin and Alber2013). Between-site differences in mean DMSO:DMSP support the hypothesis that spatial variation in environmental conditions is impacting the local-scale physiology of A. lamarcki.
Physiological profiles are coincident with differences in ecological patterns
Our findings also reveal a connection between physiological parameters and ecological patterns. If we interpret the difference between mean tissue δ15N at the two sites (Figure 1, Table 2) as resulting from differing environmental baselines (Supplementary 3, Table 2), then there was no difference in the mean value of any physiological parameter between the two sites, except DMSO:DMSP. This observation is despite the larger depth range at TMA. Significant interaction terms for tissue δ15N and RLC[rETRmax] show that it is the rates of change with depth which vary, such that the same physiological limits are reached for these parameters. In fact, the minimum saturating irradiance (RLC[Ek]) reduces at a rate three times faster at LB than TMA with depth, while RLC[alpha] increases at more than twice the rate with depth at TMA (0.28% m−1) than LB (0.13% m−1), although this relationship was too noisy to return a statistically significant interaction term. Both quantities are considered key photoadaptations with increasing depth in coral (Chalker et al., Reference Chalker, Dunlap and Oliver1983). We expect corals from low light environments to have higher alpha values, and lower Ek values, as they optimize themselves to quickly capture the small amount of light available. Although we are able to detect variation in the rates of photoadaptation with depth, the use of RLCs prevents us from distinguishing between photosynthetic characteristics and bio-optical properties as the causative factor in these observations.
These findings do suggest that depth ranges and physiological change are related. If site-specific environmental conditions are the root cause of differing distributions for coral taxa between sites (Anthony & Hoegh-Guldberg, Reference Anthony and Hoegh-Guldberg2003), then we may have an explanation for observations of mesophotic taxa at ‘unusual’ depths (Muir & Wallace, Reference Muir and Wallace2015; Laverick et al., Reference Laverick, Andradi-Brown and Rogers2017). Increasingly in mesophotic ecology there are calls for a biologically informed, rather than depth-lineated, definition of mesophotic reefs (Laverick et al., Reference Laverick, Andradi-Brown, Exton, Bongaerts, Bridge, Lesser, Pyle, Slattery, Wagner and Rogers2016; Loya et al., Reference Loya, Eyal, Treibitz, Lesser and Appeldoorn2016; Semmler et al., Reference Semmler, Hoot and Reaka2016; Lesser et al., Reference Lesser, Slattery and Mobley2018), as intended (Baker et al., Reference Baker, Puglise, Colin, Harris, Kahng, Rooney, Sherman, Slattery and Spalding2016a). Coral species typical of the mesophotic zone are known to prefer shaded microhabitats at shallower depths (Muir et al., Reference Muir, Wallace, Pichon and Bongaerts2018; Kramer et al., Reference Kramer, Eyal, Tamir and Loya2019). Meanwhile, the potential role the underwater light field could play in controlling the distribution of mesophotic reefs has been highlighted through simulations of varying reef structure (Lesser et al., Reference Lesser, Slattery and Mobley2018). Lesser et al. suggested that a more nuanced definition of MCEs may be in reach if the light field can be connected to the intrinsic properties of coral communities. We have shown how physiological patterns between sites could translate into differing depth distributions for A. lamarcki on Utila. We now suggest that considering the interaction between physiology and the light field, at a community level, could allow us to expand the concept of mesophotic habitats.
Agaricia lamarcki appears to be a mixotroph
Previous studies have attempted to interpret physiological data and claim particular species are primarily heterotrophic or photoautotrophic (Lesser et al., Reference Lesser, Slattery, Stat, Ojimi, Gates and Grottoli2010; Crandall et al., Reference Crandall, Teece, Estes, Manfrino and Ciesla2016). Specifically A. lamarcki has been previously identified as a heterotrophic coral (Crandall et al., Reference Crandall, Teece, Estes, Manfrino and Ciesla2016). Our high degree of replication within sites, in conjunction with a cross-site comparison, provides robust evidence for notable mixotrophy in A. lamarcki. Our trends in bulk tissue δ15N and δ13C at LB indicate heterotrophy (Figure 1), in agreement with previously published research (Crandall et al., Reference Crandall, Teece, Estes, Manfrino and Ciesla2016). The trends detected at TMA, however, are more similar to those reported by others for Montastraea cavernosa (Lesser et al., Reference Lesser, Slattery, Stat, Ojimi, Gates and Grottoli2010; Crandall et al., Reference Crandall, Teece, Estes, Manfrino and Ciesla2016). Though we do not have the compound-specific stable isotope analysis of sterols used by Crandall et al. (Reference Crandall, Teece, Estes, Manfrino and Ciesla2016), we do detect a decrease in δ13C without a commensurate increase in δ15N. This suggests a primarily photosynthetic strategy at TMA. Further, the statistically significant trends in RLC[Ek] and RLC[alpha] with depth indicate photoadaptation (driven by changes in photosynthetic characteristics and/or bio-optical properties) is occurring. As RLC[alpha] increases at twice the rate with depth at TMA, and over a larger depth gradient, it may be that photoadaptation is sufficient to maintain an autotrophic strategy at this location, but not at LB. This difference in strategy between the two sites is interesting, as we observed no differences by site in the relationship between photosynthetic capacity and tissue δ15N (Figure 2). Site differences in the change in environmental conditions by depth may therefore have been responsible for the apparent switch in hetero/autotrophic strategy with depth between the two sites.
An interesting extra area of research for mesophotic coral physiology concerns the seasonal fluctuations in energy availability. In the Red Sea net O2 production in S. pistillata varies through the year (Nir et al., Reference Nir, Gruber, Shemesh, Glasser and Tchernov2014), indicating a shift in the relative contributions of heterotrophy and photosynthesis over time. For A. lamarcki in the US Virgin Islands different temporal trends in energy content were detected with increasing depth. In contrast to corals at 25 m, corals at 63 m were starved in July–September, and compensate through November–April (Brandtneris et al., Reference Brandtneris, Brandt, Glynn, Gyory and Smith2016). It may be possible that the site-specific conditions of TMA on the north, and LB on the south, side of Utila may come from seasonal asynchrony, as opposed to constant differences. Only time series studies at depth, which are highly unusual on MCEs, will be able to help us understand how energy budgets are balanced across the course of a year.
Exploiting available microhabitat may explain physiological consistency at the maze, a hypothesis
In comparison to LB, very few physiological changes with depth were observed at TMA. This was despite colonies being collected across a 44 m depth range and comparable modal parameter values between both sites (Figure 3). One potential explanation is that the topography of TMA is more complex than the gentle slope of LB, affording more light-equivalent microhabitats for colonies to exploit (Brakel, Reference Brakel1979). Photosynthetic capacity in Scleractinia has been shown to correlate with the light environment of microhabitats (Anthony & Hoegh-Guldberg, Reference Anthony and Hoegh-Guldberg2003; Bessell-Browne et al., Reference Bessell-Browne, Negri, Fisher, Clode, Duckworth and Jones2017). Given the rate of light attenuation with depth, we may expect the relative difference in light intensity between microhabitats (e.g. illuminated vs shaded) to be greater at shallower depths than deeper, and we do not expect mesophotic reefs to be exposed to a higher light intensity than shallower reefs. Given a random distribution of coral colonies across these microhabitats and in situ acclimation, we would expect similar heteroscedasticity in photosynthetic capacity. Our residual plots revealed no notable deviation from the assumption of homoscedasticity in photosynthetic capacity with depth (Supplementary 5A).
Similarly microhabitats with low flow rates, and therefore food availability, have been shown to impact the growth of Agaricia tenuifolia in shallow waters down a depth gradient (Sebens et al., Reference Sebens, Helmuth, Carrington and Agius2003). Low flow rates in the mesophotic favour ciliary mucus feeders such as A. lamarcki in general (Sebens & Johnson, Reference Sebens and Johnson1991). Varying flow rates between microhabitats at TMA may permit a more constant heterotrophic contribution to the energy budget with depth (Figure 1).
Further, Figure 3 shows the probability distributions of the parameters with the greatest between site differences, as well as the depth distribution of sampled colonies for a null comparison. In all cases, the colonies at TMA have a tighter distribution around a modal value, despite being sampled over a larger depth range than at LB. Figure 3 shows a tighter distribution at TMA in terms of DMSO:DMSP, suggesting lower inter-colony variability in oxidative stress, and so potentially irradiance. This could also in part be explained by higher variability in irradiance levels at LB as a result of the south-facing nature of the site, in comparison to TMA on the north shore of Utila. Differing site means of DMSO:DMSP with depth may also indicate maintained higher irradiance levels at TMA (Table 1), corroborated by lower rates of change in RLC[Ek] at TMA with depth. This suggests A. lamarcki is better able to exist in a sub-set of preferred, stable, microhabitats at TMA.
Consideration of environmental conditions is already being used to predict the occurrence of mesophotic taxa in the Hawai'ian archipelago (Costa et al., Reference Costa, Kendall, Parrish, Rooney, Boland, Chow, Lecky, Montgomery and Spalding2015). Environmental data (e.g. temperature, irradiance, sedimentation, turbidity) and holobiont genetic information (e.g. symbiont type, gene regulation) may have provided a mechanism to explain the differences we observed. Because of an absence of environmental measures, we are unable to explain the cause of documented pattern. We do, however, make some suggestions for further research. At TMA, appropriate microhabitats appear to extend deeper than at LB, increasing the vertical range of A. lamarcki and mitigating physiological response to depth, at this location. This leads us to hypothesize that sites with greater topographical complexity are more likely to act as depth refuges, though this will require explicit testing across other species. Such sites begin to break the correlation of environmental conditions with depth (Brakel, Reference Brakel1979), allowing suitable microhabitats to exist below surface pressures (Bridge et al., Reference Bridge, Hughes, Guinotte and Bongaerts2013). We have found that site-specific conditions may influence physiology to a greater degree than depth for A. lamarcki. Future physiology studies should try to record the light environment that colonies are located in, preferably with temporal variation, and relate this to substrate slope and shading.
Supplementary material
The supplementary material for this article can be found at https://doi.org/10.1017/S0025315419000547
Author ORCID
Jack H. Laverick, 0000-0001-8829-2084.
Acknowledgements
The author would like to thank Grace C. Young for dive time, especially at TMA, Andrea P. Izaguirre-Luque from BICA for help with sample preparation in the field and ‘coral-flossing’, and Dominic Andradi-Brown for sediment aliquots. The staff of Operation Wallacea at the Coral View research station, the Bay Islands Conservation Association, and the Natural Environment Research Council Life Sciences Mass Spectrometry Facility provided invaluable logistical and technical support. A final thank you to the reviewers who helped improve this manuscript.
Financial support
The authors would like to thank the Royal Geographical Society (Ralph-Brown Award), the Zoological Society of London (EDB Expeditions fund), the Oxford University Expeditions Council, Oxford University Press (John-Fell fund), the Natural Environment Research Council (NE/L002612/1; EK258-13/15), Merton College Oxford and Operation Wallacea for funding. TG is supported by a 7th Century University scholarship. Fieldwork was completed when HB was in receipt of a Marine Alliance for Science and Technology for Scotland (MASTS) Research Fellowship. DMSO analyses were supported by a MASTS Small Grant awarded to TG. MASTS is funded by the Scottish Funding Council (grant reference HR09011) and contributing institutions. We thank the Natural Environment Research Council (NERC) Field Spectroscopy Facility for loan of the Diving-PAM instrument.


