


I. Introduction
An important notice by CRSP makes users aware that the release of the Flat File Format 1.0 (SIZ) in January 2025 was effectively the last release of the “old” CRSP tape. From 2025 onward, CRSP will only update the “new” CRSP tape, that is, the Flat File Format 2.0 (CIZ), which was first released in 2022. Although the observations for most data items match exactly between both tapes, we find one striking exception: Monthly holding period returns for stocks, which CRSP describes as follows:
There is no direct equivalent to SFZ_MTH’s [SIZ] holding period returns, but SFZ_MTH’s [SIZ] Mret and Mretx data items map most closely to CIZ MthRet and MthRetx, respectively. The reason for this is that the calculation of legacy [SIZ] Mret and Mretx uses different assumptions than the calculation of MthRet and MthRetx [CIZ]. For example, MRet is a month-to-month holding period return with dividends reinvested at month-end. MthRet is a compound daily return with dividends reinvested on their ex-dates.
Thus, CRSP computes monthly stock returns in the new tape by reinvesting payouts on the ex-date as opposed to the end of the ex-date month in the old tape. This shift in reinvestment timing and other minor changes alter 9.6% of all monthly returns by at least 1 bp between both tapes. The mean absolute difference for these altered returns is 22 bp. While data providers such as WRDS point to these changes, it is neither clear nor obvious how these changes affect asset pricing studies that directly use monthly CRSP returns. Moreover, it is unclear whether these CRSP-induced changes lead to systematic differences in monthly returns or, rather, constitute unsystematic variation.
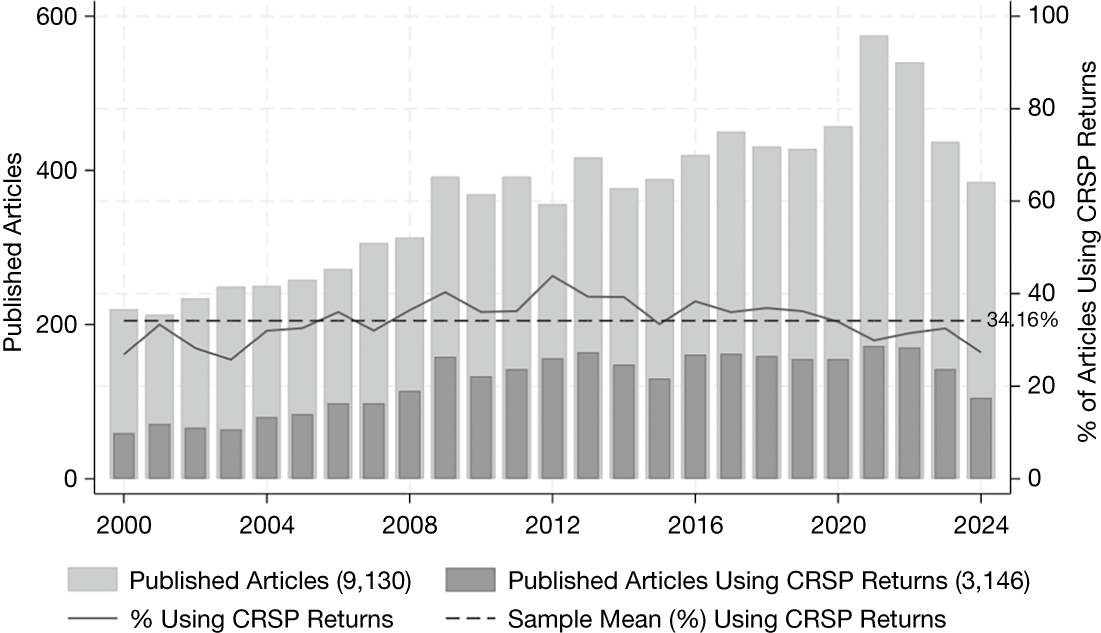
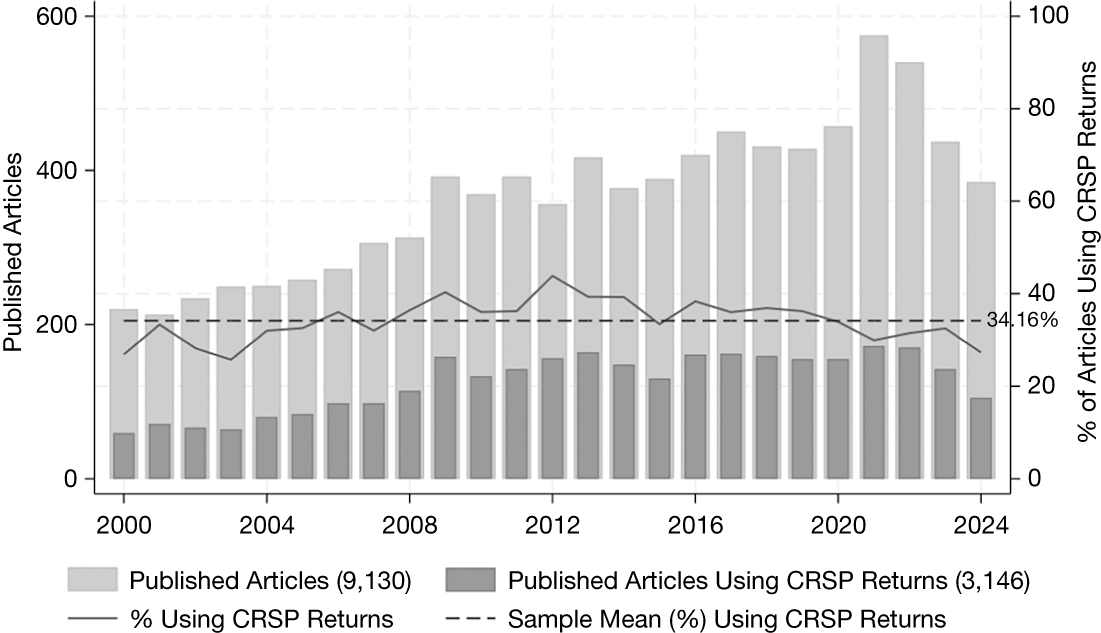
The share of asset pricing studies in top finance journals that might be affected by these changes is substantial, as shown in Figure 1. Based on textual analysis, we find that 34% of all articles published in five leading finance journals (Top5) over the last 25 years include a CRSP return-based analysis.Footnote 1 Additionally, published open-source code (see, e.g., Chen and Zimmermann (Reference Chen and Zimmermann2022), Jensen, Kelly, and Pedersen (Reference Jensen, Kelly and Pedersen2023), and Scheuch, Voigt, Weiss, and Frey (Reference Scheuch, Voigt, Weiss and Frey2024)) suggests that most researchers likely use monthly stock returns directly, irrespective of the underlying payout reinvestment assumption. Consequently, any study using monthly returns from the new tape uses conceptually different monthly returns than studies conducted with the old monthly CRSP tape.Footnote 2 Notably, no article in our sample has so far mentioned which CRSP tape (CIZ or SIZ) has been used.
Figure 1 shows the total number of published articles in five leading finance journals (Top5, i.e., JF, JFE, RFS, JFQA, and RoF) along with the absolute and relative number of published articles using CRSP return data. The sample period is from 2000 to 2024. An article is counted as conducting a CRSP-based return analysis if the article contains words (e.g., CRSP, return, portfolio sort, among others as described in Section IA.I of the Supplementary Material) indicating that return data from CRSP has been used in an empirical analysis.
In this article, we examine whether shifting the reinvestment timing from the month-end to the ex-date and other changes between the old and new tape translate into systematic differences in asset pricing studies that rely on monthly returns from CRSP. As reinvesting payouts on the ex-date might not be feasible for all investors, we also assess the effect on asset pricing studies if payouts are reinvested on the effective payment date rather than on the preceding ex-date. While an exhaustive replication of years of research is not feasible, our analysis focuses on a comprehensive set of portfolio sorts, a widely used tool found to be sensitive to methodological changes (Soebhag, Van Vliet, and Verwijmeren (Reference Soebhag, Van Vliet and Verwijmeren2024), Walter, Weber, and Weiss (Reference Walter, Weber and Weiss2024)).
The changes in monthly CRSP returns might lead to material differences in portfolio sorts for the following reasons: First, by sorting the cross section of stocks into portfolios based on characteristics, one might end up sorting stocks with high (low) payouts into the long (short) portfolio. For instance, Gormsen and Lazarus (Reference Gormsen and Lazarus2023) indicate that stocks in the long portfolio of common factors have higher payouts compared to the short portfolio. If these stocks with larger payouts also tend to have systematically more positive or negative return differences, then CRSP-induced changes might systematically alter long-minus-short portfolio returns.Footnote 3 Second, changes in monthly returns can also directly affect the construction of sorting variables that depend on monthly returns, for example, momentum. Thus, CRSP changes can also change the cross-sectional ranking of stocks.
We start by investigating why around 9.6% of monthly returns differ between the old and new CRSP tape. We find that almost all documented differences (97.7%) are due to the reinvestment of payouts on the ex-date in the new tape compared to the end of the ex-date month in the old tape. Intuitively, absolute return differences are exacerbated by higher payout yields and higher absolute returns from the day after the ex-date until the end of the month. Moreover, as the average compounded return from the ex-date to the month-end is, on average, positive, we find that monthly returns in the new CRSP tape are, on average, slightly but significantly more positive than in the old tape. Additionally, we observe 2.2% of the return differences for months in which the security has a missing monthly price at the end of the previous month (trading gaps) or was first listed during the month (IPO). Naturally, compounding daily returns within each month in the new tape leads to different monthly returns for these months compared to using month-end prices in the old tape, which can be stale in the case of trading gaps. Although infrequent, the mean absolute differences in monthly returns for months with trading gaps and IPOs are large at 7%. Lastly, we find a relatively small share (0.1%) of differences for delisting months. Compared to a standard delisting from Shumway (Reference Shumway1997), these differences for delisting months arise because CRSP does not set missing delisting returns to −30% to adjust for a delisting bias. Moreover, CRSP requires the payment date of the delisting amount to be close to the delisting date (around 30 days). Thus, to adjust for a delisting bias mentioned by Shumway (Reference Shumway1997), it is still necessary to construct monthly returns by compounding daily returns and including specific delisting assumptions. In short, trading gaps, new listings, and delistings can also induce differences in portfolio sorts that go beyond those induced by altering the reinvestment timing.
In the new tape, CRSP reinvests payouts on the ex-date to be consistent with the methodology of common total return indices, where payouts are also reinvested on the ex-date. However, reinvesting payouts on the ex-date might not be realistic for capital-constrained investors, as it requires borrowing on the ex-date until the payment date. Thus, we construct a third version of monthly returns based on the new tape, for which we only shift the reinvestment of payouts from the ex-date (new tape) to the payment date (modified new tape). This third reinvestment assumption rewrites around 14.9% of all monthly returns between the new and modified new tape. However, the mean of these absolute return differences is less than a third in relation to the mean absolute return difference between monthly returns from the old and new tape.
Turning to portfolio sorts, we sort the cross section of stock returns into portfolios based on 68 sorting variables commonly used in the literature (see, e.g., Hou, Xue, and Zhang (Reference Hou, Xue and Zhang2020)). We control for the large variation in methodological choices for portfolio sorts in the literature by constructing for each sorting variable several thousand premiaFootnote 4 that differ in common methodological choices for portfolio sorts (Walter et al. (Reference Walter, Weber and Weiss2024)).Footnote 5 Based on this methodological uncertainty procedure, we find that, on average, 11.43% of all monthly long-short portfolio returns differ by more than 10 bp when constructed with the new instead of the old CRSP tape. The corresponding mean absolute difference is 4 bp per month. These differences are especially pronounced for return-based sorting variables (i.e., which are directly constructed from monthly returns) and in NBER recessions. For those return-based sorting variables and during NBER recessions, on average, 28.07% and 18.95% of all monthly long-short portfolio returns differ at the 10 bp level. The corresponding mean absolute differences are 9 and 7 bp per month, respectively.
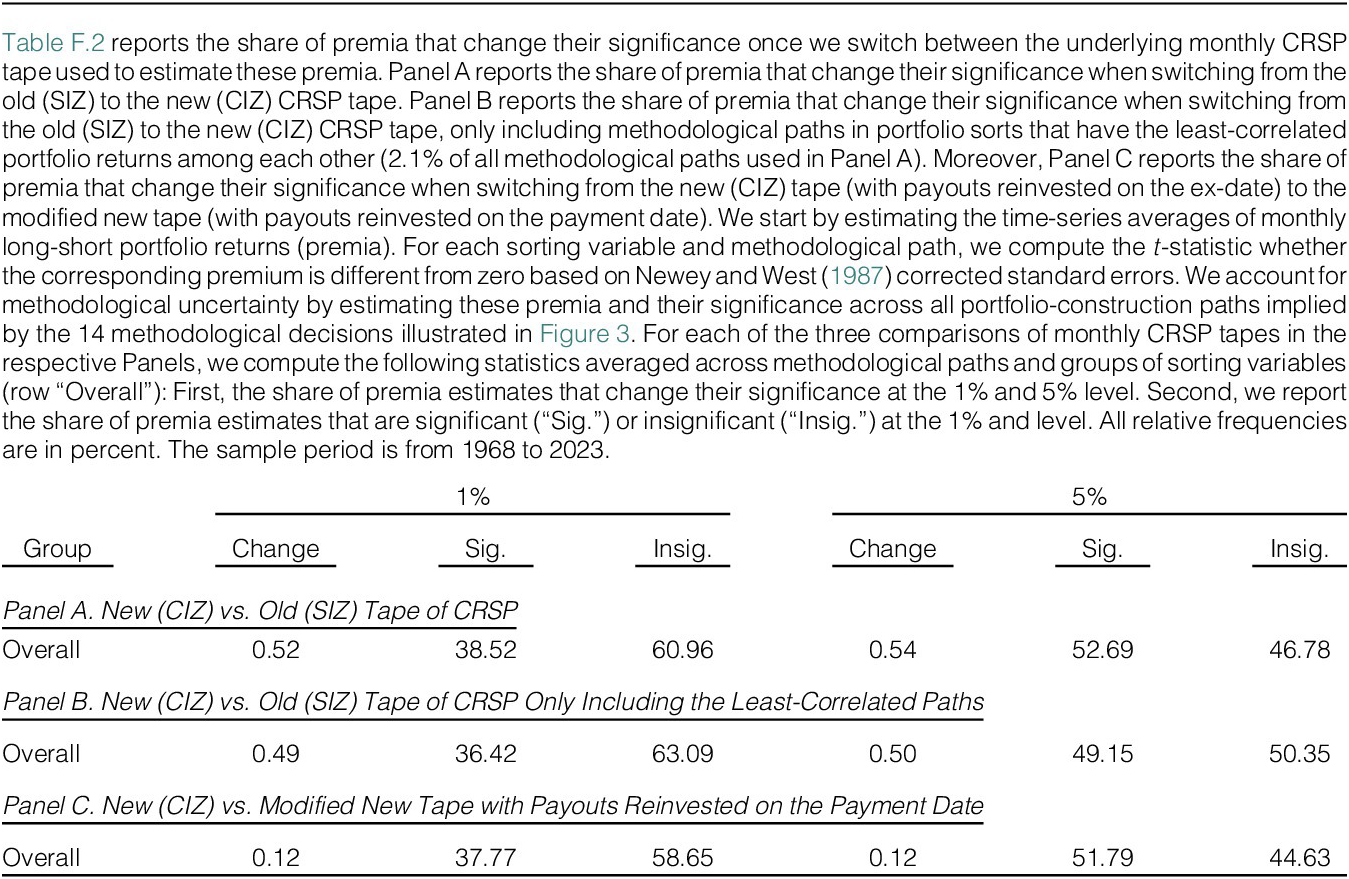
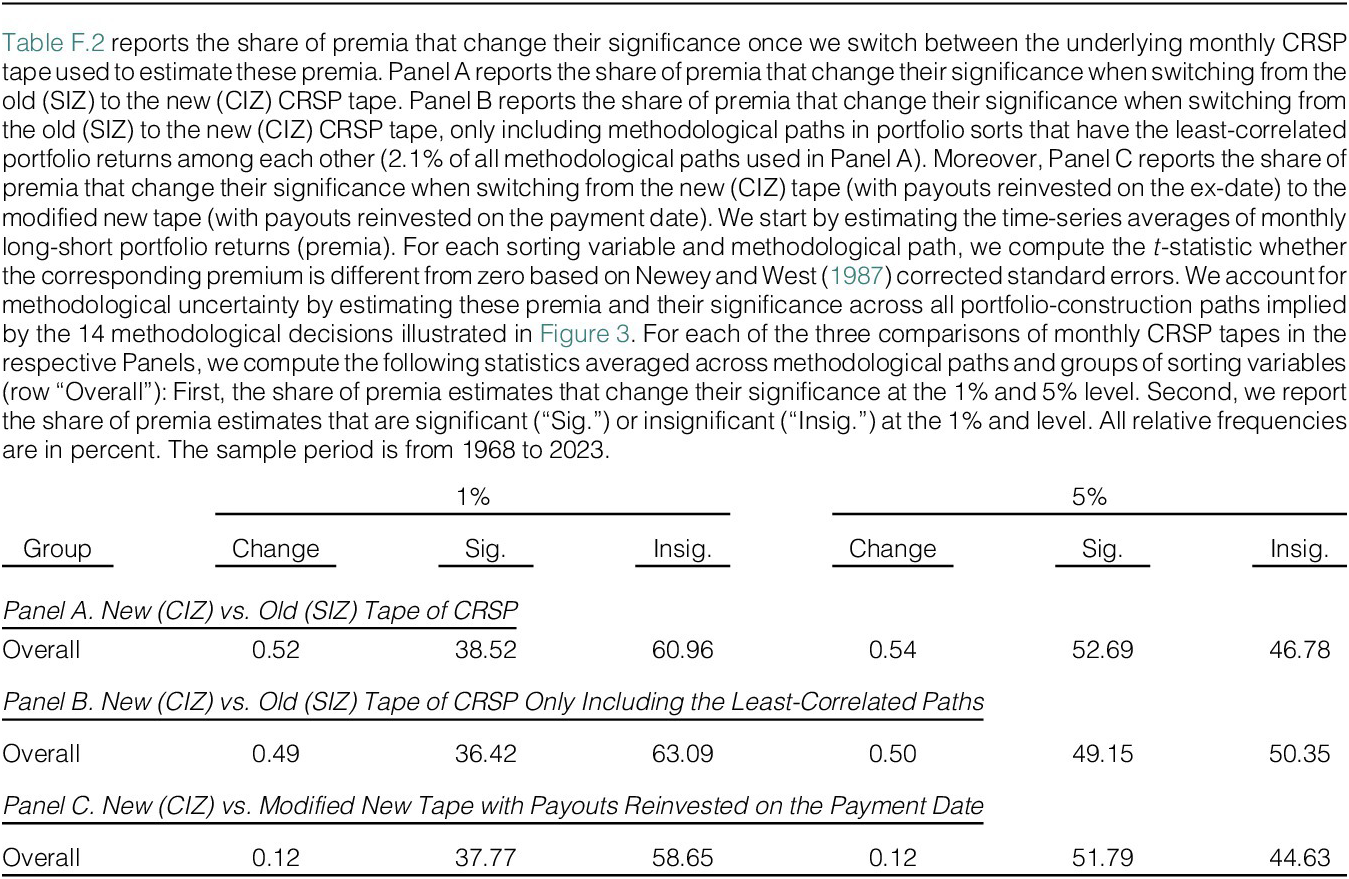
Furthermore, we investigate whether these sizable monthly portfolio return differences translate into changes of the time-series averages of these long-short portfolio returns, that is, premia estimates. Put differently, we investigate whether premia systematically differ when using the new instead of the old CRSP tape. Surprisingly, this comparison reveals that the average return premia differ by less than a basis point (i.e., 0.34 bp) for all sorting variables and by 0.59 bp for return-based sorting variables, respectively. Even looking across the many portfolio sorts generated by varying methodological choices suggests only small differences in premia. Our results show that the changes in monthly portfolio returns also have a limited influence on the significance of premia. We find that only 0.52% and 0.54% of all premia change their significance at the 1% and 5% significance level, when switching from the old to the new tape. Thus, reinvesting payouts on the ex-date instead of the end of the ex-date month and other minor changes between the new and old tape do not significantly impact premia. Additionally, we find that shifting the reinvestment timing of payouts from the ex-date (new tape) to the payment date (modified new tape) also does not materially change the size and significance of premia.
With these findings, we provide reassuring evidence that neither the recent CRSP changes nor altering the reinvestment timing of payouts from the ex-date, to the corresponding month-end, or to the payment date systematically alter unconditional asset pricing premia. Moreover, while the differences in monthly returns between the old and new tape can lead to considerable portfolio return differences in every month, we do not find any persistence in the direction of these differences in the time series. Thus, differences in long-short portfolio returns tend to cancel out over sample periods of many decades, leaving the time-series average, that is, premia, virtually unchanged.
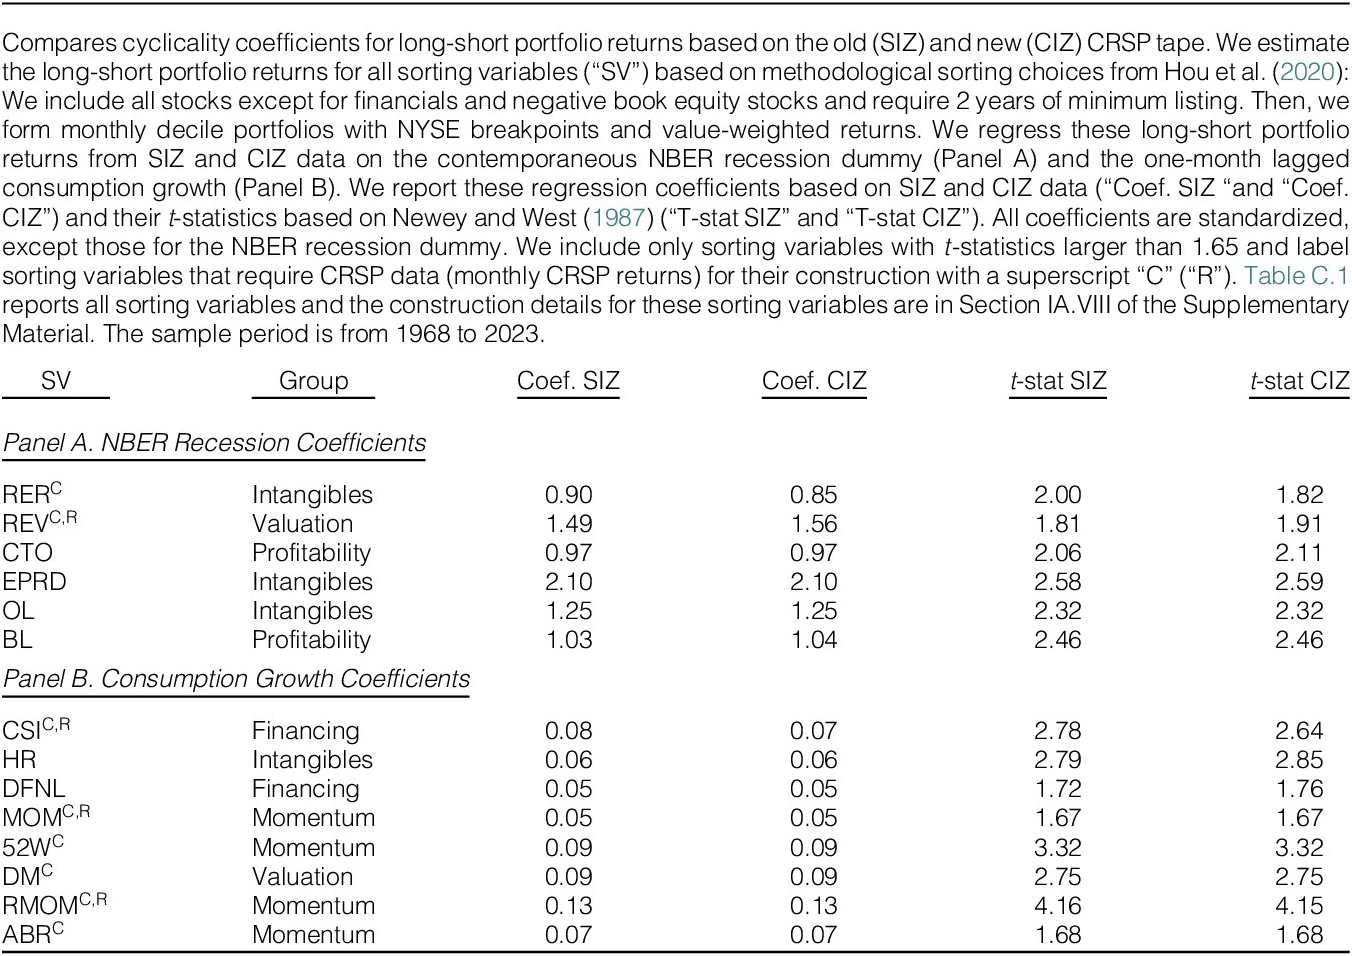
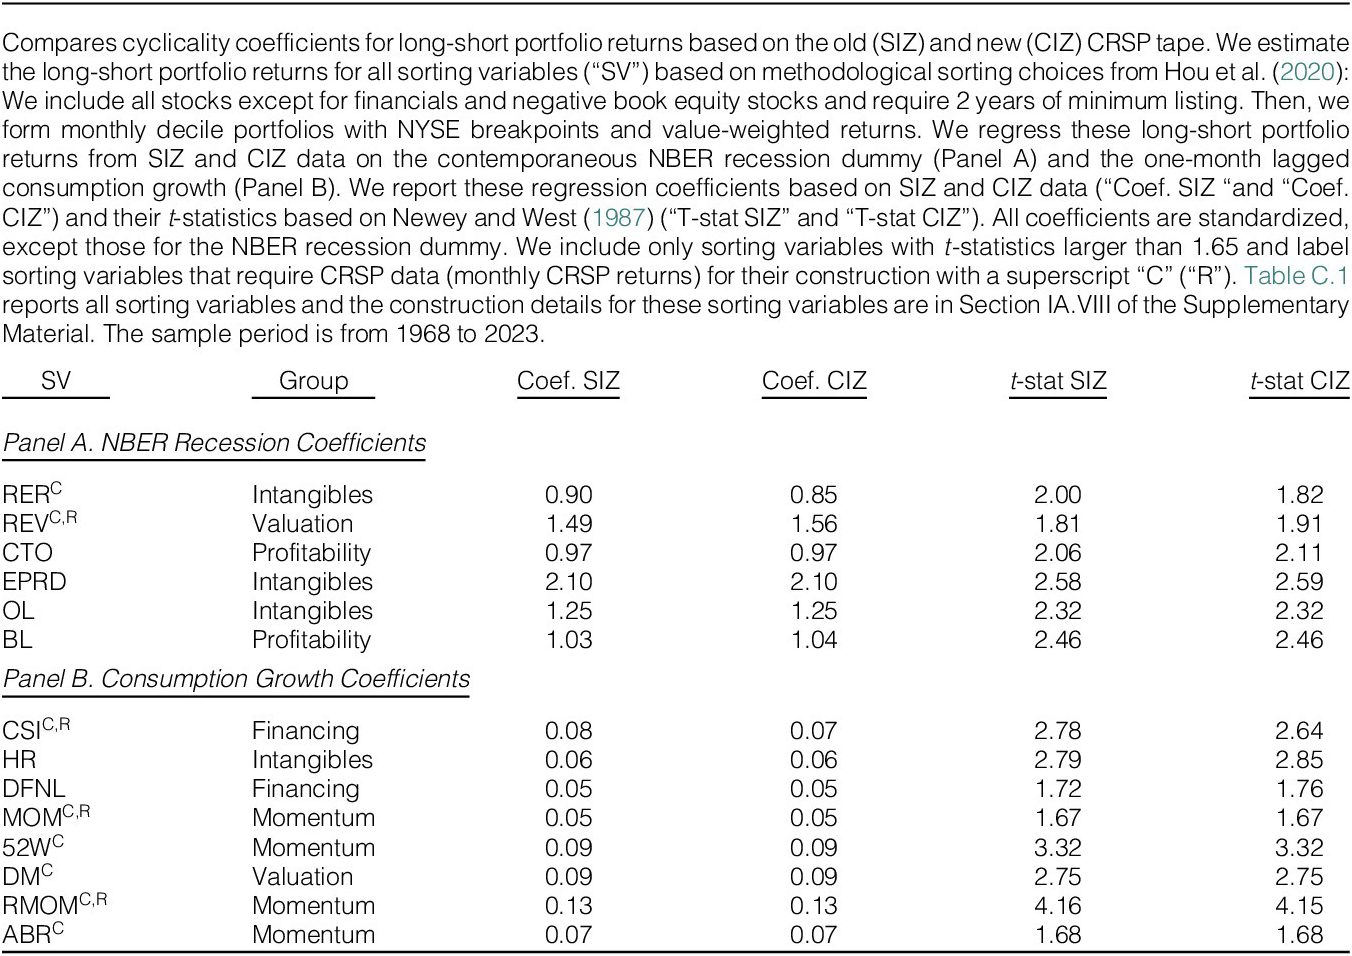
While we show that CRSP changes do not significantly impact premia estimates, we cannot generalize this result to all related asset pricing applications. Motivated by the pronounced differences of monthly long-short portfolio returns in NBER recessions, we also investigate whether the CRSP changes impact the cyclicality of premia, that is, premia conditional on the business cycle. For the vast majority of sorting variables, the CRSP changes do not alter coefficients from regressing long-short portfolio returns on business cycle indicators, that is, the NBER recession dummy. However, we do find a few exceptions: Across the various methodological choices for portfolio sorts around 24.3% of all significant NBER regression coefficients for portfolios sorted on the real estate ratio (Tuzel (Reference Tuzel2010)) change their significance at the 5% level.Footnote 6 Notably, for a specific common methodological path motivated by Hou et al. (Reference Hou, Xue and Zhang2020), the t-statistic of the NBER regression coefficient loses statistical significance at the 5% significance level as it drops from 2.00 (based on the old tape) to 1.82 (based on the new tape). Thus, CRSP changes induce larger differences in portfolio returns during NBER recessions that can—for specific sorting variables and construction choices—impact the conclusion about their cyclicality.
Related Literature. We relate to the literature that investigates data issues in commonly used financial databases. For instance, Ljungqvist, Malloy, and Marston (Reference Ljungqvist, Malloy and Marston2009), Patton, Ramadorai, and Streatfield (Reference Patton, Ramadorai and Streatfield2015), Gillan, Hartzell, Koch, and Starks (Reference Gillan, Hartzell, Koch and Starks2018), and Berg, Fabisik, and Sautner (Reference Berg, Fabisik and Sautner2021) document that historical data rewriting due to revisions, backfilling, or changes in methodology is widespread in analyst (IBES), hedge fund, executive compensation (ExecuComp), and ESG (Refinitiv) data sets, respectively.Footnote 7 Specifically, we relate to the literature that focuses on data provided by CRSP. The first studies on CRSP data quality (Rosenberg and Houglet (Reference Rosenberg and Houglet1974) and Bennin (Reference Bennin1980)) study error rates in CRSP and Compustat by comparing data points between data sets.Footnote 8 Further studies investigate errors and inconsistencies in specific CRSP variables (e.g., for shares outstanding and industry classification codes, see Courtenay and Keller (Reference Courtenay and Keller1994), Guenther and Rosman (Reference Guenther and Rosman1994), and Kahle and Walkling (Reference Kahle and Walkling1996), respectively). Particularly related to our article are the studies by Shumway (Reference Shumway1997) and Shumway and Warther (Reference Shumway and Warther1999), which document a delisting bias in CRSP returns. We add to this literature on CRSP data by showing that considerable differences in monthly stock returns between the old and new CRSP tape do not materially affect unconditional asset pricing premia.
While these studies focus on errors and biases in CRSP data, we investigate differences between the old (SIZ) and new (CIZ) CRSP tapes that are, to a large extent, due to methodological changes (i.e., change in the reinvestment assumption), and also due to revisions (i.e., treatment of trading gaps) and backfilling (i.e., IPOs). In line with the relevance of methodological changes, Akey, Robertson, and Simutin (Reference Akey, Robertson and Simutin2026) show that the construction changes in the Fama and French (Reference Fama and French1993) factors have a greater impact than revisions to the underlying data. Similarly, we raise awareness of methodological changes and their impact by dissecting CRSP changes between the old and new monthly tapes.
Moreover, we contribute to the literature on return computation. For instance, Bessembinder, Chen, Choi, and Wei (Reference Bessembinder, Chen, Choi and Wei2025) study how investors should measure long-term returns and underline the relevance of reinvesting interim cash-flows for long-term returns. We add to this literature by investigating whether reinvesting payouts on the ex-date or payment date matters for return premia. Although reinvesting dividends on the effective payment date rather than on the ex-date rewrites around 14.9% of monthly returns by at least 1 bp, it does not materially alter unconditional asset pricing premia.
Lastly, as we study the reinvestment of payouts, we also relate to studies analyzing returns around the day when stocks trade without the dividend for the first time, that is, Hartzmark and Solomon (Reference Hartzmark and Solomon2019) or Lakonishok and Vermaelen (Reference Lakonishok and Vermaelen1986). However, we can hardly infer the return difference between the old and new CRSP tape from this literature. Intuitively, the return differences between the old and new CRSP tapes depend on the payout yield and the compounded raw return from the ex-date to month-end, once we reinvest payouts on the ex-date (CIZ) instead of the month-end (SIZ). While Hartzmark and Solomon (Reference Hartzmark and Solomon2019) and Lakonishok and Vermaelen (Reference Lakonishok and Vermaelen1986) study returns after the ex-date, both focus on abnormal returns, subtracting expected returns from raw returns.Footnote 9 Additionally, Lakonishok and Vermaelen (Reference Lakonishok and Vermaelen1986) focus on 5 days after the ex-date, while we observe, on average, 14 days between the ex-date and the month-end.
II. Differences in Monthly Stock Returns
A. What Changed Between the CRSP Tapes?
From January 2025 onward, CRSP no longer updates the old tape (Flat File Format 1.0, SIZ). Instead, CRSP released a new tape (Flat File Format 2.0, CIZ) in July 2022, covering the U.S. stock and index databases. This update led to the following changes.
Structural Changes. Immediately visible, CRSP renamed data items. For instance, CRSP renamed the item “RET” for monthly stock returns (monthly tape) to “MthRet” and the item “RET” for daily stock returns (daily tape) to “DlyRet” to streamline abbreviations across data tables. Moreover, the data structure and the information content of various data items have changed. For example, CRSP altered the structure of the data items that capture exchanges and share codes by introducing additional variables that must be combined to achieve the same information content as the old data items.Footnote 10
Data Changes. Unlike structural changes that only require a precise mapping between old and new data items, changes in the data can lead to differences between past studies using the discontinued old tape versus future studies based on the new tape. Most notably, CRSP changed the computation of monthly holding period returns for stocks.
In the old tape, CRSP computes monthly returns based on month-end stock prices and assumes that payouts are reinvested at the month-end.Footnote 11 In contrast, CRSP computes monthly returns in the new tape as “Daily total return compounded for the period. Will include delisting returns if appropriate.”Footnote 12 Thus, while CRSP computed monthly returns from monthly price data using month-to-month-end prices in the old tape, CRSP compounds daily returns within each month to compute monthly returns in the new tape.
This change leads to return differences between both tapes for the following reasons: First, CRSP changed the reinvestment assumption of payouts. In contrast to the old tape, where payouts are reinvested at the end of the ex-date month, CRSP assumes that payouts are reinvested on the ex-date in the new tape.Footnote 13 This is a direct consequence of using daily data for the computation of monthly returns, as daily returns account for payouts on the ex-date. Second, unlike in the old tape, the new tape includes delisting returns “if appropriate” in the computation of monthly returns. Third, compounding daily returns within each month ensures that stale prices do not impact return computations. For instance, in the old tape, CRSP used the first available previous month-end price, which could be a stale price dating back several months, to compute the monthly return of the current month.Footnote 14 Thus, compounding daily returns within each month leads arguably to more precise monthly returns in the new tape compared to the old tape if the previous month-end price is missing due to trading gaps or new listings during the month (IPOs).
Reasons for the Changes. In line with this reasoning, CRSP stated that they changed the computation of monthly returns to improve their precision. Furthermore, CRSP reasoned that incorporating payouts on the ex-date (new CIZ tape), rather than at the end of the ex-date month (old SIZ tape), ensures methodological consistency with total return indices. For instance, total return indices from S&P Dow Jones or MSCI assume that payouts are reinvested on the ex-date. Also note that CRSP already accounts for payouts on the ex-date in the existing daily stock tape when computing daily returns. Lastly, since the monthly CRSP tape predated the daily tape, compounding daily returns was initially not feasible. With available daily data dating back to 1926, CRSP decided that it was time to reevaluate the computation of monthly returns in the new CIZ tape.Footnote 15
Although price pressure around ex-dates suggests that some investors reinvest payouts on the ex-date (see, e.g., Campbell and Beranek (Reference Campbell and Beranek1955), Barclay (Reference Barclay1987), and Bali and Hite (Reference Bali and Hite1998)), this might not be realistic for all types of investors, such as private investors. For cash-constrained investors, reinvesting on the ex-date requires borrowing on the ex-date until the subsequent payment date. In line with this reasoning, Berkman and Koch (Reference Berkman and Koch2017) show that there is temporary price pressure on payment dates, especially for stocks with dividend reinvestment plans. This suggests that a significant portion of investors at least partially reinvest their dividends on or around the payment date. Consequently, we study not only the differences in monthly returns between the old (SIZ) and new (CIZ) tapes but also investigate the differences for monthly returns when reinvesting payouts on the payment date (modified new tape) as opposed to the ex-date (new tape). Hence, we construct a version of monthly returns based on the new tape, for which we only shift the reinvestment of payouts from the ex-date to the payment date. We call these returns “modified new returns” with payouts reinvested on the payment date, explain the construction in Section IA.II of the Supplementary Material, and provide implementation code on GitHub (https://github.com/dwalter-research/CRSP_Changes_Impact_on_Asset_Pricing).Footnote 16
B. How Large Are the Differences in Monthly Returns?
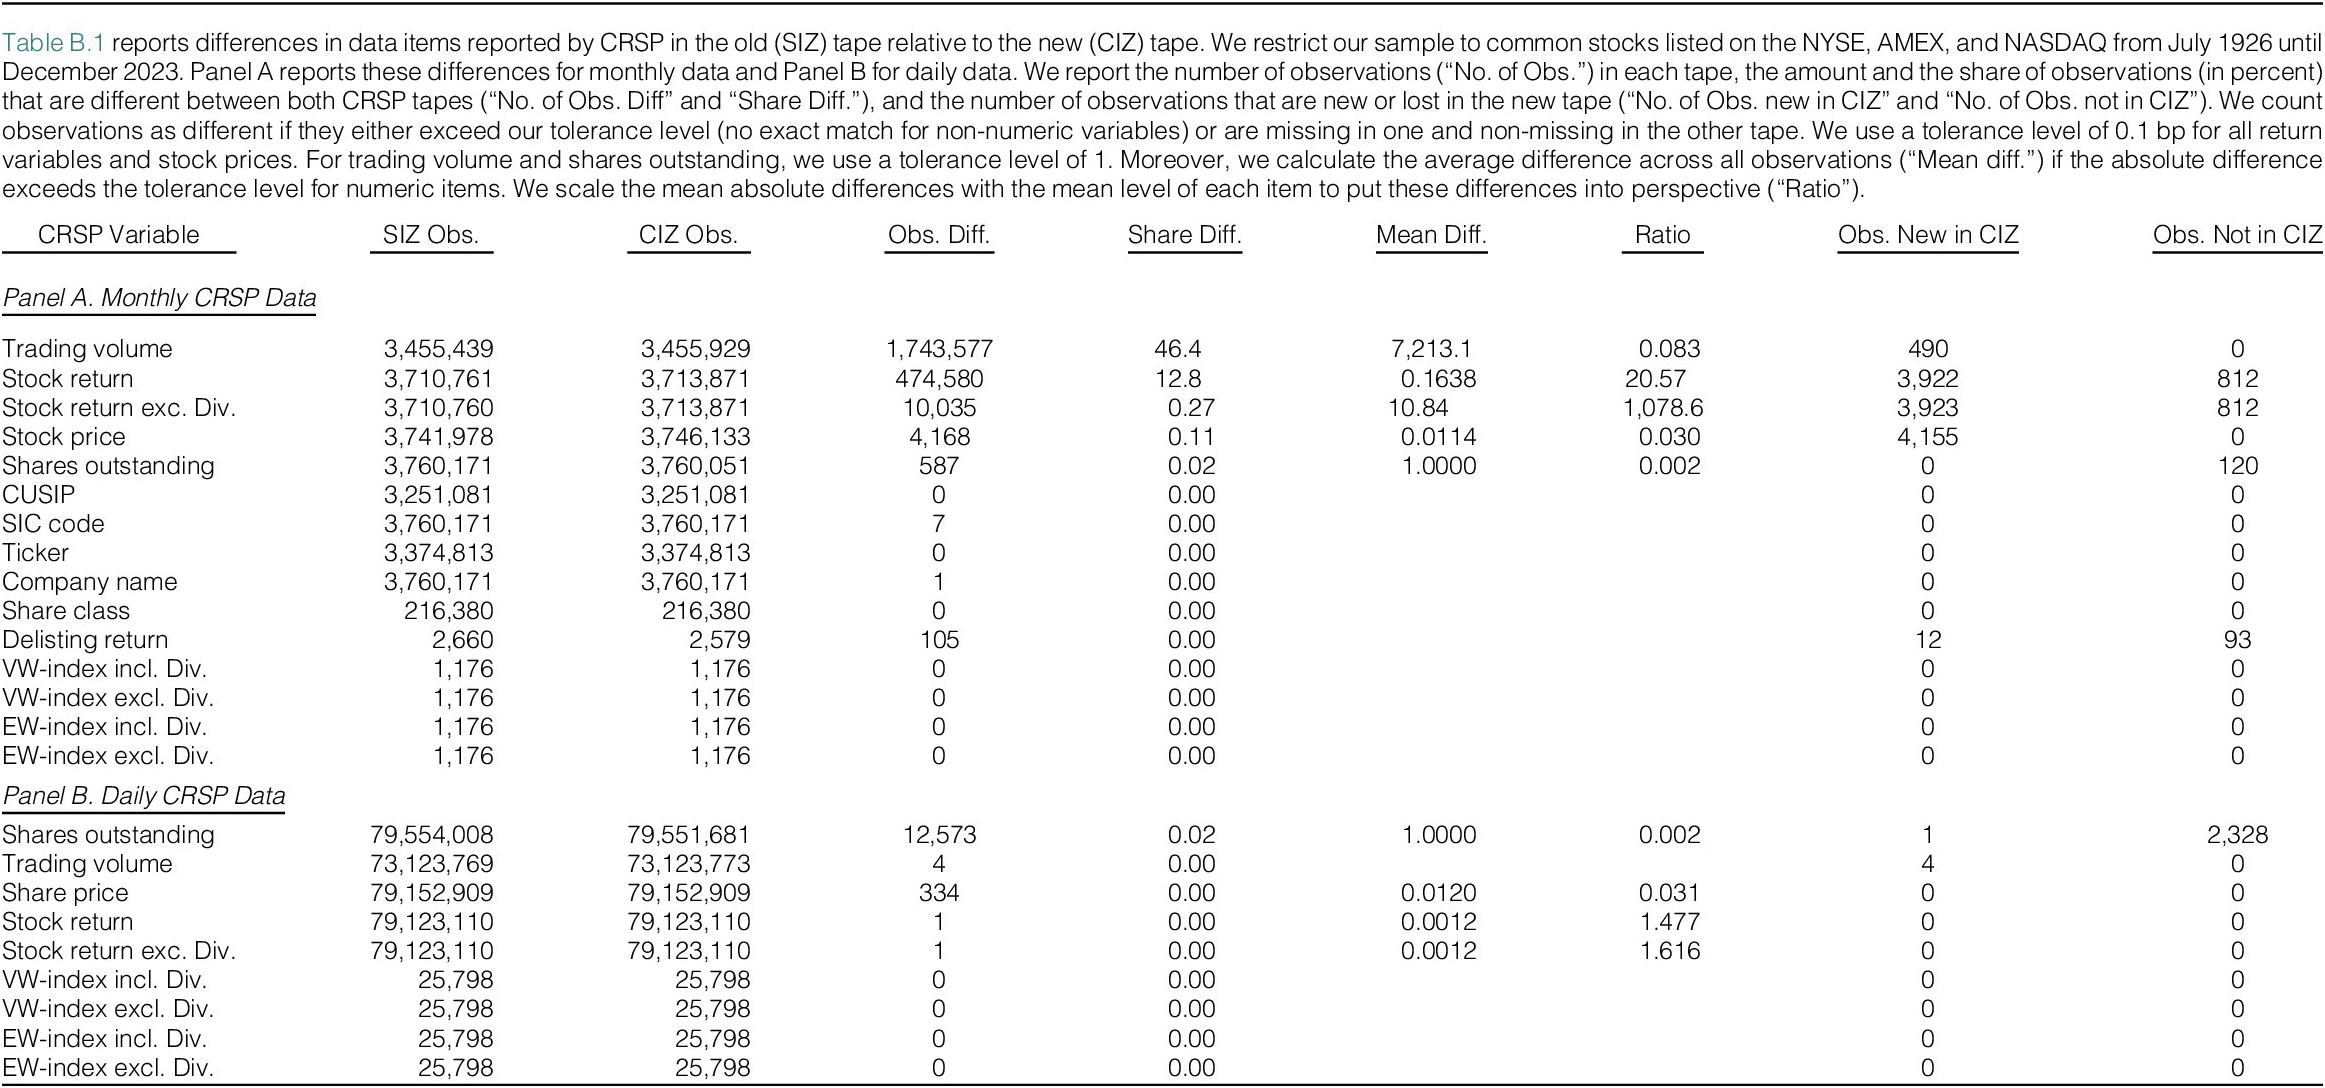
To quantify the differences due to the CRSP changes, we start by comparing the number of observations and values for commonly used data items between both CRSP tapes (Table B.1). We observe that the number of observations is almost identical for most monthly and daily data items. The new tape neither loses observations from the old tape nor adds new observations for nearly all data items. Thus, the new CRSP tape covers virtually the same stocks and time horizon as the old tape.
Although CRSP states that “the vast majority of the data match up exactly,” we see one striking exception: Monthly stock returns.Footnote 17 Thus, we compare monthly stock returns from the new CRSP tape (item “MthRet”) with monthly stock returns from the old CRSP tape (item “RET”). We adjust the returns from the old tape for delisting returns from Shumway (Reference Shumway1997) as CRSP implements a delisting adjustment in the new tape. Thereby, we avoid counting observations as different, which might not be different for studies that include delisting returns. Thus, besides differences due to altering the reinvestment timing, other differences should only derive from trading gaps, new listings, or different delisting assumptions between CRSP and Shumway (Reference Shumway1997).
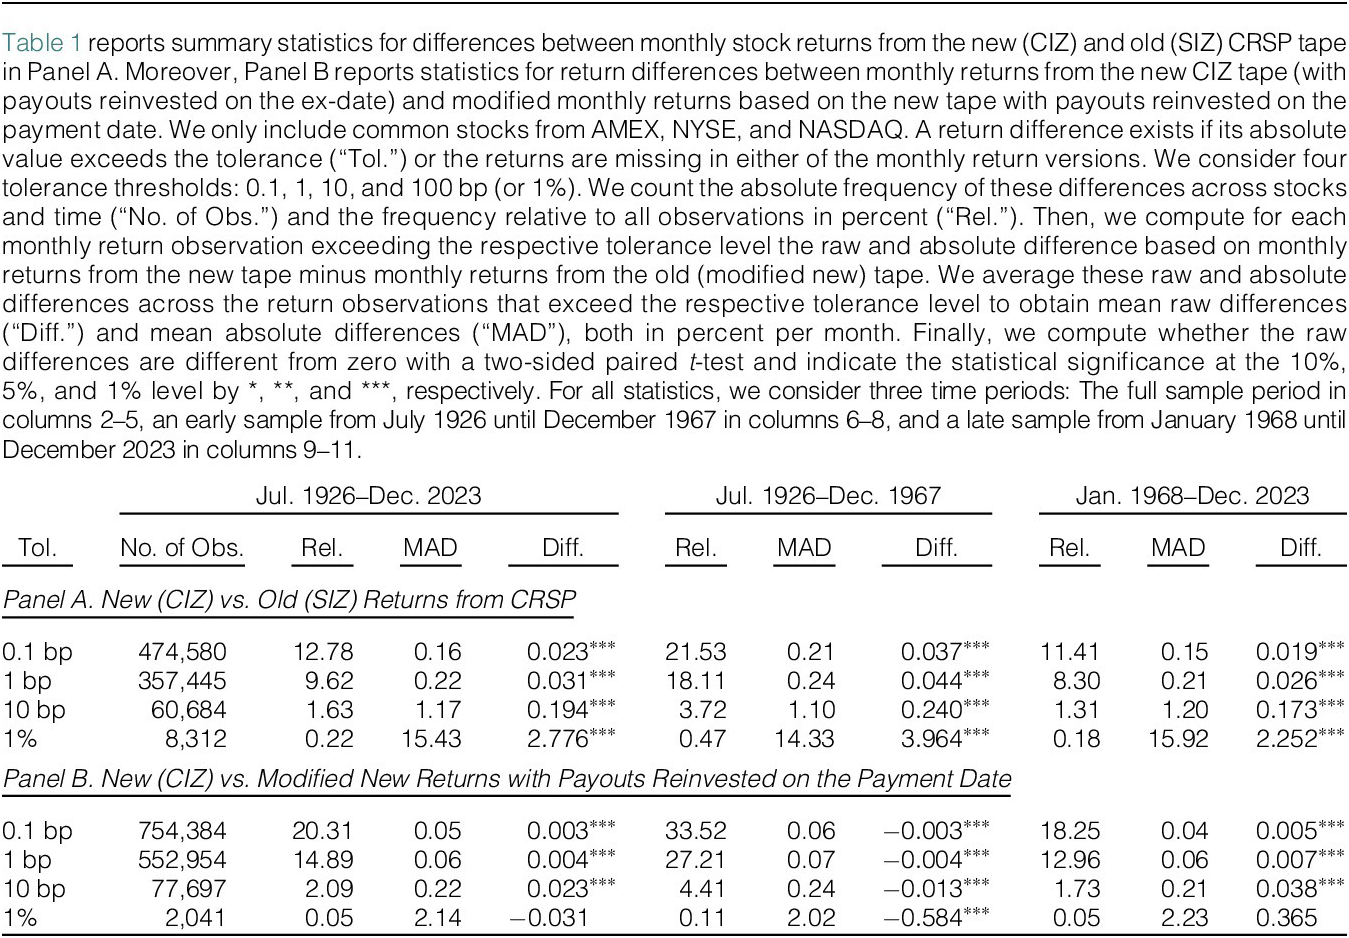
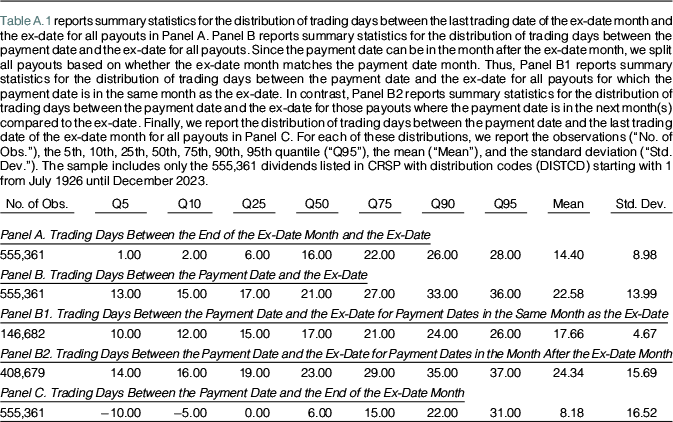
Applying a tolerance level of 1 bp, we find that almost 10% of the monthly returns have absolute differences exceeding 1 bp between the old and new CRSP tape, as reported in Panel A of Table 1. The mean of these absolute return differences that exceed 1 bp is roughly 22 bp (column “MAD”). Moreover, around 1.6% of the monthly returns have absolute differences of at least 10 bp across both tapes. We also investigate whether monthly returns are more positive or negative in the new versus old tape. Although many raw return differences cancel out once we take the average, monthly returns in the new tape are still significantly more positive than in the old tape (column “Diff”).Footnote 18 Thus, we observe sizable and significant return differences between both CRSP tapes that can potentially impact studies using monthly CRSP returns.
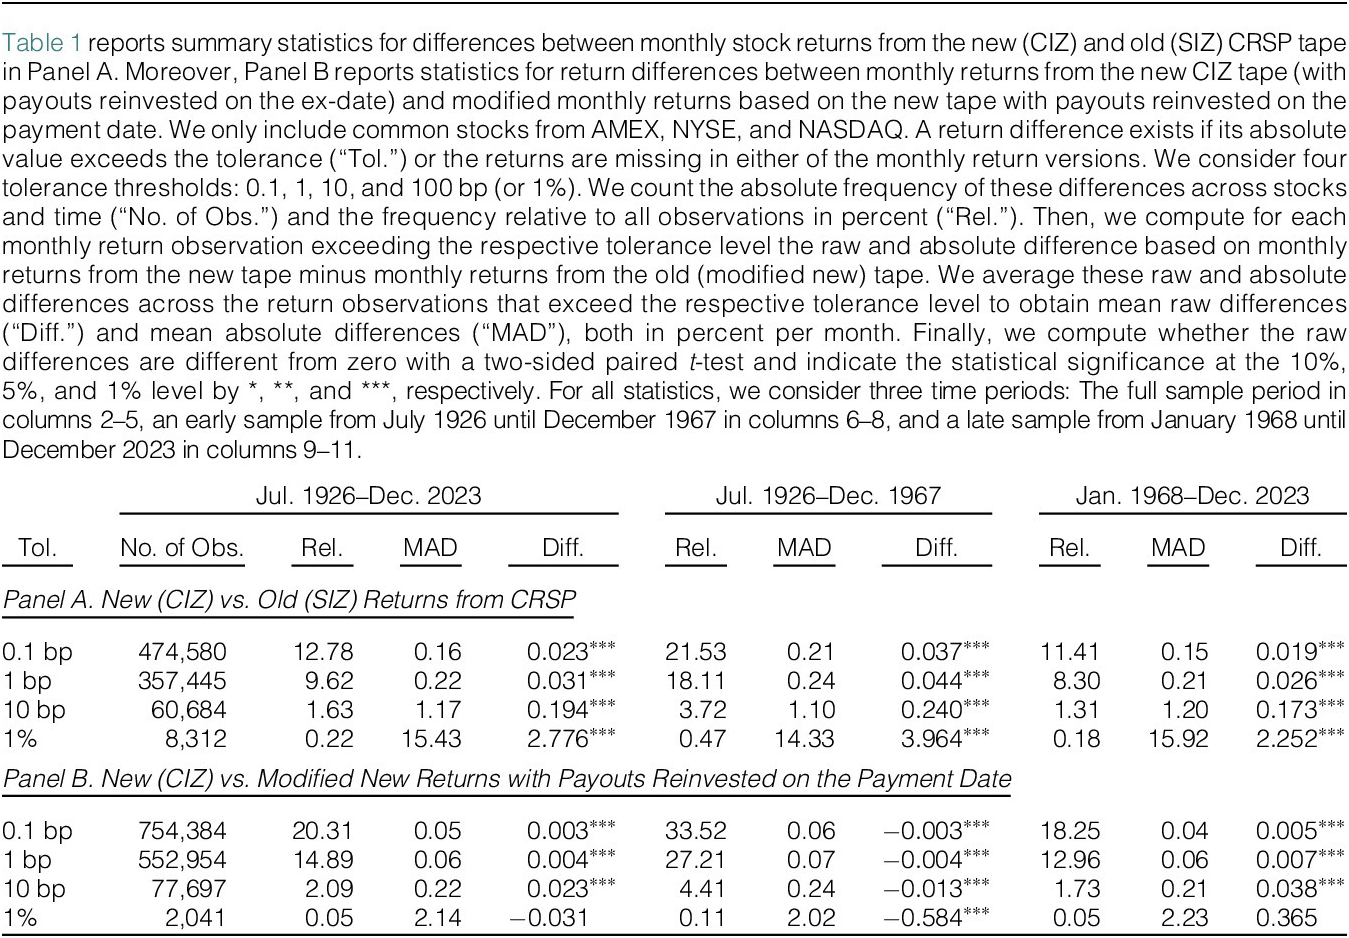
Next, we analyze the potential impact of a more realistic third reinvestment assumption. Specifically, we investigate differences between monthly returns from the new CRSP tape with payouts reinvested on the ex-date and monthly returns based on the new tape with payouts reinvested on the payment date (modified new tape) in Panel B of Table 1. Moving the reinvestment of payouts from the ex-date to the payment date alters around 14.9% of all monthly returns by at least 1 bp. Although this switch from the ex-date to the payment date alters around 50% more observations, the mean absolute difference is, with 6 bp, less than a third compared to the change from the old to the new tape in Panel A. Intuitively, reinvesting payouts on the payment date rather than on the ex-date affects more monthly observations than the change from the old to the new tape. The reason is that 73% of all payout are effectively paid out in the month(s) after the ex-date month. In contrast, shifting the reinvestment from the month-end (old tape) to the ex-date of the same month (new tape) only alters one monthly return for a given payout. Moreover, it is natural to find lower mean absolute differences relative to the comparison of the old tape versus the new tape, as we only shift the reinvestment of payouts. In contrast, the differences between the old and new tapes are additionally influenced by potentially large differences based on trading gaps, new listings, and delistings.Footnote 19
The share of return differences varies over time. The time split in Table 1 indicates around twice as many return differences in early sample periods before 1967, relative to periods thereafter.Footnote 20
The differences between returns from the new tape and modified returns from the new tape with payouts reinvested on the payment date are, by construction, only due to changing the reinvestment timing. However, it is not clear to what extent reinvestment timing, trading gaps, new listings, or delistings determine the documented differences in monthly returns between the old and new CRSP tape. Thus, we decompose the return differences between the old and new tape in the following to quantify the relative importance of these determinants. Investigating these determinants will also guide our analysis of how these return differences impact asset pricing studies in Section III.
C. What Drives the Changes in Monthly Returns?
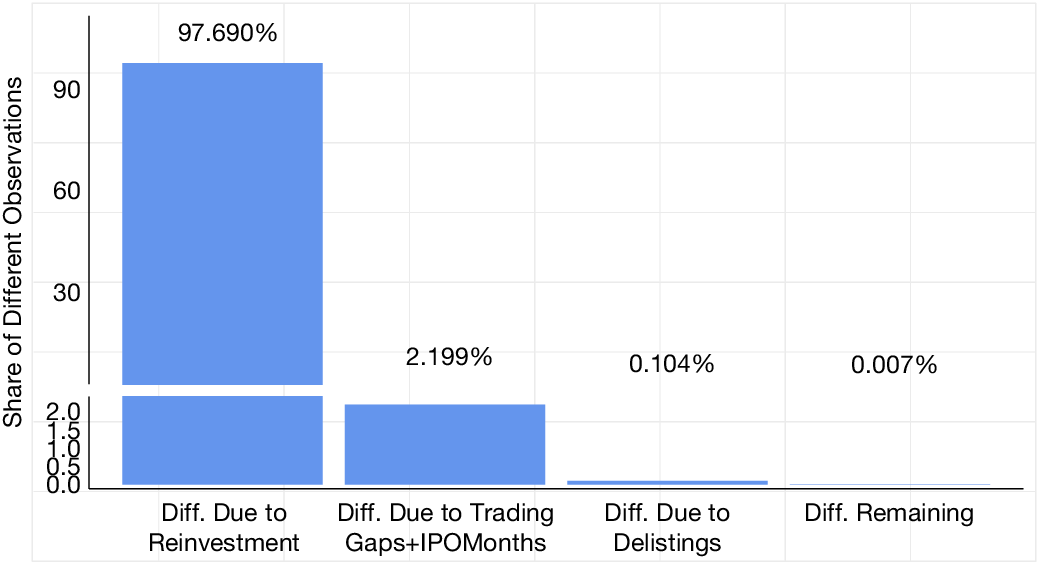
As the daily returns did not change materially in the new (CIZ) tape, we can replicate the new monthly returns using the daily stock returns from the old (SIZ) tape. This allows us to test how many of the monthly return differences are due to the altered reinvestment assumption, trading gaps, new listings, and delistings. First, we start by compounding daily returns within months for which we observe no trading gaps or delistings. Thereby, we ensure that payouts are reinvested on the ex-date as daily returns in the old tape account for payouts on the ex-date. Adjusting for this altered reinvestment assumption explains around 97.7% of all absolute return differences between both tapes that exceed a tolerance level of 0.1 bp, as shown in Figure 2. Thus, the vast majority of monthly return differences are due to changing the reinvestment timing of payouts.
Figure 2 shows the share of absolute return differences between the old (SIZ) and new (CIZ) CRSP tape exceeding 0.1 bp that can be explained by changing the reinvestment assumption, trading gaps/IPO months, and adjusting delisting returns. We compute these shares as follows: First, we compute how many of the monthly return differences can be explained by compounding the daily returns of the old CRSP tape for months without missing previous month-end prices and no recorded delistings (“Diff. Due to Reinvestment”). Second, we calculate how many of the monthly return differences can be reconciled by compounding daily returns also for months with missing month-end prices from the previous month and no recorded delistings (“Diff. Due to Trading Gaps + IPO Months”). Third, we compute how many of the monthly return differences can be explained by additionally adjusting delisting returns in the old tape (“Diff. Due to Delistings”). Lastly, we show the share of monthly return differences that we cannot explain (“Diff Remaining”) after compounding daily returns within all months and adjusting delisting returns. The sample covers all common stocks from AMEX, NYSE, and NASDAQ from 1926 to 2023. All relative frequencies are in percent, and the vertical-axis scales differ for illustrative purposes.
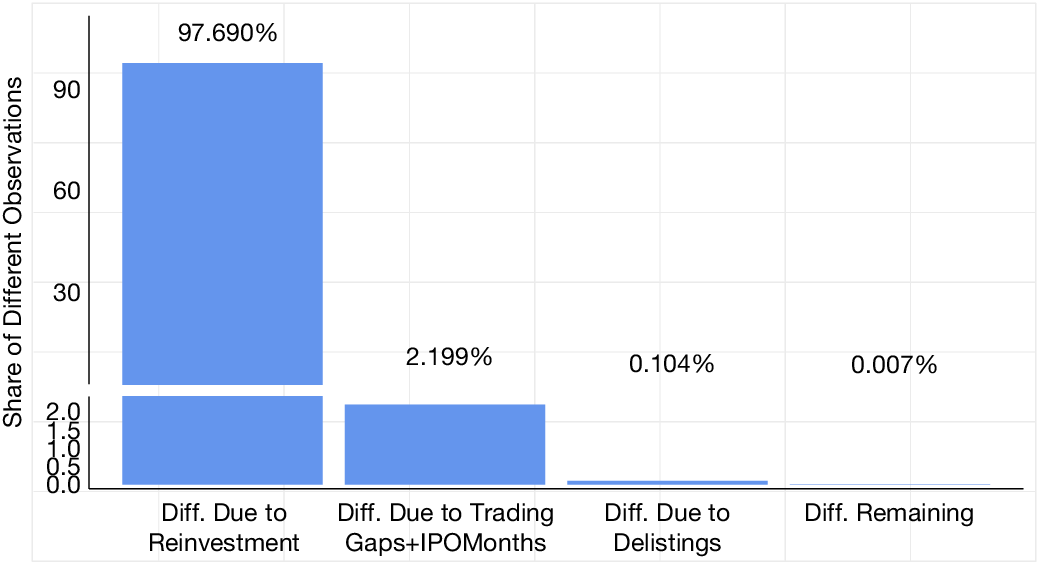
Second, we also compound daily returns for those months that have trading gaps but no recorded delistings. Compounding daily returns within each month can lead to markedly different monthly returns compared to using month-to-month-end prices in the old CRSP tape. That is, CRSP used stale month-end prices that could date back several months, depending on the trading gap. Additionally, CRSP was unable to compute monthly returns for stocks first listed during a respective month because the previous month-end price was unavailable. These observations are no longer missing in the new tape, as daily compounding within a month does not require previous month-end prices. Taking into account these trading gaps and IPO months allows us to explain additionally 2.2% of the return differences between the old and new tape, as shown in Figure 2.
Third, we can explain an additional share of 0.1% of all monthly returns that differ between the old and new tape if we alter two delisting assumptions from Shumway (Reference Shumway1997) for the old tape: First, we do not include delisting returns of −30% if the delisting return is missing and the delisting code is between 400 and 591. Second, we set delisting returns to zero if there are more than 30 days between the payment date of the delisting amount and the delisting date. For the remaining delisting dates, we adjust the daily returns by multiplying them by the delisting return. Based on this procedure, we no longer observe differences between the old and new tape in delisting months. Thus, our results suggest that the delisting procedure included in monthly returns in the new CRSP tape deviates from Shumway (Reference Shumway1997) and does not adjust for missing delisting returns. Moreover, CRSP requires the payment date of the delisting amount to be close to the delisting date to ensure that this part of the return is paid out around the delisting date. These delisting adjustments explain what CRSP refers to as delisting “if appropriate.”
Although only around 2.3% of all return differences are due to trading gaps, new listings (IPO month), and delistings, their absolute return differences are large: The mean absolute difference for all monthly returns that differ due to trading gaps and new listings is around 7.2%, and even around 14% for monthly returns that differ due to delistings between both tapes (see Figure IA.4 in the Supplementary Material). However, trading gaps, IPO months, or delistings cannot explain the large share of return differences. Moreover, even if we exclude months with trading gaps, new listings, and delisting, the mean of all absolute return differences between the new and old tape is still around 7 bp (see Table IA.4 in the Supplementary Material). These differences are similar to the mean absolute difference that we obtain if we only shift the reinvestment of payouts in the new tape from the ex-date to the payment date (6 bp in Table 1). The remaining differences (32 observations) in Figure 2 have missing returns in the new tape, but valid returns in the old tape.
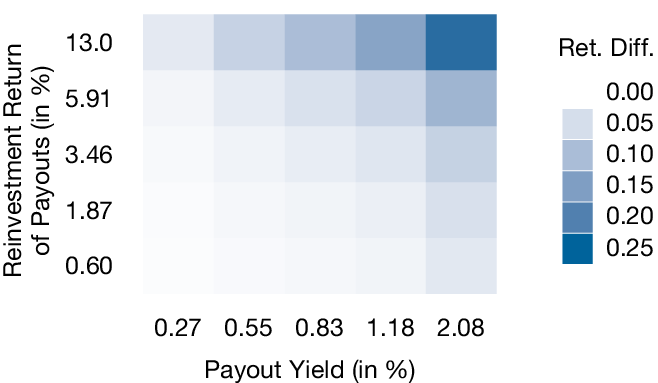
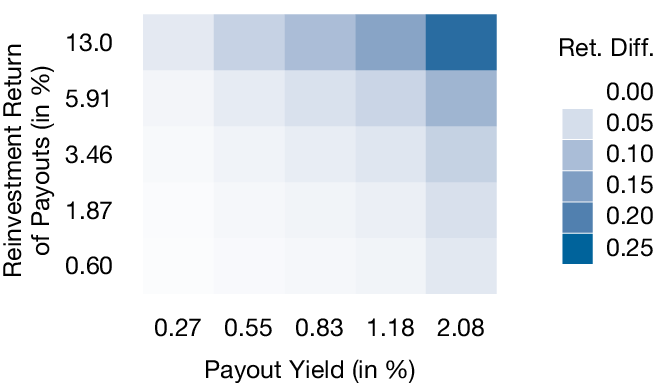
Next, we analyze the drivers of the differences that arise from reinvesting payouts on the ex-date instead of the month-end (97.7%): First, larger payout yields intuitively lead to larger differences once we shift the reinvestment of payouts. Second, larger absolute compounded returns from the ex-date to the month-end correspond to the reinvestment return of payouts within the month and will increase return differences between the tapes. Consistent with this intuition, the heatmap in Figure B.1 shows that return differences between both CRSP tapes increase with the payout yield and the absolute compounded return from the ex-date to the month-end.Footnote 21 In line with these results, stocks with return differences are older, larger, more profitable, and have higher payout yields (see Table IA.5 in the Supplementary Material). Also, stocks in traditional dividend-paying industries (e.g., financials or utilities) have a larger share of absolute return differences (see Table IA.7 in the Supplementary Material).Footnote 22
Dependency on the Business Cycle. Both components—the payout yield and the absolute compounded return from the ex-date to the month-end—are larger during NBER recessions (see Figure IA.7 in the Supplementary Material). This might be intuitive, as payout yields depend on prices that drop at the beginning of recessions. Furthermore, the cross-sectional return dispersion increases during recessions, implying, on average, more extreme returns from the ex-date to the month-end.Footnote 23 Thus, both channels that drive the monthly return differences are more pronounced in recessions. Hence, we expect larger impacts of these return differences on asset pricing studies during economic downturns.
To sum up, changing from the old (SIZ) to the new (CIZ) tape rewrites 9.6% of monthly returns by at least 1 bp, which is mostly due to reinvesting payouts on the ex-date instead of the month-end. Moreover, these differences are more pronounced during recessions. Thus, the change from the old to the new tape is potentially impactful, as the code of open source asset pricing studies (see, e.g., Chen and Zimmermann (Reference Chen and Zimmermann2022), Jensen et al. (Reference Jensen, Kelly and Pedersen2023), and Scheuch, Voigt, and Weiss (Reference Scheuch, Voigt and Weiss2023)) suggests that these authors and, thus, likely the majority of original studies directly used monthly returns from the old CRSP tape. We find no indications that, instead of using the monthly return item, studies compute monthly returns by compounding daily returns with dividends reinvested on the ex-date or the payment date. Altering the reinvestment timing in the new CIZ tape from the ex-date to payment date rewrites even 14.9% of monthly returns by at least 1 bp. However, the corresponding mean absolute difference of these monthly returns is less than a third relative to the comparison between the old and new CRSP tape.
III. Differences in Return Premia
It is ex ante unclear how these significant changes in monthly returns between the old and new tape affect studies that use monthly stock returns from CRSP. The impact of these documented changes is arguably relevant, as 34% of the articles published in the Top5 finance journals in the last 25 years use monthly CRSP returns. While there are many possible applications, we focus on a widely used asset pricing method that relies on monthly CRSP returns, that is, portfolio sorts. By sorting the cross section of stocks into portfolios, researchers uncover (risk) factors and estimate their premia.
A. Data and Methodology
Data. Our premia analysis relies on standard asset pricing data from 1968 until 2023.Footnote 24 In particular, we use CRSP data on prices, returns, shares outstanding, industry classifications, and trading volume of common stocks traded on the NYSE, AMEX, and NASDAQ from the old (SIZ) and new (CIZ) tapes. For the old tape, we use delisting returns according to Shumway (Reference Shumway1997) and set missing delisting returns with delisting codes 400–591 to −30%. Monthly returns in the new tape already include delisting returns. Accounting data are from Compustat, and we require for all analyses a valid primary link between CRSP’s permno and Compustat’s gvkey in the respective linking table.
Moreover, we follow Akey et al. (Reference Akey, Robertson and Simutin2026) and replicate the market factor with their publicly available code, which is based on a fixed methodology following the details in Fama and French (Reference Fama and French2023). This allows us to construct a market factor with data from the old SIZ and new CIZ tapes separately. The code from Akey et al. (Reference Akey, Robertson and Simutin2026) ensures replicability and consistency as the Fama and French (Reference Fama and French1993) factors are maintained by Dimensional Fund Advisers (DFA) and are subject to methodological changes (Akey et al. (Reference Akey, Robertson and Simutin2026)).Footnote 25 The risk-free rate comes from DFA data available on Kenneth French’s website. Since future database updates might affect the reproducibility of our study, we state the vintage of these data sets, which is from July 2024. Lastly, we obtain the NBER recession indicator and consumption growth from the FRED (vintage from November 2025).
Sorting Variables. We construct 68 sorting variables covering a wide range of economic rationales, which previous studies have suggested to predict the cross section of stock returns. These sorting variables are our test characteristics to assess the impact of the return changes. We provide a list of all sorting variables in Table C.1. Moreover, we follow Hou et al. (Reference Hou, Xue and Zhang2020) in the sorting variable construction (see Section IA.VIII of the Supplementary Material) and assign all sorting variables to groups to facilitate comparisons: Financing, intangibles, investment, momentum, profitability, size, trading frictions, and valuation.
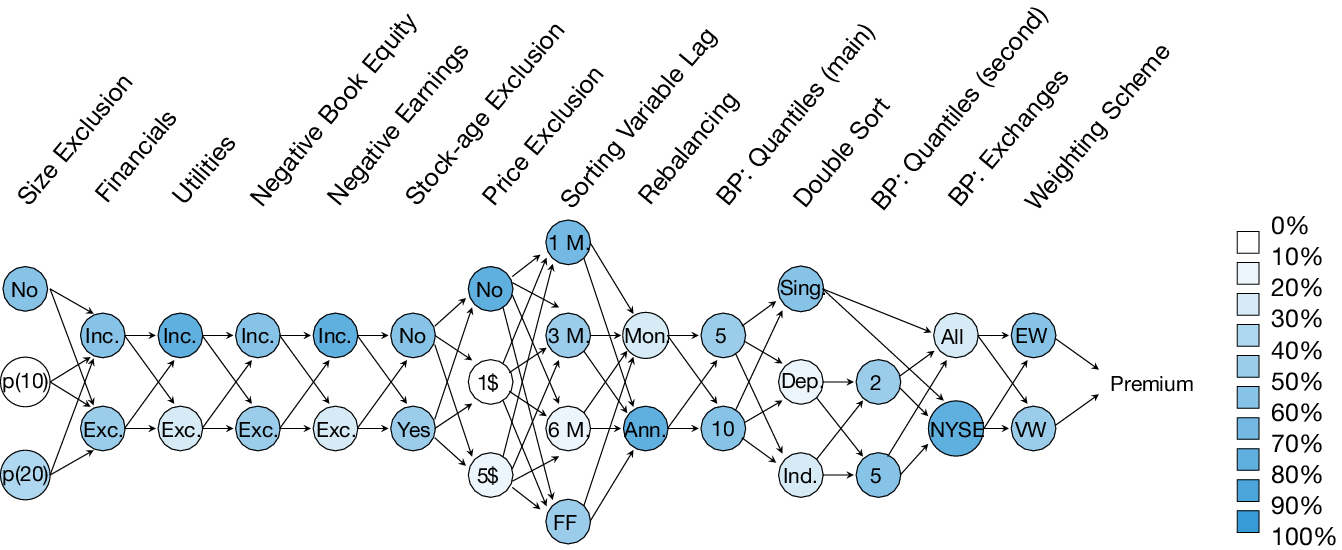
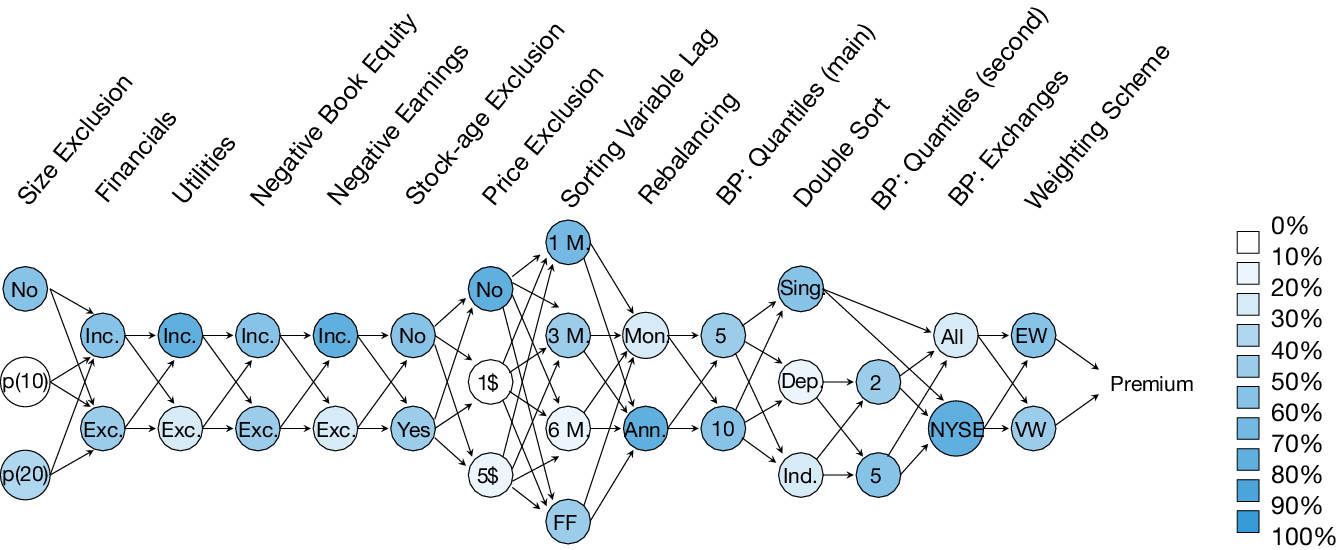
Portfolio Sorts. We estimate the premia for each sorting variable by sorting stocks into portfolios based on each of the 68 sorting variables. While portfolio sorts require many choices, for example, equal- or value-weighted portfolio returns, we control for this methodological variation: We follow Walter et al. (Reference Walter, Weber and Weiss2024) and identify 14 common methodological decisions and their choices for portfolio sorts in Figure 3 based on how often published articles implemented these choices, which we indicate by color saturation. As shown in Figure 3, we consider seven sample construction decisions, for example, whether to include or exclude small stocks, financials, utilities, or stocks with negative book equity values. Moreover, we assess seven common portfolio construction decisions, such as different lags between information arrival and portfolio formation, monthly versus annual rebalancing, 5 versus 10 portfolios, or equal- versus value-weighted portfolio returns. To implement these portfolio sorts, we adjust open-source code on GitHub from Walter et al. (Reference Walter, Weber and Weiss2024) for the (modified) new tape with updates from www.tidy-finance.org (Scheuch et al. (Reference Scheuch, Voigt and Weiss2023)).
Figure 3 shows the paths based on 14 construction decisions (forks) for a portfolio sort until the premium is estimated. The first seven forks concern the sample construction: Excluding small stocks dependent on market equity quantiles (No, smaller than p(10) or p(20)), financials (included (Inc.) or excluded (Exc.)), utilities (included or excluded), firm-months with negative book equity (included or excluded), firm-months with negative earnings (included or excluded), requiring 2 years of minimum listing as in Fama and French (Reference Fama and French1992) (Yes or No), and excluding stock prices smaller than $1, $5, or none. The subsequent seven forks belong to the portfolio construction: The lag of the sorting variables (1 month (1 M.), 3 months (3 M.), 6 months (6 M.), or a Fama and French (Reference Fama and French1992) lag (FF)), the portfolio rebalancing (monthly (Mon.) or annually (Ann.)), the number of main portfolios (5 or 10), the sorting method (single sorts (Sing.), dependent (Dep.), or independent double sorts (Ind.)), the number of secondary portfolios for double sorts (2 or 5), the exchanges for breakpoints (all stocks (All) or NYSE listed stocks (NYSE)), and the weighting scheme (equal-weights (EW) or value-weights based on the market capitalization (VW)). Note that we only allow for a sorting variable lag of 3 months, 6 months, and as in Fama and French (Reference Fama and French1992) for sorting variables updated yearly. For sorting variables updated monthly, we allow for sorting variable lags of 1, 3, and 6 months. Sorting variables updated quarterly can have a sorting variable lag of 3 or 6 months. Also, the choice to rebalance portfolios annually is naturally only available for sorting variables updated yearly and not for those updated monthly or quarterly. The color saturation indicates how often the 109 papers analyzed by Hou et al. (Reference Hou, Xue and Zhang2020) implemented each choice.
The choices in Figure 3 imply for the same sorting variable various methodological paths to estimate a premium. We define a path $ p=\left({c}_1,\dots, {c}_F\right) $
as a vector of choices
$ p=\left({c}_1,\dots, {c}_F\right) $
as a vector of choices $ {c}_f $
made at each of the 14 decision forks
$ {c}_f $
made at each of the 14 decision forks $ f=1,\dots, 14 $
. To account for this methodological variation, we estimate for each sorting variable the premia based on all paths from Figure 3, for example, 69,120 value premium estimates that differ in the choices made at each decision fork. Thus, we acknowledge the existence of methodological uncertainty (Menkveld, Dreber, Holzmeister, Huber, Johanneson, Kirchler, Razen, Weitzel, Abad, Abudy, and others (Reference Menkveld, Dreber, Holzmeister, Huber, Johanneson, Kirchler, Razen, Weitzel, Abad and Abudy2024)) and ensure that differences between premia constructed with the new, old, or modified new tape are not only prevalent for one potentially arbitrary path.
$ f=1,\dots, 14 $
. To account for this methodological variation, we estimate for each sorting variable the premia based on all paths from Figure 3, for example, 69,120 value premium estimates that differ in the choices made at each decision fork. Thus, we acknowledge the existence of methodological uncertainty (Menkveld, Dreber, Holzmeister, Huber, Johanneson, Kirchler, Razen, Weitzel, Abad, Abudy, and others (Reference Menkveld, Dreber, Holzmeister, Huber, Johanneson, Kirchler, Razen, Weitzel, Abad and Abudy2024)) and ensure that differences between premia constructed with the new, old, or modified new tape are not only prevalent for one potentially arbitrary path.
After sorting stocks into portfolios, we compute in every month $ t $
the long-minus-short portfolio return for each sorting variable
$ t $
the long-minus-short portfolio return for each sorting variable $ v $
and all paths
$ v $
and all paths $ p=1,\dots, P $
. We estimate these long-short returns (
$ p=1,\dots, P $
. We estimate these long-short returns ( $ {r}_{t,p}^{v,d} $
) with data
$ {r}_{t,p}^{v,d} $
) with data $ d\in \left\{\mathrm{old},\mathrm{new},\mathrm{modified}\;\mathrm{new}\right\} $
from the old, the new, and the modified new tape (with payouts reinvested on the payout date) separately:
$ d\in \left\{\mathrm{old},\mathrm{new},\mathrm{modified}\;\mathrm{new}\right\} $
from the old, the new, and the modified new tape (with payouts reinvested on the payout date) separately:
 $$ {r}_{t,p}^{v,d}={r}_{t,p}^{v,d,\mathrm{Long}}-{r}_{t,p}^{v,d,\mathrm{Short}}, $$
where $ {r}_{t,p}^{v,d,\mathrm{Long}} $
(
$ {r}_{t,p}^{v,d,\mathrm{Long}} $
( $ {r}_{t,p}^{v,d,\mathrm{Short}} $
) is the long (short) portfolio return. We compute the premium for each sorting variable
$ {r}_{t,p}^{v,d,\mathrm{Short}} $
) is the long (short) portfolio return. We compute the premium for each sorting variable $ v $
and each path
$ v $
and each path $ p $
as the time-series average of long-short portfolio returns. We do this separately for the old, new, and modified new tape:
$ p $
as the time-series average of long-short portfolio returns. We do this separately for the old, new, and modified new tape:
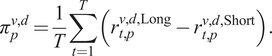 $$ {\pi}_p^{v,d}=\frac{1}{T}\sum \limits_{t=1}^T\left({r}_{t,p}^{v,d,\mathrm{Long}}-{r}_{t,p}^{v,d,\mathrm{Short}}\right). $$
This allows us to compare long-short portfolio returns and premia between different CRSP tapes. Specifically, we compute for each path the absolute difference in monthly long-short portfolio returns between the old and new tape, as well as between the new and modified new tape. Then, we average the absolute differences across all paths and months to obtain mean absolute differences (MADs) for each sorting variable:
 $$ {MAD}^v=\frac{1}{T}\frac{1}{P}\sum \limits_{t=1}^T\sum \limits_{p=1}^P\left|{r}_{t,p}^{v,\mathrm{new}}-{r}_{t,p}^{v,\mathrm{old}\hskip1em \left(\mathrm{modified}\hskip0.42em \mathrm{new}\right)}\right|. $$
Correspondingly, we compute absolute differences for each sorting variable between premia based on the new and old (modified new) tape by averaging across paths:
 $$ {AD}^v=\frac{1}{P}\sum \limits_{p=1}^P\left|\hskip0.1em {\pi}_p^{v,\mathrm{new}}-{\pi}_p^{v,\mathrm{old}\hskip1em \left(\mathrm{modified}\hskip0.42em \mathrm{new}\right)}\hskip0.1em \right|. $$
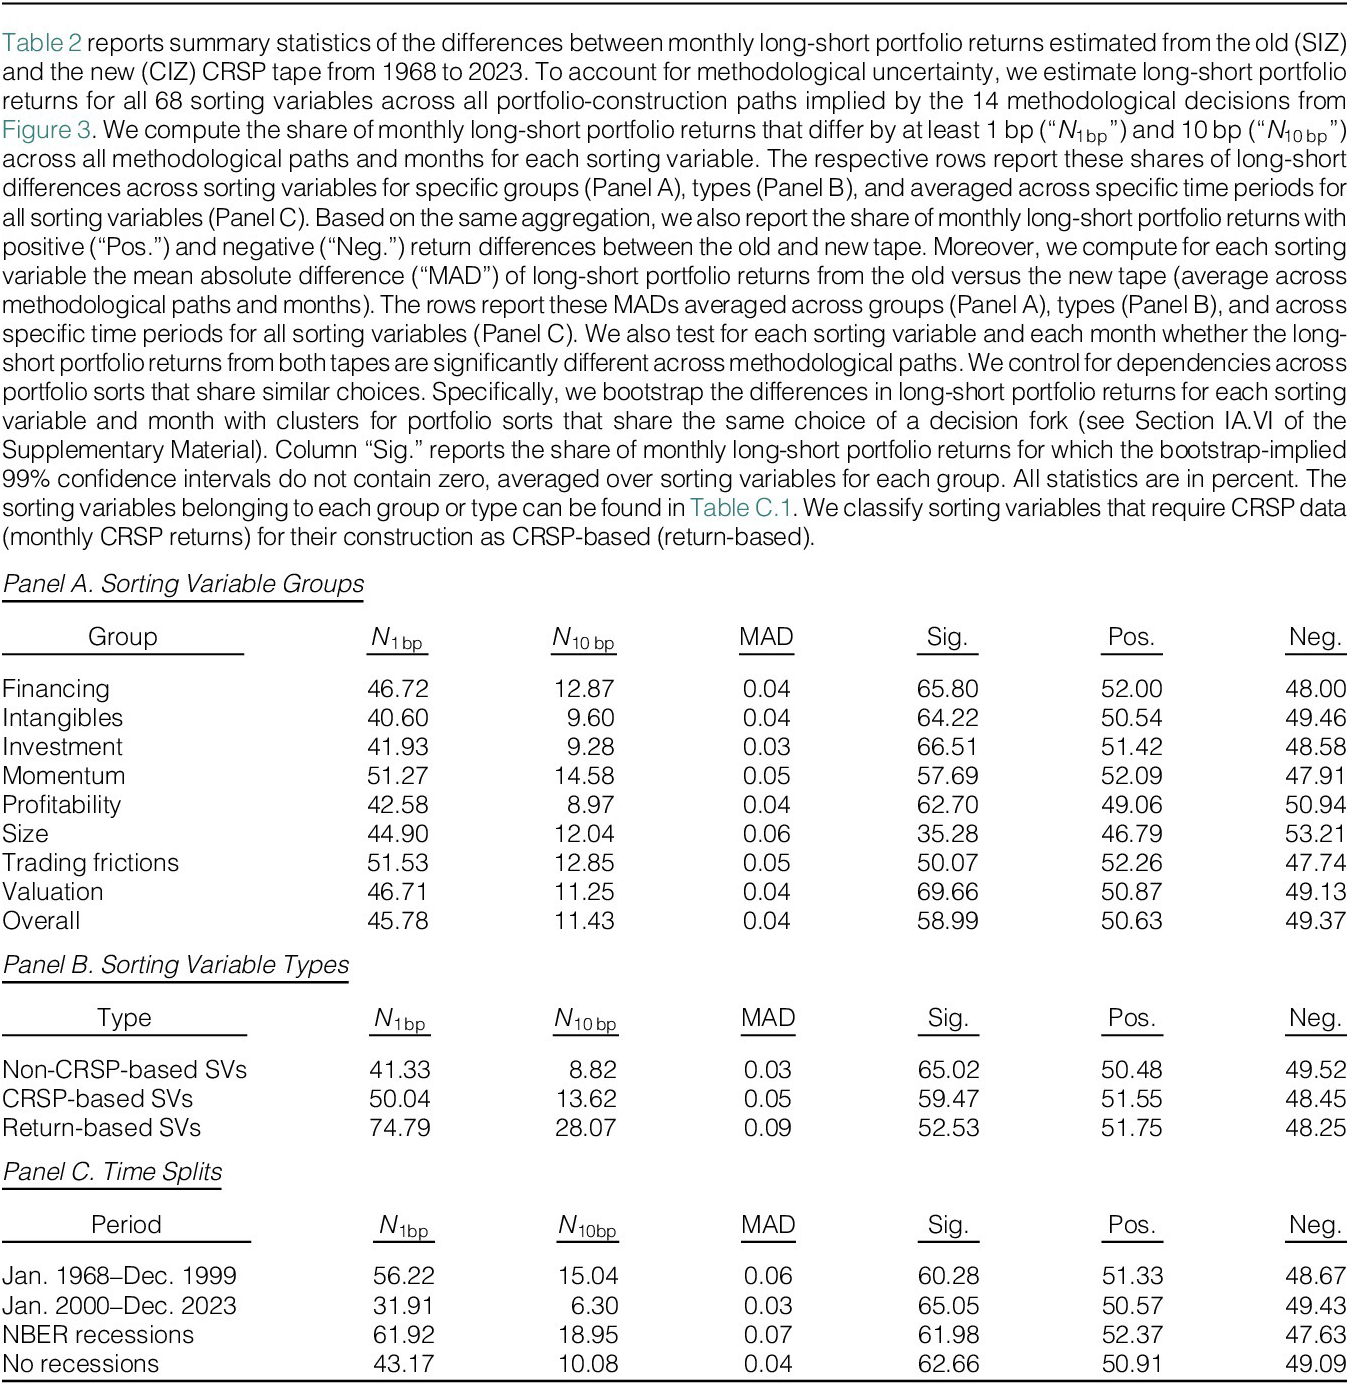
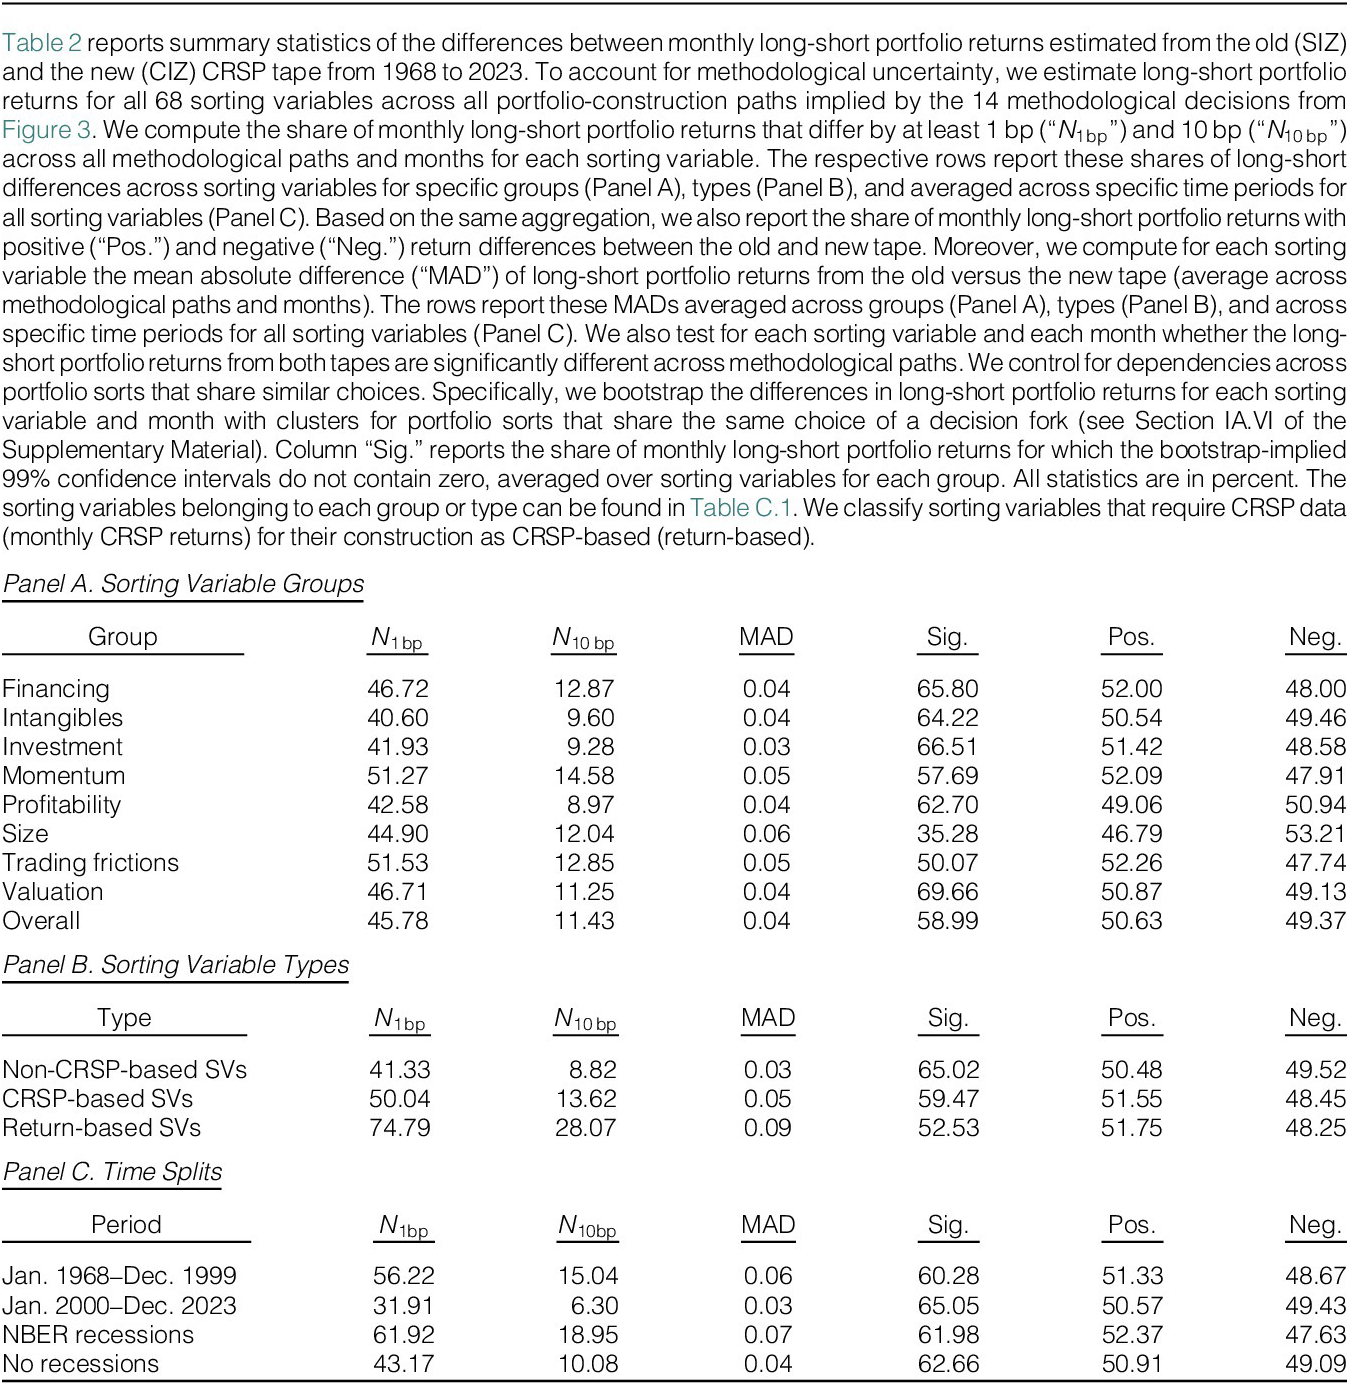
Additionally, we test whether the long-short portfolio return differences between the old and new tape (“Sig.” in Table 2) are significant. Portfolio sorts that share the same choice of a decision fork, but differ in other (potentially less relevant) choices, might not be independent. To control for these dependencies, we set up clusters for all portfolio sorting choices from Figure 3 and assign portfolio sorts that make the respective choice to these clusters. Then, we repeatedly sample differences in long-short portfolio returns based on these clusters for every sorting variable and month. Finally, we determine for each sorting variable how many of the bootstrap-implied 99% confidence intervals for the differences in long-short portfolio returns do not contain zero (see Section IA.VI of the Supplementary Material).Footnote 26
How Do CRSP Changes Impact Portfolio Returns? The return changes across the old, new, and modified new tape affect portfolio sorts in two ways: First, monthly portfolio returns can change when aggregating monthly stock returns with differences between tapes into portfolio returns. However, it is unclear how the documented return changes affect portfolio returns as we aggregate potentially positive and negative stock return differences. For example, one might systematically sort stocks with positive (negative) return differences between tapes predominantly into one portfolio, for example, the long portfolio. If this is the case, CRSP return changes would systematically alter premia.Footnote 27
Second, the impact of CRSP return changes can go beyond the impact induced by aggregating monthly stock returns into portfolio returns for sorting variables that are constructed based on monthly stock returns, for example, 11-month return momentum. For these sorting variables, the CRSP return changes directly alter the sorting variable before sorting stocks into portfolios. These construction changes can potentially change the cross-sectional rank of affected observations and, in turn, lead to differences in estimated premia. Hence, we flag all sorting variables that directly use monthly returns from CRSP with a superscript R.Footnote 28 For these predictors constructed with monthly returns, it is even more unclear how the CRSP changes between both tapes impact estimated portfolio returns and premia. Changes in the cross-sectional ranking of stocks can lead to differences along many steps of the portfolio sorting procedure, that is, when we compute portfolio breakpoints. Thus, we expect a potentially larger impact of CRSP changes for sorting variables that are directly constructed from monthly return data.
B. Differences in Return Premia Between Tapes
After sorting stocks into portfolios based on a sorting variable, we compute for all 68 sorting variables monthly long-short portfolio returns and their time-series averages (premia) over various methodological paths. For example, we compute 69,120 value premium estimates that emerge from all possible combinations of the methodological choices for portfolio sorts in Figure 3. We start by comparing monthly long-short portfolio returns computed with data from the old tape with those based on data from the new tape. Table 2 reports the share of these long-short portfolio returns that differ by more than 1 bp (“N $ {}_{1\hskip0.24em \mathrm{bp}} $
”) and by more than 10 bp (“N
$ {}_{1\hskip0.24em \mathrm{bp}} $
”) and by more than 10 bp (“N $ {}_{10\hskip0.24em \mathrm{bp}} $
”) when constructing them based on both tapes separately. We compute these shares of monthly returns that differ between both tapes by averaging across all methodological paths, months, and finally across all sorting variables that belong to the respective group in the first rows of Panel A in Table 2.
$ {}_{10\hskip0.24em \mathrm{bp}} $
”) when constructing them based on both tapes separately. We compute these shares of monthly returns that differ between both tapes by averaging across all methodological paths, months, and finally across all sorting variables that belong to the respective group in the first rows of Panel A in Table 2.
We find the largest share of long-short portfolio returns that differ by at least 10 bp between both CRSP tapes for momentum variables and their methodological paths (14.58%). In contrast, we find the lowest share for profitability-related variables, as 8.97% of their monthly long-short portfolio returns differ by at least 10 bp between both CRSP tapes. Across all groups of sorting variables, 11.43% (45.78%) of all monthly long-short portfolio returns differ by more than 10 (1) bp.Footnote 29 Notably, the share of long-short returns that differ by at least 10 bp when using data from the old versus the new tape is at least 5.6% for all sorting variables separately, as shown in Table IA.10 in the Supplementary Material. To get a perspective on the size of these differences, we compute the mean absolute difference of monthly long-short returns between the tapes averaged across all methodological paths and months. These mean absolute differences are around 4 bp per month (column “MAD”) across all groups of sorting variables. Moreover, the bootstrap procedure indicates that in 59% of the months, the differences in long-short portfolio returns across all methodological paths and groups are statistically different from zero at the 1% level (column “Sig.”).Footnote 30
Panel B of Table 2 reports that the differences in long-short portfolio returns are more pronounced for sorting variables that are directly constructed from monthly returns. For those return-based sorting variables, we find that more than a fourth (28.07%) of all monthly long-short returns across all methodological paths exceed a difference of 10 bp when comparing them across the old and new CRSP tape. The mean absolute difference of these long-short returns for all return-based sorting variables is around 9 bp per month.
Next, we investigate differences in monthly long-short portfolio returns across all sorting variables and their methodological paths during early sample periods and recessions in Panel C of Table 2. For samples prior to 2000 and during NBER recessions, we find, on average, almost twice as many monthly long-short returns that differ by more than 10 bp compared to the period after 2000 and compared to non-NBER recession months. In particular, prior to 2000 and during NBER recessions, around 15.04% and 18.95% of all monthly long-short returns differ by at least 10 bp. The corresponding mean absolute differences are about 6 and 7 bp per month, respectively.
Overall, the results of Table 2 suggest that the CRSP changes in the new tape alter monthly long-short portfolio returns by far more than they change monthly stock returns. While about 10% of the monthly stock returns differ at the 1 bp threshold level between the old and new CRSP tape, our results show that a similar share of monthly long-short portfolio returns (11.43%) differ even at the 10 bp level. This suggests that portfolio sorts amplify the CRSP return changes throughout the sorting procedure.
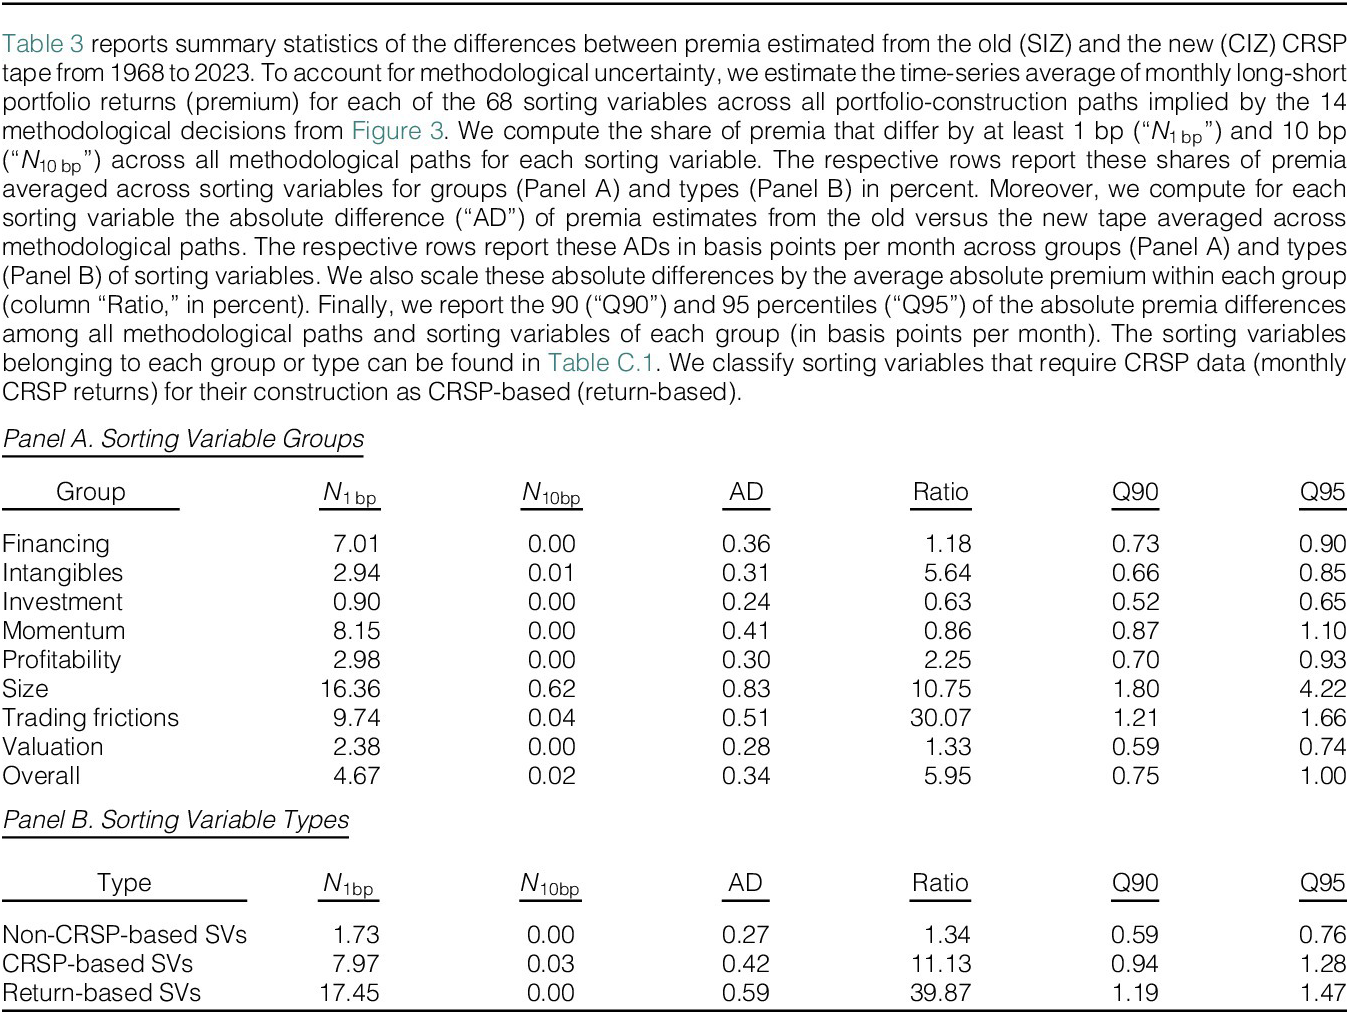
Unconditional Return Premia. In the next step, we investigate whether these significantly altered monthly long-short returns lead to different return premia, that is, differences in the time-series averages of the monthly long-short returns. Surprisingly, our results reveal that changing from the old to the new tape does not materially change premia. Table 3 reports the share of premia that differ between both tapes, averaged across all methodological paths for groups of sorting variables in Panel A and for types of sorting variables in Panel B. On average, only 0.02% (4.67%) of all premia across all groups and their methodological paths differ between the old and new tape at the 10 bp (1 bp) level.
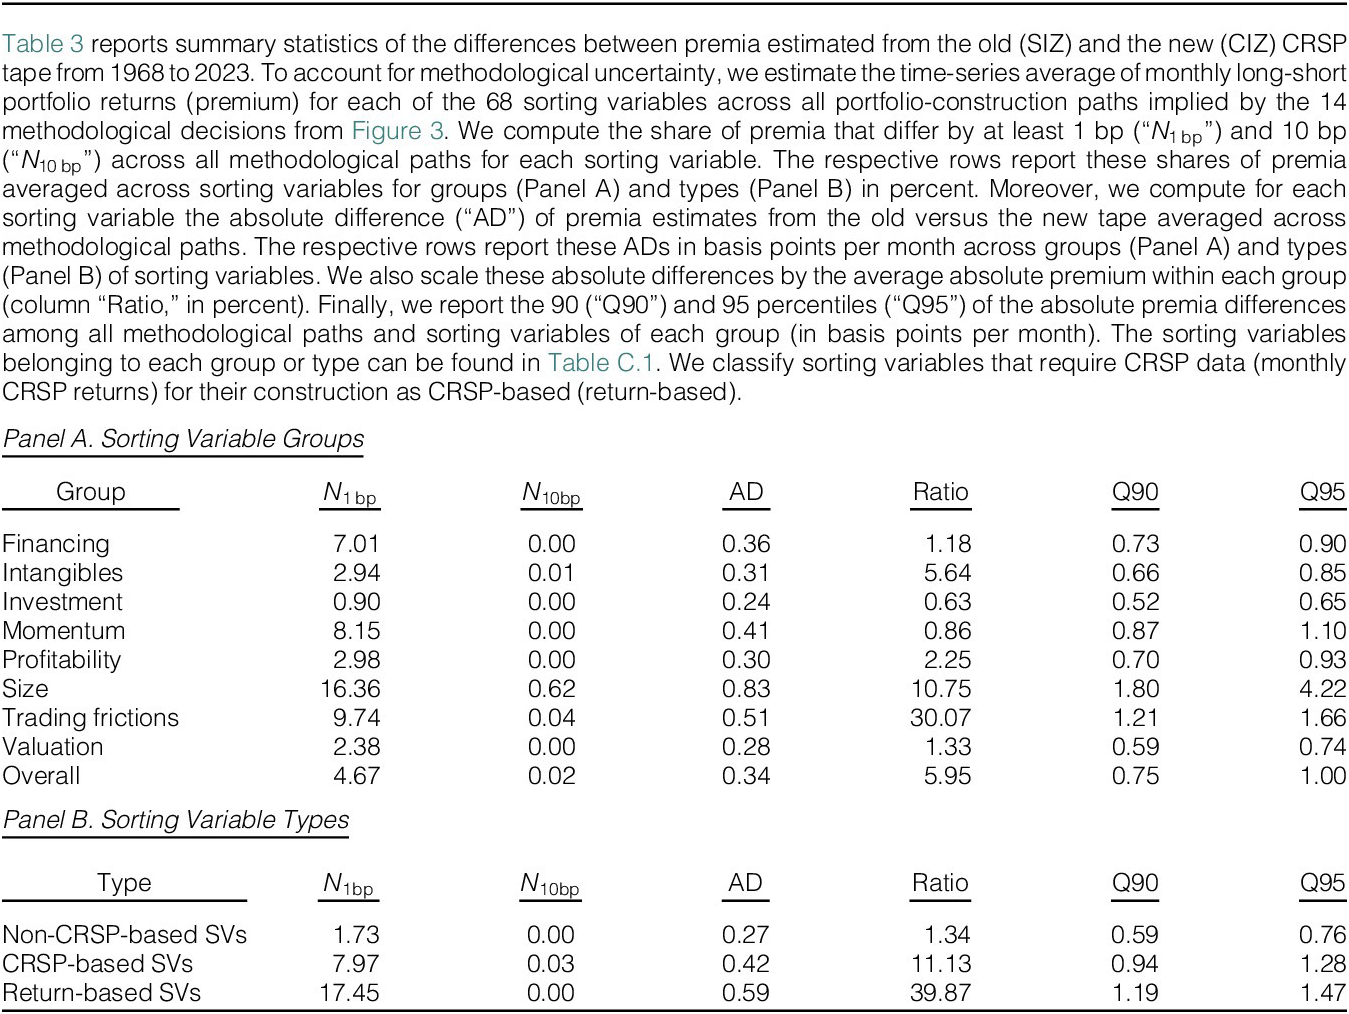
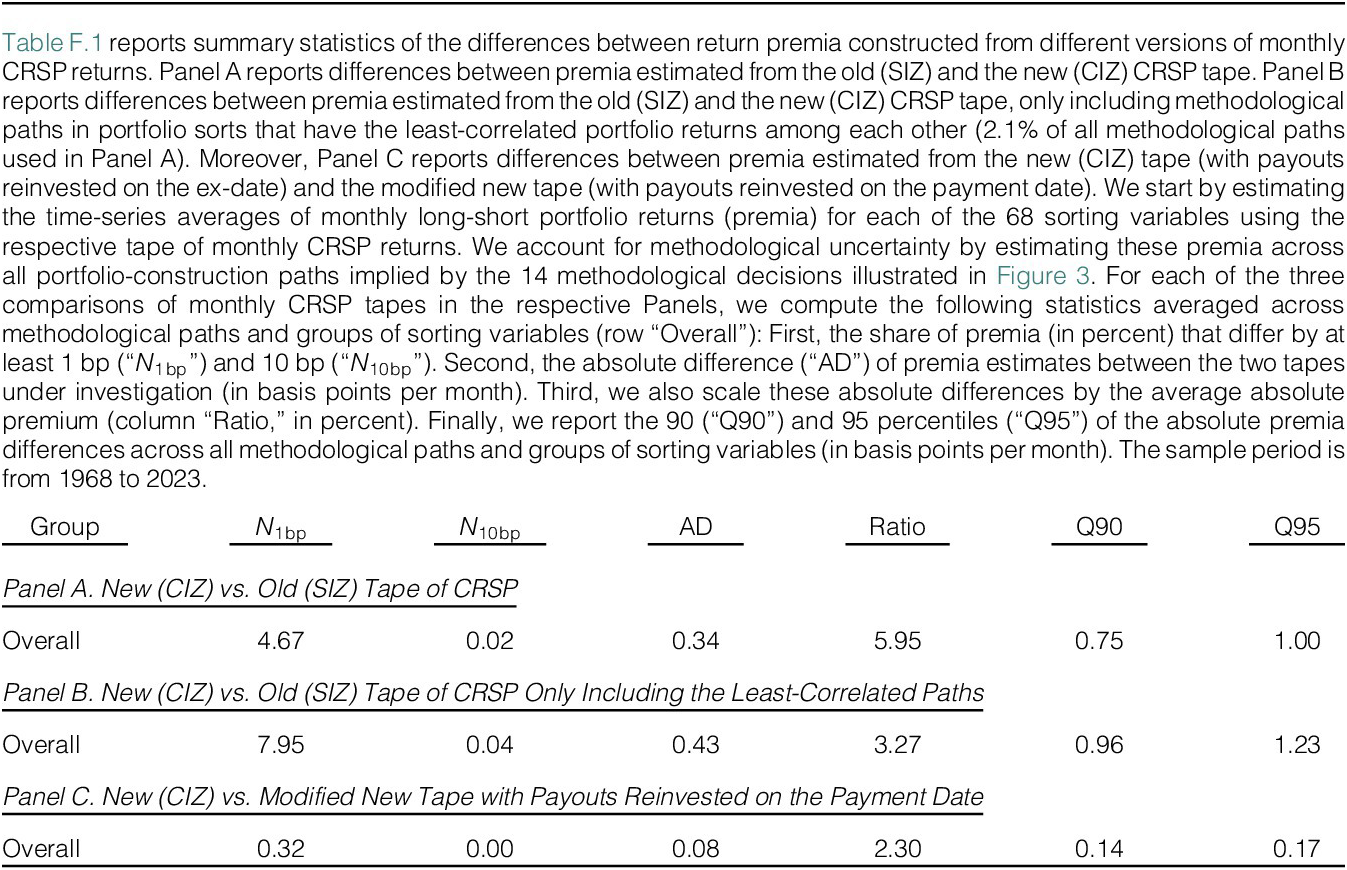
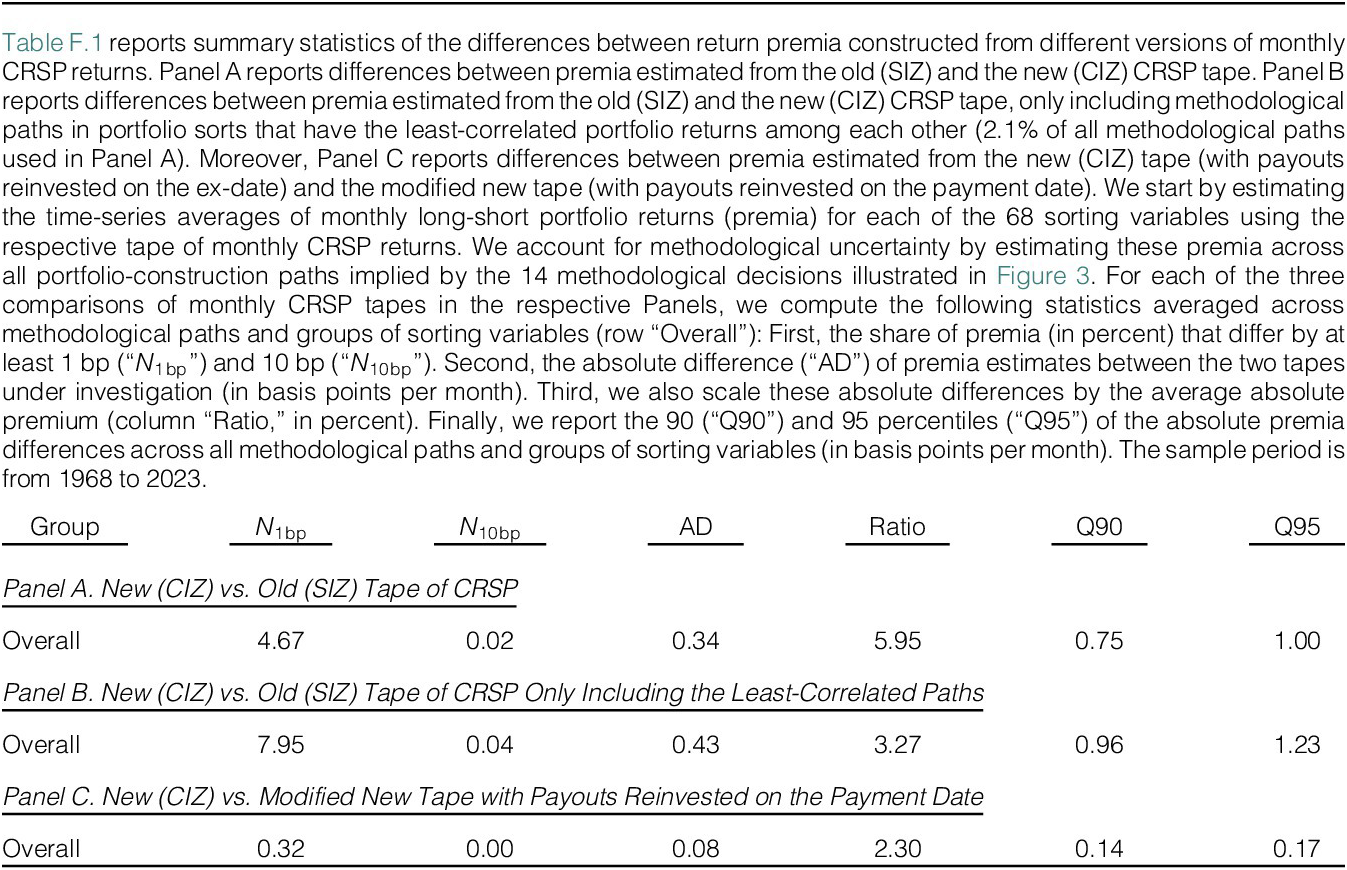
Moreover, for each sorting variable, we compute the average absolute difference between premia constructed with the old versus the new tape by averaging across all methodological paths. These absolute differences (column “AD”) between the premia from the old versus the new tape range from 0.24 bp for all investment related variables to 0.83 bp for the size group. Across all groups of sorting variables and their methodological paths, return premia differ on average by 0.34 bp, which is only about 5.95% (column “Ratio”) of the average absolute premium. Panel B reports similar results for the return-based sorting variables with premia differences of, on average, 0.59 bp.
Even looking at the many methodological paths suggests only small differences in premia for sorting variables belonging to each group: For the methodological paths that generate the 5% largest differences in premia (column “Q95”), we find only absolute differences of at least 1 bp across all sorting variables and 1.47 bp across return-based sorting variables. These results also hold for all sorting variables separately (Table IA.11 in the Supplementary Material) and for CAPM alphas relative to the market factor (Table IA.13 in the Supplementary Material).
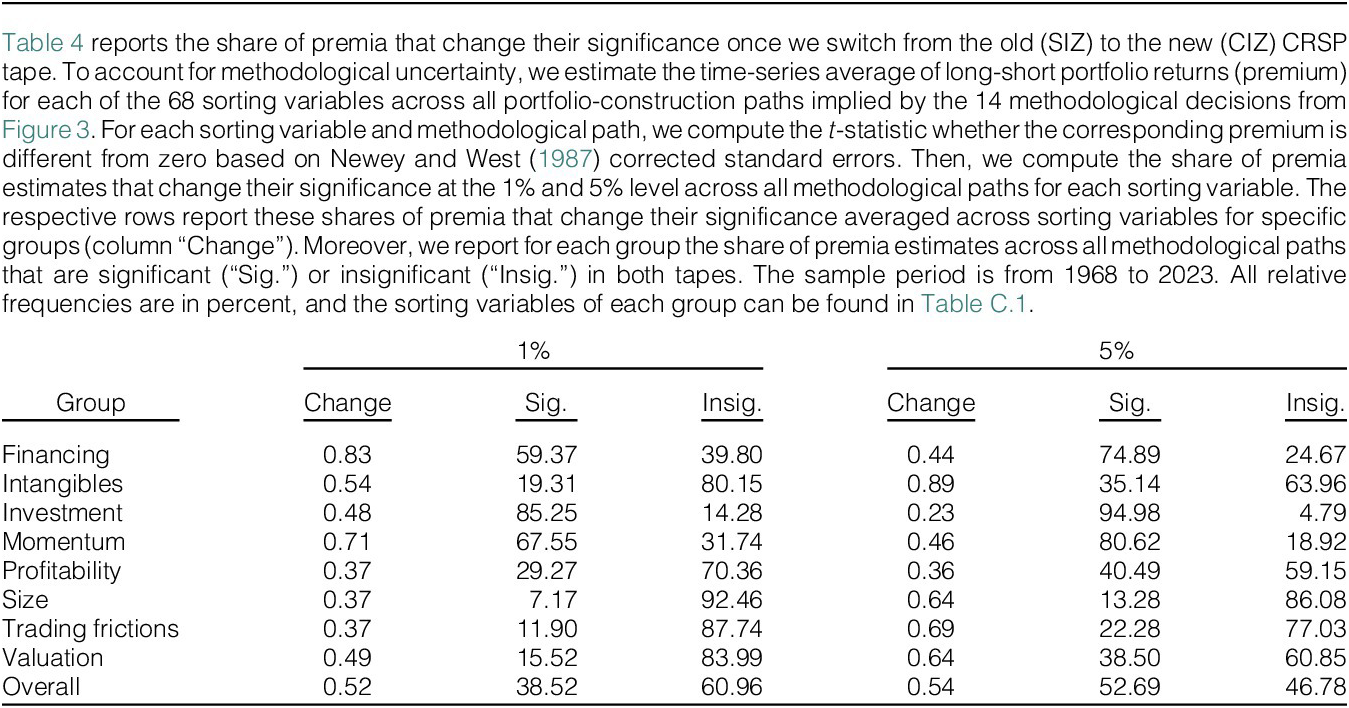
In line with the small absolute differences in premia, we find that only a few premia estimates change their significance once we switch from the old (SIZ) to the new (CIZ) CRSP tape. Specifically, Table 4 reports that only 0.52% and 0.54% of all methodological paths generate premia estimates across all sorting variables that change their significance at the 1% and 5% significance levels, respectively.
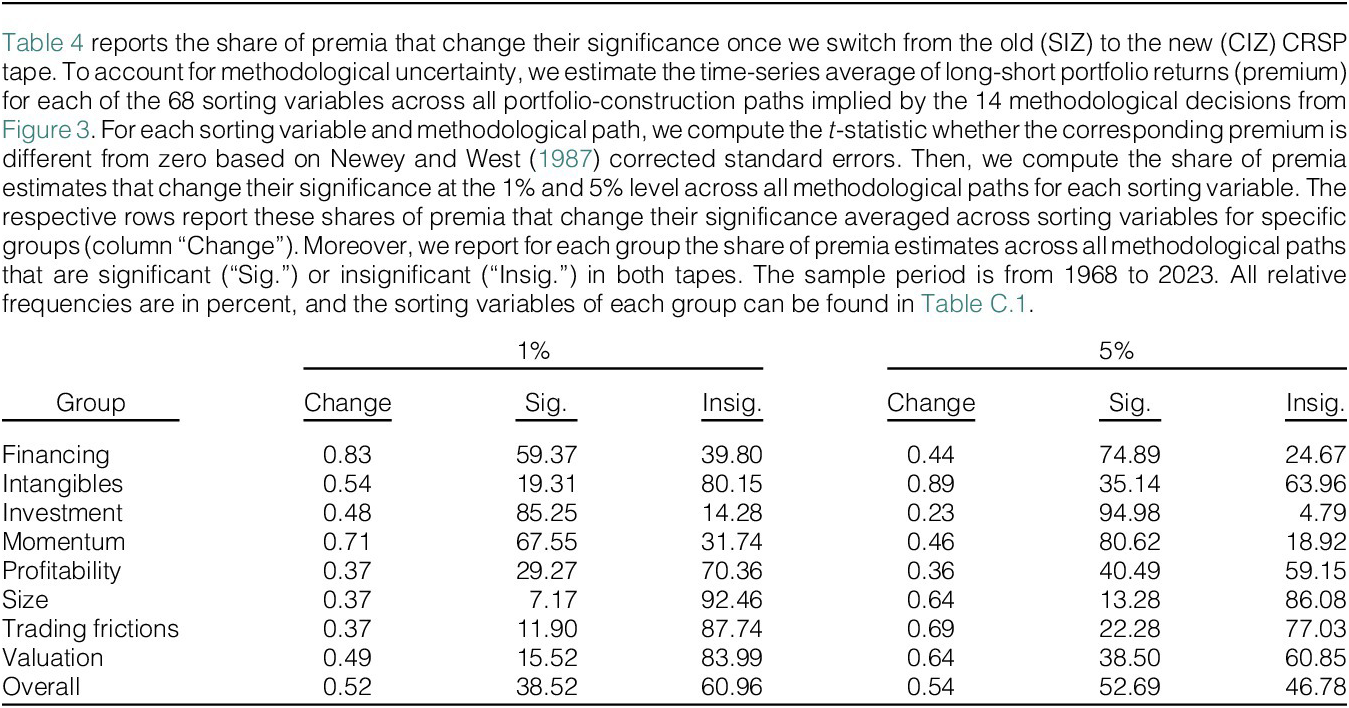
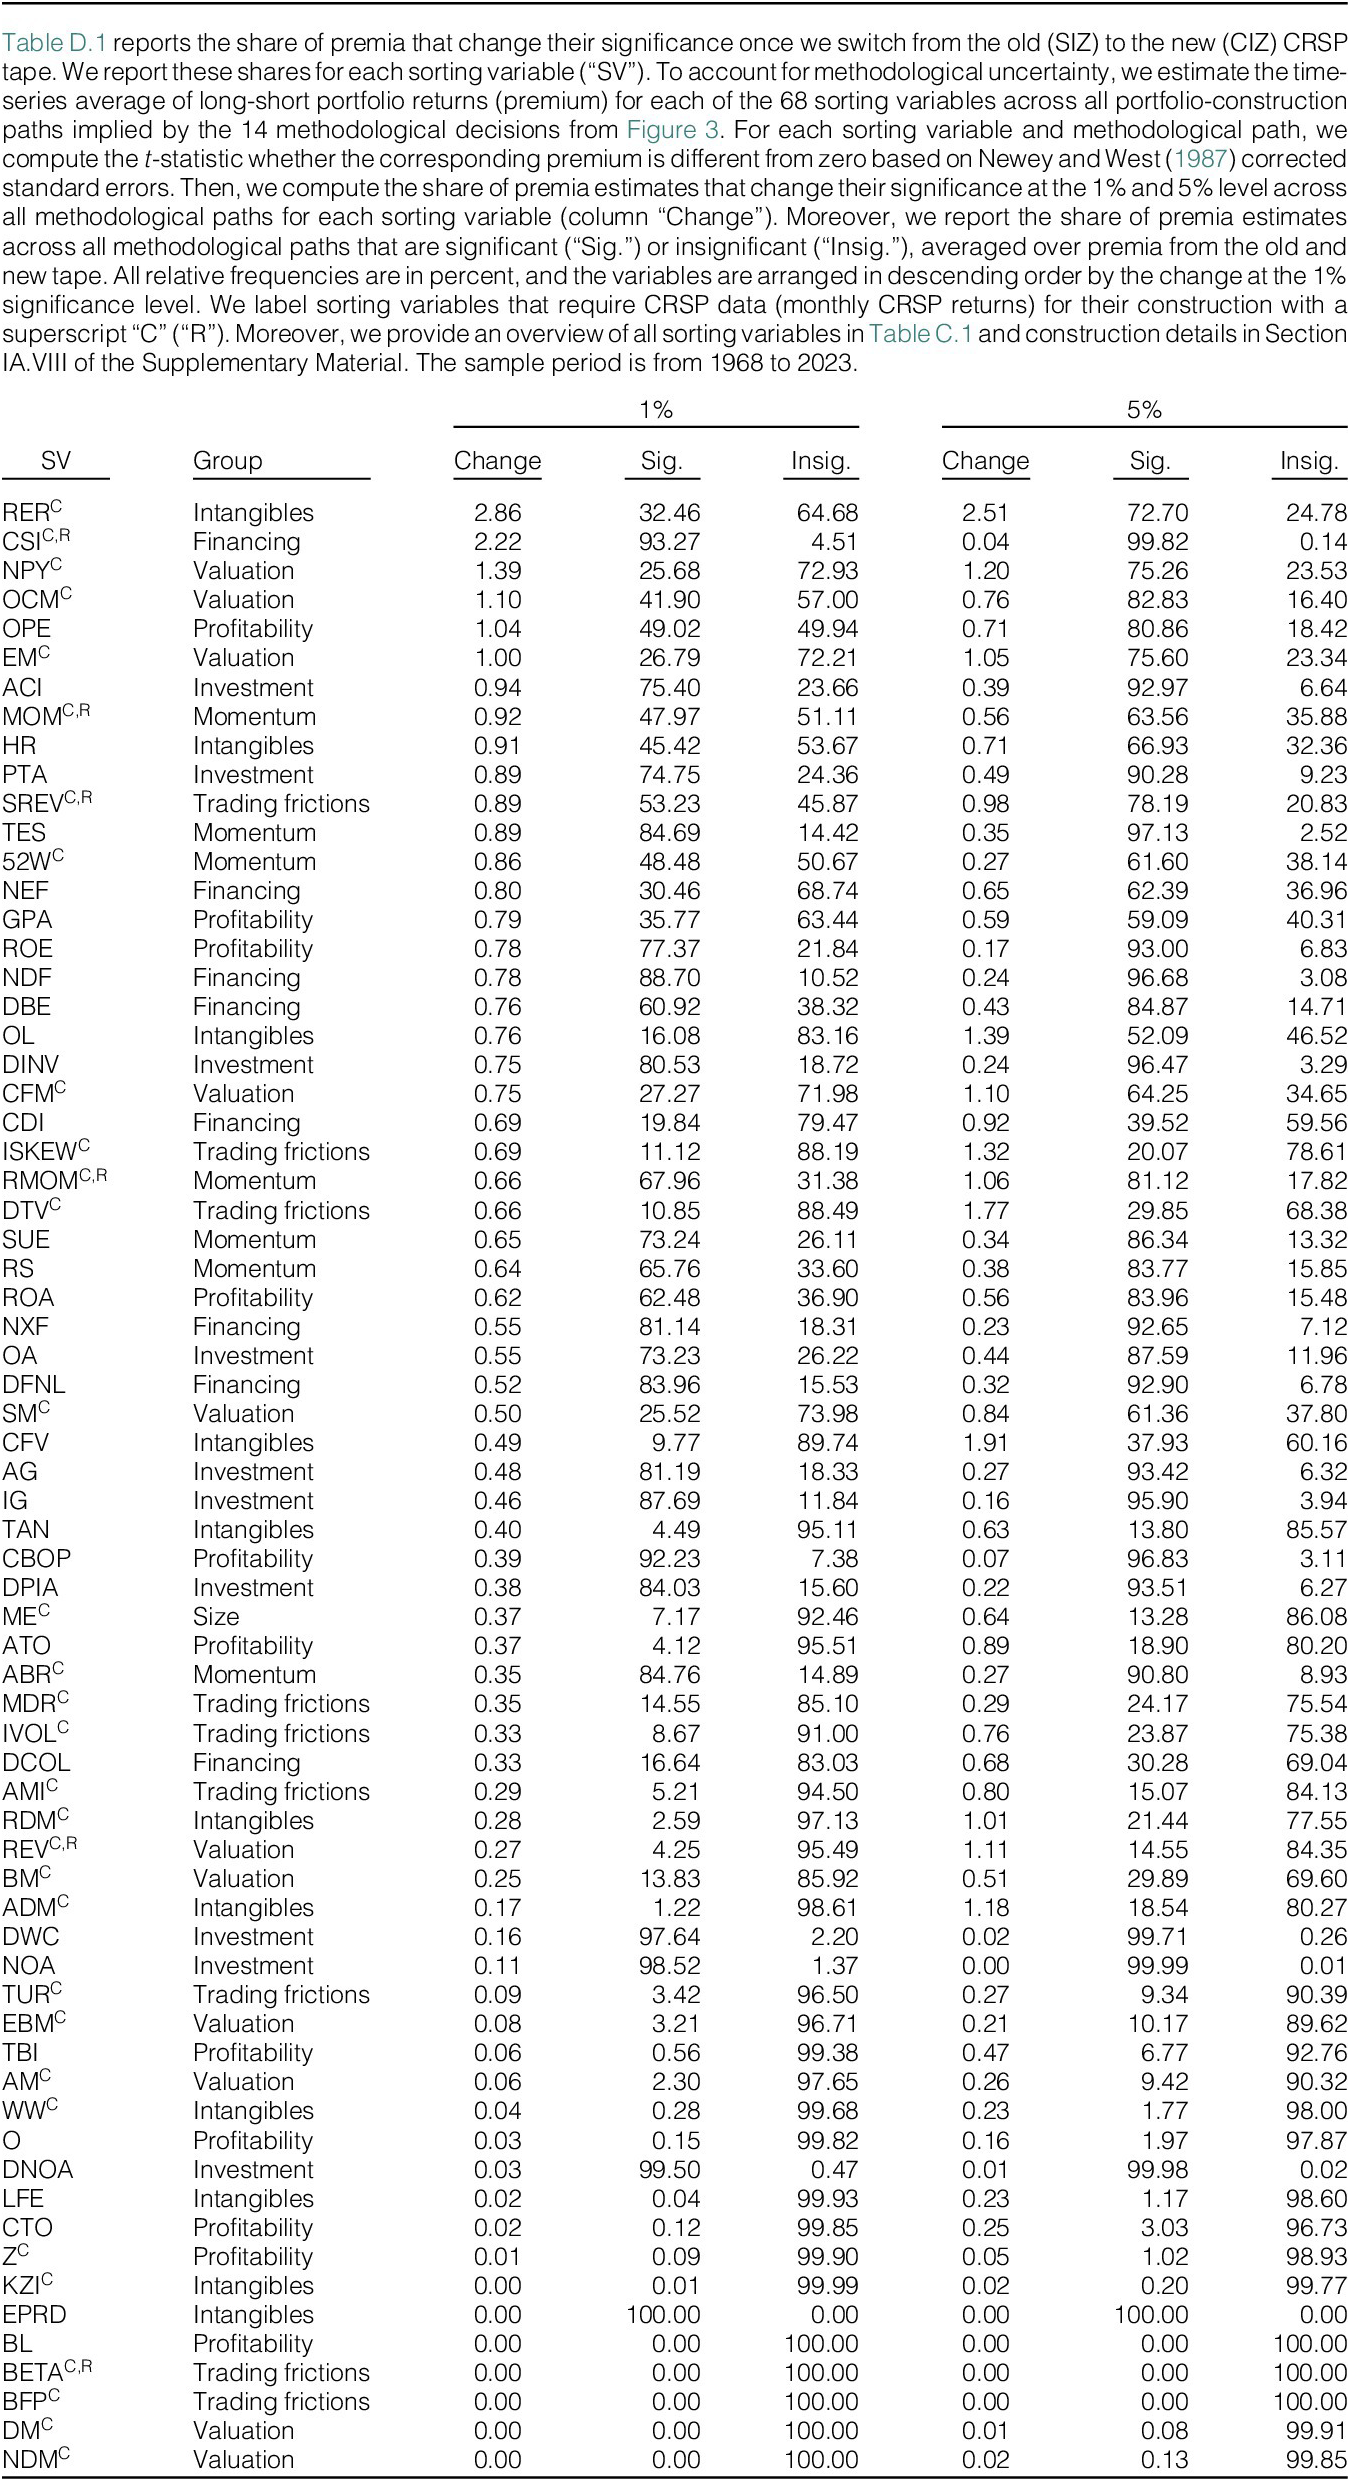
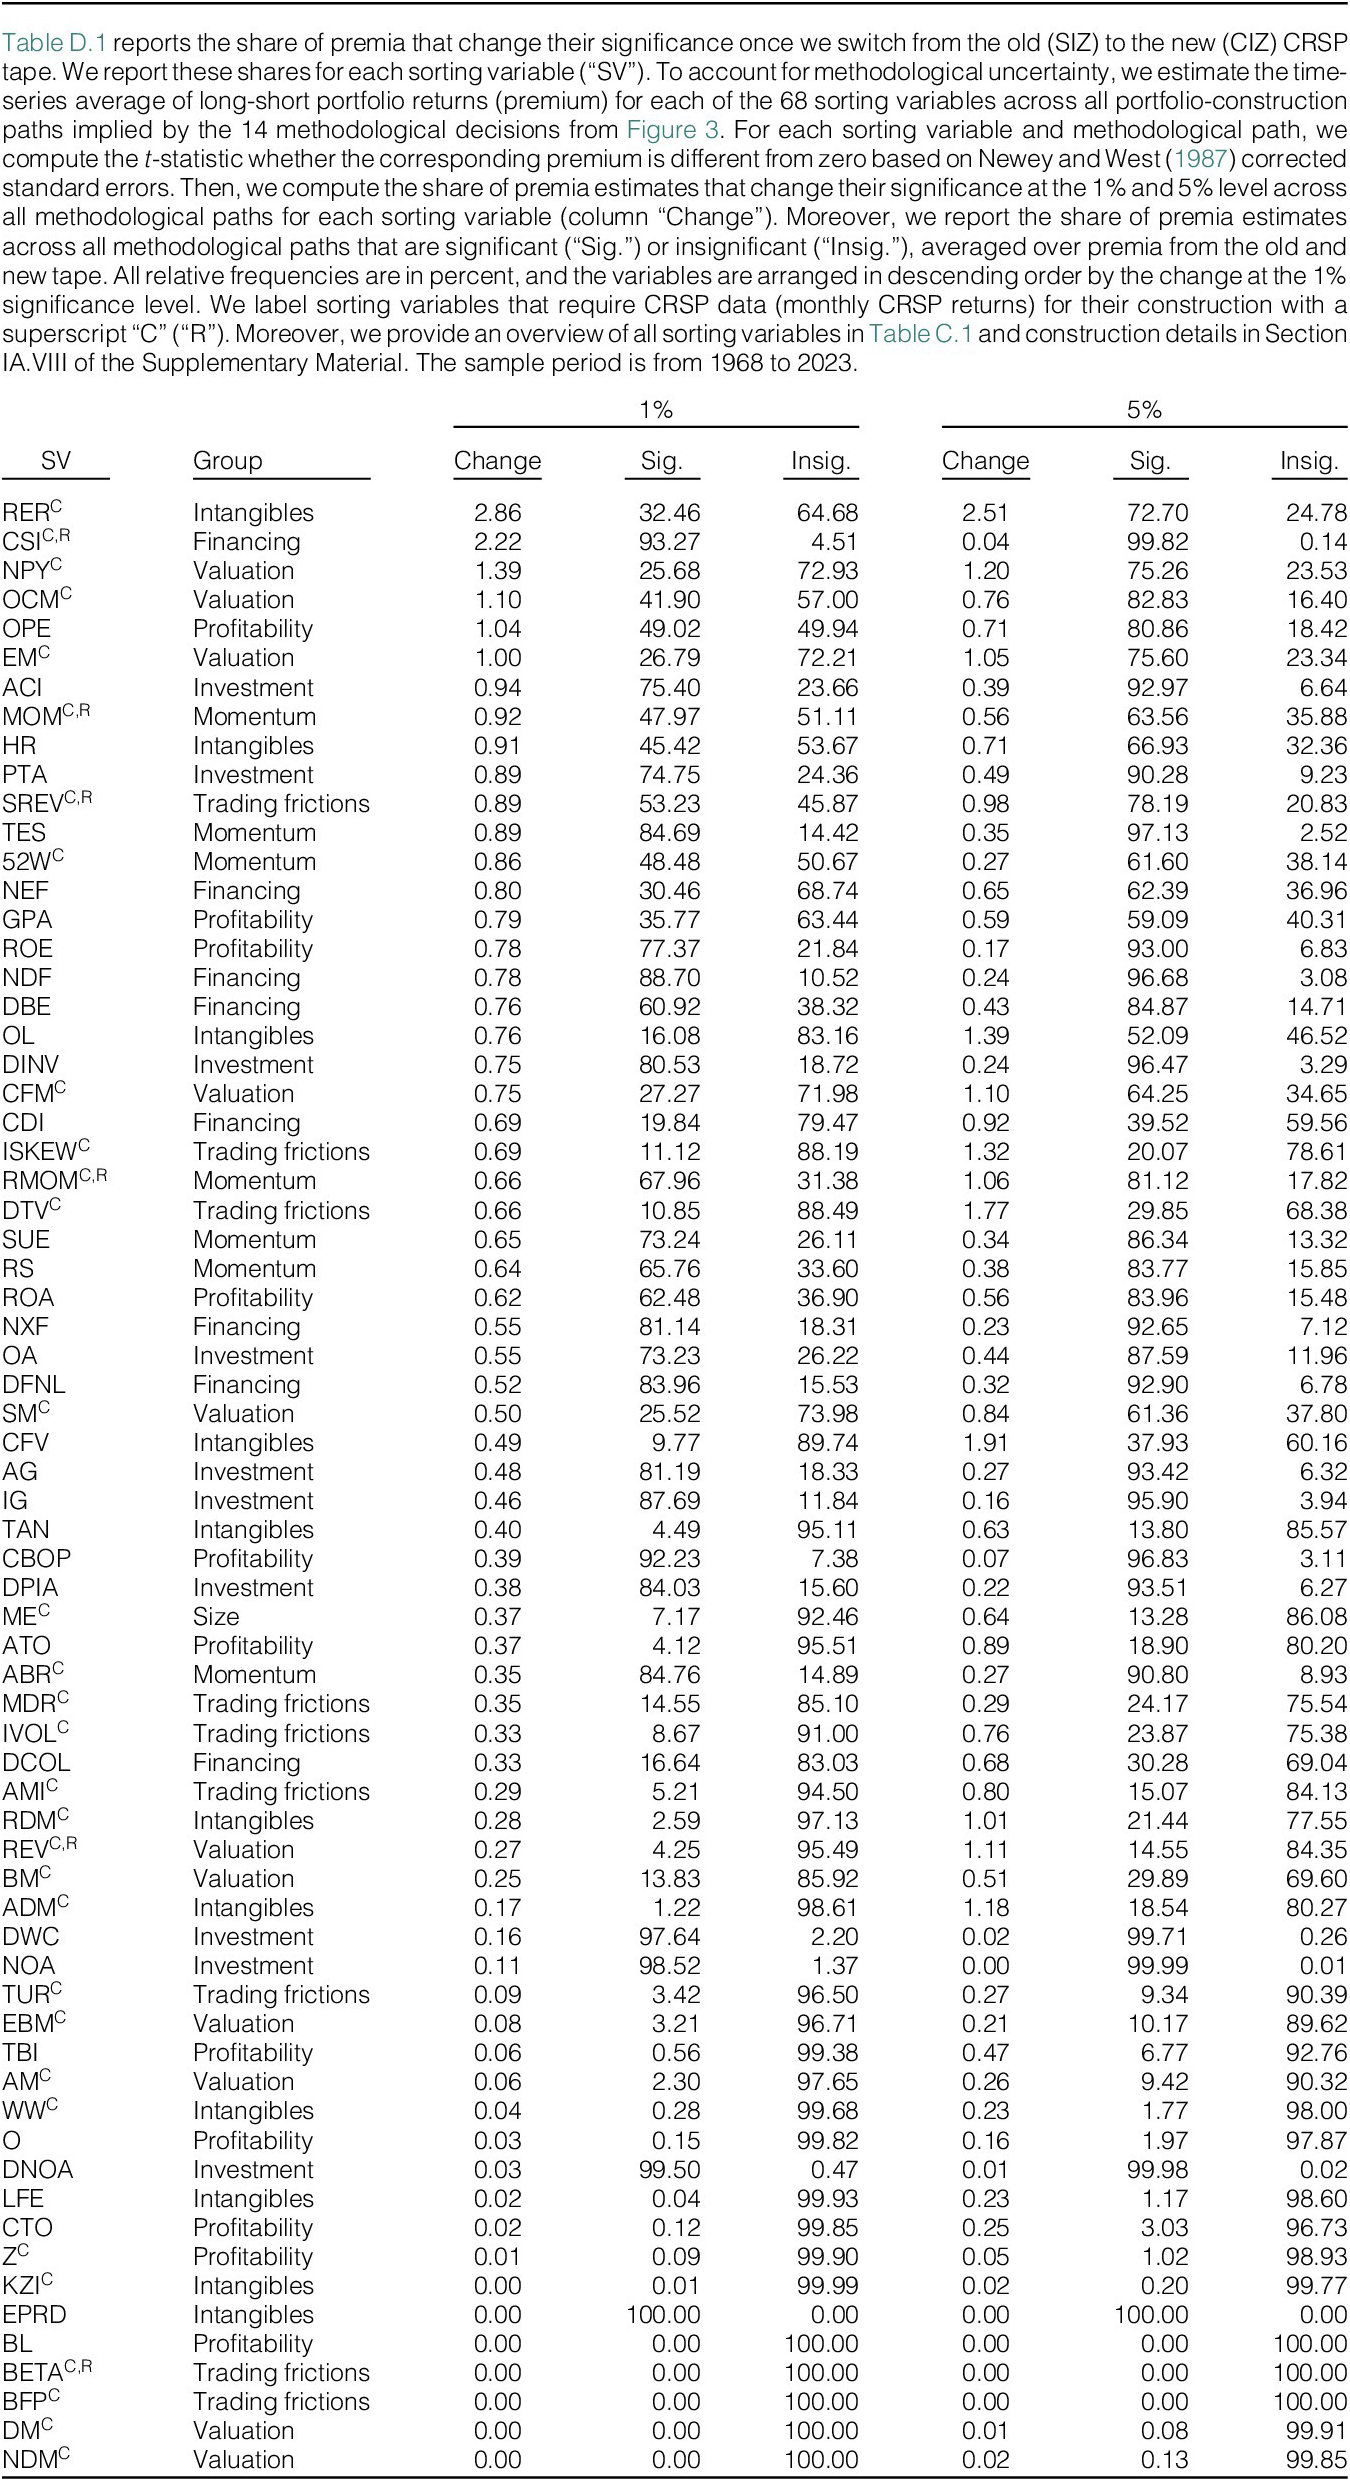
The changes are similar among groups of sorting variables, ranging from 0.37% to 0.83% for the 1% significance level. We find that none of the sorting variables has more than 2.9% of methodological paths that change the significance of premia at the 1% level between the old (SIZ) and the new (CIZ) CRSP tape (Table D.1).Footnote 31
While we show that changing from the old to the new CRSP tape does not systematically alter premia, the question remains whether reinvesting payouts on the payment date as opposed to the ex-date might substantially alter premia. Thus, we repeat the same analysis and compare premia based on data from the new CRSP tape, in which payouts are reinvested on the ex-date, with premia based on the same tape but with payouts reinvested on the payment date. In line with the change from the old to the new tape, we find that reinvesting payouts on the payment date as opposed to the ex-date also does not materially change premia (Panel C of Table F.1) nor the significance of these premia estimates (Panel C of Table F.2) across all groups of sorting variables.
Conditional Return Premia. While unconditional premia are largely unaffected by the CRSP changes, we also investigate whether the CRSP changes affect the cyclicality of premia. Investigating premia conditional on the business cycle might be a natural starting point where CRSP changes potentially matter, as differences in monthly long-short portfolio returns are almost twice as frequent and large during NBER recessions relative to all other months (see Table 2). To provide comprehensive evidence, we identify cyclical premia in our sample and regress the respective monthly long-short portfolio returns on the NBER recession dummy as a realized business cycle indicator. We estimate these NBER regression coefficients for the same sorting variable across various long-short portfolio returns, which we estimate by varying methodological choices in portfolio sorts.Footnote 32
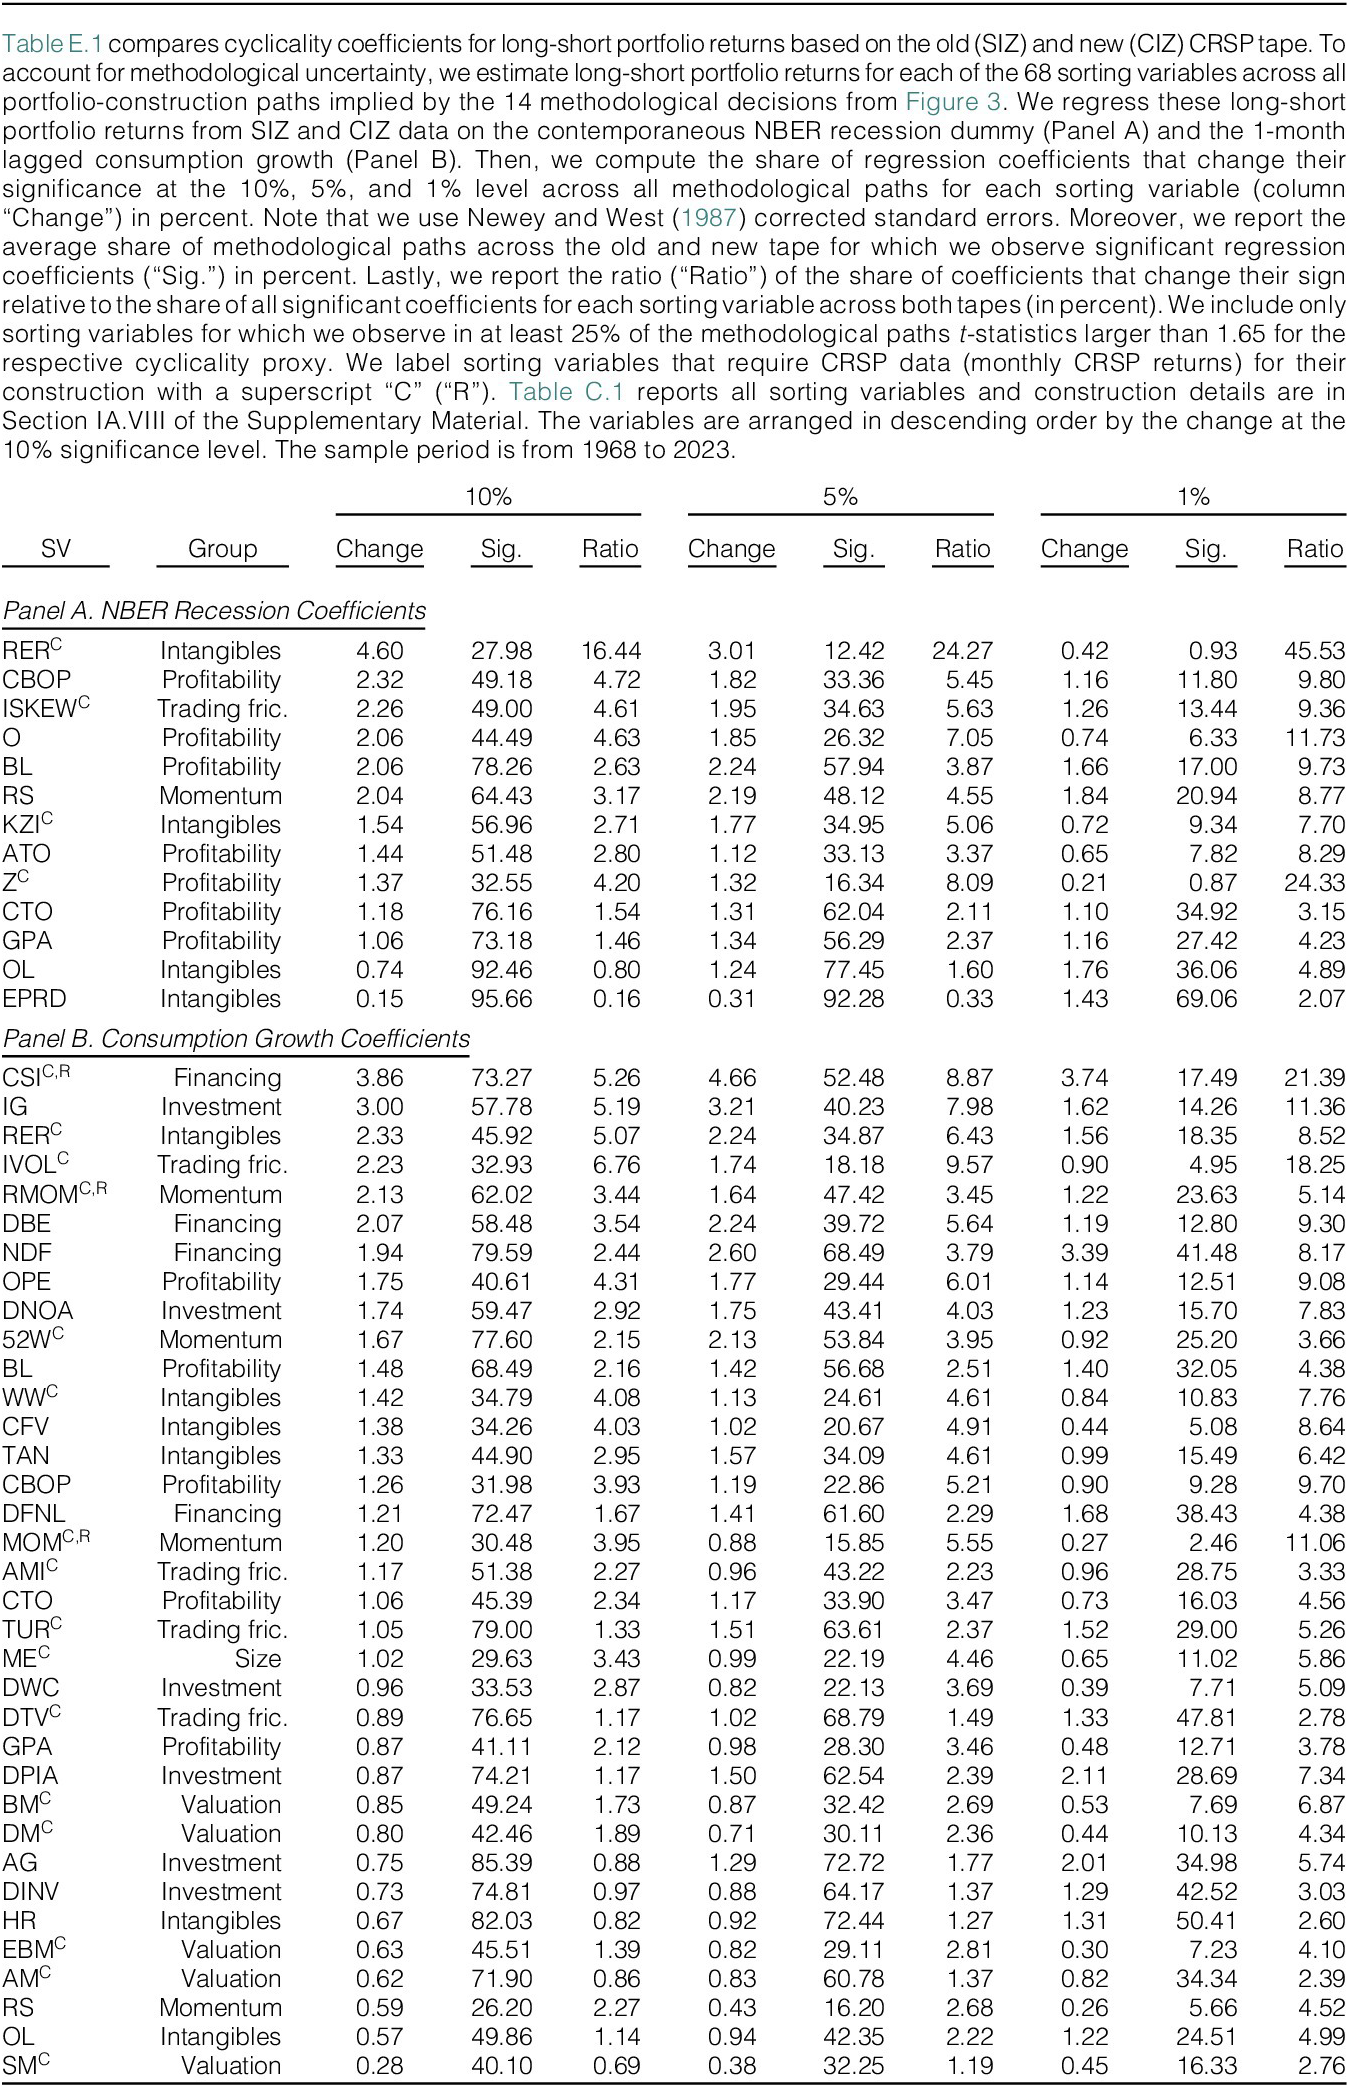
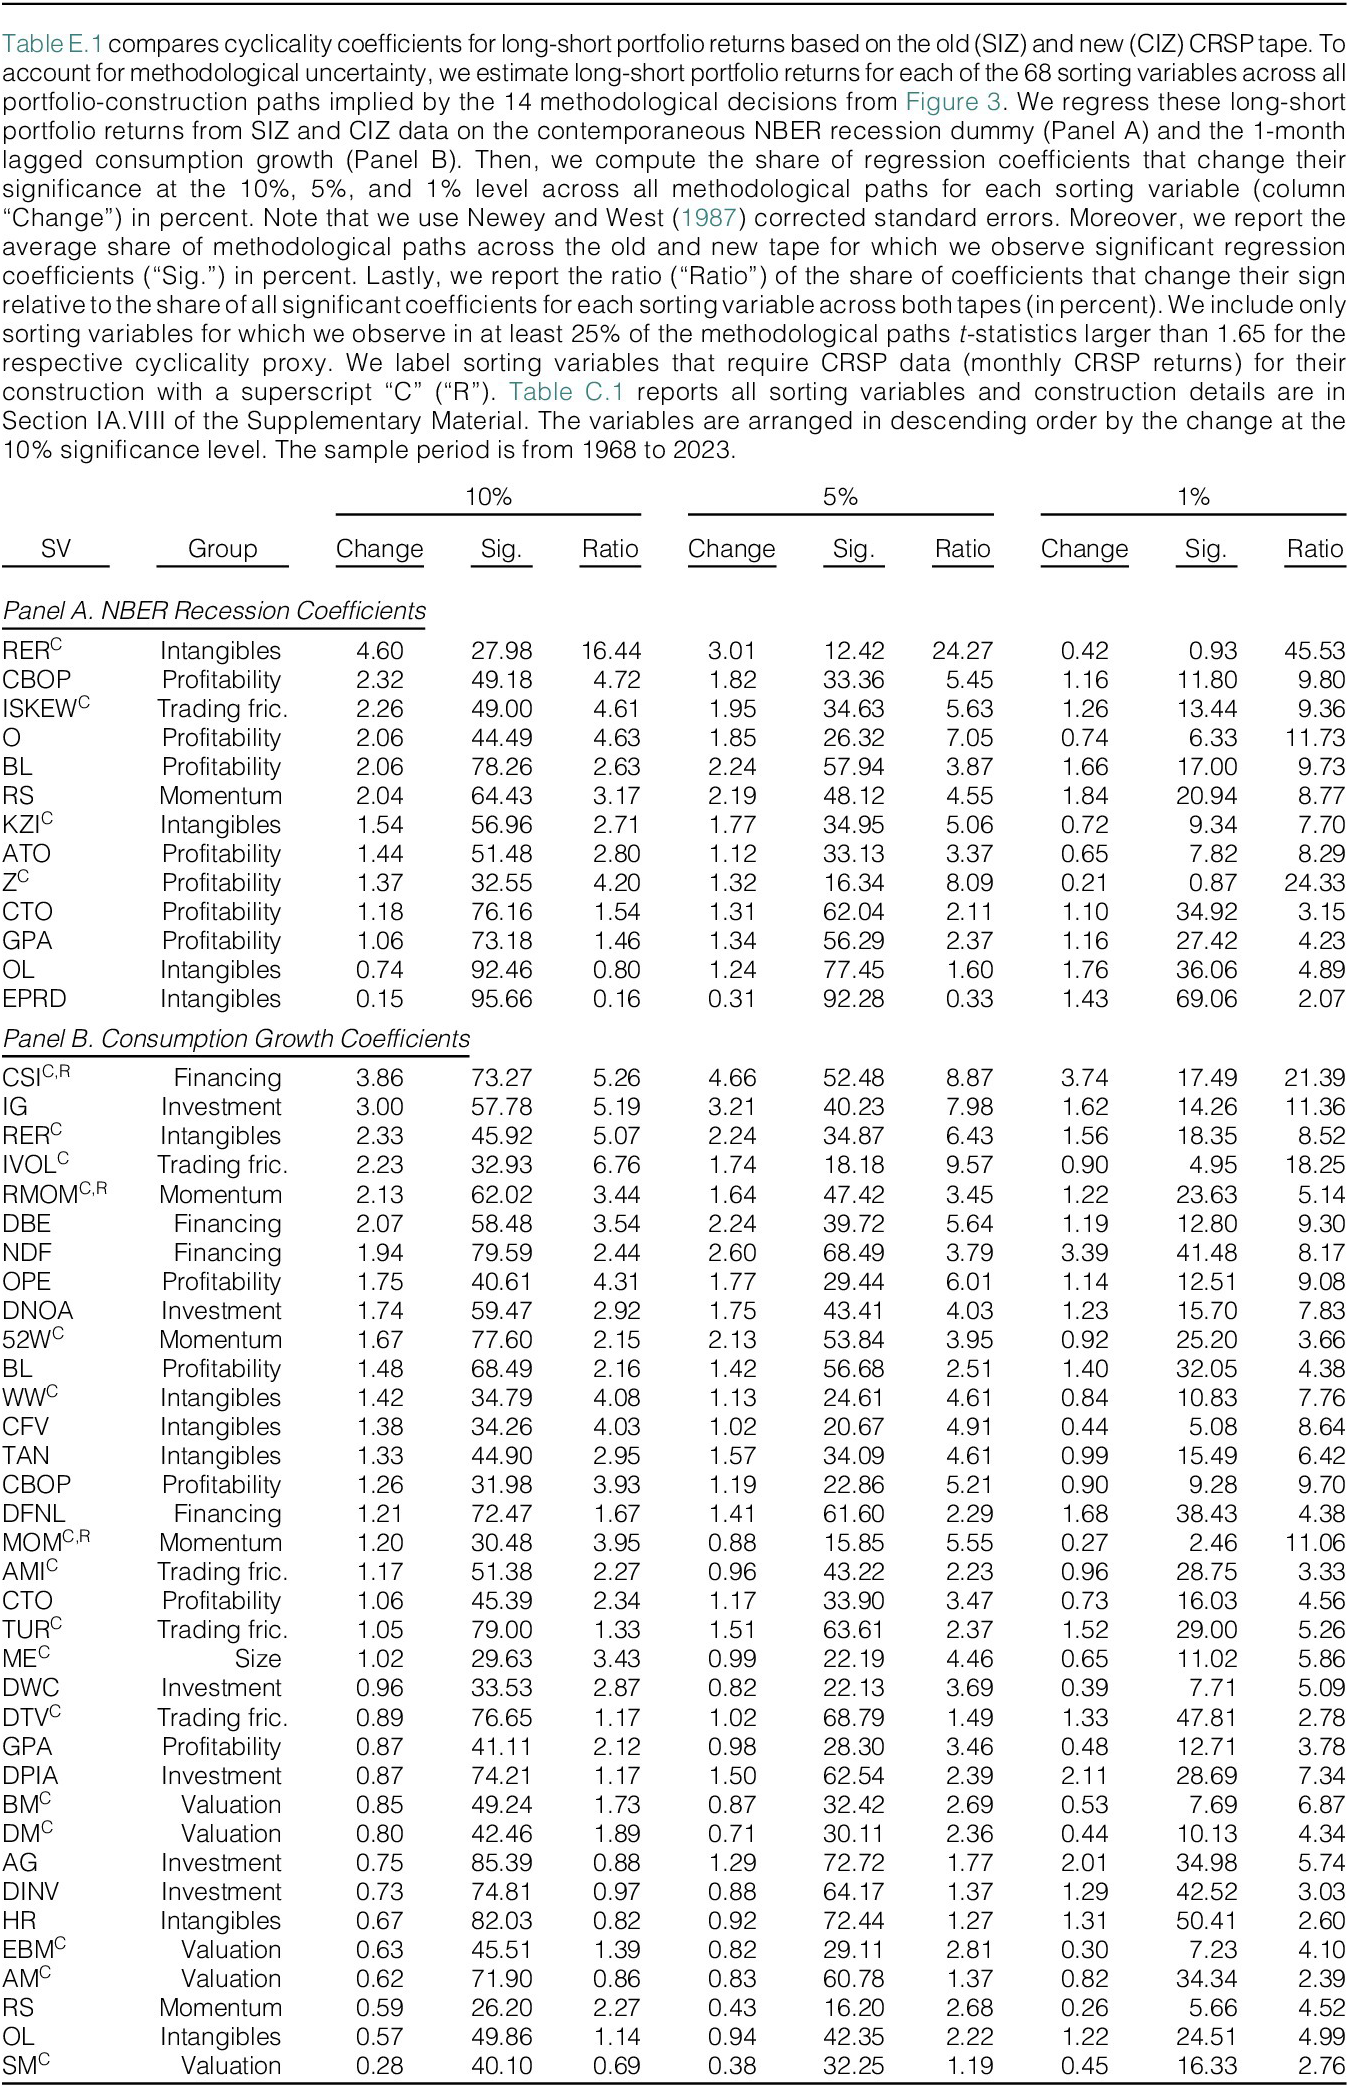
For the vast majority of sorting variables and their methodological paths, we do not find that the regression coefficients for the NBER recession dummy change their significance in Table E.1 when we change from the old to the new CRSP tape. However, we note one exception: the real estate ratio from Tuzel (Reference Tuzel2010). Around 4.6% (3%) of the NBER recession coefficients across all long-short portfolio returns, which we estimate by varying methodological sorting choices, change the significance at the 10% (5%) level once we switch from the old to the new tape. These shares are large if we consider that only 28% (12%) of all real estate ratio-sorted portfolio returns generate significant NBER recession coefficients at the 10% (5%) level when varying methodological sorting choices.
To reduce complexity, we also fix a common methodological path for risk-based rationales motivated by the choices in Hou et al. (Reference Hou, Xue and Zhang2020)Footnote
33: We include all stocks except for financials, stocks with negative book equity values, and stock observations with less than 2 years of listing. Then, we form monthly decile portfolios based on NYSE breakpoints and value-weighted portfolio returns. In line with the evidence across all methodological paths, we note that the $ t $
-statistic of the NBER recession coefficient for long-short portfolio returns sorted on the real estate ratio changes from 2.00 to 1.82 once we switch from the old to the new CRSP tape (see Panel A in Table E.2). For this sorting variable and methodological path, the CRSP changes potentially reverse our judgment that the real estate ratio premium is counter-cyclical at the 5% significance level.Footnote
34
$ t $
-statistic of the NBER recession coefficient for long-short portfolio returns sorted on the real estate ratio changes from 2.00 to 1.82 once we switch from the old to the new CRSP tape (see Panel A in Table E.2). For this sorting variable and methodological path, the CRSP changes potentially reverse our judgment that the real estate ratio premium is counter-cyclical at the 5% significance level.Footnote
34
The result that CRSP changes can potentially affect specific conditional premia is not specific to the NBER recession dummy but also pertains to alternative business cycle predictors. We follow the literature, that is, Cooper and Maio (Reference Cooper and Maio2019), and predict various time series of long-short portfolio returns for the same sorting variable that differ in their methodological sorting choices made to estimate them (see Panel B of Table E.1). Using consumption growth as a cyclical predictor, we note for the composite share issuance variable from Pontiff and Woodgate (Reference Pontiff and Woodgate2008) that 4.7% (3.7%) of consumption growth coefficients for all portfolio returns generated by varying methodological choices change the significance at the 5% (1%) level. These changed coefficients make up around 9% (21%) of all significant consumption growth coefficients for all composite share issuance-sorted portfolios, which differ in the methodological sorting choices.Footnote 35
Overall, our results suggest that the changes in monthly CRSP returns alter monthly portfolio returns by far more (10% at the 10 bp level) than they change monthly stock returns between both CRSP tapes (around 10% at the 1 bp level). However, these changes in monthly long-short portfolio returns do not lead to meaningful differences in the size and significance of return premia (the time-series average of these monthly long-short portfolio returns). While the changes from the old to the new CRSP tape are mostly due to reinvesting payouts on the ex-date instead of the month-end, we also confirm that reinvesting payouts on the effective payment date does not materially alter premia. Thus, our results provide reassurance for asset pricing studies using the old CRSP tape that their unconditional premia should be almost the same when using the new CRSP tape (with payouts reinvested on the ex-date) or when shifting the reinvestment timing from the ex-date to the payment date. However, we cannot generalize these findings to all asset pricing applications, as we observe meaningful differences in cyclicality estimates for specific sorting variables, for example, for the real estate ratio. Therefore, we cannot rule out that specific asset pricing applications with specific methodological choices might yield significantly different conclusions about the cyclicality of premia.
IV. Discussion
Our results from Section III raise the question of why monthly return changes between the old and new tape lead to considerable differences for monthly long-short portfolio returns but not for their time-series averages (i.e., premia). Intuitively, the difference in monthly portfolio returns from the new versus the old tape is positive (negative) if the compounded returns from the ex-date to the end of the same month are positive (negative). These compounded returns represent the differences in reinvestment returns of payouts between the old and new tape for each month. Furthermore, conditional on the reinvestment return differences, return differences between the old and new tape increase with the payout yield. However, if the average reinvestment return differences are 0, the return differences for these stocks might cancel out once we aggregate them into portfolios. Thus, the direction of the differences in portfolio returns depends on whether stocks with large payouts have payout yields that correlate positively or negatively with the reinvestment return differences of payouts. Thus, we inspect in each month the cross-sectional correlation between the payout yield and the compounded return from the ex-date to the end of the ex-date month.
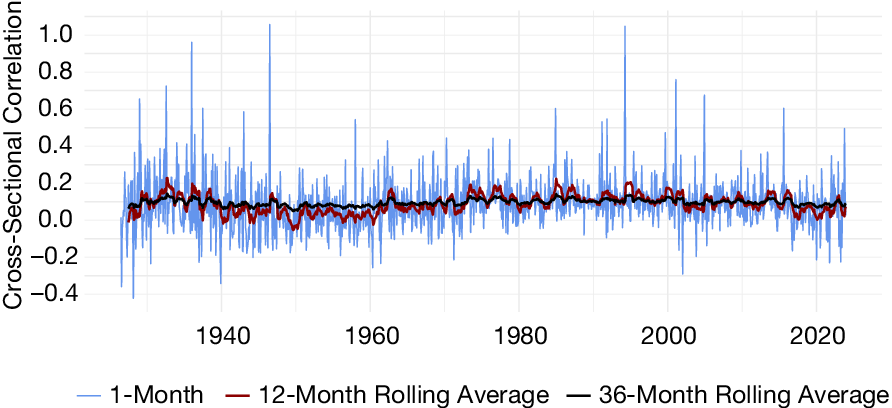
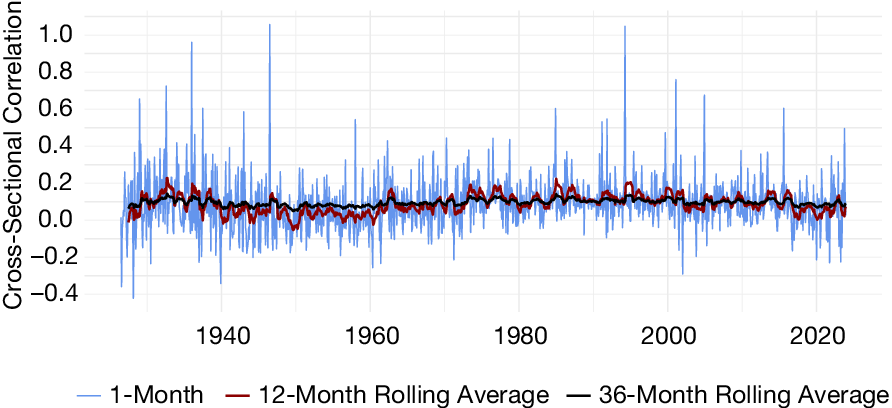
Figure 4 shows that these cross-sectional correlations between the payout yield and the compounded return from the ex-date to the end of the ex-date month range in 90% of the months from −21% to 21% around the mean cross-sectional correlation. However, there is little persistence in the direction of these rank correlations over time. Although these cross-sectional correlations can be either positive or negative over a year, we observe, on average, little variation around a 3-year rolling window. Thus, while cross-sectional correlations between both determinants of CRSP changes—the payout yield and the compounded return from the ex-dates to the end of the ex-date month—can be large in each month, they are not systematic over time. This might explain why we observe considerable differences in monthly long-short returns that do not translate into differences in their time-series averages (i.e., premia).
Figure 4 shows the time series of cross-sectional correlations between the payout yield and the compounded return from the ex-date to the end of the ex-date month. We compute these cross-sectional correlations in each month based on the observations that have absolute return differences exceeding 0.1 bp between monthly returns from the new (CIZ) and the old (SIZ) tape of CRSP. The red line shows the 12-month rolling average of these cross-sectional correlations, and the black line shows the 36-month rolling average.
We observe a similar picture for monthly long-short portfolio returns in Section III. Across all groups of sorting variables and their methodological paths, we find almost an equal share of monthly long-short returns with positive and negative differences when constructed based on the new versus the old tape (Table 2). Thus, considerable differences in specific months tend to cancel out once we average over many decades.
While we show that the CRSP changes from the old to the new tape do not systematically alter unconditional premia, we cannot generalize this result to all asset pricing applications based on monthly returns. For example, we find that changing from the old to the new CRSP tape alters our assessment of whether the real estate ratio is counter-cyclical based on a 5% significance level. While only a few conditional premia change, those that are sensitive to the CRSP changes have a low data coverage for their sorting variable (real-estate ratio) or require cumulative monthly returns over many years for their construction (composite share issuance).
Furthermore, the CRSP changes imply the following: First, CRSP changes impact the common procedure to compute dividends from the difference between monthly returns including payouts (old CRSP item “ret”) and monthly returns excluding payouts (old CRSP item “retx”).Footnote 36 Inferring dividends directly from monthly returns in the new tape is no longer possible as dividends are reinvested on the ex-date. Thus, differences between the new CRSP item “MthRet” and “MthRetx” reflect payouts and reinvestment proceeds. Second, although monthly returns in the new tape include delisting returns, CRSP does not adjust for a delisting bias following Shumway (Reference Shumway1997). Thus, to adjust for a delisting bias, it might still be necessary to construct monthly returns by compounding daily returns and including specific delisting assumptions.
V. Conclusion
From January 2025, CRSP no longer updates the Flat File Format 1.0 (SIZ) commonly used as a data source for the returns of U.S. listed stocks. Instead, CRSP started to provide its new Flat File Format 2.0 (CIZ) in 2022. This transition primarily changes monthly stock returns, potentially affecting the results of approximately 34% of all articles published by the Top5 finance journals over the last 25 years.
With the new release, CRSP overwrote the history of 9.6% of monthly stock return observations, which significantly differ by at least 1 bp between the old and new tape. The vast share of these differences arises because payouts are reinvested on the ex-date in the new tape as opposed to the end of the ex-date month in the old tape. Although infrequent, we find exceptionally large differences for observations with trading gaps, new listings, and delistings. While reinvesting payouts on the ex-date might not be realistic for some investors, we find that shifting the reinvestment of payouts from the ex-date to the subsequent payment date even rewrites 14.9% of monthly returns by at least 1 bp.
We investigate how these changes for monthly returns affect asset pricing studies by examining a widespread procedure using monthly CRSP returns, that is, portfolio sorts. Changing from the old to the new tape alters around 11.43% of monthly long-short portfolio returns by at least 10 bp with larger differences during recession months. Reassuringly, these sizable positive or negative differences in monthly long-short portfolio returns cancel out over longer horizons, leaving the size and significance of their time-series averages, that is, premia, virtually unchanged. This also holds if we switch from the new tape to a modified new tape for which we only shift the reinvestment of payouts from the ex-date (new tape) to the payment date.
Although changing from the old to the new tape does not systematically alter unconditional premia, we find that switching from the old to the new tape can alter our conclusion about the cyclicality for a few specific premia. Thus, while changes of monthly CRSP returns unlikely affect studies investigating average effects over long time period, they might lead to differences for a few premia conditional on specific time periods, such as during economic downturns.
Appendix
A. Summary Statistics
B. Differences Between the CRSP Tapes
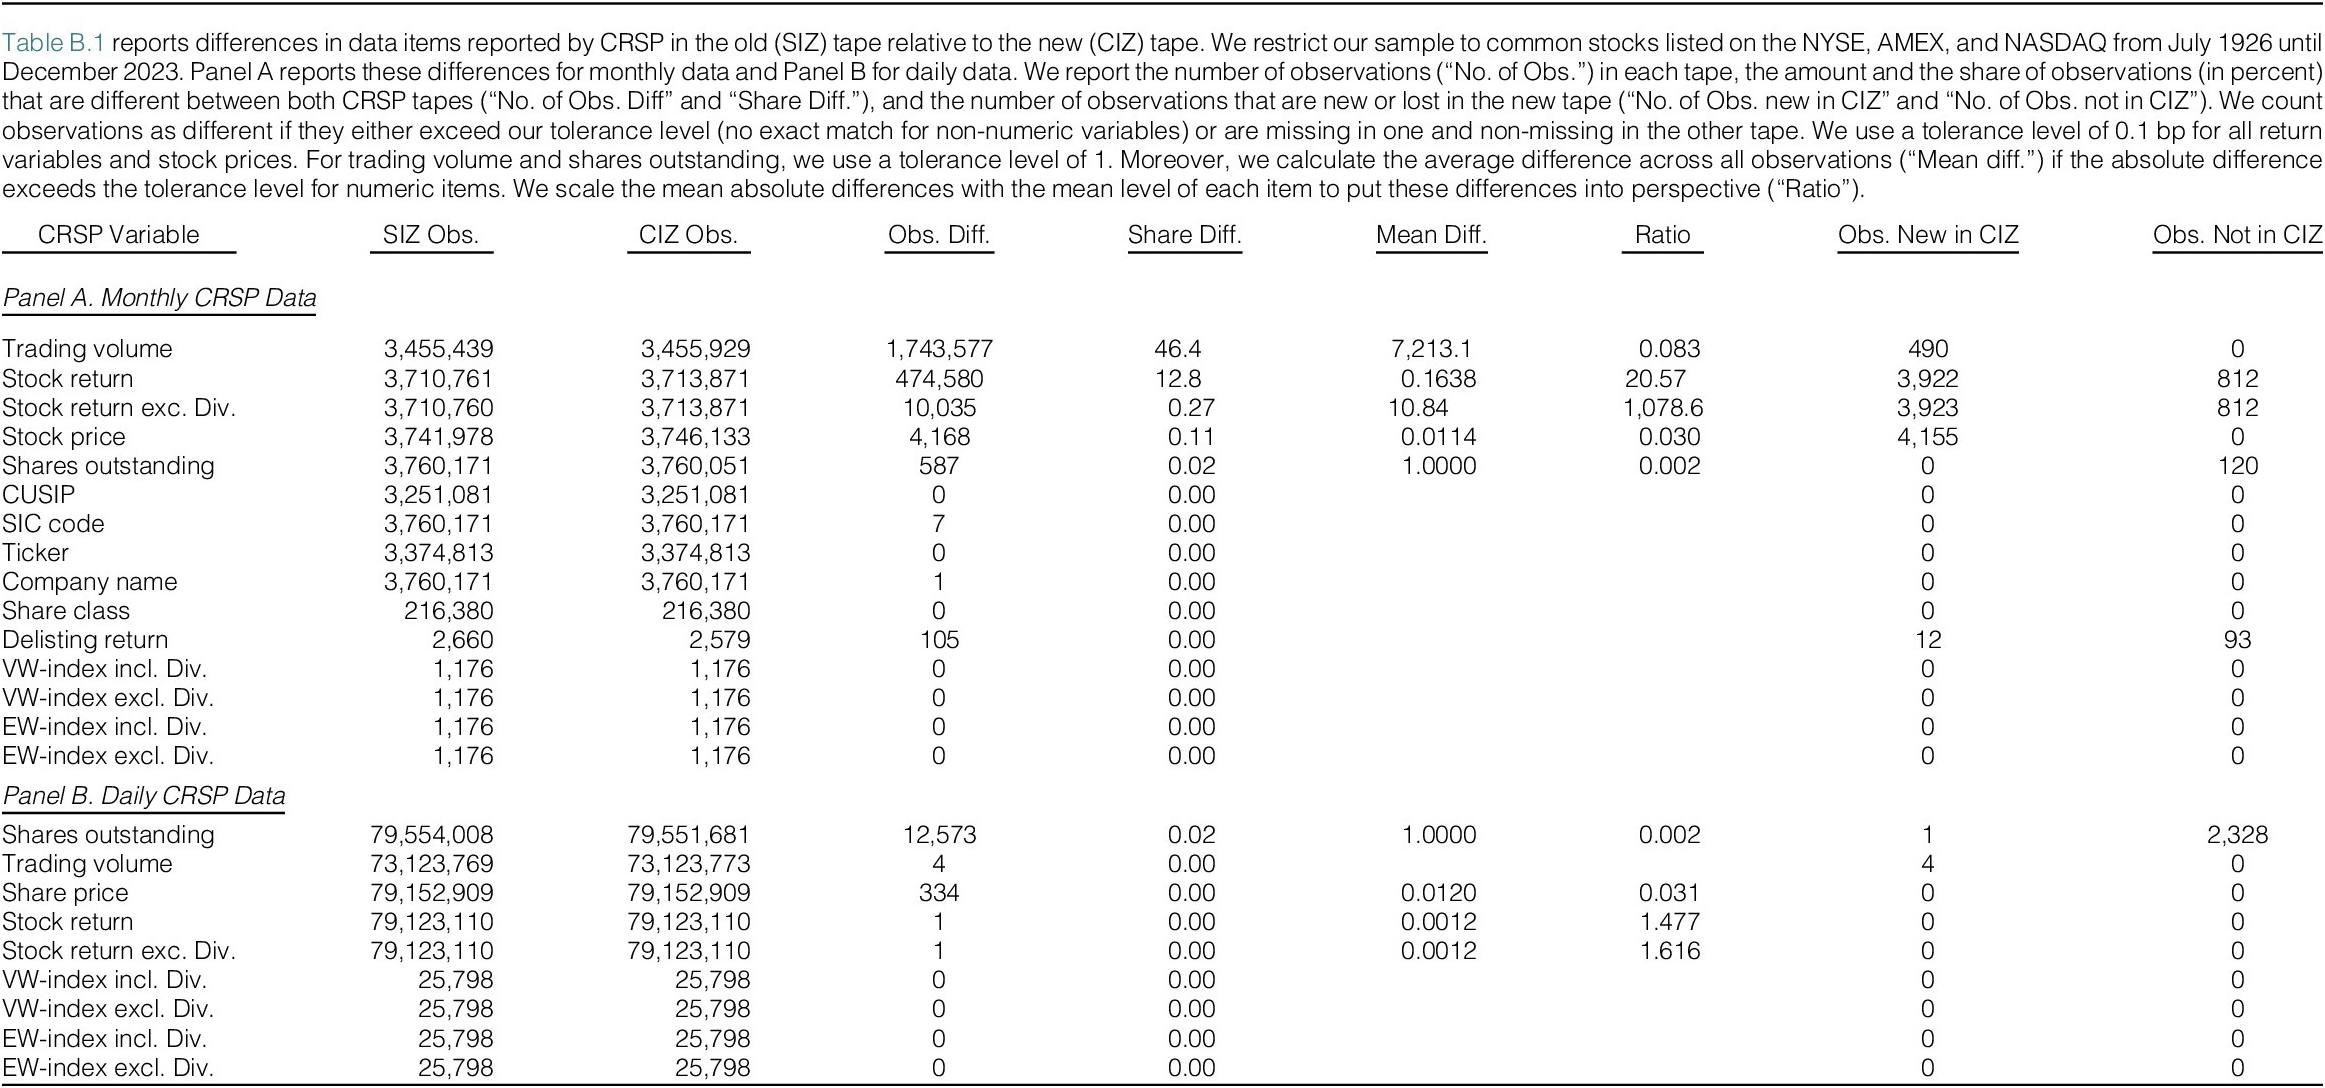
Figure B.1 shows the average absolute return differences in percent (“Ret. Diff.”) in each of the 25 double-sorted buckets with increasing color intensity. We assign observations with monthly return differences exceeding 0.1 bp between the new (CIZ) and old (SIZ) CRSP tape into quintiles based on their payout yield and the stock’s absolute compounded return from the ex-date to the month-end (“Reinvestment Return of Payouts”). We replace missing daily returns for the computation of the reinvestment return with zero. Based on these independent double sorts, we assign stocks into 25 buckets and depict the absolute return differences for each bucket by color intensity. We show the mean values for the payout yield (horizontal axis) and reinvestment return of payouts (vertical axis) for each bucket in percent. We include all common stocks listed on AMEX, NYSE, and NASDAQ from 1926 until 2023.
C. Sorting Variables

D. Differences in the Significance of Premia
E. Differences in Cyclicality Coefficients
F. Overview of Differences in Premia
Supplementary Material
To view supplementary material for this article, please visit http://doi.org/10.1017/S0022109026102774.
Funding Statement
Walter and Weiss gratefully acknowledge financial support from the Austrian Science Fund (grant number DOC 23-G16 and 10.55776/DOC202).





 Open access

