


Introduction
The conservation status of archaeological sites and landscapes is a matter of foremost importance with manifold implications for research activities and public engagement endeavours alike. In recent years, heritage conservation policies worldwide have been pushing increasingly restrictive guidelines for reducing the anthropic pressure across archaeological and archaeo-naturalistic sites and parks, often promoting synergy between research institutes, government authorities and local communities in shared efforts to ensure best practice and site safeguarding (Marshall Reference Marshall2002; Bewley et al. Reference Bewley and Campano2016; Lafrenz Samuels Reference Lafrenz Samuels2016; Rayne et al. Reference Rayne2020). However, disruption caused by natural events often falls outside of predictability and governability measures due to their dimensional scale, which is essentially beyond human control. Most prominently, this is observed for water-driven surface processes, namely soil erosion manifesting as pervasive networks of rills and gullies that furrow natural and anthropogenic landscapes across all climates and geographies (Dotterweich et al. Reference Dotterweich2003; Valentin et al. Reference Valentin2005; Montgomery Reference Montgomery2007; Vanwalleghem et al. Reference Vanwalleghem2017; Azareh et al. Reference Azareh2019; Busch et al. Reference Busch2021; Yang et al. Reference Yang2021; Costanzo et al. Reference Costanzo2022). Although containment measures do exist, with some having been devised and experimented with in local-scale settings by non-specialised personnel (Pederson et al. Reference Pederson2006), soil erosion is an inescapable natural morphogenetic process that can be slowed down, but never truly stopped.
Climate changes, and climatic regimes generally, act worldwide to drive erosional processes, which move faster and more incisively in sensitive areas where geopedological settings, natural land cover and anthropogenic land use interlock in self-amplifying nexuses, causing distress to the land surface and its ultimate degradation (Borrelli et al. Reference Borrelli2020). This interplay is apparent throughout the palaeontological and archaeological records, where shifting regional and supra-regional climatic trends are often associated with morphogenetic and cultural changes (Wright Reference Wright2017, Reference Wright2023; Zerboni & Nicoll Reference Zerboni and Nicoll2019; Nicoll & Zerboni Reference Nicoll and Zerboni2020; Costanzo et al. Reference Costanzo2022; Wright et al. Reference Wright2024).
All such processes act cumulatively on landscapes, which we record in the present day as a palimpsest of forms and deposits. Crucially, however, any landscape at any time may be considered its own morphogenic starting point for the sake of applying models to predict the long-term effects of soil erosion. Such models represent reliable quantitative tools that are widely used in the field of agronomics and agroforest land management, and that have become part of the geoarchaeological toolkit for the multiscalar and interdisciplinary exploration of historical landscapes (Howland et al. Reference Howland2018; Agapiou et al. Reference Agapiou2020; Brandolini et al. Reference Brandolini2023a & b) and archaeological sites, such as the tell sites of South-west Asia (Rosen Reference Rosen1986; Forti et al. Reference Forti2023). One of these tools is the Revised Universal Soil Loss Equation (RUSLE) model. This is an empirical soil erosion estimation model (Renard et al. Reference Renard1997) that combines the topographic characteristics of an area with rainfall data and coefficients related to the uppermost soil properties, to provide dimensional estimates of annual soil loss (tonnes per hectare per year) caused by sheet and rill water erosion. RUSLE modelling is commonly used worldwide (Smith Reference Smith1999; Hammad et al. Reference Hammad2004; Benavidez et al. Reference Benavidez2018; Kumar et al. Reference Kumar2022) and is endorsed by the European Union (Panagos et al. Reference Panagos2015a & Reference Panagosb; see also https://www.eea.europa.eu/data-and-maps/figures/rusle-soil-erosion-model-structure). Among several existing models for the estimation of soil loss and soil quality depletion (Igwe et al. Reference Igwe2017; Borrelli et al. Reference Borrelli2021), the RUSLE and its variants are commended for their ease of application in digital environments (such as Geographic Information Systems or GIS) and their accessible workflows, consolidated across several hundred publications on the topic (Borrelli et al. Reference Borrelli2021), which make it possible for non-specialists to evaluate any area, provided a Digital Elevation Model (DEM) and reliable rainfall data are available.
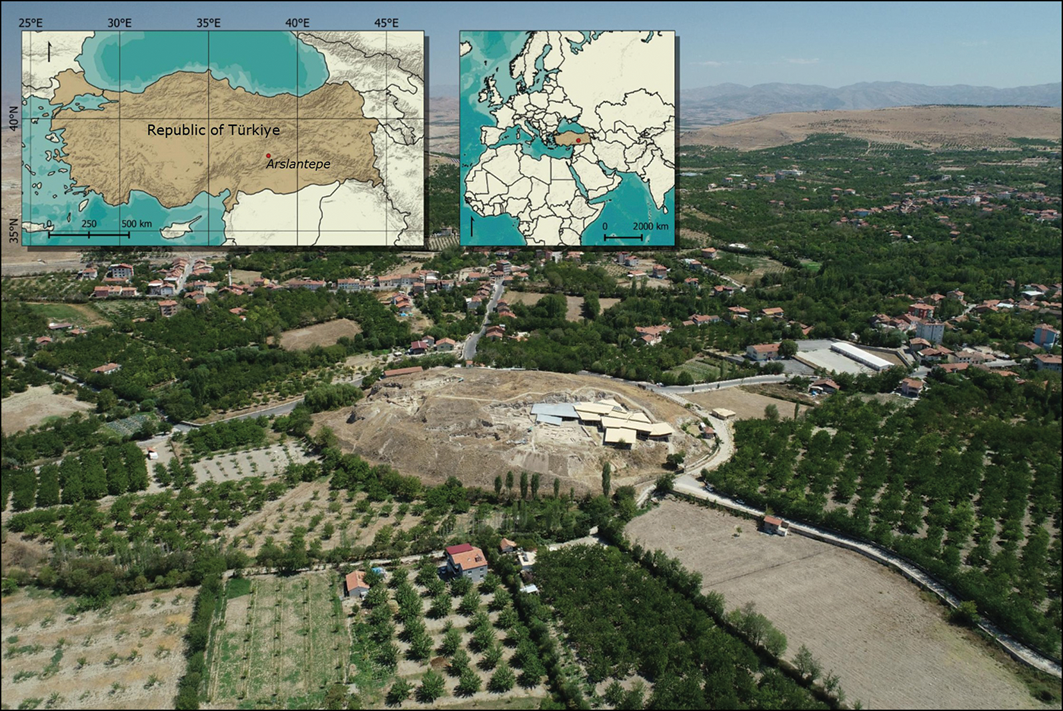
Here, we employ RUSLE modelling on the hill of Arslantepe (Malatya, south-eastern Anatolia) (Figure 1), a UNESCO World Heritage archaeological site, to estimate its current preservation status and possible incipient risks as part of the UNESCO requirements for best management practice and stepwise creation of conservation policies to regulate future archaeological excavations and tourist traffic.
Geographical location of Arslantepe (inset maps) and an east-facing bird’s-eye view of the archaeological site. The CRS grid of the map panel is in WGS84 (figure by authors).

Figure 1 Long description
The image consists of two main elements: an inset map and an aerial photograph. The inset map shows the geographical location of Arslantepe within the Republic of Turkey, with a focus on its position relative to surrounding regions. The map uses the WGS84 coordinate reference system. The aerial photograph provides an east-facing bird's-eye view of the archaeological site of Arslantepe, showcasing the landscape, surrounding vegetation, and nearby structures. The site is characterized by its elevated mound and the presence of various buildings and fields in the vicinity. The combination of the map and the aerial photograph highlights the site's location and its environmental context, emphasizing the importance of geographical and environmental factors in archaeological conservation.
Archaeology and morphology of Arslantepe
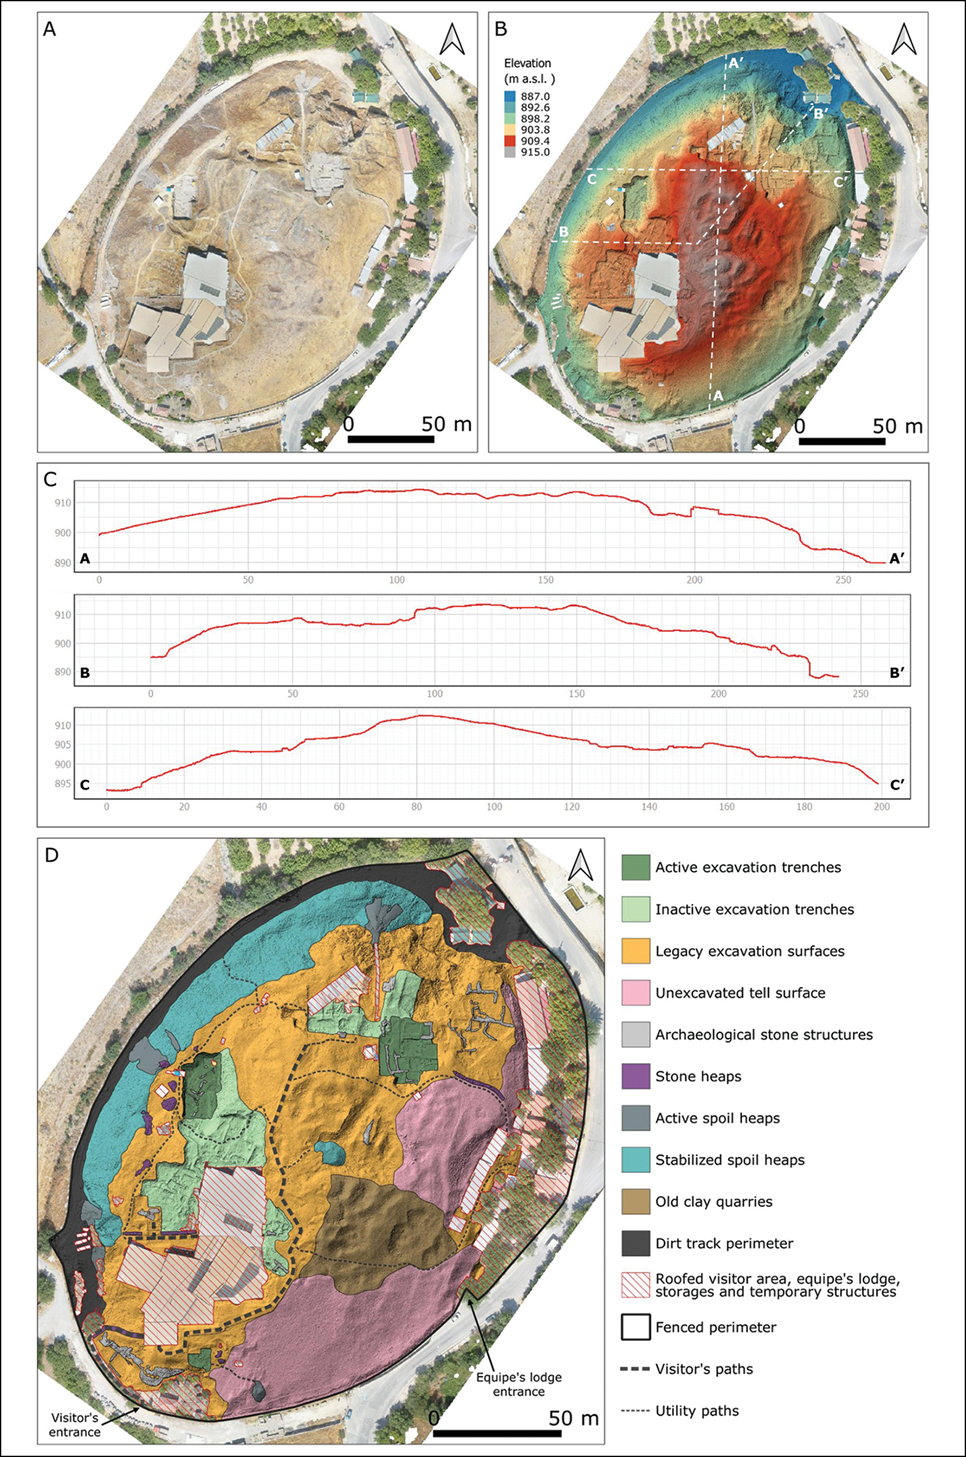
Arslantepe is 15km south of the Euphrates River in the Malatya plain, a large intramontane basin in the south-eastern Taurus mountains characterised by a heavily anthropised agricultural landscape set on rugged terrain colonised by grass steppe and sparse arboreal vegetation receiving 365mm/year rainfall (Köppen–Geiger climate classification: BSk – Hot Semiarid) (Beck et al. Reference Beck2018; Turkish State Meteorological website (https://mgm.gov.tr/veridegerlendirme/il-ve-ilceler-istatistik.aspx?k=H&m=MALATYA)). The site consists of a 30m-high artificial mound, covering an area of 3ha (Figure 2), that is the result of the repeated construction and dismantling of adobe and stone buildings over millennia. Since the early twentieth century, archaeologists have uncovered evidence of continuous occupation from the sixth millennium BCE until the medieval period (very early second millennia CE), and a pilot geomorphological survey has highlighted the dynamic nature of the local landscape (Dreibrodt et al. Reference Dreibrodt2014). The discovery of a fourth-millennium BCE adobe temple/palace complex, containing some of the earliest examples of metal swords, and the recovery of monumental Hittite stone sculptures—among several other features (Frangipane Reference Frangipane2004, Reference Frangipane2007, Reference Frangipane2010, Reference Frangipane2015, Reference Frangipane2018; Balossi Restelli et al. Reference Balossi Restelli2017; Di Nocera Reference Di Nocera, Durak and Frangipane2019; Frangipane et al. Reference Frangipane2021, Reference Frangipane, Ertürk Güngör and Karakul2023)—has made Arslantepe one of the most important archaeological sites in western Asia and secured its induction into the UNESCO World Heritage List in 2021 (https://whc.unesco.org/en/list/1622/).
A) orthopoto; B) digital surface model; C) elevation profiles transects (in metres) corresponding to the dashed lines in panel (B); D) graphic characterisation of Arslantepe. All images created with QGIS v.3.40 (figure by authors).

Figure 2 Long description
The image consists of four panels. Panel A shows an orthophoto of Arslantepe, capturing the site's surface features and structures. Panel B presents a digital surface model of the same area, with elevation data ranging from 311.4 to 992.6 meters above sea level, highlighted in various colors. Panel C displays three elevation profiles corresponding to the dashed lines in Panel B, showing the terrain's elevation changes across the site. Panel D provides a graphic characterization of Arslantepe, detailing active and inactive excavation trenches, legacy excavation surfaces, unexcavated tell surfaces, archaeological stone structures, stone heaps, active and stabilized spoil heaps, old clay quarries, dirt track perimeters, roofted visitor areas, and utility paths. The image was created using QGIS version 3.40.
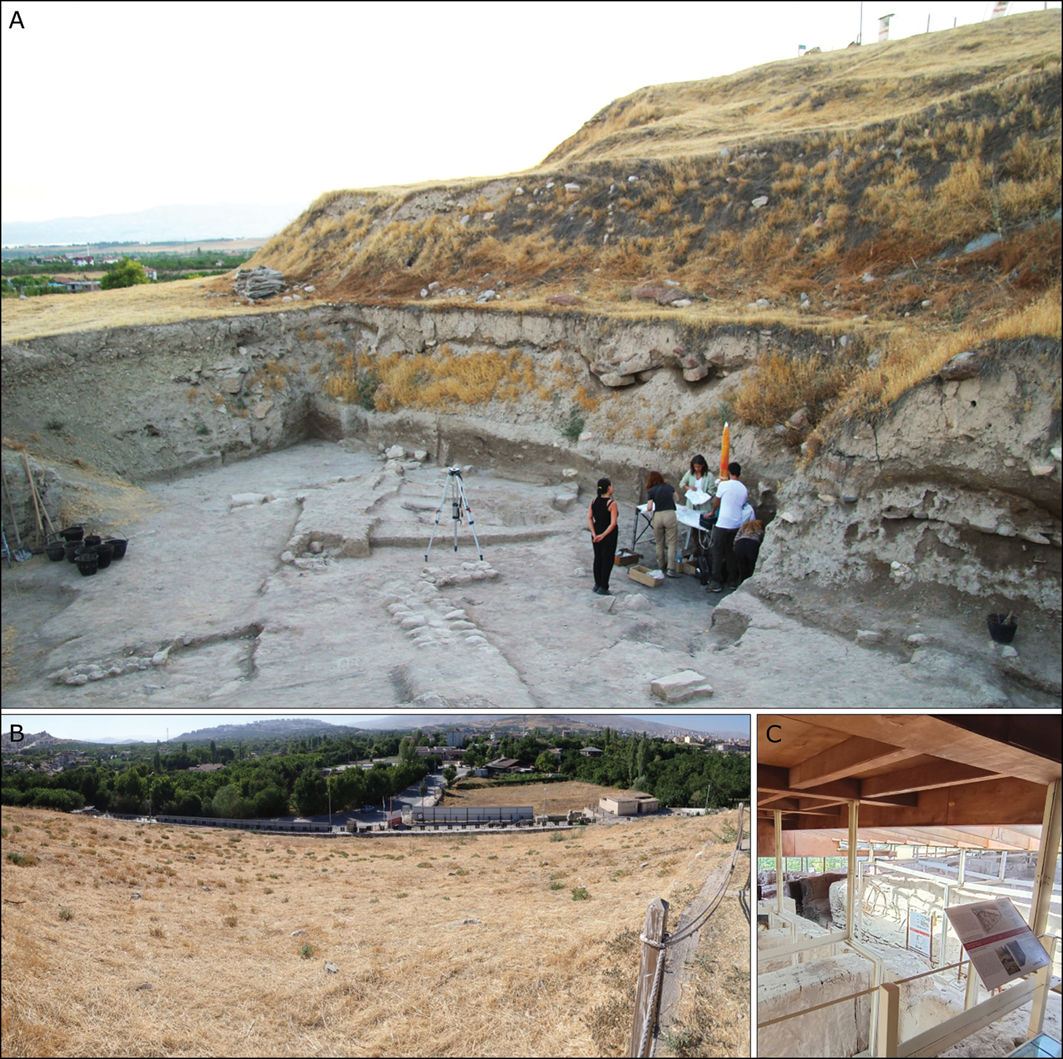
The site overlooks the rural landscape of Orduzu village on the eastern periphery of Malatya, and currently presents as an elliptical mound (approximately 240 × 160m) with a south-west to north-east orientation. The perimeter of the site is delimited by a steel fence atop a 0.3–1.5m-tall concrete wall. The mound originally exceeded 30m in height but today stops at 28.5m following 2024 excavations on the summit, and the relief of the slopes largely reflects the intensity and extensiveness of the archaeological excavations. Many areas are today flattened along a compass-oriented excavation grid, giving the impression of a terrace system (Figures 2B–C & 3A). This is particularly evident on the western half and northern tip, although almost the entire mound has been host to archaeological trenches or, in less recent times, clay quarrying for local mudbrick production, excepting only the south-eastern skirt that might still preserve the original sloping surface (Figures 2D & 3B).
A) North-east-facing view of the deep excavation trench and terraced surfaces of the western half of the mound; B) east-to-south-facing panoramic view of the unexcavated surface at the south-east of the mound, seen from atop; C) the self-supporting structure covering the palace complex (figure by authors).

Figure 3 Long description
The composite image consists of three distinct views of an archaeological site. The first view (A) is a north-east-facing image of a deep excavation trench and terraced surfaces of the western half of the mound. Several people are present, engaged in archaeological work, with equipment such as tripods and tables visible. The second view (B) is an east-to-south-facing panoramic image of the unexcavated surface at the south-east of the mound, seen from atop. It shows a vast, dry landscape with scattered vegetation and buildings in the distance. The third view (C) is an interior shot of a self-supporting structure covering the palace complex, featuring wooden beams and display cases with informational panels.
The palace complex, in the south-west of the mound, is covered by a modular self-supporting structure that requires no pole foundations (Figure 3C) and that prevents increased erosion from rainfall splashing along its perimeter through the use of a gutter system, which expels the water outside the mound’s perimeter at its south-western tip. Movement across the site is possible thanks to a timber-lined earthen track, and a few paths connecting the excavation areas (Figure 2D). As is common practice for archaeological sites in the region, active excavation trenches are covered with thin nonwoven fabric and a light sprinkle of soil between field seasons, while trenches that are inactive or awaiting preparation for long-term display are protected with heavier fabric and more soil.
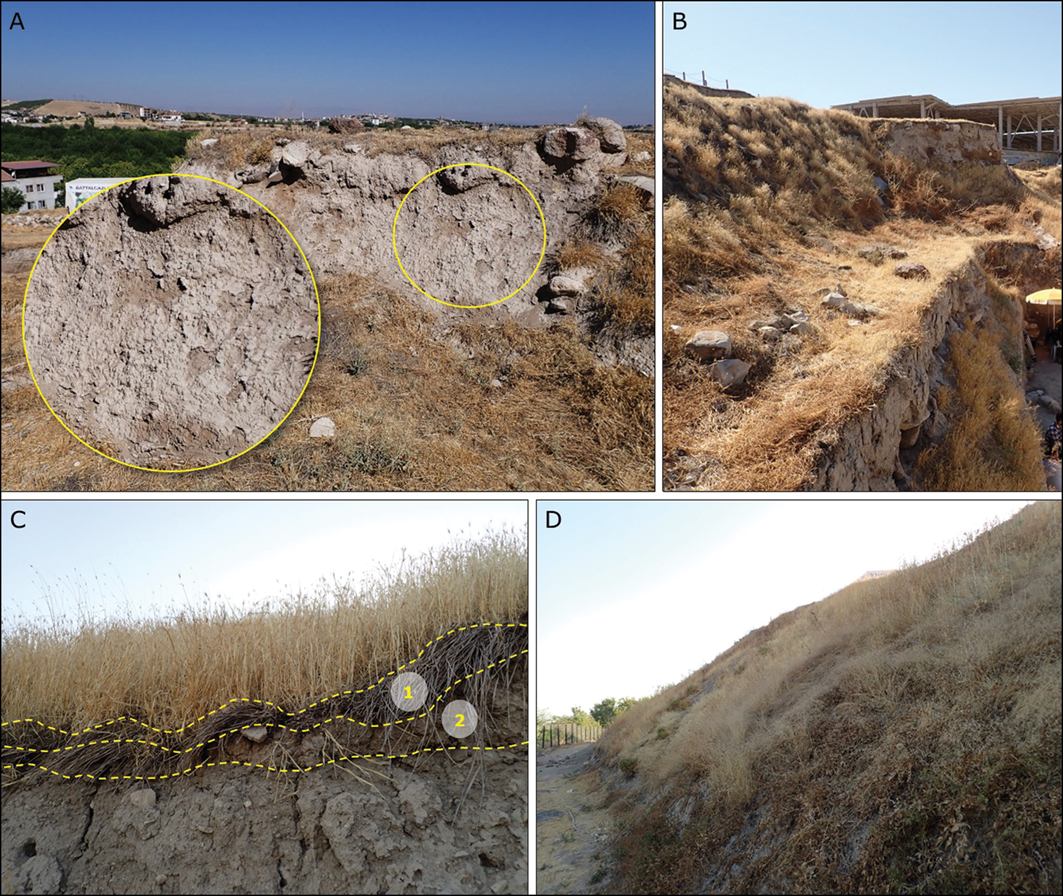
While freshly exposed trench sides present variable stability depending on the constituent archaeological layers (adobe walls, plaster, rubble, refuse pits, etc.), the silty clay loam composing the soil matrix undergoes partial surface meteoric liquefaction, filling structural voids with mobilised mud and evening out the surface texture in a short-term self-sealing process (Figure 4A). Over time, splashing rainfall and surface wash remove the fine-grained and colloidal fraction of the matrix, weakening the exposed deposits and freeing gravel and stones. However, fast growing unmanaged annual shrubs and grasses—mostly rewilded wheat windblown from the surrounding fields—have colonised all gently sloping surfaces and many of the exposed sections (Figure 4B), promoting the formation of a protective organic litter and an incipient topsoil across the site (Figure 4C) that help negate the mechanical stress induced by rain and human trampling. In past decades, small flocks of sheep were grazed on the mound, contributing to mechanical stress (trampling), but site management policies and the shrinking of local agropastoral economies have halted the practice, and any residual zoogeomorphological traces have been adsorbed and masked by archaeological activities and the grass cover. Fast growth grass is also responsible for engulfing and stabilising excavation spoil heaps (Figure 4D), the cumulative build-up of which, over roughly 60 years, coated the western and northern edges of the mound with a conspicuous detrital skirt that recently required mechanised removal to re-establish the perimeter pathway (Figure 2).
A) Detail of a dry mud pellicle deposited by sheetwash encrusting an exposed trench section; B) wheat and shrubs growing on long-exposed trench sections; C) detail of the protective organic litter build-up (1) underneath the unmanaged wheat, promoting an incipient topsoil (2); D) wheat and shrubs colonising and stabilising the build-up of cumulative spoil heaps on the north-western perimeter of the mound (figure by authors).

Figure 4 Long description
The first image shows a close-up of a dry mud layer deposited by sheetwash encrusting an exposed trench section. The second image depicts wheat and shrubs growing on long-exposed trench sections. The third image highlights the protective organic litter build-up underneath unmanaged wheat, promoting an incipient topsoil. The fourth image shows wheat and shrubs colonizing and stabilizing the build-up of cumulative spoil heaps on the northwestern perimeter of the mound.
Methods
Theory of RUSLE modelling
RUSLE modelling is a method that allows the quantitative estimation of yearly soil loss across a standard projected area (Renard et al. Reference Renard1997), expressed as tonnes per hectare over the timespan of a year (1).
 $$\;\left( {{t \over {ha}}} \right)/y\;or\;t \times h{a^{ - 1}} \times {y^{ - 1}}$$
The model consists of an empirical equation developed in the field of agronomics, combining five independent factors, presented as metadata-bearing raster files, in a linear multiplication that requires an admixture of measured data, computed parameters and practical evaluations. The formula is expressed as follows (2):
 $${{\rm{\;}}A = R \times LS \times K \times C \times P}$$
Where A is the yearly soil loss, R expresses the cumulative erosivity of yearly rainfall precipitation, LS expresses slope variations of the topographic surface, K expresses the substrate’s inherent resistance to hydraulic erosion, C expresses surface cover and/or land-use destination and P expresses the influence of infrastructural containment measures to prevent erosion. The extraction of these factors in relation to Arslantepe is described in the following paragraphs.
Software and resources
The software used to build the factors and create the final model is QGIS v.3.40 (QGIS Development Team 2025). The building of each factor, except for the R-Factor, was based on a georeferenced orthophoto of Arslantepe and its immediate surroundings, derived from a drone-based photogrammetric survey with ground control points, at ultra-high 2cm/px native resolution, which was used as a basemap for drawing polygons (Figure 2A). The survey was conducted with a Mavic 2 Pro drone (model L1P) capturing a total of 2486 photographs at a resolution of 5472 × 3648 pixels following an automatic flight plan set to 35m above the take-off point, located at the highest area of the mound. Georeferencing of the model used GPS co-ordinates (WGS84) recorded by the drone through 17 coded ground targets measured with a total station, granting <100mm vertical accuracy. The orthophoto was produced using data from 4 September 2025, therefore all modelling refers to this date and does not account for later topographic modifications. The same photogrammetric dataset was processed with Structure-from-Motion (SfM) photogrammetric software to extract a Digital Surface Model (DSM) with the same 2cm/px resolution (Figure 2B), which was smoothed to remove vegetation pitting that would have altered subsequent automated altimetry-derived computing.
Extraction of the R-Factor
The R-Factor is the value that describes the weighted influence of splash erosion and transport (i.e. rainfall erosivity). Several different empirical approaches have been developed for different world regions, each broadly depending on general terrain properties and climate (Benavidez et al. Reference Benavidez2018). For this study we chose the formula for south-east Turkey (Irvem et al. Reference Irvem2007) (3):
 $$R = 0.1215 \times {\left( {\mathop \sum \limits_{i = 1}^{12} {{{P_i}^2} \over P}} \right)^{2.2421}}$$
where Pi and P are the monthly and yearly rainfall, respectively, expressed in mm, and the non-dimensional numbers are empirical coefficients that conform well with the local precipitation regime. Pi and P were retrieved from data available on the Turkish State Meteorological Service’s website, averaged from 30 years of data collection (1991–2020) at Malatya’s airport meteorological station. The station is located less than 25km from Arslantepe and sits at the same altitude, thus these data can be considered representative of precipitation at the archaeological site.
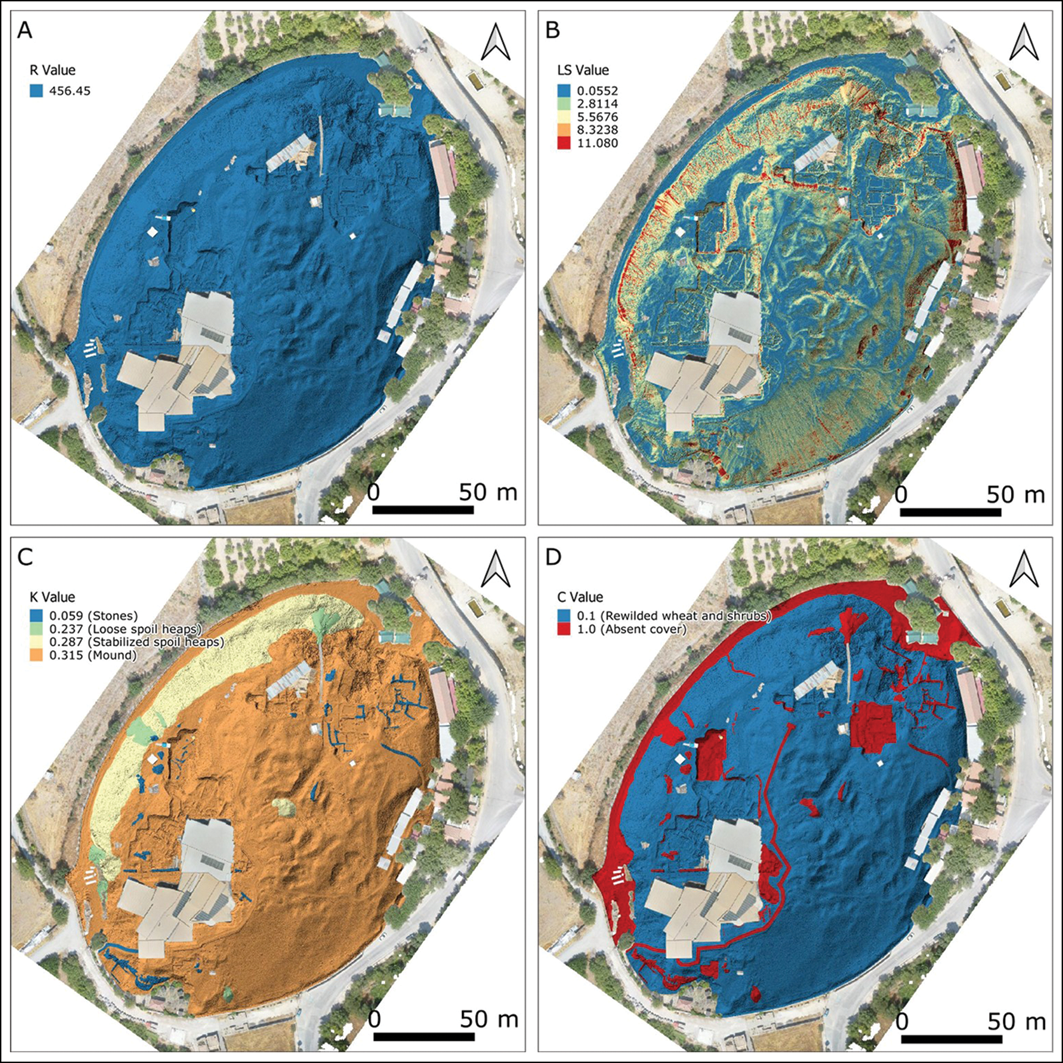
After calculation, the R-Factor was set at R = 456.45. This value was applied to a blank raster, whose area corresponds to the fenced perimeter minus the roofed areas shown in Figure 2D, to be later used in the RUSLE equation (Figure 5A). The same mask (removing the roofed areas) was maintained for all subsequent operations.
Maps illustrating each RUSLE Factor: A) R-Factor; B) LS-Factor; C) K-Factor; D) C-Factor (figure by authors).

Figure 5 Long description
The image contains four maps labeled A, B, C, and D, each illustrating different RUSLE factors for an archaeological site. Map A shows the R-Factor with a value of 456.45, depicted in shades of blue. Map B illustrates the LS-Factor with values ranging from 0.0552 to 11.080, shown in a gradient from blue to red. Map C displays the K-Factor with values ranging from 0.059 to 0.315, represented in shades of orange and brown. Map D shows the C-Factor with values ranging from 0.1 to 1.0, depicted in blue and red. Each map includes a scale bar indicating a distance of 50 meters and an orientation arrow pointing north. The maps highlight different aspects of soil erosion and conservation status across the site.
Extraction of the LS-Factor
The LS-Factor is a derivate of the DSM and expresses the relationship between the steepness of a slope and the uninterrupted same-value length of each slope. Thus, higher LS-Factor values are generally associated with longer and/or steeper slopes, whereas lower values are found on flat ground or very short slopes. The LS-Factor was calculated with the System for Automated Geoscientific Analyses (SAGA) (Conrad et al. Reference Conrad2015) through its QGIS interface, running the algorithm saga:lsfactorfieldbased (Moore & Nieber Reference Moore and Nieber1989) on the smoothed DSM (Figure 5B).
Extraction of the K-Factor
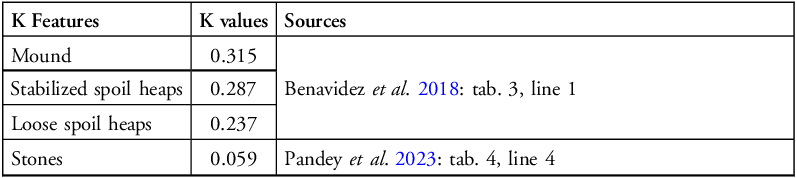
The K-Factor expresses the inherent resistance of surfaces to hydraulic erosion, and is a number comprised between 0 (no erosion susceptibility) and 1 (extreme erosion susceptibility). K values apply to the uppermost characteristics of a topographic surface and consider the texture and porosity of the substrate, ranging from solid rock outcrops to loose sand covers. K values may be obtained by extraction of near-surface core samples for parametric lab testing, but operability constraints at Arslantepe made such an approach impractical. Hence, we opted for retrieving K values from available literature and through simplified empirical soil evaluations. The K value for stone heaps and structures was retrieved from the work of Pandey and colleagues (Reference Pandey2023), while values pertaining to the mound’s earthen mass were calculated following Renard and colleagues’ (Reference Renard1997) empirical formula (Benavidez et al. Reference Benavidez2018: tab. 3, line 1) (4):
 $${\rm{\;}}K = \;\left\{ {\matrix{ {\left[ {2.1 \times {{\left( {\% silt \times \left( {100 - \% clay} \right)} \right)}^{1.14}} \times {{10}^{ - 4}} \times \left( {12 - \% organic} \right)} \right]} \cr + \cr {\left[ {3.25 \times \left( {granularity\;class - 2} \right)} \right] + \left[ {2.5 \times \left( {permeability\;class - 3} \right)} \right]} \cr } } \right\} \div 100$$
where all variables were extracted through in-situ testing of the mound’s soil in several locations. A textural composition of low-sand silty clay loam (clay 35%; silt 60%; sand 5%), with an organic fraction of approximately 1% and a granularity class of 2 (‘fine granular’; Benavidez et al. Reference Benavidez2018: tab. 3, line 1) were noted as average across the mound, while the permeability class ranged from 1 (‘rapid’) to 4 (‘slow to moderate’) across three macro-categories: active spoil heaps (1), stabilised spoil heaps (3) and original earthen mass (4). To distribute the obtained K values (Table 1) on a raster map, values were assigned onto drawn polygons (see Figure 2D) and later transformed into adjoining rasterised areas using the saga:rasterise algorithm and setting the cell size to 20mm to match the LS-Factor’s raster resolution (Figure 5C).
Main K features of Arslantepe, with respective K values and their sources.

Table 1 Long description
A table with four rows and three columns. The columns are labeled K Features, K values, and Sources. The rows list different K features with their respective K values and sources. The K features include Mound, Stabilized spoil heaps, Loose spoil heaps, and Stones. The K values are 0.315, 0.287, 0.237, and 0.059 respectively. The sources are Benavidez et al. 2018 and Pandey et al. 2023.
Extraction of the C-Factor
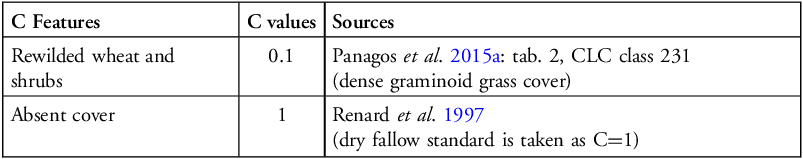
The C-Factor expresses the influence of the soil cover and land use on hydraulic erosion and is generally linked to the protection offered by the presence and variety of vegetation covers or the aggravation derived from tillage activities. As with the K-Factor, the C-Factor is a number between 0 (high protection against erosion, e.g. tight continuous vegetation cover) and 1 (no protection against erosion, e.g. total absence of vegetation cover). On the Arslantepe mound, the only vegetation is represented by the continuous cover of rewilded wheat and low shrubs (Figure 4). Non-vegetated areas are clearly identifiable on the orthophoto and were validated on site. C-Factor values were retrieved from literature (Panagos et al. Reference Panagos2015a) (Table 2) and assigned by creating value-bearing polygons rasterised with the same process as that of the K values (Figure 5D).
Main C features of Arslantepe, with each respective C value and its source.

Table 2 Long description
The table presents data on C features, C values, and sources for Arslantepe. It has three columns: C Features, C values, and Sources. The first row indicates rewilded wheat and shrubs with a C value of 0.1, sourced from Panagos et al. 2015a. The second row shows absent cover with a C value of 1, sourced from Renard et al. 1997. The table highlights the influence of soil cover and land use on hydraulic erosion, with values ranging from 0 to 1.
Extraction of the P-Factor
The P-Factor expresses the influence of prevention-oriented land management and is linked to the waterflow reducing capacity of infrastructural works such as drystone walls, terracing and check dams. While the P-Factor is significant for regional-scale assessments whose low-resolution DSMs are not representative of local-scale altimetric microvariations, we intentionally did not include it in our model because the LS-Factor extracted from our high-resolution photogrammetry computes topographic variations at a scale that effectively outweighs hand-drawn P-Factor characterisations.
Creation of the RUSLE model
The final product of RUSLE modelling is a georeferenced raster image bearing positive dimensional numerical values of the estimated soil loss. The RUSLE model is obtained by linear multiplication of all previously produced superimposable 2cm/px raster maps (Figure 5). The product is obtained with QGIS’s raster calculator tool, adding the R-Factor, LS-Factor, K-Factor and C-Factor rasters in the computing interface and running the multiplication function.
Results
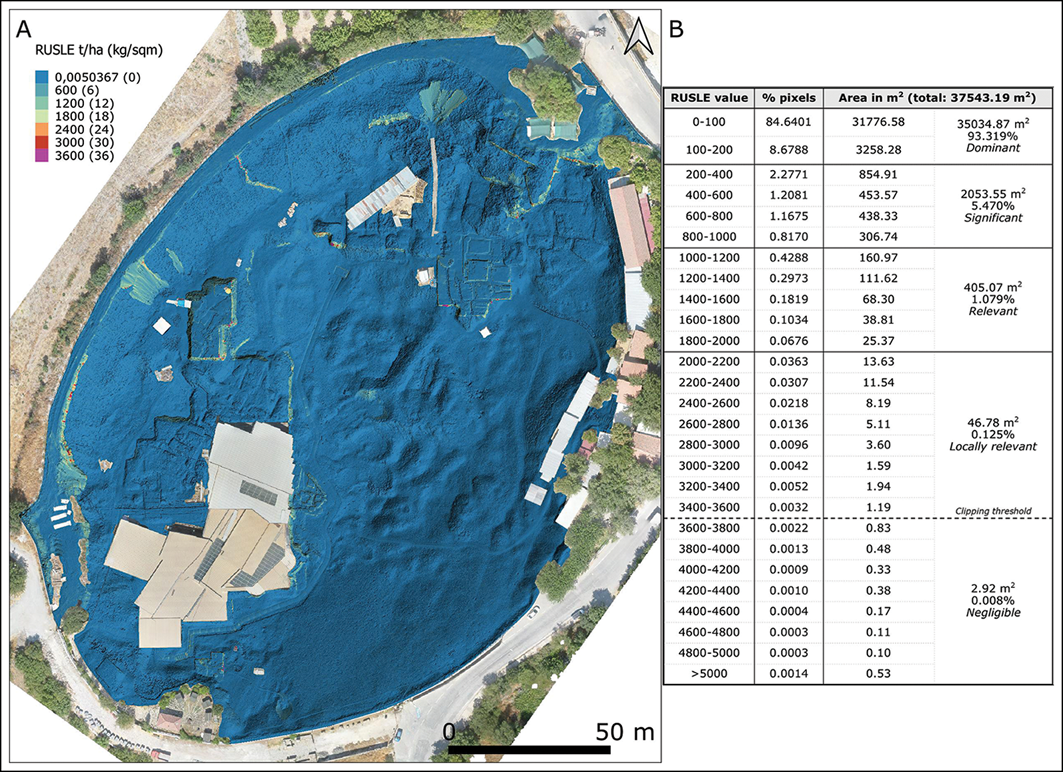
The RUSLE model for Arslantepe (Figure 6A) shows dimensional values ranging from near zero to approximately 3600 tonnes per hectare per year, with a few outliers reaching 8000 units. While RUSLE modelling remains a widely used tool for estimating erosion potential, numerous studies have highlighted its tendency to substantially over- or underestimate absolute soil-loss values when compared to field-measured data, particularly in heterogeneous terrains (Hammad et al. Reference Hammad2004; Benavidez et al. Reference Benavidez2018; Ghosal & Das Bhattacharya Reference Ghosal and Das Bhattacharya2020; Kumar et al. Reference Kumar2022; Mejía-Parada et al. Reference Mejía-Parada2024). To address this limitation and improve interpretability, a post-processing step was introduced to qualitatively classify erosion risk.
RUSLE model (A) with value class frequencies and corresponding areas (B) (figure by authors).

Figure 6 Long description
A heat map titled 'RUSLE model (A) with value class frequencies and corresponding areas (B)' displays soil erosion values across an area. The map uses a color gradient ranging from blue to red to indicate varying levels of soil erosion, measured in tonnes per hectare per year. The color scale on the left side of the map ranges from 0.0050367 to 3600, with specific values color-coded: blue for lower values and red for higher values. The map is overlaid on a satellite image of the area, showing buildings and vegetation. The data table on the right, labeled 'B', lists RUSLE values, percentage of pixels, and corresponding areas in square meters. The table categorizes soil erosion values into ranges, such as 0-100, 100-200, up to over 5000, with the dominant value being 0-100, covering 93.319% of the total area. The table also highlights significant, relevant, locally relevant, and negligible areas based on their soil erosion values. The heat map and data table together provide a comprehensive view of soil erosion across the studied landscape.
Specifically, the raw RUSLE output raster was clipped to a maximum threshold of 3600, based on representativeness of pixel values on the total area of the mound (Figure 6B), using QGIS’s raster calculator with the following formula (5):
 $${\rm{Clipped\;RUSLE}} = {\rm{RUSLE}} - \left( {{\rm{RUSLE}} - 3600} \right) \times ({\rm{RUSLE}} \gt 3600)\;$$
where ‘RUSLE’ is the raster file drawn from the project’s folder. Values exceeding this threshold were considered unrealistic or exaggerated representations interpreted as DSM pitting errors and were thus removed to minimise distortion in subsequent analyses.
Following the clipping, the raster was normalised to a scale of 0–100%, allowing for a relative assessment of erosion risk across the mound with the formula (6):
 $${\rm{Normalised\;RUSLE}} = \left( {{{{\rm{Clipped\;RUSLE\;}} - {\rm{\;}}0.0050367} \over {3600{\rm{\;}} - {\rm{\;}}0.0050367}}} \right) \times 100$$
where 0.0050367 is the lowest value assumed by the ‘Clipped RUSLE’ raster. This normalisation, here defined as ‘normalised relative erosion intensity’, enables a qualitative classification where the final values do not represent dimensional erosion rates, but rather express each cell’s relative severity compared to the maximum observed (i.e. clipped) value. The final map can be used to define risk categories (e.g. very low to very high) providing an advanced tool for the interpretation of relative erosion intensity and a guide for targeted conservation strategies, without requiring dimensional validation through impractical site measuring. This modified approach preserves the spatial distribution accuracy of the RUSLE model while improving its practical usability and minimising the effects of extreme outliers.
Discussion
After clearance and normalisation, the resulting raster was assigned colour ramps and superimposed with DSM-derived hillshade, providing 3D relief impression for the sake of data representation. The final model is presented in two colour-ramp variants (Figures 7 & 8).
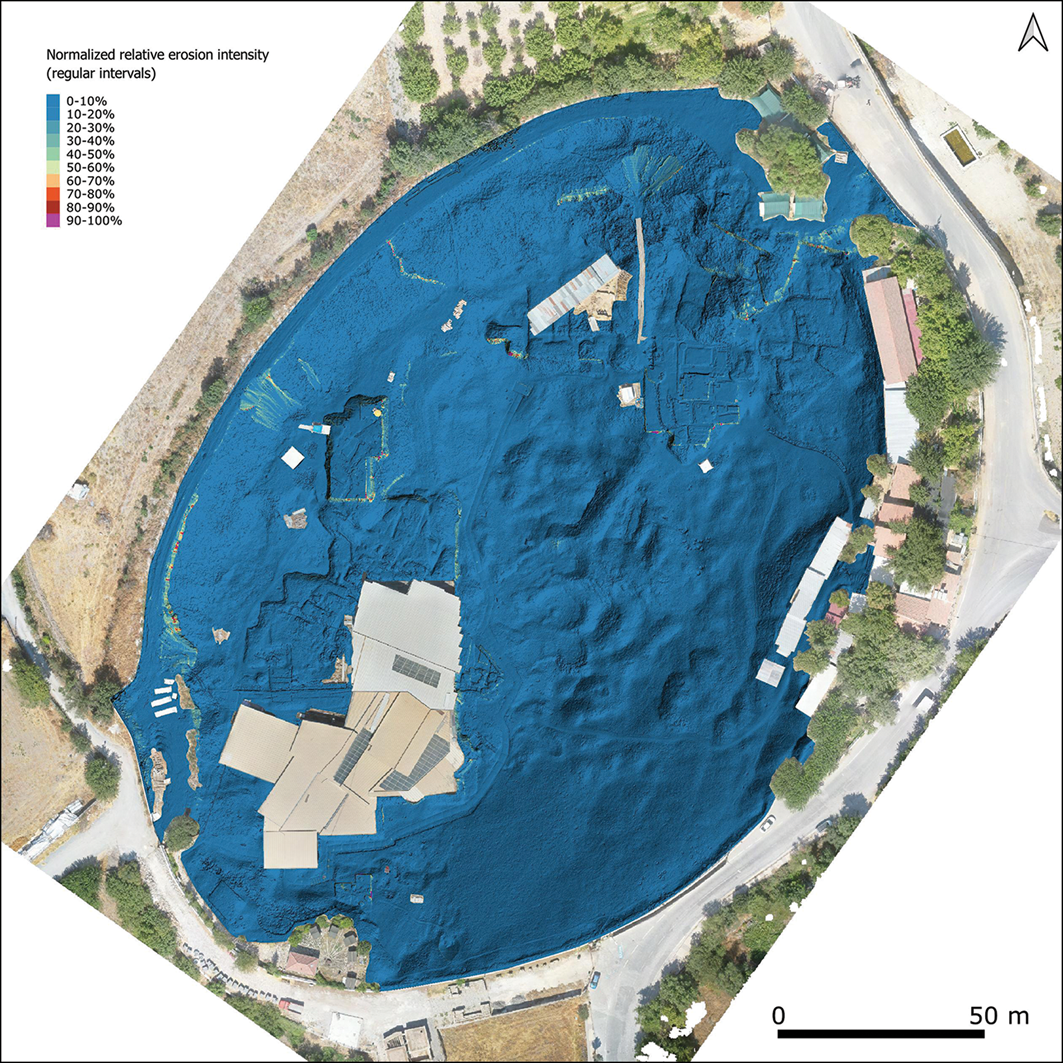
Final RUSLE model with values presented as evenly spaced 10 per cent increases. This highlights the general conditions of Arslantepe, characterised by limited erosional surface processes. Sensitive areas correspond to the sides of active archaeological excavation trenches and exposed surfaces, where steep gradients and no cover promote erosion, and to the loose spoil heaps currently in use for discarding excavation soil (figure by authors).

Figure 7 Long description
A heat map of Arslantepe displays normalized relative erosion intensity in regular intervals. The map uses a color scale ranging from blue to red, indicating erosion intensity from 0-10% to 90-100%. The majority of the area is shaded in blue, representing low erosion intensity. Higher erosion intensity areas, shown in green, yellow, orange, and red, are concentrated around the edges of active archaeological excavation trenches and exposed surfaces. These areas have steep gradients and lack cover, promoting erosion. Additionally, loose spoil heaps used for discarding excavation soil also show higher erosion intensity. The map highlights the general conditions of Arslantepe, characterized by limited erosional surface processes.
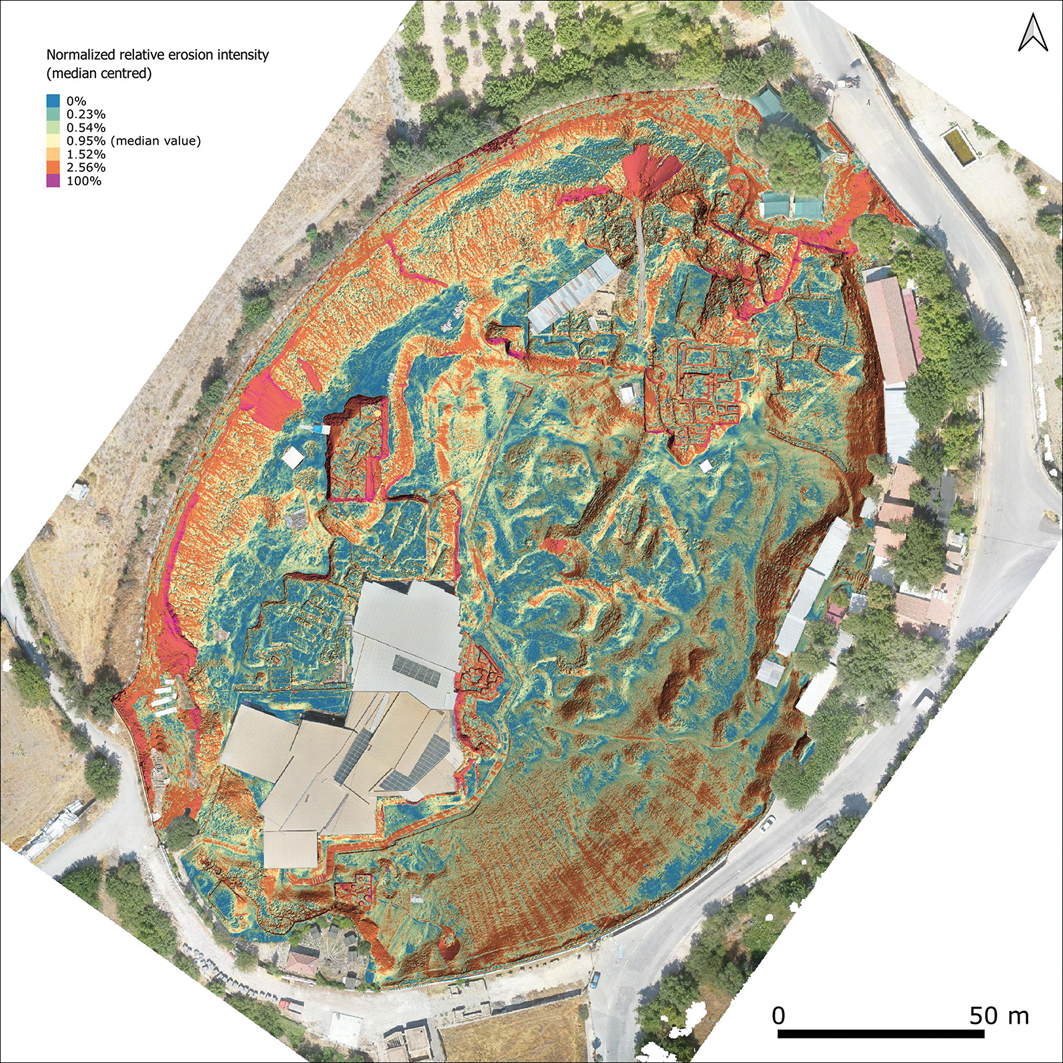
Final RUSLE model with values presented as median-centred. A median is defined as the value separating the higher half from the lower half of a data sample. This render highlights slight variations across K- and C-Factor uniform areas that are mainly conditioned by the steepness gradient (figure by authors).

Figure 8 Long description
A heat map showing normalized relative erosion intensity with a median-centered scale ranging from 0 to 100 percentage. The map features a color gradient where blue represents 0 percentage, green represents 0.23 percentage, yellow represents 0.54 percentage, orange represents 0.95 percentage, red represents 1.52 percentage, and dark red represents 100 percentage. The map highlights variations in erosion intensity across different areas, with notable concentrations of higher erosion intensity in the central and lower regions. The surrounding areas show lower erosion intensity, with a mix of green, yellow, and orange colors indicating moderate erosion. The map includes a scale bar indicating a distance of 50 meters for reference.
In Figure 7, values are represented as a colour ramp stretching from 0–100% with evenly spaced increases, resulting in a visual rendition that is informative of the general erosional asset across the site. The absolute prevalence of blue-hued values implies a general state of limited erosion across most of the mound’s surface. This is interpreted as the outcome of a twofold protective effect: on one hand, the presence of a grass-shrub cover protects the mound’s surface, preventing splash erosion and incipient rilling; on the other, the mound’s general topography prevents water channelisation and fast surface flow thanks to the large flat surfaces that are connected by steep but short slopes. This asset is, de facto, a grass-stabilised terrace system that is effectively limiting the inception of erosional processes thanks to the immediate or very quick dissipation of the rainfall’s kinetic and potential energy (Arnáez et al. Reference Arnáez2015). The locations with the highest erosion rates correspond, as expected, to active spoil heaps, which are prone to erosion due to their inherent lack of compaction and grass cover, and to the steeper archaeological trench sides, where no stable vegetation cover is present. Even though the trench sides are not steeper than other slopes found in other locations across the site, the absence of grass increases RUSLE values, highlighting the risk associated with the year-round exposure to rainfall of non-vegetated areas.
The RUSLE model shown in Figure 8 bears the same pixel values and metadata of that of Figure 7, but it is presented with a different colour-associated value progression. Here, the colour ramp and associated values are centred around the median value, automatically computed by QGIS in the raster’s styling panel, which is defined as the value that separates the higher half from the lower half of a data sample. As can be seen in Figure 8, the median value after normalisation is 0.95 out of 100; this means that half of all pixel values present a relative erosion intensity that is less than 0.95% of the highest possible value, which again corresponds to the spoil heaps and the non-vegetated sides of the excavation trenches (Figure 4). Moreover, most of the values that are greater than 0.95% still fall under 2.56%, proving that Arslantepe is indeed not subject to severe hydraulic erosion across the greater part of its surface. However, by compressing the colour ramp over a very small pixel-value interval, this representation highlights slight variations in relative erosion intensity such as those of the pathways, whose current erosional susceptibility appears relatively high as a result of repeated trampling, which hollows the ground and creates a preferential channelling path for water runoff. This provides a convenient predictive tool for locating higher probability areas for future or incipient erosional processes that could be triggered by changes in site maintenance policies, for example in the removal of grass from currently unmanaged sloping areas for the launching of new excavation trenches or the construction of new visitor pathways.
Conclusions
The production of a RUSLE model of Arslantepe, obtained from field-based evaluations and subsequent QGIS characterisations and computations over an ultra-high-resolution DSM, was successful for providing insight into the conservation status of the mound. By presenting RUSLE data through an adapted normalisation of the native dimensional pixel values, we obtained a relative erosion intensity map that revealed limited hydraulic erosion processes acting on Arslantepe, mostly located along steep and non-vegetated excavation trench slopes and on active excavation spoil heaps. However, by stretching low pixel values over a high-contrast colour ramp, we highlighted that many areas that are currently at low risk can become susceptible to incipient surface processes if grass cover were to be removed, exposing high-gradient surfaces to rainfall erosion.
Our approach thus informs on the current conservation status and differential erosion susceptibility of Arslantepe, while also offering a prospective risk map for directing future low-impact archaeological excavation and mitigation policies for limiting or reversing the active erosion processes across the exposed surfaces. Such advances are important given the recent induction of the site into the UNESCO World Heritage List, with an enhanced commitment to creating and following rigorous conservation and valorisation policies.
RUSLE modelling is easy to apply and cost-efficient, where decade-averaged rainfall data are available and an ultra-high-resolution DSM can be obtained by means of drone-based photogrammetry. Any archaeological expedition may benefit from this workflow both for the planning of new excavations and conservation strategies, and in creating valuable documentation for research institutions and heritage authorities alike.
Acknowledgements
This research stems from the Italian Archaeological Expedition in Eastern Anatolia (MAIAO), co-ordinated by Francesca Balossi Restelli of Sapienza University of Rome. The authors thank the institutional partners “Roma Tre” University (Rome), the Directorate General of Antiquities (Ministry of Culture, Türkiye) and the Directorate of Tourism Office of the Metropolitan City of Malatya. Stefano Costanzo is grateful to Dr Andrea Pezzotta for his support in software operation.
Funding statement
Stefano Costanzo is funded by the Italian Ministry of Universities through the PRIN 2022 PNRR (Research Projects of National Interest 2022, National Recovery and Resilience Plan, code P2022PNWYW), awarded to Lucia Mori (Sapienza University of Rome) and co-ordinated by Gian Maria Di Nocera (Tuscia University, Viterbo).
Author contributions: using CRediT categories
Stefano Costanzo: Conceptualization-Lead, Data curation-Lead, Formal analysis-Lead, Investigation-Lead, Methodology-Lead, Visualization-Lead, Writing - original draft-Lead. Nevio Danelon: Resources-Equal, Writing - review & editing-Supporting. Martina Ciavardini: Resources-Supporting, Writing - review & editing-Supporting. Francesca Balossi Restelli: Writing - review & editing-Supporting. Gian Maria Di Nocera: Funding acquisition-Lead, Project administration-Lead, Supervision-Equal, Writing - original draft-Supporting, Writing - review & editing-Supporting.

 Open access