

Introduction
Economic weights in breeding objectives have traditionally been derived using profit equations or bio-economic models to study the effect of genetic changes on profit. Lately however, stated preference techniques for eliciting consumer or farmer preference and measuring willingness to pay for goods or services have been considered when deriving these economic weights. There appear to be several reasons for the increasing interest in consumer-based preference methods when defining breeding objectives. In developing countries, where farm production and economic data generally are poor, stated preference techniques can be an alternative to methods based on profit equations or bio-economic models when estimating the relative importance of traits using conjoint analysis (Tano et al., Reference Tano, Kamuanga, Faminow and Swallow2003). Estimates of farmer’s preferences for cattle traits in Africa (Tano et al., Reference Tano, Kamuanga, Faminow and Swallow2003) and a stated choice experiment have been reported (Wurzinger et al., 2006). Methods based on evaluating individual’s preferences can also be applied to estimate an economic weight for traits in future markets. A contingent valuation method was applied by Von Rohr et al. (Reference Von Rohr, Hofer and Künzi1999) to derive economic weights for traits in pigs. Meat quality experts from slaughter and retail companies were asked how much they would be willing to pay for specific products. Olesen et al. (2006) discuss using choice experiments to derive economic weights for traits related to animal welfare. In addition, in industry contexts where farmer/and or breeder acceptance of breeding objectives is poor, application of choice experiment methods may increase farmer acceptance of breeding objectives.
The aim of a choice experiment is to estimate preferences of a group of respondents by establishing the relative importance of attributes (characteristics of a good) and to estimate the trade-off or marginal rates of substitution between attributes that individuals within the group are willing to make (Carson et al., Reference Carson, Louviere, Anderson, Arabie, Bunch, Hensher, Johnson, Kuhfeld, Steinberg, Swait, Timmermans and Wiley1994). In a choice experiment, a set of alternatives (the choice set), that are pre-specified in terms of levels of attributes, are incorporated into a questionnaire. Respondents are then asked to view various alternative descriptions of a good, differentiated by their attributes and levels, and are asked to choose their most preferred alternative in a given choice set. Within the context of consumer theory, the chosen alternative is assumed to be associated with the highest utility, where utility quantifies the degree of satisfaction from consuming different bundles of goods and services (Train, Reference Train2003). The problem with a survey is that, in practise, it is usually unrealistic to present each respondent with choices among all alternative combinations of attributes. Therefore, it is important to generate and ask questions in such a way that the maximum amount of information is collected from each respondent given other constraints such as complexity for the respondent and the cost of a survey. In addition, with many attributes in the choice experiment, there is a risk that respondents may simplify the task by focusing only on the most important attributes. Therefore, limits need to be placed on the number of attributes that can be realistically examined (Carlsson and Martinsson, Reference Carlsson and Martinsson2001).
Methodology describing how results of choice experiment methods can be incorporated into economic weights to be used in a breeding objective is still scarce. Additionally, the need to account for differences in the frequency and timing of genetic trait expression has not been explicitly acknowledged. Furthermore, it is not clear how powerful, realistic, and practical, choice experiment designs might be for the accurate specification of breeding objectives.
The aim of this study was to show how choice experiments can be used to derive economic weights in breeding objectives. We simulated a partial profile choice experiment (Chrzan and Elrod, 1995) with four different traits each at three levels. In a partial profile design the choices are simplified so that only a subset of traits is used in each choice set, making participation in the experimental process less onerous. The effectiveness of different designs was evaluated based on comparisons between true and simulated preferences for varying numbers of respondents and choice sets per respondent. Finally, we show how parameters obtained from a choice experiment can be used to derive economic weights.
Material and methods
Experimental design
In the context of determining the relative importance of traits in a breeding objective, the alternatives in a choice experiment may consist of animals, animal group definitions or animal products (here referred to as animal profiles), while the attributes in a given alternative are represented with genetic traits each at different performance levels (e.g. mastitis resistance as a trait with performance level of 10% cases in the herd v. 20% cases in the herd). Respondents may be farmers, consumers, etc. In breeding objectives the relative importance of many traits usually needs to be estimated. In a survey with, e.g., four traits each at three levels, there could potentially be 81 different animal profiles (alternatives) and 648 unique choice sets with two alternatives each. Therefore, an experimental design including all traits in each alternative including all choice sets for each respondent is not realistic.
Alternatively, in a partial profile design, the task is simplified because only a subset of attributes is presented for each respondent (e.g. with four traits each respondent might only be presented with two traits at a time). Presenting only a subset of the attributes to each respondent simplifies the task, which possibly reduces errors in the response process. Because the task for the respondents is simplified, a greater number of attributes can be included in the survey (Reference ChrzanChrzan, 1999).
There is currently no software package generating choice designs using partial profiles (So and Kuhfeld, 2005). The designs used in this study were generated using SAS® (Statistical Analysis Systems Institute, 1999). Three different choice designs differing in the number of traits, which were presented in each choice set, were compared. All three designs included four traits (A, B, C and D) each at three levels (1, 2 and 3) and respondents should choose between two alternative animal profiles.
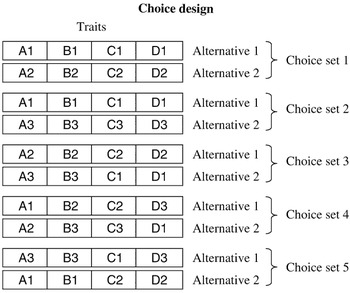
In the first design, respondents were presented with all four traits simultaneously. For example, in one choice set they should choose between an animal profile characterised as A1, B1, C1 and D1 and an animal profile characterised as A3, B2, C2 and D3. Figure 1 presents an example of a choice design with five choice sets for a respondent using this first design with all four traits represented simultaneously.
Choice design with four traits (A, B, C and D) each at three levels (1, 2 and 3). The total number of choice sets is five and there are two alternatives in each choice set. Each alternative in a given choice set represents an animal profile with traits at different levels.
In the second design, respondents were only presented with three of the four traits per choice set. For example, respondents should choose between an animal profile characterised as A1, B1 and C1 and an animal profile characterised as A2, B3 and C2. In another choice set, they should choose between an animal profile characterised as A1, B2 and D1 and an animal profile characterised as A3, B3 and D2. In the third design respondents were only presented with two of the four traits per choice set respectively.
Simulation
For each respondent, a choice design was simulated by randomly drawing the required number of choice sets from the full set of all possible choice sets (an example of a choice design with five choice sets for a respondent using the design with all four trait represented simultaneously is shown in Figure 1). A choice set was rejected if levels of any trait was represented at the same level across the two alternative animal profiles (e.g. A1, B1, C1, D1 in alternative 1 v. A1, B2, C2, D2 in alternative 2 would be rejected because A1 exists in both alternatives). Restrictions regarding number of traits and number of levels per trait per respondent were applied in order to balance the design. A respondent design was rejected and re-sampled if each trait or if each level within a trait was represented in less than 10% of the whole choice design. For the two and three trait designs, a design was rejected if each trait or each level within a trait was represented in less than 5% of the choice design.
For each simulated respondent, a set of true preferences for each of the four traits was defined. The true preference for trait A was defined as the utility for a 1-unit increase in trait A and was set equal to 1. True preferences for traits B, C and D were defined as the marginal increase in respondent utility for a 1-unit increase in traits B, C and D each expressed relative to respondent preference for trait A. The degrees of true preferences (utility) for trait B, C and D relative to trait A varied among the three traits (Table 1). The simulated true preferences were chosen to represent traits with high (trait A), medium (trait C), low (trait D) and medium negative (trait B) respondent preferences (a negative preference means that respondents preferences decrease with a unit increase in a given trait). True respondent preferences for traits B, C and D relative to trait A were sampled from normal distributions with specified means and standard deviations (Table 1). The standard deviations shown in Table 1 correspond to either a low (20%) or high (80%) coefficient of variation relative to the means of simulated trait preferences.
Level of variables investigated for each of the three choice designs

†Mean utility for trait B relative to trait A per level increase.
‡Mean utility for trait C relative to trait A per level increase.
§Mean utility for trait D relative to trait A per level increase.
True simulated respondent preferences were then applied to the simulated choice designs, by computing a preference score for each respondent for each alternative animal profile in a given choice set. Preference scores were computed as the sum across traits of simulated true trait preferences after multiplication by the number of levels for the traits in each simulated alternative. The respondent choice was then taken as the alternative with the highest preference score for that respondent in a given choice set. The ranges of true simulated respondent preferences presented in Table 1 were applied for all the different designs. Choice design and the simulated respondent choice were used for data analysis, and the results of the data analysis (means and standard deviations of derived preferences) compared with the average of true simulated respondent preferences. Standard deviations of simulated preferences were used as a measure of accuracy of the estimates. To evaluate and compare the three different designs, sensitivity analyses were performed where the number of choice sets presented to each respondent and the number of respondents in each survey varied (Table 1). Each experimental design was simulated using 200 replicates.
Statistical model
The data analysis was based on random utility model theory, which is usually used as the basis for analysis of choice-based experiments (Train, Reference Train2003). In a conditional logit model, the explanatory variables Z consist of characteristics of a given alternative. The variables in Z assume different values for each alternative in a given choice set and the impact of a unit of Z is assumed to be constant across alternatives. The conditional logit model is the multiple choice generalisation of the binary logit model, where the dependent variable measures the most preferred option with respect to the remaining alternatives. It is assumed that the observed choice is the one associated with the highest utility. If respondents make sequential or repeated choices, observations and choices are assumed to be independent. The probability that an individual j chooses alternative k is
where θ is a single vector of regression coefficients. The choice probabilities are the exponential of the utility of alternative k divided by the sum of the exponential utilities for all alternatives. The most commonly used estimation method is based on maximum likelihood principles (So and Kuhfeld, 2005). Maximum likelihood estimates of the parameters can be estimated using proportional hazard regression techniques. In this study we used SAS® (SAS, 1999) to obtain the regression coefficients (θ). In SAS, the PHREG procedure fits the cox proportional hazard model to survival data with the partial likelihood of Breslow having the same form as the likelihood in a conditional logit model (So and Kuhfeld, 2005):
With four traits each at three levels as applied in this study the vector of regression coefficients is

where βij is the regression coefficient for trait i (i = 1, …, 4) and level j (j = 1, 2 or 3). The solutions for the regression coefficients were based on an average of the 200 simulated replicated choices across respondents.
Derivation of economic weights
The vector of estimated regression coefficients (θ) from the conditional logit model can be used to estimate the relative economic weights of traits. Economic weights were expressed per unit change in trait i′ relative to a unit change in trait i = 1 and were computed as
where αij = absolute level of trait i at level j (1, 2 or 3 in this study). The numerator is the economic weight for trait i expressed per trait unit by dividing by the change in the absolute level of the trait (the difference between the absolute level of the trait at level 3 (αi ′,j = 3) and level 1 (αi ′,j = 1)). In this study αi ′,j = 1 was equal to 1 and αi ′,j = 3 was equal to 3. The denominator is the economic weight for trait 1, which ensures that the economic weights of traits 2, 3 and 4 are expressed relative to the economic weight of trait 1.
In this study we simulated a linear relationship between trait preferences and trait levels. However, non-linearity in trait preferences with respect to trait levels could possibly be observed as
In this instance, the relative economic weights could be computed as
for the range αi ′, j = 1 to αi ′,j = 2
and as
for the range αi ′,j = 2 to αi′,j = 3.
Accounting for differences in timing and frequency of trait expression
When deriving the economic weights used in a selection index, it is necessary to account for differences in the timing and expression of various trait categories (e.g. McClintock and Cunningham, Reference McClintock and Cunningham1974). For example, traits such as the direct effect of difficulty at parturition are expressed once by every animal at birth, whereas reproduction traits are usually expressed repetitively over the production life of breeding females only. This has important implications for the way animal group definitions are formulated when presenting options to farmers as respondents. For example, the animal group definitions might be posed to the farmer in such a way that the effects of differences in frequency and timing of trait expressions are accounted for during the choice process. The farmer would be asked to make choices between purchased breeding males that will result in genetic changes in the herd over time (e.g. a bull whose estimated breeding value is +5% for difficulty at parturition in breeding females after first mating v. a bull with an estimated breeding value of 0%). The farmer must therefore implicitly anticipate the effects of differences and timing of trait expression as part of the choice process. Alternatively, the farmer could be asked to make choices based on differences in specific farm events (e.g. a 10% incidence of difficulty at parturition in breeding females after first mating, v. a 5% incidence) that are interpreted as occurring instantaneously. In this situation, a birth trait will be expressed in the same time and at the same frequency as a reproductive trait. Thus, the application of discounted gene flow principles to breeding objectives based on contingency valuation techniques depends explicitly on the way the questions are asked.
Results
Effects of number of choice sets per respondent
Table 2 presents results from the simulations of the three choice designs where two, three and four traits are presented per respondent and the number of choice sets per each of the 50 respondents are 10, 20 and 30, respectively. In general, differences between true and estimated respondent preferences were highest for trait D, which had the lowest true preference (0.2). Also the accuracies of the estimates were lowest for trait D, as indicated by the standard deviations of the estimates over replicates. There was a clear tendency for a reduction in accuracy of the estimates for traits B and C when the number of traits per choice set in the design increased from two to three, whereas the accuracy of the estimates were similar for three and four traits per choice set. However, for trait D the accuracy of estimated preferences was higher when the number of traits per choice set was three compared with two. Based on a comparison of simulated and true means of respondent preference using units of standard errors of the estimates (i.e. standard deviation divided by square root of 50 (the number of simulated respondents)), the estimates for trait D are biased downwards when there are three traits per choice.
Mean and standard deviations in parentheses of estimated preferences for trait B, trait C and trait D relative to preference for trait 1 with 50 respondents surveyed and 10, 20 or 30 choice sets per respondent based on 200 replicates

The survey includes four traits, but the number of traits presented to each respondent in each choice set varies from two to four. True preferences for simulated respondents for traits B, C and D relative to preference from trait A were 0.5, 0.5 or 0.2, respectively, and their coefficients of variation (CV) were 20% (Low) or 80% (High).
There was a significant increase in the accuracies of the estimates for all three traits when the number of choice sets per respondent was increased from 10 to 20. Increasing the number of choice sets from 20 to 30 only had minor influence on the accuracies of the estimates for traits with the high preferences (B and C), but a higher effect on trait D with the lowest true preference. Table 2 also presents simulated preferences for each of the three traits for two different levels of standard deviations of the true simulated preferences. Increasing the standard deviations of simulated true preferences across respondents did increase the standard deviation of estimates over replicates, but the effect was modest relative to the difference in standard deviations of true preferences. For the highest level of standard deviation of simulated true preferences, estimated preferences for all three traits were biased for most of the simulated number of choice sets and whether two, three or four traits were presented for the respondents.
Effects of number of respondents in the experiment
The effects of increasing the number of respondents surveyed are shown in Figure 2 for the situation where respondents are asked to make 20 choices between two different alternative animal profiles in each of the 20 choice sets. No meaningful bias was detected for any of the traits (simulated preferences were −0.5, 0.5 and 0.2 for traits B, C and D relative to trait A, respectively). The negative preference for trait B had no effect on the accuracy of estimates as shown by the dotted lines indicating 2 standard deviations around the mean estimates. In contrast, the accuracy of the preference estimates was lower for trait D which had the lowest absolute effect. This difference in accuracy was maintained, irrespective of the number of respondents surveyed. Improvements in accuracy of preferences relative to trait A were very modest for all three traits once the number of respondents increased beyond 30.
Mean (solid) and range plus or minus two standard deviations (dotted) of estimated relative preferences for trait C (top set), trait D (middle set) and trait B (bottom set) for a survey with two traits per choice, 20 questions per respondent and 200 replicates, with from 10 to 100 respondents surveyed. The coefficient of variation of true preferences for the simulated respondents was 20%.
Discussion
Efficacy for breeding objective definition
This study has demonstrated that partial profile choice experiments can provide accurate and unbiased estimates of economic weights based on respondent preferences for different livestock traits. The reliabilities of the parameter estimates depended highly on the number of choice sets per respondent and the number of respondents in each experiment with the number of choice sets per respondent being the most important.
Estimated preferences for traits were unbiased and accurate when a low level of standard deviation of simulated true preferences was used (20%). However, for the high level of standard deviation (80%) of simulated true preferences, estimated preferences for all three traits were biased for most of the simulated number of choice sets and whether two, three or four traits were presented for the respondents. The biases were modest compared with the level of variation across respondents. A tendency for larger biases and standard deviations of estimated preferences for trait D compared with trait B and trait C indicates that partial profile choice designs may provide slightly less reliable estimates for a trait with low preference compared with other traits.
We have explicitly defined how relative economic weights used in selection indexes can be defined from maximum likelihood solutions of a conditional logit model fitted to the data generated. These are expressed as relative units of preference to relative unit trait changes. The sizes of the parameter estimates from the logit model have no absolute interpretation in themselves, rather, the ratio between two parameters is equal to the marginal rate of substitution between two attributes in the experiment (Tano et al., Reference Tano, Kamuanga, Faminow and Swallow2003). Economists tend to present relative importance of traits as parth worths or marginal values (e.g. Sy et al., Reference Sy, Faminow, Johnson and Crow1997; Tano et al., Reference Tano, Kamuanga, Faminow and Swallow2003), which is the contribution of an attribute level to the total utility of a given profile. The relative importance of traits or attributes are calculated by taking the difference between the highest and lowest utility value for a given attribute and dividing by the sum of the ranges of utilities of all attributes. However, for a practical application of economic weights in selection indices, economic weights should be expressed per unit trait change as in this study or alternatively per genetic standard deviation. In addition, in order to derive economic weights, the survey questions should be developed on an individual traits basis (e.g. welfare related to individual traits) and they should include the performance level of the trait. When considering surveys with consumers as respondents, performance levels of traits must be explained to the consumers (e.g. what is mastitis and what are the consequences for the cow of getting infected with mastitis to a specified degree of infection which maps directly to the units for which an estimated breeding value can be estimated).
In situations where the traits of interest for genetic improvement are expressed at different times of an animal’s life, and with different frequency of expression, discounted gene flow principles (e.g. McClintock and Cunningham, Reference McClintock and Cunningham1974) also need to be considered closely in the formulation of the survey questions. Depending on the way the questions are formulated, some modification to the estimates of relative economic weights may be required before they can appropriately be applied in selection indexes.
In animal breeding there is a time lag from when animals are selected until genetic improvement is expressed by the progeny. Therefore, economic weights in the breeding goal should be projected for the future. Production circumstances (market prices, production systems, etc.) at the moment of genetic expression may differ from production circumstances when animals were selected for breeding. Choice experiments, as applied in the current study, were developed for evaluating new brands or to obtain estimates of consumer preferences for goods, which are not traded on ordinary (or current) markets (e.g. Von Rohr et al., Reference Von Rohr, Hofer and Künzi1999). Deriving economic weights based on hypothetical markets fits well with the issue of projecting economic weights for the future, because respondents can be asked to project their preferences and corresponding choices into a future context.
Profit equations or bioeconomic model are generally based on maximising the profit of the farmer but may not reflect the full goals and aspirations of farmers. Profit equations and bioeconomic models are also commonly subjected to arbitrary restraints on the scale of the farming enterprise which can affect estimates of economic weights (Amer and Fox, Reference Amer and Fox1992). When deriving economic weights using a choice experiment with farmers as respondents, their opinions can be included and the economic weights will more likely reflect their aspirations than economic weight derived using a profit equation or a bioeconomic model. On the other hand, how much consumers or farmers are willing to pay may not correctly represent the pure effects of changes in the traits considered on farm profit or production efficiency. Farmers and/or consumers may also not feel confident in their own perceptions of at least some trait values and prefer to rely on technical expertise to define them. Therefore, in many cases, methods based on choice experiments should complement profit equations or bioeconomic models. Technical model derived economic weights can be compared with those derived using choice experiments and their differences can be quantified. This may provide valuable insights in industries where adoption of, and/or price premiums for, genetically improved livestock is less than expected. Methods based on choice experiments may also be relevant for definition of breeding objectives for sustainable production where non-market values of traits of traits are derived based on economic weights using a profit equation and on how much farmers are willing to pay for improvements in functional traits (e.g. Nielsen et al., Reference Nielsen, Christensen and Ødegård2006).
Experimental design
In this study we considered partial profile choice experiments. The main reason for choosing the partial profile experiment compared with full or fractional choice designs was the possibility of including a high number of attributes, which is important in a breeding objective context.
Caussade et al. (Reference Caussade, de Dios Ortúzar, Rizzi and Hensher2005) found that each respondent could only manage a maximum of six attributes in each alternative. This is most likely because as respondents attempt to process more information they will either make mistakes or adopt a simplified strategy based on partial information only where they ignore less important attributes. Therefore, increasing number of attributes has a highly negative effect on the respondent’s ability to choose, which significantly increases the error term of the experiment (Arentze et al., Reference Arentze, Borgers, Timmermans and DelMistro2003; Caussade et al., Reference Caussade, de Dios Ortúzar, Rizzi and Hensher2005). Our results indicate that including more traits per choice set also lowers the statistical power of the conditional logit statistical approach.
Many livestock breeding objectives include more than six traits. In a partial profile experiment, the number of attributes in each profile is less than the total number of evaluated attributes. Therefore, a larger number of traits/attributes can be included in the experiment (Chrzan, Reference Chrzan1999). Simplification of the choice task for the respondents resulting from presenting only a subset of the attributes may be the reason why estimated utilities from a partial profile choice design have been found to have lower variances than estimates from full or fractional choice designs (Chrzan and Elrod, 1995; Chrzan, Reference Chrzan1999). A reduction in the number of traits presented to the respondents at one time is also particularly important when using pictorial representation of the traits (Tano et al., Reference Tano, Kamuanga, Faminow and Swallow2003).
In this study, in addition to varying the number of attributes in each alternative, we also varied the number of choice sets presented per respondent from 10 to 30. Caussade et al. (Reference Caussade, de Dios Ortúzar, Rizzi and Hensher2005) found that the optimum number of choice sets per respondent in a choice experiment was around 10. For up to 10 choice sets, a learning effect was observed which may decrease the error variance. With more than 10 choices, Caussade et al. (Reference Caussade, de Dios Ortúzar, Rizzi and Hensher2005) found an increase in error variance due to the higher information load presented to the respondents.
Besides number of attributes in each alternative and number of choice sets, other design dimensions such as number of alternatives in each choice set and number of levels per attribute contribute to the error variance of the design (Arentze et al., Reference Arentze, Borgers, Timmermans and DelMistro2003). Next to the number of attributes in each alternative, number of alternatives per choice set is the most important factor contributing to error variance of a choice design (Caussade et al., Reference Caussade, de Dios Ortúzar, Rizzi and Hensher2005). Including more alternatives per choice set up to a given threshold can possible reduce error variance of our simulated design because increasing numbers of alternatives increase the probability of a better matching option for the respondent (Caussade et al., Reference Caussade, de Dios Ortúzar, Rizzi and Hensher2005).
Only four traits were included in our study. Further studies concerning deriving economic weights using choice experiments should therefore evaluate partial profile choice designs efficiency with a larger number of traits. However, several methods to reduce the number of traits in the survey exist. Among others, there is the two step approach applied by Tano et al. (Reference Tano, Kamuanga, Faminow and Swallow2003). In that approach, a number of traits of interests is initially identified. Later the number of traits is reduced using participatory consultative procedures. In addition, four traits as applied in this study should be enough to obtain the relative importance in the primary traits of interest for genetic selection. Errors in economic weights of traits with smaller genetic variation in profitability are unlikely to significantly affect the efficiency of selection (Smith, Reference Smith1983; Amer and Hofer, Reference Amer and Hofer1994). On the other hand, only including a subset of traits in a choice experiment will increase the risk of overlooking a non-scientific trait (e.g. a type trait without a direct economic value), but one which is strongly preferred by farmers.
Partial profile choice experiments were considered in this study. Other stated preference methods like conjoint analysis could potentially be used. In conjoint analysis, respondents are presented with different animal profiles and are asked to rate or rank the different profiles (see e.g. Sy et al., Reference Sy, Faminow, Johnson and Crow1997; Tano et al., Reference Tano, Kamuanga, Faminow and Swallow2003). However, there are advantages with a choice based approach, as applied in the current study. Choosing their preferred alternative between different alternatives is a more realistic task that consumers or farmers often perform. A disadvantage with the partial profile choice approach is a scarcity of software packages to generate the design (Kuhfeld, 2005). Other methods that could possible be used are adaptive conjoint analysis, which also uses partial profile choice sets. Adaptive conjoint analysis is a conjoint method, which customises each choice task based on each respondents prior utilities in order to provide robust estimates from relatively few questions (Toubia et al., Reference Toubia, Simester, Hauser and Dahan2003). The method is web-based because questions are customised for each respondent during the choice tasks.
In our simulated choice design, respondents were presented with two alternative animal profiles and were assumed to choose their most preferred alternative. Recently, also choice experiments with real economic incentives (real choice experiments) have been applied (e.g. Alfnes et al., Reference Alfnes, Guttormsen, Steine and Kolstad2006). In a choice experiment with real economic incentives, respondents are forced to commit to their chosen alternative. In that way the choices have economic consequences for the respondent. One reason for the increased interest in choice experiments with real incentives is to avoid a hypothetical bias. This hypothetical bias occurs when consumers overvalue how much they are willing to pay for different alternatives (Carlsson and Martinsson, Reference Carlsson and Martinsson2001). However, choice experiments with real incentives are often not relevant for the livestock breeding objective context, where farmer preferences are evaluated. Usually, farmers have the option to select among breeding stocks with a wide variety of genetic attributes, usually at quite similar prices. This is because sellers of improved breeding animals derive extra revenue largely through maintaining or increasing market share, rather than from attracting a higher price per animal sold. But real incentives can possible be included when consumer preferences for different animal products are evaluated (e.g. Von Rohr et al., Reference Von Rohr, Hofer and Künzi1999). In addition, hypothetical bias mainly influences estimates of people’s willingness to pay for a product. In our approach, economic weights are based on relative differences across traits in marginal utilities and not on willingness to pay.
Some choice experiments also include the possibility for the respondent not to choose any of the alternatives presented for them in each choice set. This is typically done in order to avoid forced choices between different alternatives which are equally preferable to the respondent (Train, Reference Train2003). Further studies could consider providing respondents with the option of not choosing any of the presented alternatives in a given choice set.
Heterogeneity of economic weights
One important issue in the formulation of breeding objectives is the potential differences in preferences among respondents due to differences in, e.g., production and management system for different farmers (Groen et al., Reference Groen, Steine, Colleau, Pedersen, Pribyl and Reinsch1997). If farmer preferences differ depending on the levels of different traits, diversification of the breeding objective might be relevant. Characteristics of farmers or respondents can be included in a choice experiment by fitting a mixed logit model where utility is a function of both characteristics of the respondent and the product/the animal (So and Kuhfeld, 2005). Farmer or respondent characteristics can be fitted as an interaction between farmer/respondent type and level of the trait. The parameter estimates are then the marginal impacts of interaction between levels of traits and respondent/farmer type (Tano et al., Reference Tano, Kamuanga, Faminow and Swallow2003). Sy et al. (Reference Sy, Faminow, Johnson and Crow1997) and Tano et al. (Reference Tano, Kamuanga, Faminow and Swallow2003) included characteristics of the farmers when estimating farmer preferences for cattle traits.
Non-linearity of economic weights
In this study we simulated the utilities for all the traits as linear functions of the level of each of the traits. In reality, there might be a non-linear relationship between utility and trait levels meaning that farmer preferences would differ between levels of traits. Using stated preference methods, non-linearity of economic weights can easily be detected by comparing preferences for each of the levels within a trait. If non-linearity of economic weights are expected, it may be advisable to consider more than three levels for the traits concerned. Consideration of index application of non-linear economic weights was however beyond the scope of this paper.
Conclusion
We have demonstrated that a method based on a practical choice experiment design can be used to define economic weights for use in animal breeding selection indexes where traditional approaches such as profit equations and bioeconomic models are not practical. Simulation results demonstrate that when the relative importance of four traits are to be considered, practical designs involving, e.g., 20 choice sets based on a subset of two traits at each choice, and over 30 respondents provide relatively accurate estimates of relative respondent preferences for unit changes in traits. On the other hand, when the preferences of the respondents within a sample group are quite heterogeneous, estimated preferences might be slightly biased, with a greater risk of bias for traits with relatively low preference. The approach may also be of interest to commercial breeding programs wishing to formulate a quantitative understanding of market preferences for attributes of the genestocks that they sell.
Acknowledgements
This study was financed by The Research Council of Norway Grant No. 143045/140 (Future Animal Breeding Goals).


