


It is estimated that an additional 50 % protein will be required by 2050 as the global population increases(Reference Henchion, Hayes and Mullen1), which may put individuals from all generations at an increased risk of protein undernutrition. Several studies have also shown that inadequate protein intake in broad generations, including younger individuals, might lead to reduced physical activity through the effect on muscles(Reference Deutz, Bauer and Barazzoni2,Reference Landi, Calvani and Tosato3) . In addition, it is speculated that the reduced physical activity in individuals from younger generation would increase the risk of disease development later in life. Besides, several studies have reported that protein undernutrition may induce fatty liver and lead to liver disease in the long term(Reference Yamada, Odamaki and Araki4–Reference Toyoshima, Tokita and Taguchi7). Thus, because protein undernutrition has potential adverse effects on living tissues such as the muscles and liver, it would be desirable to establish minimally invasive and easy-to-collect biomarkers detecting the nutritional status as early as possible. Biomarkers that reflect protein undernutrition in bio-fluid samples such as blood and urine could be extremely useful for the prevention of chronic protein malnutrition and the secondary diseases in a wide generation range.
The levels of specific circulating proteins such as transthyretin, transferrin and albumin in blood have been reported to correlate with protein nutritional status(Reference Zhang, Pereira and Luo8,Reference Omran and Morley9) . Furthermore, it has been reported that urine as well as blood may be able to detect protein nutritional status(Reference Omran and Morley9). Urine could be advantageous over blood, as the sampling is non-invasive and easy to perform frequently. However, unlike proteins in blood, those in urine are difficult to apply widely as a biomarker because they are only detected in individuals with renal dysfunction(Reference Gowda, Desai and Kulkarni10). Hence, low-molecular-weight metabolites, non-protein components in urine, are generally focused on. Although urinary nitrogen has been reported as the metabolite that correlates with total protein intake, nitrogen sources other than protein make a greater contribution to total nitrogen levels(Reference Bingham11). 3-Methylhistidine is a urinary metabolite that correlates with protein nutritional status; however, the excretion level is reported to increase with meat intake(Reference Marliss, Wei and Dietrich12,Reference Stella, Beckwith-Hall and Cloarec13) , and the nutritional status in response to meat-derived proteins may be overestimated. Thus, to the best of our knowledge, there are few suitable urinary metabolites that correlate with protein nutritional status.
Metabolomic approaches provide low-molecular-weight metabolite profiles to help understand biological responses. Highly informative metabolic profiles can be a potential source of biomarkers; therefore, metabolomics has been a promising tool for the diagnosis of several diseases such as cancer and heart diseases(Reference Abate-Shen and Shen14,Reference Brindle, Antti and Holmes15) . Metabolomics can also be used for the discriminant analysis of physiological responses to nutritional status(Reference Jones, Park and Ziegler16). NMR and MS have been used as techniques for metabolomics. The NMR method is less sensitive; however, it has many advantages such as high reproducibility, high quantitation, minimal sample requirement and non-destructive characteristic compared with MS methods(Reference Moco, Bino and De Vos17). Therefore, the NMR analysis was applied to identify and quantify complex metabolites in biological samples such as urine, plasma and liver in this study.
We have recently investigated the effects of moderate protein undernutrition on plasma protein profiles in adult Wistar rats where rats were maintained on an AIN-93 M (14 % casein, control (CT) diet) or AIN-93 M-based isoenergetic diet containing 5 % casein (low-protein (LP) diet) for 4 weeks(Reference Wada, Izumi and Shimizu18). The use of this animal model has been justified by confirming that this nutritional condition reflects the potential protein undernutrition in human(Reference Wada, Komatsu and Izumi19). Here, we expanded the investigation on the same animals, focusing on their metabolites. The aim of this study was to identify novel urinary metabolites as biomarker candidates that were responsive to protein undernutrition using NMR metabolomic and transcriptomic analyses.
Experimental methods
Animal experiments
The study design was approved by the Animal Research Committee of Morinaga Milk Industry Co. Ltd (approval number: 18-025), and experiments were performed in accordance with their guidelines (27 September–9 November 2018). The detail has already been described in our recent report(Reference Wada, Izumi and Shimizu18). Briefly, twelve male Wistar rats (14 weeks old; Japan SLC) were acclimated individually to polycarbonate cages with wood shavings in temperature-, humidity- and light-controlled facility (21–25°C, 40–60 % and a 12 h light–12 h dark cycle) by allowing them ad libitum access to water and the CT diet for 2 weeks. Then, animals were assigned to two dietary groups, being fed ad libitum either the CT diet or the LP diet for 4 weeks (respectively, n 6). This sample size is the minimum necessary for reliable statistical verification. Urine samples were obtained weekly during the experimental period using metabolic cages. At the experimental period (after 4 weeks), animals were euthanised by deep anaesthesia with sevoflurane and blood samples were drawn from the inferior vena cava using syringes. Blood samples were centrifuged at 1700 g for 10 min at room temperature, and the upper plasma layers were collected and stored at –80°C until analysis. Liver samples were then obtained and frozen in liquid N2. All the samples were stored at –80°C until analysis. Furthermore, welfare-related assessments and interventions were carried out before, during and after the experiment by the Animal Research Committee.
Sample preparation for NMR analysis
Urine samples (540 µl) were mixed with 60 µl of PBS in 100 % D2O containing 500 mm NaP, 5 mm 3-(trimethylsilyl)propionic acid-d4 sodium salt (TSP) and 0·04 % (w/v) NaN3. This mixture was centrifuged at 15 000 g for 5 min at 4°C, and 550 µl supernatant was transferred to a 5 mm NMR tube (Shigemi). Plasma samples (540 µl) were mixed with 60 µl of PBS in 100 % D2O containing 500 mm NaP, 5 mm TSP, 10 mm formate and 0·04 % (w/v) NaN3 and centrifuged at 3000 g for 5 min at 4°C, and 550 µl of supernatant was transferred to a 5 mm NMR tube. Liver samples were homogenised in 1·0 ml of extraction buffer (acetonitrile–MilliQ water = 1:1) per 100 mg of liver at 25 000 rpm for 30 s on ice. The homogenate was centrifuged at 5480 g for 10 min at 4°C, and 800 µl of supernatant was collected and lyophilised. The lyophilised sample was suspended in PBS in 100 % D2O containing 200 mm NaP and 2 mm TSP. The suspension was centrifuged at 15 000 g for 5 min at 4°C, and the 550 µl of supernatant was transferred to a 5 mm NMR tube. The pH of all supernatants was adjusted to 7·4. TSP and formate were used as internal standards. D2O was used as an internal lock solvent.
NMR spectra acquisition
1H NMR spectra were recorded using a Bruker 600 MHz AVANCE III spectrometer (Bruker) at a proton frequency of 600·13 MHz with the sample temperature controlled at 298 K. The 1H NMR spectra of urine and liver samples were recorded using a water-suppressed standard one-dimensional NOESY1D pulse sequence, while those of the plasma samples were recorded using a water-suppressed standard one-dimensional CPMG pulse sequence. Each spectrum consisted of 32 768 data points with a spectral width of 12 parts per million (ppm). The acquisition time was 2·28 s, and the number of scans was 128. A water-suppressed pulse sequence was used to reduce the residual water signal at the water frequency with a recycle delay (D1 (Bruker notated)) of 2·72 s and a mixing time (D8 (Bruker notated)) of 0·10 s. A 90° pulse length was automatically calculated for each sample analysis.
Spectral data processing and multivariate data analysis
All raw spectra were manually corrected for phase and baseline distortions against TSP resonance at δ = 0·0 ppm using Delta 5.0.4 (JEOL). The spectra were normalised to the peak area value of the internal standards TSP or formate using the NMR Suite 7.5 Processor (Chenomx). Differences in urine concentration between the samples were corrected by dividing each by their creatinine content. The normalised spectral data were exported to NMR Suite 7.5 Profiler (Chenomx). In the first round of processing, the 0·0–10·0 ppm chemical shift region was integrated into regions with a width of 0·04 ppm, while spectral regions related to residual water (4·68–5·08 ppm) and urea (5·50–6·00 ppm) were removed to eliminate their massive signals as it could affect other metabolite signals. In the second round of processing, metabolite assignment and quantification were determined by referencing the library from Chenomx NMR Suite and published literature(Reference Xiong, Lang and Gao20–Reference Ebbels, Holmes and Lindon22).
mRNA microarray experiments
As already described in our previous report(Reference Wada, Izumi and Shimizu18), total RNA was extracted from livers and purified. Complementary RNA was generated and labelled with cyanine 3 using a Low Input QuickAmp Labeling Kit (Agilent Technologies) and hybridised to a SurePrint G3 Rat GE microarray 8 × 60K (Agilent Technologies) according to the manufacturer’s instructions. Fluorescence signals were detected using Agilent SureScan Microarray Scanner Extraction Software 12.0.3.1 (Agilent Technologies) according to the manufacturer’s instructions. Raw data from the Feature Extraction Software were exported to GeneSpring GX version 14.9 (Agilent Technologies). To identify differentially expressed genes in the microarray hybridisation and reduce noise, each data set of fluorescence signals was normalised using a median shift algorithm (shifted to 75 percentile) with background correction to the median of all samples. Only genes with normalised signals detected on all microarrays were judged to be present. Furthermore, genes detected by the multiple probes were selected one to have the largest fold change. Subsequently, in order to find potential associations between the detected hepatic genes and identified metabolites, the Kyoto Encyclopedia of Genes and Genomes pathway database was used.
Gene ontology data analysis
For functional analysis of differentially expressed genes in mRNA microarray, up-regulated and down-regulated genes were subjected to gene set enrichment analysis with gene ontology (GO) terms using GeneSpring GX. GO term description and GO accession number were referenced to The Gene Ontology Resource, the web available bioinformatics database (http://www.geneontology.org/). Generally, Fisher’s exact test and the χ 2 test were used to classify the GO term, and the false discovery rate was calculated to correct P value. P values of <0·05 were considered statistically significant.
Reverse transcription and quantitative PCR
To validate the gene fluctuations detected by mRNA microarray analysis, total RNA was reverse-transcribed using a QuantiTect RT Kit (QIAGEN) and DNA templates were amplified using a CFX96 Real-Time PCR (Bio-Rad Laboratories) with TaqMan Fast Advanced Master Mix and TaqMan probes (Applied Biosystems) according to the manufacturer’s instructions. The primers and probes are summarised in online Supplementary Table S1. Gene expression was normalised to β-actin and analysed using CFX Manager version 3.1 (Bio-Rad Laboratories).
Statistical analysis
The NMR spectral data matrix was exported into SIMCA-P 14.0 (Umetrics). Principal component analysis (PCA) was performed on the area values of binned NMR spectra as a non-targeting analysis. Score plots were obtained to visualise the clustering pattern of the samples along two principal components (PC1 and PC2), with each point denoting an individual sample spectrum. Unit variance was carried out on mean centred data. Supervised classification of orthogonal partial least squares discriminant analysis (OPLS-DA) was performed following PCA, to extract significant metabolite information. Loading plots indicated the metabolites responsible for group separation. Partial least square model quality was determined by the Q2 value, which represents model predictability, and the model with Q2 value of >0·5 generally indicates a good separation(23). Similarly, the cross-validated ANOVA (CV-ANOVA) P value is also used as an indicator of model quality, and the model with the P value of <0·05 indicates a statistically significant separation(Reference Triba, Le Moyec and Amathieu24).
JMP software (version Pro 14.0.0, SAS Institute) was used for statistical analysis. Data for each dietary group are presented as the mean values and standard deviations. Two-way repeated-measures ANOVA was performed for urine metabolites data, and the statistical results (effects of time, diet and the interaction of time and diet) are presented in Fig. 3. Student’s t tests with Welch’s correction were used to compare the means of each group at each time point. P values of <0·05 were considered statistically significant.
Results
Characteristics of the experimental animals
As already described in our previous report(Reference Wada, Izumi and Shimizu18), while protein intake was significantly lower in the LP group than in the CT group (0·80 (sd 0·03) v. 1·87 (sd 0·08) g/d, P < 0·0001) and energy intake was significantly higher in the LP group than in the CT group (254 (sd 9) v. 217 (sd 9) kJ/d, P < 0·0001), no significant difference in body mass was observed between the CT and LP groups at week 4 (360 (sd 7·0) v. 353 (sd 7·8) g, P = 0·12). Despite that, the plantaris muscle mass tended to be lower in the LP group than in the CT group (1·68 (sd 0·08) v. 1·75 (sd 0·04) g/kg body mass, P = 0·06).
Urine metabolomic profiling
Representative 1H NMR spectra of urine samples at week 4 are shown in online Supplementary Fig. S1. Low-molecular-weight compounds, such as amino acids (AA), AA-derived metabolites, tricarboxylic acid (TCA) cycle intermediates, taurine, choline and trimethylamine N-oxide (TMAO), were identified, and their chemical shifts are shown in online Supplementary Table S2. Differences in the NMR spectra between the CT and LP groups were visualised using PCA at each time point (Fig. 1). The score plots derived from the urine NMR spectra of the two groups did not form separate clusters at week 0; however, the separation became apparent at weeks 1–4. Moreover, the score plots showed separation pattern by the components of PC1. In further multivariate analysis, pairwise comparisons of urine NMR spectra were performed using OPLS-DA at each time point to clarify the factors that contributed to separation by giving group information (Fig. 2). The Q2 value, an indicator of the quality of OPLS-DA models, was maximal at week 3, and the CV-ANOVA P value, which assesses the validation of the OPLS-DA models, was also statistically significant at week 3. Urine metabolites with peaks containing correlation coefficients of 0·70 or more at specific time points from weeks 1–4 are illustrated in Fig. 2.
Principal component (PC) analysis score plots derived from the NMR spectra of urine samples from rats fed control (CT) or low-protein (LP) diets at (a) week 0, (b) week 1, (c) week 2, (d) week 3 and (e) week 4. Each symbol represents the urine sample from an individual animal (n 6). ![]() , CT;
, CT; ![]() , LP.
, LP.

Multivariate analysis of binned NMR spectra of urine samples from rats fed control (CT) or low-protein (LP) diets at weeks 0–4. Coefficient loading plots obtained from rats fed CT or LP diets at (a) week 0, (b) week 1, (c) week 2, (d) week 3 and (e) week 4. Peaks pointing upwards indicate metabolites whose levels were higher in the LP group than in the CT group, whereas peaks pointing downwards indicate metabolites whose levels were higher in the CT group than in the LP group. Heat colours indicate the contribution degree of metabolites that separate the CT and LP groups. Among the assigned metabolites, those with NMR spectra with correlation coefficients of 0·70 or more are annotated in the figure. Partial least square model quality was determined by Q2 value, which represent model predictability, and the P value of cross-validated ANOVA. Each value is shown in the figure. ppm, Parts per million.

Relative concentrations of urinary metabolites responsible for differentiating the control (CT) and low-protein (LP) diet groups by orthogonal partial least squares discriminant analysis in urine samples at weeks 0–4. The levels of (a) phenylalanine, (b) threonine, (c) tryptophan, (d) valine, (e) isobutyrate, (f) cadaverine, (g) putrescine, (h) urea, (i) citrate, (j) cis-aconitate, (k) 2-oxoglutarate, (l) succinate, (m) fumarate, (n) taurine, (o) N-methylnicotinamide, (p) choline, (q) tartrate and (r) trimethylamine N-oxide are shown. The relative concentration of each metabolite is its integral value normalised to 3-(trimethylsilyl)propionic acid-d4 sodium salt (TSP), which was added to the NMR buffer as an internal standard. Data are mean values and standard deviations (n 6) and were analysed by Student’s t tests with Welch’s correction. * P < 0·05, ** P < 0·01, *** P < 0·001. ![]() , CT;
, CT; ![]() , LP. Ti, time; Di, diet.
, LP. Ti, time; Di, diet.

Relative concentrations of eighteen urine metabolites at weeks 0–4, responsible for differentiating these diet groups by OPLS-DA, were then examined (Fig. 3 and online Supplementary Table S3). Some essential AA (phenylalanine, threonine, tryptophan and valine), AA-derived metabolites (isobutyrate, cadaverine and putrescine), urea, taurine and N-methylnicotinamide were significantly lower in the LP group than in the CT group at specific time points from weeks 1–4. In contrast, TCA cycle intermediates (citrate, cis-aconitate, 2-oxoglutarate, succinate and fumarate), choline, tartrate and TMAO levels were significantly higher in the LP group than in the CT group at specific time points.
Plasma metabolomic profiling
Representative 1H NMR spectra of plasma samples at week 4 are shown in online Supplementary Fig. S2. Assigned compounds and their chemical shifts are shown in online Supplementary Table S4. The score plots derived from the plasma NMR spectra of rats fed CT or LP diets were not clearly separated in PCA (online Supplementary Fig. S3(a)). In further multivariate analysis, pairwise comparisons of plasma NMR spectra were performed using OPLS-DA (online Supplementary Fig. S3(b)). The Q2 value was low (<0·5), and the CV-ANOVA P value was not statistically significant. Plasma metabolites, with peaks containing correlation coefficients of 0·70 or more, were glutamine, serine, valine and urea. The relative concentration of plasma metabolites that were detected in rats fed a CT or LP diet for 4 weeks is shown in online Supplementary Table S5. Plasma betaine, fumarate, glutamine, glycine, N,N-dimethylglycine and serine levels were significantly higher in the LP group than in the CT group at week 4, whereas isoleucine, leucine, phenylalanine, threonine, urea and valine levels were significantly lower in the LP group than in the CT group at week 4. Among them, five metabolites (phenylalanine, threonine, valine, urea and fumarate) were also identified in the urine and these levels in plasma are shown in Fig. 4.
Relative concentrations of metabolites in plasma samples of rats fed control (CT) or low-protein (LP) diets for 4 weeks. The levels of (a) phenylalanine, (b) threonine, (d) valine, (d) urea and (e) fumarate are shown. The relative concentration of each metabolite is its integral value normalised to formic acid, which was added to the NMR buffer as an internal standard. Data are mean values and standard deviations (n 6). P values for the effects of time (Ti), diet (Di) and the interaction of time and diet (Ti×Di) were calculated by a two-way repeated-measures ANOVA and were shown in each subfigure. Student’s t tests with Welch’s correction were used to compare the means of diet group at each time point. * P < 0·05, ** P < 0·01, *** P < 0·001. ![]() , CT;
, CT; ![]() , LP.
, LP.

Liver metabolomic profiling
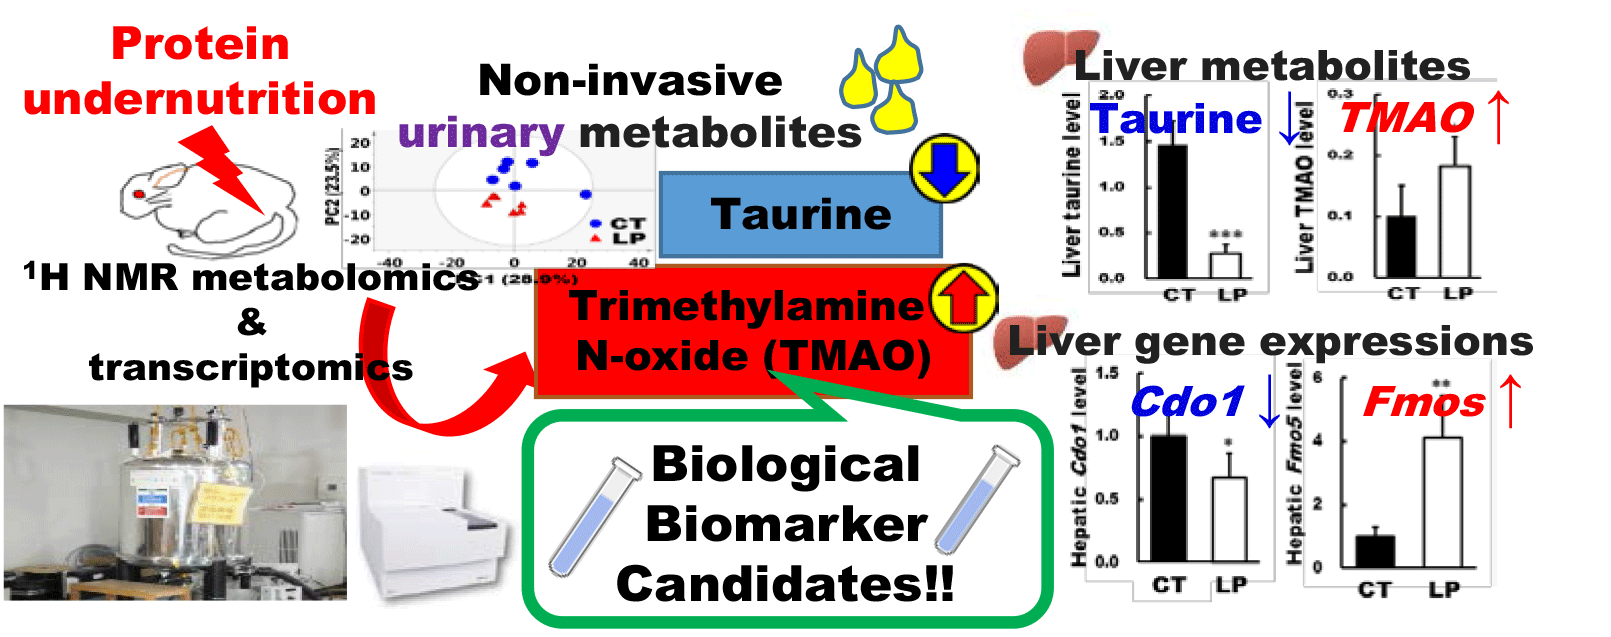
Representative 1H NMR spectra of liver samples at week 4 are shown in online Supplementary Fig. S4. Assigned compounds and their chemical shifts are shown in online Supplementary Table S6. Among metabolites identified in both urine and liver, some were not identified in plasma. This may be due to these metabolites binding to proteins in the blood, which would affect the pulse sequence to eliminate signals derived from protein in the NMR analysis of plasma as discussed in a previous report(Reference de Graaf and Beharn25). The score plots derived from the liver NMR spectra of the two groups were clearly separated by the components of PC2 in the PCA (online Supplementary Fig. S5(a)). In further multivariate analysis, pairwise comparisons of liver NMR spectra were performed using OPLS-DA (online Supplementary Fig. S5(b)). The Q2 value was high (≥ 0·5), and the CV-ANOVA P value was statistically significant. Liver metabolites, with peaks containing correlation coefficients of 0·70 or more, were inosine, uridine, NAD+, taurine and hypoxanthine. The relative concentration of liver metabolites that were detected in rats fed CT or LP diets for 4 weeks is shown in online Supplementary Table S7. Liver β-alanine, choline, dimethylamine, hypoxanthine, inosine monophosphate and TMAO levels were significantly higher in the LP group than in the CT group at week 4, whereas inosine, nicotinamide adenine, NAD+, o-phosphocholine, taurine and uridine levels were significantly lower in the LP group than in the CT group at week 4. Among them, three metabolites (taurine, TMAO and choline) were also identified in the urine and these levels in the liver are shown in Fig. 5.
Relative concentrations of metabolites in liver samples of rats fed control (CT) or low-protein (LP) diets for 4 weeks. The levels of (a) taurine, (b) trimethylamine N-oxide and (c) choline are shown. The relative concentration of each metabolite is its integral value normalised to 3-(trimethylsilyl)propionic acid-d4 sodium salt (TSP), which was added to the NMR buffer as an internal standard. Data are mean values and standard deviations (n 6) and were analysed by Student’s t tests with Welch’s correction. * P < 0·05, *** P < 0·001. ![]() , CT;
, CT; ![]() , LP.
, LP.

mRNA microarray for hepatic transcriptomic profiling
When GO analysis following hepatic mRNA microarray was performed to investigate how metabolite fluctuations occurred, the metabolic process pathway was determined to be most significantly altered among the biological processes. The metabolic process pathway encompasses several sub-pathways, including cellular metabolic process, the organic substance metabolic process and the biosynthetic process (Table 1).
Gene ontology (GO) terms for functional analysis of differentially expressed genes*

* GO term description and GO accession number were referenced to The Gene Ontology Resource, the web-available bioinformatics database (http://www.geneontology.org/). P values of <0·05 were considered statistically significant (Fisher’s exact test).
mRNA microarray analysis revealed that a total of 19 598 gene expressions were confirmed in the livers, of which 3056 were significantly differentially expressed between the CT and LP groups. Among them, 352 genes were significantly overexpressed in the LP group than in the CT group by more than 1·5-fold, whereas 362 genes were significantly under-expressed in the LP group than in the CT group by more than 1·5-fold (online Supplementary Table S8). Gene expressions associated with eight metabolites that were identified in both urine and plasma/liver were further analysed by quantitative PCR to validate the microarray findings (Fig. 6). The gene expression levels of argininosuccinate lyase (Asl), argininosuccinate synthase 1 (Ass1) and cysteine dioxygenase type 1 (Cdo1) were significantly lower in the LP group than in the CT group. In contrast, the gene expression levels of glucose-6-phosphate isomerase, pyruvate carboxylase, isocitrate dehydrogenase 2, flavin-containing mono-oxygenase 1 (Fmo1) and Fmo5 were significantly higher in the LP group than in the CT group.
Hepatic gene expression levels in rats fed control (CT) or low-protein (LP) diets for 4 weeks. Relative expression levels of (a) argininosuccinate lyase (Asl), (b) argininosuccinate synthase 1 (Ass1), (c) glucose-6-phosphate isomerase (Gpi), (d) pyruvate carboxylase (Pc), (e) isocitrate dehydrogenase 2 (Idh2), (f) cysteine dioxygenase type 1 (Cdo1), (g) flavin containing mono-oxygenase 1 (Fmo1) and (h) Fmo5 were examined at week 4. Among genes differentially expressed between the CT and LP diet groups by mRNA microarray, only those related to fluctuating metabolites were examined. Values are normalised to the CT group. Data are mean values and standard deviations (n 6) and were analysed by Student’s t tests with Welch’s correction. * P < 0·05, ** P < 0·01, *** P < 0·001. ![]() , CT;
, CT; ![]() , LP.
, LP.

Discussion
We performed metabolomic and transcriptomic analyses in adult rats fed a 14 % casein diet (CT diet) or 5 % casein diet (LP diet) for 4 weeks. According to our previous report using the same experimental animals as this study(Reference Wada, Izumi and Shimizu18), no significant differences in body mass were observed between the two groups, whereas plantaris muscle mass tended to be lower in the LP group than in the CT group (P = 0·06), implicating the manifestation of potential protein undernutrition in the LP group. Furthermore, GO analysis indicated that protein undernutrition perturbed metabolic processes such as the cellular metabolic process, the organic substance metabolic process and the biosynthetic process, which is likely, in turn, to lead to fluctuations in metabolite levels. Thus, the novelty of this study was to identify metabolites as biomarker candidates responsive to protein undernutrition using metabolomics and transcriptomic approaches.
Metabolites identified in both urine and plasma were phenylalanine, threonine, valine, urea and fumarate. In urine and plasma, the levels of AA and urea were significantly lower in the LP group than in the CT group, respectively. These observations are presumed to be caused by reduced AA/protein intake. Furthermore, lowered urinary phenylalanine excretions in rats fed the LP diet were observed at weeks 1 and 2, whereas lowered threonine excretion was observed at week 3. Hence, different durations of protein undernutrition may impact the pattern of AA/protein metabolism. In line with AA excretion, hepatic expression levels of Asl and Ass1, which encode enzymes in the urea cycle, were significantly lower in the LP group than in the CT group. This is probably due to the decreased metabolism of AA-derived nitrogen, which would stagnate the urea cycle. Similarly, decreased protein intake is reported to reduce the hepatic expression of genes which encode urea cycle-related enzymes(Reference Young and Marchini26). Protein insufficiency may facilitate nitrogen conservation in tissues and decrease hepatic Asl and Ass1 expressions in the LP group. In contrast, fumarate levels in urine and plasma were significantly higher in the LP group than in the CT group, respectively. The observed increase in fumarate, a TCA intermediate, may be due to higher carbohydrate contents in the LP diet. Hepatic gene expression levels of glycolytic enzymes glucose-6-phosphate isomerase, pyruvate carboxylase and the TCA cycle enzyme isocitrate dehydrogenase 2 were also significantly higher in the LP group than in the CT group. These suggest that glucose metabolism was activated by increased carbohydrate intake accompanied by high carbohydrate contents in the LP diet. However, it should be noted that TCA cycle acceleration following high carbohydrate intake has been linked to the progression of various diseases, such as cancer and atherosclerosis, through the overproduction of reactive oxygen species in the mitochondria(Reference Matsuda and Shimomura27). Furthermore, fumarate accumulation can lead to oxidative stress by modifying glutathione metabolism(Reference Zheng, Cardaci and Jerby28) and induce endoplasmic reticulum stress in a diabetic model(Reference You, Quach and Saito29). Thus, the increase in the TCA cycle activity and its intermediate fumarate associated with LP diet ingestion may increase the risk of developing specific diseases.
The OPLS-DA showed that the Q2 value of liver samples was higher than that of plasma samples, and the CV-ANOVA P value of liver samples was statistically significant, suggesting that the liver reflected protein undernutrition more substantially than plasma. Thus, metabolites such as taurine, TMAO and choline, which fluctuated not only in urine but also in the liver, may be sensitive to protein undernutrition. Notably, urinary taurine levels were significantly lower in the LP group than in the CT group at week 1 and remained constant thereafter. The liver taurine level was also significantly lower in the LP group than in the CT group at week 4. The activity of CDO1, the rate-limiting enzyme in the biosynthesis of taurine from cysteine(Reference Hayes and Sturman30), is considerably higher in the liver than other tissues(Reference Stipanuk31). Thus, decreased urinary and hepatic taurine levels could have been caused by the stagnation of cysteine metabolism associated with reduced hepatic expression of Cdo1. Taurine contributes to numerous biological functions through its anti-oxidative and anti-inflammatory properties(Reference Marcinkiewicz and Kontny32). It is reported that taurine deficiency induces skeletal muscle loss(Reference De Luca, Pierno and Camerino33), while taurine intake improves skeletal muscle function by preventing muscle degeneration(Reference Seidel, Huebbe and Rimbach34,Reference Terrill, Pinniger and Graves35) . Muscle degeneration is related to oxidative stress in the muscle and promotes muscle cell apoptosis. It is reported that taurine can protect against oxidative stress as well as reducing the abundance of apoptotic signal proteins(Reference Khalil, Abdo and Saad36,Reference Takatani, Takahashi and Uozumi37) . In our previous study(Reference Wada, Izumi and Shimizu18) examining the same experimental animals in this study, the plantaris muscle mass tended to be lower in the LP group than in the CT group (P = 0·06). Collectively, this might be mediated in part by decreased taurine levels in the body. Although gene expression analyses involved in muscle synthesis and degradation in muscle tissues are lacking in this study, it would be necessary to investigate the molecular mechanism to clarify the relationship between taurine concentration and muscle mass. Taurine deficiency is also reported to affect energy metabolism in adipose tissue(Reference Murakami38). Taurine protects against dyslipidaemia by inhibiting reactive oxygen species generation(Reference Wen, Li and Zhang39,Reference Scicchitano and Sica40) , and taurine supplementation can normalise serum HDL concentrations in a high cholesterol diet-fed rats(Reference Yokogoshi, Mochizuki and Nanami41). It has also been reported that protein intake and serum HDL-cholesterol levels are positively correlated(Reference Pasiakos, Lieberman and Fulgoni42). Furthermore, in our previous study using the same experimental animals as in the present study(Reference Wada, Izumi and Shimizu18), the LP group exhibited significantly lower HDL-cholesterol compared with the CT group. Considering these facts, taurine level may be involved in dyslipidaemia associated with protein undernutrition. In contrast to the decreased taurine level in urine and liver of the LP group, urinary TMAO levels were significantly higher in the LP group than in the CT group at week 2 and it remained constant thereafter. The liver TMAO level was also significantly higher in the LP group than in the CT group at week 4. In our metabolomic analysis, choline in urine and liver were also higher in the LP group than in the CT group. Choline is converted to TMA by intestinal bacteria, and TMAO is synthesised from TMA by the FMO family in the liver(Reference Tang, Wang and Levison43). Hepatic gene expressions of Fmo1 and Fmo5 were also significantly higher in the LP group than in the CT group, respectively. Therefore, it is speculated that the increase in TMAO level was associated with an increase in both its substrate choline and the gene expression levels of Fmo1 and 5. The urinary tartrate level was also significantly higher in the LP group than in the CT group. Since choline was provided in both CT and LP diets as choline bitartrate, the increased urinary tartrate excretion observed in the LP-fed rats may indicate the use of choline as a nitrogen source in protein undernutrition, as observed previously(Reference Mayneris-Perxachs, Bolick and Leng44). Besides, as protein deficiency has been suggested to alter the gut microbiota(Reference Mayneris-Perxachs, Bolick and Leng44,Reference Ma, Tian and Wu45) , increased TMAO levels may also be indirectly caused by fluctuations in intestinal microbiota. Clinical trials have demonstrated that elevated TMAO level increases the risk of CVD(Reference Tang, Wang and Levison43,Reference Randrianarisoa, Lehn-Stefan and Wang46) , while consumption of a high TMAO-containing diet reduces serum HDL levels in mice(Reference Hu, Zhao and Yuan47). A recent review suggests that TMAO-induced atherosclerosis is associated with decreased HDL-cholesterol, which increases the risk of CVD(Reference Canyelles, Tondo and Cedó48). Furthermore, as mentioned above, our previous study using the same animals reported that protein undernutrition reduced HDL-cholesterol(Reference Wada, Izumi and Shimizu18). Thus, the increase in TMAO levels in the LP group may also be associated with decreased circulating HDL-cholesterol levels. Collectively, the increase in choline utilisation as a nitrogen source induced by protein undernutrition may increase the risk of dyslipidaemia and cardiovascular disorder via elevating TMAO production. It should also be noted that the plasma TMAO level is affected by the intake of fish containing TMAO and de novo synthesis from carnitine contained in red meat(Reference Cho, Taesuwan and Malysheva49,Reference Koeth, Wang and Levison50) . Therefore, TMAO intake derived from diets should be taken into account for comprehending the TMAO level fluctuation in the body.
In conclusion, the fluctuation of several metabolites identified in urine, plasma and liver samples was caused by the LP diet ingestion in adult rats. Among the identified metabolites, taurine and TMAO, the final metabolites that are not further metabolised, fluctuated not only in urine but also in the liver. Notably, changes in taurine and TMAO levels were detectable in the urine by week 2 after LP diet ingestion, which may reflect protein undernutrition at an early stage. Hepatic gene expressions of taurine and TMAO biosynthesis enzymes also corresponded to these fluctuations. Thus, fluctuations in urinary taurine and TMAO are considered to have occurred as a result of substantial responses to protein undernutrition in the liver. Furthermore, taurine and TMAO might also be potential mediators of the development of skeletal muscle disorders and lipid abnormalities, which could be associated with LP nutritional status as discussed above. It follows from these results that taurine and TMAO may serve as potential biomarker candidates of protein undernutrition and targets for prevention of secondary diseases associated with protein undernutrition. To further elucidate in-depth the molecular mechanisms involved in taurine and TMAO in the context of protein nutritional status, it may be necessary to determine whether fluctuations in taurine and TMAO levels dissolve as the protein nutritional status improves. In addition, clinical trials are warranted to investigate their usefulness as protein nutrition biomarkers.
Acknowledgements
We are grateful to Dr Hiroyuki Kumeta (Open Facility Division, Global Facility Center, Creative Research Institution, Hokkaido University) for supporting the NMR analysis and Dr Tatsuya Ehara (Wellness & Nutrition Science Institute, Morinaga Milk Industry Co. Ltd) for assistance with mRNA microarray.
This research was funded by the Morinaga Milk Industry Co. Ltd. Y. K., Y. W., H. I., T. S., Y. T. and T. A. designed the research; Y. K. and Y. W. conducted the experiment; Y. K. analysed data and wrote the paper; Y. K. had primary responsibility for final content. All authors read and approved the final manuscript.
Y. K., Y. W., H. I., T. S. and Y. T. are the employees of Morinaga Milk Industry Co. Ltd. T. A. declares no conflict of interest.
Supplementary material
For supplementary materials referred to in this article, please visit https://doi.org/10.1017/S0007114520003281
Metabolomics and transcriptomics raw data are available from MetaboLights (Study Identifier: MTBLS1452, https://www.ebi.ac.uk/metabolights/MTBLS1452) and Gene Expression Omnibus (Study Identifier: GSE144207, https://www.ncbi.nlm.nih.gov/geo/query/acc.cgi?acc=GSE144207).


