It is estimated 38 % of all European children are overweight or obese(1–Reference Han, Lawlor and Kimm3). Childhood obesity and poor nutrition are linked to health complications such as type 2 diabetes, dental caries and increased risk of obesity and chronic diseases later in life(Reference McGinnis, Gootman and Kraak4–6).
In the UK, the National Diet and Nutrition Survey 2008–09 found the intake of non-milk extrinsic sugars in 4–18-year-olds to be 15 % of total energy intake, above the dietary reference value of no more than 10 %; saturated fat intake also exceeded the dietary reference value of 10 %(Reference Bates, Lennox and Swan7, 8). These factors may contribute to rising obesity levels(1). This pattern is reflected in other countries in Europe, with the intake of total fat being above the WHO-recommended 30 % of energy intake and saturated fat intake generally being greater than 10 %(Reference Elmadfa9, 10). The marketing of energy-dense foods of poor nutritional quality to children may contribute to the rise in childhood obesity and has been highlighted as a cause for concern(10, 11). WHO recommends governments as key stakeholders in specifying policies and mechanisms which will reduce the exposure and impact of marketing of foods high in fat, sugars or salt to children(12).
Marketing is described broadly as ‘a mechanism for influencing behaviour’(Reference Hastings, Stead and McDermott13). Marketing to children focuses on food; in particular high fat, sugar and/or salt (HFSS) products(Reference Harris, Schwartz and Brownell14, Reference Hawkes15). There is evidence verifying that food promotion influences children's consumption, purchasing behaviour and requests, known as ‘pester power’(Reference McGinnis, Gootman and Kraak4, Reference Hastings, Stead and McDermott13, Reference Roberto, Baik and Harris16, Reference Sixsmith and Furnham17). Children are targeted due to their ability to influence household purchases, their own increasing purchasing power and their potential as lifetime consumers(Reference Hastings, Stead and McDermott13, Reference Chapman, Nicholas and Banovic18). Food promotion to children influences both brand and type of food purchased(Reference Hastings, Stead and McDermott13). Use of characters, particularly familiar, age-appropriate cartoons, promotes fun and encourages children to form attachments(Reference Roberto, Baik and Harris16, Reference Chapman, Nicholas and Banovic18, Reference Kelly, Hattersley and King19).
Links have been established between extensive television advertising of HFSS foods and obesity in children(Reference Hastings, Stead and McDermott13). Television advertising is subject to statutory legislation; the UK ban on advertising unhealthy foods around children's programmes is recognised as one of the most comprehensive schemes to be implemented(11, Reference Jenkin, Wilson and Hermanson20–Reference Elliott23).
Most research into the effects of television advertising focuses on the promotion of HFSS products, i.e. confectionery and soft drinks(Reference McGinnis, Gootman and Kraak4, Reference Hastings, Stead and McDermott13, Reference Harris, Schwartz and Brownell14, Reference Elliott23). There has also been extensive work demonstrating that breakfast cereals marketed to children are more likely to be HFSS(Reference Lobstein and Davies21, Reference Schwartz, Vartanian and Wharton24). Assessment of other children's products has been performed in countries such as the USA, Canada and Australia, but little research has been undertaken in Europe(Reference Harris, Schwartz and Brownell14, Reference Chapman, Nicholas and Banovic18, Reference Elliott23, Reference Livingstone25, Reference Story and French26). Existing studies evaluating the differences between children's products and non-children's products have either included baby and toddler foods only or have been limited to small sample sizes(Reference Hastings, Stead and McDermott13, Reference Elliott27).
The present study aimed to determine whether foods marketed to children in UK supermarkets are less healthy than those not marketed to children. Yoghurts (including fromage frais), cereal bars and ready meals were selected for comparison as these may be viewed as healthier options. Yoghurts represent the greatest proportion of milk and milk products consumed by children under the age of 10 years excluding milk(28). Cereal bars are often selected as a ‘healthier’ option to traditional chocolate bars(29). ‘Ready meal’ is a recognised food category within the European Commission; the category can be further divided into chilled, frozen, canned and ambient types(30, 31) and the current research focused on chilled and frozen sectors. Infant ready meals are a rapidly expanding market segment that has recently increased its presence in chilled food aisles of supermarkets(Reference Leyland32). There is also a predominance of child-oriented packaging for these items which allowed comparison against an equivalent. Confectionery, fast food and soft drinks were not included as these are already known to be HFSS(Reference McGinnis, Gootman and Kraak4, Reference Chapman, Nicholas and Banovic18) and research has already been undertaken worldwide for breakfast cereals(Reference Lobstein and Davies21, Reference Schwartz, Vartanian and Wharton24).
Materials and methods
Nutritional data were collected between November 2010 and March 2011 from online and in-store packaging information from UK supermarkets, as described in similar studies(Reference Sixsmith and Furnham17, Reference Schwartz, Vartanian and Wharton24, Reference Elliott and Conlon33). Seven major UK supermarkets were used to cover different socio-economic categories. The supermarkets chosen represent over 85 % of the market share in the UK(34). Nutrients included energy (kilojoules), protein, carbohydrate, sugars, fat, saturated fat, fibre and sodium (all in grams). Calcium was included for yoghurts. Data were collected per 100 g as required by UK Food Labelling Regulations(35, 36). Data per portion size were obtained from packaging information or calculated based on recommended serving size and information per 100 g(37).
Children's food items were identified by statements such as ‘little’/'kids’; specified age range; use of characters or celebrities for marketing; links with children's media; fun or fantasy themes; and/or promoted for lunchboxes(Reference Chapman, Nicholas and Banovic18, Reference Elliott23, Reference Schwartz, Vartanian and Wharton24, 38). Non-children's food products were selected from the same food categories but without the qualifying features above.
Certain products were excluded such as those deemed as specialised or novel foods. Yoghurt exclusions were those with stanols and sterols as these are directed at adults; pre/probiotic yoghurts as there were insufficient children's products to enable fair comparisons; non-cow's milk yoghurts; and products where yoghurt content was below 90 %. All other yoghurt types and brands were included. Cereal bars exclusions were specialised ‘free from’ ranges and those with less than 50 % cereal grains. All other cereal types and brands were included.
For ready meals, products were categorised into meal type depending on protein and carbohydrate source. These were beef & pasta, beef & potato, chicken & pasta, chicken & potato, chicken & rice, fish & pasta, fish & potato, pork & pasta, pork & potato, and vegetable & pasta dishes. This categorisation is used in the current National Diet and Nutrition Survey in the UK(Reference Bates, Lennox and Swan7). A range of children's products was selected within each type and non-children's equivalents included to the equivalent number per category.
A small number of nutrients were labelled as ‘trace’; these were designated 0·05 g/100 g to enable analysis. This is in accordance with the Food Standards Agency's Food Labelling Regulations, which state that ‘trace’ can be used for values below 0·1 g/100 g and values between 0·05 and 0·15 g/100 g may be rounded to this(35). It was considered that 0·05 g/100 g would be more suitable than using 0 g/100 g as nil is a permissible value and could be used if manufacturers deemed appropriate(35).
Statistical analysis
Comparisons were made between children's and non-children's products for nutrients (per 100 g and per recommended portion). A Kolmogrov–Smirnov analysis was used to test the normality of the distribution; the Mann–Whitney U test or independent-samples t test was then used, depending on the findings of normality, to compare the nutrient content of children's v. non-children's products in the three different product categories. The significance of these tests was based on a 95 % confidence interval. Energy contribution from fat and sugars was calculated using Atwater conversion figures(39). Percentage of fat as saturated was also calculated and compared using an independent t test. Statistical analyses were performed using the statistical software package PASW Statistics 18 at a 95 % confidence interval.
Results
A total of 436 products were analysed: 147 yoghurts of which sixty were categorised as children's and eighty-seven non-children's; 145 cereal bars of which forty-three were children's and 102 non-children's; and 144 ready meals of which seventy-one were children's and seventy-three non-children's.
Nutritional composition
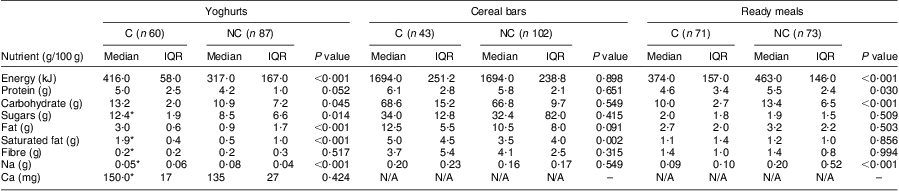
Children's yoghurts contained significantly higher levels of energy (P < 0·001), carbohydrate (P = 0·045), sugars (P = 0·014), fat and saturated fat (both P < 0·001) per 100 g than non-children's products (Table 1). Conversely, there was a significantly lower level of sodium in children's products compared with non-children's (P < 0·001). There was no significant difference in the amount of calcium in children's v. non-children's yoghurts. For cereal bars, there were no significant differences between children's and non-children's per 100 g, except for saturated fat which was significantly higher in children's cereal bars (P = 0·002). For ready meals children's products had significantly lower values for energy (P < 0·001), protein (P = 0·030), carbohydrate and sodium (both P < 0·001) per 100 g, yet sugar and fat contents were not significantly different.
Nutritional values for children's and non-children's products per 100 g; products from seven major UK supermarkets, November 2010–March 2011

C, children's products; NC, non-children's products; IQR, interquartile range; N/A, product information not available.
Significant difference between nutrients, P < 0·05, by Mann–Whitney test.
*Full product information was unavailable for one children's yoghurt.
Figures 1–3 show the nutrient distribution per 100 g along with the UK Food Standards Agency boundaries for high, medium and low amounts of sugars, fats and salt presented for reference(40, 41). These plots show the range of nutrient distribution in the products sampled, including the extreme values. For yoghurts, the greatest range was in non-children's products; cereal bars had a consistent distribution, except for saturated fat. Most children's yoghurts were above the medium boundary for fats and a higher proportion of children's cereal bars fell in the high category for saturated fat. For ready meals the difference in sodium between categories is clearly demonstrated, with meal types with highest/lowest values (i.e. outliers) indicated.
The distribution of nutrients per 100 g in yoghurts (n 147) marketed to children in seven major UK supermarkets, November 2010–March 2011. Data are presented as box-and-whisker plots in which  represents the interquartile range; the bottom and top of the whisker represent the minimum and maximum value, respectively; —— represents the median; ○ represent outliers;
  represent extreme values. — · —, UK Food Standards Agency (FSA) boundary for a high amount of sugars, fats or salt(40, 41); – – –, FSA boundary for a medium amount of sugars, fats or salt(40, 41)
The distribution of nutrients per 100 g in cereal bars (n 145) marketed to children in seven major UK supermarkets, November 2010–March 2011. Data are presented as box-and-whisker plots in which  represents the interquartile range; the bottom and top of the whisker represent the minimum and maximum value, respectively; —— represents the median; ○ represent outliers;
  represent extreme values. — · —, UK Food Standards Agency (FSA) boundary for a high amount of sugars, fats or salt(40, 41); – – –, FSA boundary for a medium amount of sugars, fats or salt(40, 41)
The distribution of nutrients per 100 g in ready meals (n 144) marketed to children in seven major UK supermarkets, November 2010–March 2011. Data are presented as box-and-whisker plots in which  represents the interquartile range; the bottom and top of the whisker represent the minimum and maximum value, respectively; —— represents the median; ○ represent outliers;
  represent extreme values. — · —, UK Food Standards Agency (FSA) boundary for a high amount of sugars, fats or salt(40, 41); – – –, FSA boundary for a medium amount of sugars, fats or salt(40, 41)
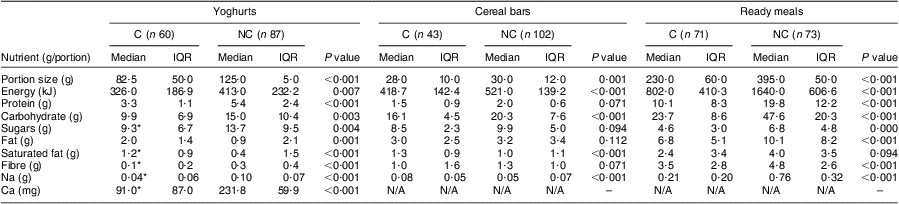
When expressed as nutritional values per portion, differences were observed in the results compared with per 100 g (Table 2). On average, children's products were significantly smaller than non-children's. However, fat (P = 0·001) and saturated fat (P < 0·001) were higher in children's yoghurts than non-children's. For cereal bars, children's products were significantly higher than non-children's in saturated fat and sodium (both P < 0·001). In ready meals, all nutrients were higher in non-children's meals, significant (P < 0·001) for all but saturated fat. Further analysis within meal type showed no significant differences between children and non-children's products, except for pork & potato meals which contained significantly more sodium in non-children's (P < 0·001), likely to be due to those containing sausages.
Nutritional values for children's and non-children's products per portion; products from seven major UK supermarkets, November 2010–March 2011
C, children's products; NC, non-children's products; IQR, interquartile range; N/A, product information not available.
Significant difference between nutrients, P < 0·01, by Mann–Whitney test.
*Full product information was unavailable for one children's yoghurt.
Energy proportions from fat and sugars
Expressed as a percentage of the energy per 100 g, children's yoghurts had a significantly higher level of energy from fat compared with non-children's yoghurts (P < 0·001; Table 3). Conversely, for non-children's yoghurts there were higher levels of energy from sugars (P < 0·001). For cereal bars, children's products had a higher percentage of energy from sugars (P = 0·047). Similarly, children's ready meals had significantly more energy from sugars than the non-children's products (P = 0·004). Children's cereal bars had a significantly higher percentage of total fat as saturated fat than non-children's equivalents (P < 0·001).
Fat and sugars content as a percentage of energy and percentage of fat as saturated for products per 100 g; products from seven major UK supermarkets, November 2010–March 2011

C, children's products; NC, non-children's products.
Significant difference between nutrients, P < 0·01, by unpaired t-test.
Discussion
The present study compared nutritional information for products marketed towards children with their non-children's equivalents. Yoghurts, cereal bars and ready meals marketed towards children had significantly different nutritional profiles from those aimed at the general population. In most cases products marketed to children were higher in sugars, fat, saturated fat and/or sodium, with the exception of children's ready meals, which had lower sodium content than non-children's. It is important to note the different results depending on whether nutrients were assessed per 100 g or per portion. Comparisons by portion may be more meaningful given that these products will mostly be eaten per portion and, for young children, perhaps in even smaller amounts. However, the results per 100 g illustrate the difference in nutrient density between categories.
For all categories, non-children's versions that were noted as ‘diet’ or manufactured by weight-loss promotion companies were not included in the analysis as children's versions are not available to enable fair comparisons. However, for yoghurts where low-fat versions are part of the normal category range, these were included. The results highlight that for non-children's yoghurts fat reduction may be counteracted with sugar addition, emphasising the need for consumers to read labels.
Findings from the present investigation for yoghurts and cereal bars agree with those from other studies, namely that children's products are often HFSS(Reference Harris, Schwartz and Brownell14, Reference Schwartz, Vartanian and Wharton24, Reference Elliott27). In Canada, sodium in children's ready meals was found to be markedly higher than in the non-children's product equivalent(Reference Elliott and Conlon33). Our study of UK products did not find this. There has been a UK government campaign for food manufacturers to lower salt in products, which may have contributed to the lower salt in children's products, particularly yoghurts and ready meals(42). Low salt in products is not only important for long-term health, but also in developing children's taste preferences(Reference Elliott and Conlon33, Reference Webster, Dunford and Neal43).
The strengths of the present study are its large sample sizes, the objective approach in identifying products and the comparison of nutrient content per 100 g and per portion, which provided more detailed findings. All major supermarket chains in the UK were chosen to ensure diversity and to include a range of socio-economic target populations. This avoided discrepancy due to the reported association of advertising HFSS food to people with financial restrictions(Reference Robertson44). Most product information was collected online from supermarket or company websites and included a variety of branded and own-label products to ensure that product availability due to location or socio-economic status of an area did not lead to impartiality(Reference Robertson44–Reference Darman, Caillavet and Joly46).
Limitations of the present study are that portion size was based on the manufacturer's recommended amount and may not be representative of what is actually eaten by different consumer populations(Reference Burger, Kern and Colemam47, Reference Fisher and Kral48). The study does not cover all foods aimed at children, but concentrated on a systematic assessment of three food types – yoghurts, cereal bars and ready meals. The design of the study could be improved by laboratory analysis of a sample to validate nutrition labelling. Discrepancies were noted in energy content of products where kcal and kJ did not correspond. To thoroughly determine nutritional values and ingredients, individual companies could be contacted, in particular for added sugars.
Differences in nutrient requirements between children and adults and target age range for products also influence interpretation of results. For example, children under 12 years of age generally have lower energy needs compared with adults, and therefore lower fat, carbohydrate and protein requirements(8). It follows that saturated fat and sugars should be less(8) and this has been achieved for ready meals, and partially for yoghurts, by making, on average, children's products smaller. Only children's ready meals specified an age range, generally 1–3 years. Energy and protein could be analysed further to look at percentage contribution to dietary reference values, assuming a meal provides a third of daily intake. Children's ready meals are within this range; however, it is beyond the scope of the present study to fully evaluate this here and there are obvious limitations as these requirements are based on a ‘reference child’(8). As the other products do not specify a target age range this analysis could not be extended further. Quantity of consumption also needs consideration; yoghurts and cereal bars are normally viewed as snacks and would be taken in smaller amounts than ready meals, but these could be consumed more frequently than ready meals.
Nutritional labelling has been well debated elsewhere, particularly the contribution of added sugars to energy intake(Reference Lobstein and Davies21, Reference Elliott23, Reference Grunert, Wills and Fernández-Celemín49). Although children may not regularly use nutrition labelling, it can guide parents of younger children or develop use in older children(Reference Campos, Doxey and Hammond50). Parents need more guidance so they are aware that foods considered ‘healthier’ options for their children are not always the healthiest product available. For example, a children's cereal bar may have less saturated fat than chocolate confectionery, but it may have more saturated fat than a non-children's cereal bar.
Marketing could be used to promote healthier eating in children, but the results from the present study suggest that this opportunity has not been realised. From age 2–8 years children can identify brands, packaging and characters and thus make their own food selections(Reference McGinnis, Gootman and Kraak4, Reference Kopelman, Roberts and Adab51, Reference Robinson, Borzekowski and Matheson52). However, those under 8 years are unable to differentiate between persuasive marketing and information; children are generally less sceptical and lack critical thinking skills until over 11 years old(Reference Hastings, Stead and McDermott13, Reference Roberto, Baik and Harris16, Reference Jones, Mannino and Green53). Studies have shown children preferred snacks and vegetables when a cartoon character was added, compared with identical products without the character(Reference McGinnis, Gootman and Kraak4, Reference Roberto, Baik and Harris16, Reference Gunnarsdottir and Thorsdottir54). Robinson et al. found that pre-school children favoured foods in a McDonald's wrapper compared with the same food in an unbranded wrapper; this included milk and carrots as well as burgers and fries(Reference Robinson, Borzekowski and Matheson52).
The current study raises ethical issues due to the nutritional quality of children's food products. HFSS foods in childhood have implications for obesity, dental caries, insulin resistance and taste preference later in life(10, Reference Hawkes15). In the UK, the Department of Health claims to work with food manufacturers to increase signposting on products but there is clearly still work to be done(39, 55). The UK Department of Health has recently announced plans for a single system for front-of-pack nutrition labelling using both per serving and per 100 g to aid consumer understanding(56). A drawback of any labelling scheme is applicability to children's products, but this new approach could be used to start work on reaching guidelines on children's products for both industry and consumers to address energy density and portion size issues.
The products chosen for analysis were those deemed as ‘healthier’ options and likely to comprise a significant proportion of a child's intake. More food types could be included, for example fruit-based snacks, smoothies, cheese snacks and processed meat products; however these food types often have smaller product ranges. Future work could investigate the knowledge and understanding of parents and carers who buy foods marketed at children and explore the interplay between satisfying children's requests and optimising nutritional intake.
Conclusion
The present study has shown that there is a tendency for products marketed towards children to be less healthy than those aimed at a broader, non-child, general market. There are significant differences in nutritional contents between categories, raising the question as to why. Would the ideal situation not be to have similar, healthy products with differences in requirements met by varying portion size and food category rather than brand or industry-determined age bracket? The study findings suggest a need for constructive engagement with the food industry and possibly more comprehensive nutritional guidelines for the regulation of food products aimed at children and subsequent marketing of these.
Acknowledgements
Sources of funding: This research received no specific grant from any funding agency in the public, commercial or not-for-profit sectors. Conflicts of interest: The authors confirm that they have no conflicts of interest. Ethics: Ethical approval was not required. Authors’ contributions: A.L. was responsible for the study design, data acquisition, analysis and writing of the manuscript. K.L.R. was responsible for the study concept and contributed to the design, analysis and writing of the manuscript. C.R. contributed to the study design, analysis and the writing of the manuscript. A.M.M. contributed to the writing of the manuscript.