
Introduction
Lichens are influenced by climate and cyanolichens are particularly sensitive. Cyanobacterial photobionts in cyanolichens require liquid water in order to photosynthesize at normal rates (Lange et al. Reference Lange, Kilian and Ziegler1986), resulting in high sensitivity to drought (Richardson & Cameron Reference Richardson and Cameron2004; Cameron & Richardson Reference Cameron and Richardson2006). Acid rain and deposition of other atmospheric pollutants also have detrimental effects on lichen health and colonization in some regions of Canada (Arsenault et al. Reference Arsenault, Belland, Goward, Newmaster and Vitt2000; Goward & Arsenault Reference Goward and Arsenault2000; Richardson & Cameron Reference Richardson and Cameron2004), and cyanolichen population decline in north-eastern North America has been attributed to anthropogenic impacts (e.g. Erioderma pedicellatum (Hue) P. M. Jørg., Maass & Yetman (Reference Maass and Yetman2002)).
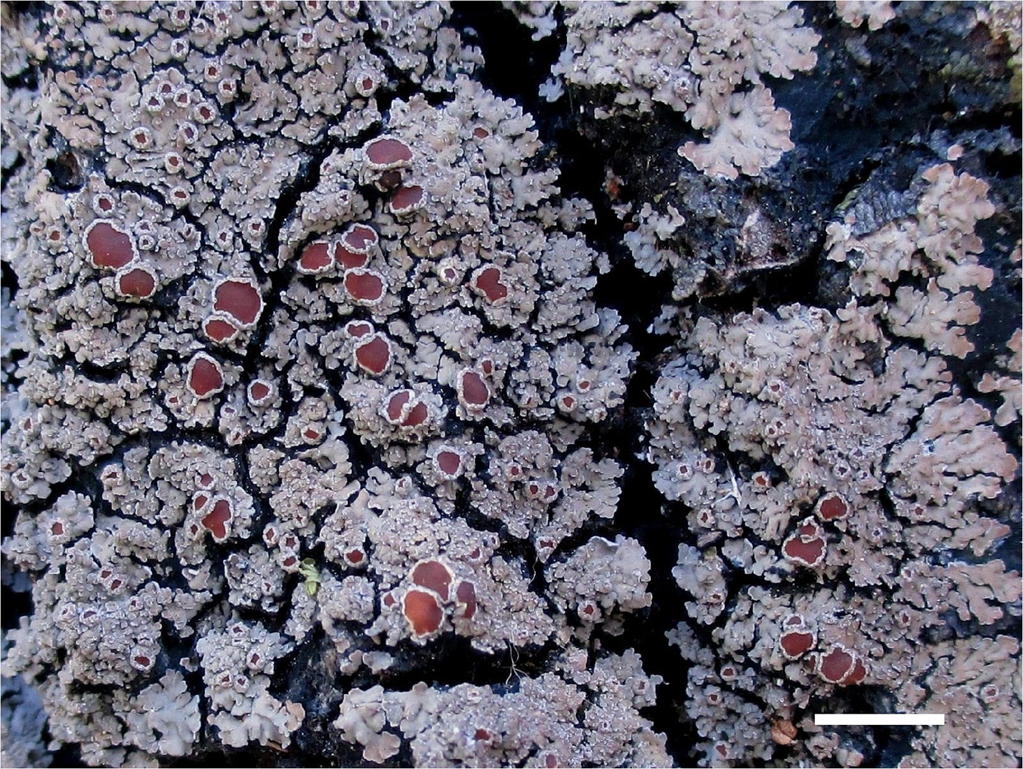
Fuscopannaria leucosticta (Tuck.) P. M. Jørg. (Fig. 1) is a cyanolichen with Nostoc as a photobiont (Brodo et al. Reference Brodo, Cameron, Andrachuk and Craig2001). It has been poorly studied and is likely to be sensitive to changing climate and other anthropogenic impacts. The observed range of this species is in eastern coastal North America and eastern coastal Asia where it is somewhat common, following a pattern known as tertiary relict distribution (Jørgensen & Sipman Reference Jørgensen and Sipman2007). Fuscopannaria leucosticta also occurs at high elevations in Greece, Italy and Slovenia (Spribille Reference Spribille2009), Tanzania (Alstrup & Christensen Reference Alstrup and Christensen2006), Ecuador, Mexico and with scarcity in the Caribbean (Jørgensen & Sipman Reference Jørgensen and Sipman2007). Plant communities that were distributed throughout large areas of the Northern Hemisphere during the early to mid-Tertiary and became restricted to limited regions as the world cooled over the last 15 million years are known as tertiary relict floras (Milne & Abbott Reference Milne and Abbott2002). Tertiary relict distributions have been described for a variety of vascular plants (Sing-chi Reference Sing-chi1983) and for lichenized fungi (Culberson Reference Culberson1972) and are described for lichens in general by Poelt (Reference Poelt1963) and Culberson (Reference Culberson1972).
Fuscopannaria leucosticta in Alligator River Natural Wildlife Refuge, North Carolina, USA. In colour online. Scale=3 mm.
Geographically disparate and apparently ecologically different habitats across the World might sometimes experience similar conditions at the micro-climatic scale. This could explain why, according to Jørgensen & Sipman (Reference Jørgensen and Sipman2007), the range for F. leucosticta is mainly coastal and temperate yet its southern incidences are at high elevations in mountain mist zones. These authors suggest that, like some other lichen species, F. leucosticta could have survived climatic fluctuations in these warmer areas by dispersing to higher or lower elevations as needed to locate a suitably moist and cool microclimate.
Fuscopannaria leucosticta is rare in Canada, occurring only in New Brunswick, Nova Scotia, Ontario and Quebec (Goward et al. Reference Goward, Brodo and Clayden1998). It is one of a group of cyanolichens that is rare or declining in New England with no known collections in the region since 1939 (Hinds & Hinds Reference Hinds and Hinds2007). The Committee on the Status of Endangered Wildlife in Canada consider F. leucosticta a high priority candidate for conservation status assessment because of its rarity and conservation concern (Committee on the Status of Endangered Wildlife in Canada 2017). After searching herbarium and data records, we speculate that Nova Scotia might have the largest population in Canada, making the province an ideal place to study this species.
Nova Scotia contains some of the most northern populations of F. leucosticta in eastern North America (Jørgensen & Sipman Reference Jørgensen and Sipman2007). The province is a large peninsula (55 284 km2) on the east coast of North America and is characterized by a cool moist climate (Davis & Browne Reference Davis and Browne1996). It consists mainly of forested land, although these are often a patchwork of forestry operations (Neily et al. Reference Neily, Quigley and Stewart2008).
Much of the range of F. leucosticta is occupied and industrialized by humans. The landscape-scale distribution of this species has never been studied in detail in any region. Determining the distribution of this inconspicuous species, which is sensitive to anthropogenic influences, is a crucial first step in understanding its ecology and conservation needs.
Although little is known about F. leucosticta, many locations have been identified from Nova Scotia. It is possible to gain knowledge about the environmental requirements of a species by examining environmental variables where its presence is known. Our aim is to use the known localities in Nova Scotia to build a species distribution model (SDM) to better understand 1) where this species occurs, 2) what ecological variables it requires, and 3) how it should be managed and conserved.
Material and Methods
To predict where Fuscopannaria leucosticta can be found in Nova Scotia and its habitat associations, we developed a presence-only species distribution model. We chose maximum entropy modelling, using the program MaxEnt (Phillips et al. Reference Phillips, Dudik and Schapire2017), because of its superior ability to handle small datasets (Aguirre-Gutiérrez et al. Reference Aguirre-Gutiérrez, Carvalheiro, Polce, van Loon, Raes, Reemer and Biesmeijer2013) and the option it provides for using imperfect pseudo-absence data to manipulate background processes and reduce the effects of site selection bias (Anderson et al. Reference Anderson, Lew and Peterson2003; Phillips & Dudík Reference Phillips and Dudík2008; Phillips et al. Reference Phillips, Dudík, Elith, Graham, Lehmann, Leathwick and Ferrier2009). A dataset of presence and absence locations was assembled from data collected in recent lichen inventory projects in the province. The habitat requirements of other taxa in closely related groups were used as a baseline from which to estimate the needs of this species and guide covariate selection.
The lichen point data used in this study are the cumulative result of annual lichen inventories that occurred between 2005 and 2015 and were a part of surveys for Erioderma pedicellatum and other cyanolichens occurring in coastal forests. Lichen inventories were directed by a habitat prediction model for a suite of co-occurring cyanolichen species including E. pedicellatum. The model predicts habitat patches in the coastal forest of Nova Scotia. Patches range in size from a few hectares to tens of hectares. Between 2005 and 2015, 1100 patches were searched. Fuscopannaria leucosticta was found at 62 localities during the lichen inventories, and these were used in MaxEnt modelling. Sites surveyed for cyanolichens but lacking F. leucosticta, totalling 1405 “pseudo-absence” points, were used in this study to manipulate the background processes of the MaxEnt algorithm. This method of site selection bias control, called target group background manipulation here, allows the bias inherent in the presence points to be introduced to the background points, removing the bias patterns from the comparison equation (Phillips & Dudík Reference Phillips and Dudík2008; Phillips et al. Reference Phillips, Dudík, Elith, Graham, Lehmann, Leathwick and Ferrier2009). MaxEnt assesses model performance by comparing prediction in known presence locations to prediction in other locations. If the same bias can be applied to both datasets, the effect of sample bias in the output prediction surface will be diminished (Phillips & Dudik Reference Phillips and Dudík2008). This method of bias control is an important distinction in presence-only modelling that improves its accuracy.
Environmental covariates used in this analysis included depth to water table, distance to coast, mean annual precipitation and mean annual temperature (Table 1). We chose not to use WorldClim data, a commonly used climate data source for modelling species. WorldClim data is based on data from climate stations meeting the United Nation’s World Meteorological Organization (WMO) standards (Fick & Hijmans 2017) and only 25 of 57 climate stations in Nova Scotia meet WMO standards (Government of Canada 2017). However, all climate stations in the province meet Canadian standards and we expected to gain better interpolation between stations using all 57 stations rather than the limited dataset used to create WorldClim data for the province. Covariates were selected based on expert opinion (D.H.S. Richardson pers. comm.), ecological and practical criteria, and their effect on small-scale niche conditions governing microclimate suitability (temperature and moisture) noted from similar studies (e.g. Glavich et al. Reference Glavich, Geiser and Mikulin2005; Ellis et al. Reference Ellis, Coppins, Dawson and Seaward2007; Cameron et al. Reference Cameron, Neily and Clayden2011; Dymytrova et al. Reference Dymytrova, Stofer, Ginzler, Breiner and Scheidegger2016). All the raster data used in this analysis were first formatted to 50 m resolution to ensure alignment in analysis and as an intermediate resolution between fine and coarse layers. All spatial analyses were performed using ArcGIS 10.1 (Esri 2012). Depth to water table data served as an indicator of the relative soil moisture throughout the province. It was created using a digital elevation model in order to map wet areas (for methods see Arp Reference Arp2009). Distance to coast data was calculated from marine shoreline vector data using a Euclidean distance calculator without incorporating change in relief because of the relatively even topography in the province. Temperature and precipitation data in the form of monthly recordings at 57 locations between 1971 and 2000 were averaged for each sampling point and were used to interpolate a raster surface for the province using universal kriging.
Summary of environmental covariates and presence data for maximum entropy model (MaxEnt) for Fuscopannaria leucosticta in Nova Scotia, Canada

The number of covariates that could be used in this study was limited by the propensity of the model to over-predict when fewer than 10 points exist for each covariate (Franklin Reference Franklin2009), and because 62 presence points existed the number of covariates would be restricted to six. In addition to the four final covariates used in this study, we also considered elevation, proportion of red maple (Acer rubrum L.) in the forest canopy, dominant forest cover species and secondary forest cover species (note that in Nova Scotia F. leucosticta is known to occur only on red maple). All variables were tested for multicollinearity using Pearson’s correlation coefficient. Elevation and depth to water table were the only correlated variables (P<0·05) and therefore elevation was removed from the model. Forest cover (both types) was also removed due to low explanatory power and high error rates (see Westwood (Reference Westwood2016) for an analysis of error rates in Nova Scotia forest cover data).
Air pollution is often considered a factor affecting lichen distribution in Canada (Cameron Reference Cameron2004; Cameron et al. Reference Cameron, Neily and Richardson2007; McMullin et al. Reference McMullin, Ure, Smith, Clapp and Wiersma2017). Accordingly, distance to roads was considered as a parameter that might be used to estimate anthropogenic influence on air quality; however, this parameter is correlated with site selection bias. Forest type was also considered for inclusion in this model but was discarded because of the inaccuracies in the current Nova Scotia Forest Land Inventory (Westwood Reference Westwood2016). Since information about red maple was not used as a model covariate, it is recommended that regional and stand level data on the prevalence of red maple be used in addition to the broader scale maps provided here to guide efforts in the field to find, protect and study this lichen species.
We ran the MaxEnt algorithm with 500 iterations, for which a jackknife assessment was performed on covariate influence, giving a quantitative comparison of the contribution of each covariate to the model. MaxEnt uses a predetermined portion of the input point data to create a prediction map and uses the remaining data to test it, producing a statistical metric of model performance called an area under the curve value (AUC). 10% of the presence points for model testing and 90% for model training were used as these are the default settings in MaxEnt. The AUC value is the probability that a presence point excluded from the model will be ranked as having a higher probability of occurrence than a randomly chosen background point. AUC is a common metric of model performance with 0·5 being no better than random and 1·0 being a perfect fit. Generally an AUC of at least 0·70 is recommended for the production of an acceptable map (Pearce & Ferrier Reference Pearce and Ferrier2000). Doing this allows the model to predict the distribution of a species in areas for which presence information is not given and allows some metric of model quality to be produced.
Results
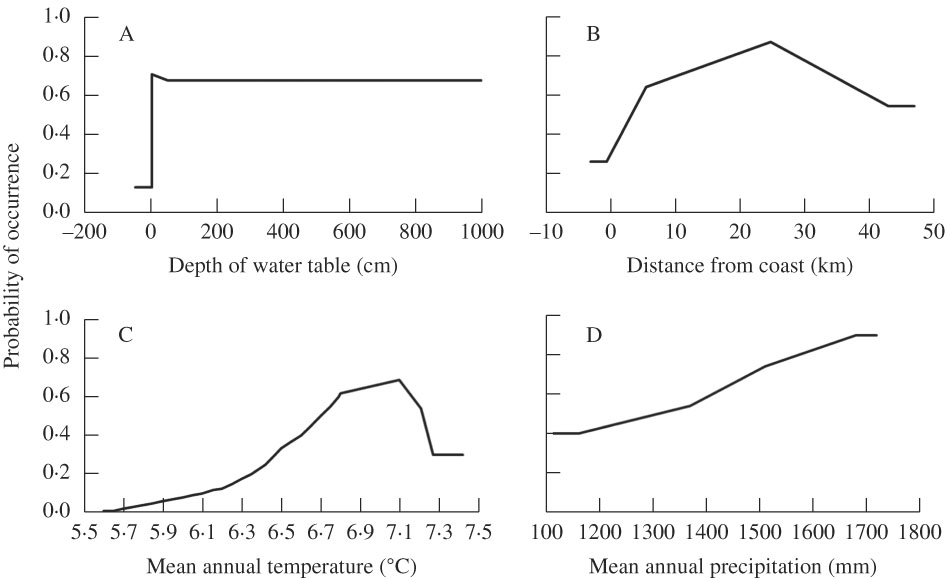
The area under the curve (AUC) value was 0·85, indicating that the model has a good capacity to predict the probability of occurrence of Fuscopannaria leucosticta. This species is more likely to occur within 8 to 40 km of the coast, in warmer and wetter areas with a mean annual temperature of 6·5–7·3 °C and a mean annual precipitation>1400 mm (Fig. 2). Depth to water table was found to improve the performance of the model, suggesting that this lichen is more often found in wetter areas with moist but not saturated soils. The peak probability of occurrence was about 25 km from the coast, suggesting sensitivity to a relatively small range of conditions. Probability of occurrence increased from close to zero in areas with an average temperature below 6 °C, to a peak at 7·1 °C. Above this mean temperature, probability of occurrence dropped off again dramatically in a curvilinear relationship. The probability of occurrence increased linearly with increased mean annual precipitation, with no apparent upper limit.
Probability of occurrence of Fuscopannaria leucosticta in Nova Scotia, Canada with A, depth to water table (as a proxy for soil moisture); B, distance from coast; C, mean annual temperature; D, mean annual precipitation. Temperature and precipitation calculated from 57 locations between 1971 and 2000.
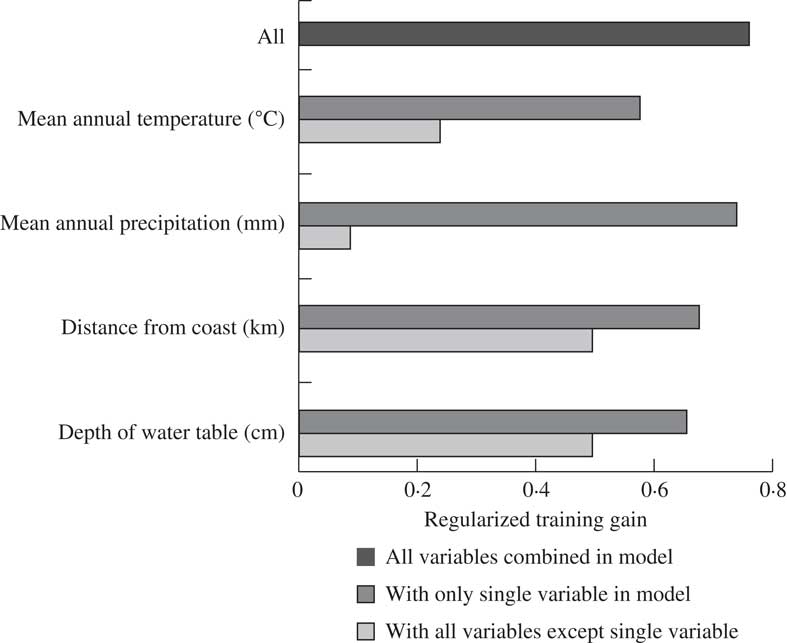
Of the four covariates, mean annual temperature contributed more than half of the model’s predictive capacity (Table 2). Distance to coast was the second most influential covariate, providing a quarter of the model’s prediction. The other two layers contributed considerably less but jackknife analysis suggested that including them improved the overall predictive power of the model (Fig. 3). Jackknife analysis is an additional test for model performance under different combinations of covariates (Fig. 3). Results of this test indicate that the model performs better with temperature alone than it does excluding temperature, meaning that not only does this layer include more information than the other layers, this information is also not captured by the other covariates. The best model performance (based on regularized training gain) is achieved with all four covariates included.
Jackknife of the regularized training gain highlighting the influence of the tested covariates in a MaxEnt (Maximum Entropy) model of the distribution of Fuscopannaria leucosticta in Nova Scotia, Canada.
Contribution of environment covariate layers to predictive capacity of a MaxEnt model of Fuscopannaria leucosticta occurrence
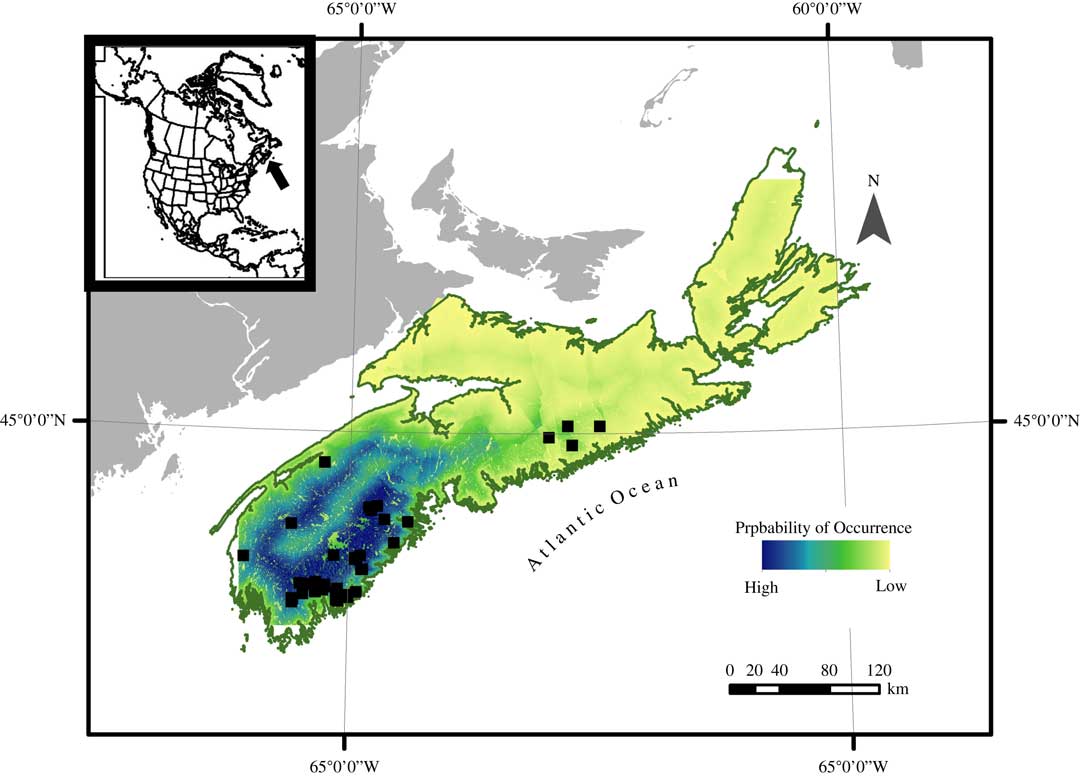
Mapped probability of occurrence can be used to infer suitable habitat for this species (Fig. 4). Based on spatial distribution of probability of occurrence, it is likely that the majority of suitable habitat can be found in south-west Nova Scotia, with the remainder of the province becoming less suitable towards the north-east. The strong influence of the distance to coast covariate can be seen in the map in the ring of more suitable habitat following the outline of the coast, particularly in south-west Nova Scotia.
Probability of occurrence heat map of Fuscopannaria leucosticta in Nova Scotia, Canada, based on a presence only species distribution model using a Maximum Entropy Model technique (MaxEnt), white squares indicating the presence locations. Probability of occurrence is expressed as an integer ranging from high (1) to low (0). In colour online.
Discussion
The relatively high AUC value of 0·85 suggests that the model was able to accurately predict the test data in 85% of cases. This reflects well on the predictive power of the model despite the relatively small sample size which is not uncommon in the study of rare species. Species distribution models have previously been shown to be successful for lichens in other studies (Glavich et al. Reference Glavich, Geiser and Mikulin2005; Bolliger et al. Reference Bolliger, Bergamini, Stofer, Kienast and Scheidegger2007; Dymytrova et al. Reference Dymytrova, Stofer, Ginzler, Breiner and Scheidegger2016). Such models improve our understanding of environmental factors which affect lichen persistence (Dymytrova et al. Reference Dymytrova, Stofer, Ginzler, Breiner and Scheidegger2016) and can also help guide conservation biologists to new locations for rare and at risk lichens (Glavich et al. Reference Glavich, Geiser and Mikulin2005; Cameron & Neily Reference Cameron and Neily2008).
The model developed in this study indicates that temperature is an important limitation to this more southerly distributed species, Fuscopannaria leucosticta. Temperature was identified as the most influential covariate on this species’ distribution. Temperature as a covariate has emerged as an important predictor of occurrence for some lichen species, but not for others. Dymytrova et al. (Reference Dymytrova, Stofer, Ginzler, Breiner and Scheidegger2016) found that temperature was a useful predictor for the distribution of 20 lichen species in Switzerland using MaxEnt and generalized linear models. Glavich et al. (Reference Glavich, Geiser and Mikulin2005) found that temperature was an important explanatory variable for only three of eight species of lichen in their logistic regression models for the Pacific Northwest. Climate envelope modelling of 26 species of lichen-forming fungi in Britain by Ellis et al. (Reference Ellis, Coppins, Dawson and Seaward2007) found temperature and precipitation useful predictors of lichen distribution. In Nova Scotia, it is likely to be the factor restricting the predicted occurrences of F. leucosticta to southern parts of the province. As this area encompasses the northernmost extent of the range of F. leucosticta in North America, it might denote a threshold of minimum temperature tolerance for this species. As such, this region is important for additional research in the context of climate change.
Changing climate might have a considerable impact on F. leucosticta in Nova Scotia. Using 40 separate coupled climate models, ClimAction Services (2017) suggest a mean temperature increase in south-western Nova Scotia of 4·9 °C by 2080. This would result in a mean temperature well above the optimum suggested by our model for F. leucosticta. Even the cooler areas of the province will likely have a mean temperature above the optimum for F. leucosticta (ClimAction Services 2017). If temperature is as important a factor as suggested by our model, F. leucosticta persistence in Nova Scotia might be in question.
The model results correlating occurrence of this species with higher soil moisture and precipitation suggests the importance of high humidity and soil moisture for F. leucosticta. Other models also suggest the importance of moisture for cyanolichens both in this region (Cameron & Neily Reference Cameron and Neily2008; Cameron et al. Reference Cameron, Neily and Clayden2011) and elsewhere (Glavich et al. Reference Glavich, Geiser and Mikulin2005; Dymytrova et al. Reference Dymytrova, Stofer, Ginzler, Breiner and Scheidegger2016). The correlation with soil moisture might be related to the requirement of liquid water for cyanolichens to photosynthesize. The curvilinear relationship with distance from the coast suggests an ideal distance which would provide optimum conditions for F. leucosticta. Conditions immediately adjacent to the coast are exposed, habitats being subject to salt spray and high winds. Areas further inland from the coast (8–40 km) are likely to be highly humid as a result of off-shore winds and fog but are not as exposed. More central areas of the province, at maximum distance from the coast (c. 60 km), are drier with less precipitation and fog (Davis & Browne Reference Davis and Browne1996).
The combination of the mean annual temperature and precipitation may best explain the regional distribution of F. leucosticta and the model results in the province. Annual temperature decreases from south-west to north-east here, possibly explaining the higher proportion of high probability of occurrence in south-western Nova Scotia. Annual precipitation is highest in the most eastern part of Nova Scotia, in the eastern half of Cape Breton Island. A high proportion of the annual precipitation in this area falls as snow, particularly in the highlands (Davis & Browne Reference Davis and Browne1996). As with other cyanolichens, F. leucosticta likely requires liquid water for photosynthesis, thus water in the form of snow would presumably be unavailable (cf. Lange et al. Reference Lange, Kilian and Ziegler1986). Decreased occurrence in more northern areas of the species range is also consistent with Werth et al. (Reference Werth, Tømmervik and Elvebakk2005) who found that in Norway epiphytic cyanolichens were limited in the northern parts of their range by low temperatures. This could, in part, explain the low probability of occurrence of F. leucosticta in the model. Precipitation along the Atlantic coast of Nova Scotia is between 1400 and 1500 mm y–1 but, unlike more northern areas of the province, 85% of this falls as rain (Clayden et al. Reference Clayden, Cameron and McCarthy2011). The largest area of high probability of occurrence falls within the coastal higher rainfall zone and higher temperature zone.
Topography and wind patterns were not factored into the model and might also play a part in the distribution of F. leucosticta in Nova Scotia. Westerly winds tend to bring dry continental air masses to the province. These are moderated by coastal effects such as late spring and summer sea breezes. A convection cell is created by land masses heating up faster than the sea. The warm air rises over land and cooler air from the ocean moves onshore bringing moister air. In winter, low arctic air masses gather moisture over the ocean, rising and precipitating the moisture when they reach land (Davis & Browne Reference Davis and Browne1996). These effects vary in different areas of the province and may be influenced by local topography. The area of highest probability of F. leucosticta occurrence has low relief, having elevational changes of only 0 to c. 150 m. Climate is more greatly influenced by topography in the northern portion of the province where elevational change can be as high as 500 m and these areas have fewer occurrences of F. leucosticta.
Scale is always an important consideration when interpreting habitat models for lichens. For example, the scale of the raster map created in this analysis is 50 m, while the scale of habitat selection for this lichen may be only a few centimetres. The specific proximate factors of a small section of red maple bark (a species known to occur in this area) are impossible to capture through GIS and remote sensing. This is a problematic discrepancy because while the map may show general areas of habitat that are optimal for this species, it cannot assist with site-level detectability in the field, especially for such an inconspicuous species. However, this coarse predictive model can be used to identify areas in which to target on-the-ground surveys.
It is possible that the inability to include certain covariates important for detectability or habitat selection could have influenced model accuracy. However, we were able to control bias patterns affecting sampling and site distribution through target group background manipulation. It is not known if some other factor governing detectability or distribution of various species of cyanolichen introduced bias. For example, some species may be more readily detectable than others.
The quality of the model might also have been influenced by the small sample size. This can be problematic in species distribution models can be problematic because outliers can carry more weight, sometimes skewing the results. Wisz et al. (Reference Wisz, Hijmans, Li, Peterson, Graham and Guisan2008) argue that the complex nature of ecological niches and potential for interacting environmental variables means that large datasets may be needed to fully describe a species distribution. Nonetheless, they compared 12 modelling methods for 46 species and found that MaxEnt had the best predictive ability across varying sample sizes and performed better than all other models at low sample sizes.
Cyanolichens have a distinctive physiology compared to the more common chlorolichens which often means they are restricted to specialized macrohabitats and/or microhabitats. This might help explain the distribution pattern of F. leucosticta in Nova Scotia. Gauslaa et al. (Reference Gauslaa, Coxson and Solhaug2012) suggested that the distribution patterns of many cyanolichens may be affected by intolerance to prolonged desiccation. Antoine (Reference Antoine2001) indicated that for the cyanolichen Lobaria oregana, the effect of temperature on carbon metabolism and N fixation might help, in part, to explain its landscape distribution pattern. The availability of liquid water appears to be an important factor in cyanolichen distribution, and indeed better model performance was achieved by including mean annual precipitation and depth to water table (as a proxy for soil moisture). Other studies of Fuscopannaria show a hygrophilous nature in several species of the genus (Carlsen et al. Reference Carlsen, Bendiksby, Hofton, Reiso, Bakkestuen, Haugan, Kauserud and Timdal2012). Using only bioclimatic variables, Carlsen et al. (Reference Carlsen, Bendiksby, Hofton, Reiso, Bakkestuen, Haugan, Kauserud and Timdal2012) were able to successfully model the distribution of F. confusa using MaxEnt in Norway.
Although landscape variables may be useful in helping understand the distribution of cyanolichens, other factors might also have an effect. Merinero et al. (Reference Merinero, Martínez, Rubio-Salcedo and Gauslaa2015) found that the cyanolichen Lobaria scrobiculata grew as fast in drier and warmer Mediterranean forests as had been reported for boreal forests. They attributed this to local conditions and/or microclimate near tree bases which are not reflected in average climate parameters. Finer scale factors such as soil moisture, used in our model, might be important components for distribution modelling and in understanding the complex relationship between cyanolichen physiology and the environment.
We recommend that the conservation status of F. leucosticta be of concern. Our model indicated that only a portion of Nova Scotia contained suitable habitat for F. leucosticta and within this narrow belt only wet forests containing red maple are suitable. Thus, this species is highly restricted within the province, as is reflected in the high search effort which resulted in only a small number of locations. Similar to other cyanolichens in the province, we suggest F. leucosticta is probably sensitive to acid precipitation, climate change and forestry practices. Protection for this species is warranted in the face of these threats and its rarity in Nova Scotia and Canada.
Our species distribution model for F. leucosticta provides baseline knowledge that can aid researchers and conservationists in identifying suitable habitat and locating additional populations in the region. This can facilitate research into other pertinent aspects of this species’ ecology, allowing conservation requirements to be evaluated, which can guide future management strategies.
This project was undertaken with the financial support of the Government of Canada. We thank Amanda Lavers for coordinating the project with the Mersey Tobeatic Research Institute. We also thank Alana Westwood for helpful comments on earlier drafts of the manuscript and Dalhousie University for the use of facilities; advice and input from Jennifer Strang, Shanni Bale and Charles Walsh is acknowledged. The authors would like to thank the Associate Editor, Sergio Pérez-Ortega, and two anonymous reviewers for helpful comments.


