


Introduction
Of the various natural climate archives (such as tree rings, corals, sea and lake sediments) ice cores play a unique role since they store information not only about temperature and precipitation but also about atmospheric composition and transport (Reference StaufferStauffer,1999). to obtain such long-term records, several deep ice-core drilling projects have been carried out in Greenland and Antarctica. Two new deep cores will be drilled in the framework of the European Project for Ice Coring in Antarctica (EPICA). One of those drillings will take place in Dronning Maud Land (DML), in the Atlantic sector of the East Antarctic plateau (Fig. 1a). This region is mainly influenced by air masses originating from the Southern Ocean (Reference Noone, Turner and MulvaneyNoone and others,1999;Reference Reijmer and PReijmer and others, in press). Accordingly, the DML deep core is expected to provide the first South Atlantic counterpart to the Greenland ice-core records over the last glacial cycle and may give crucial information about the climate coupling of both hemispheres across the Atlantic.
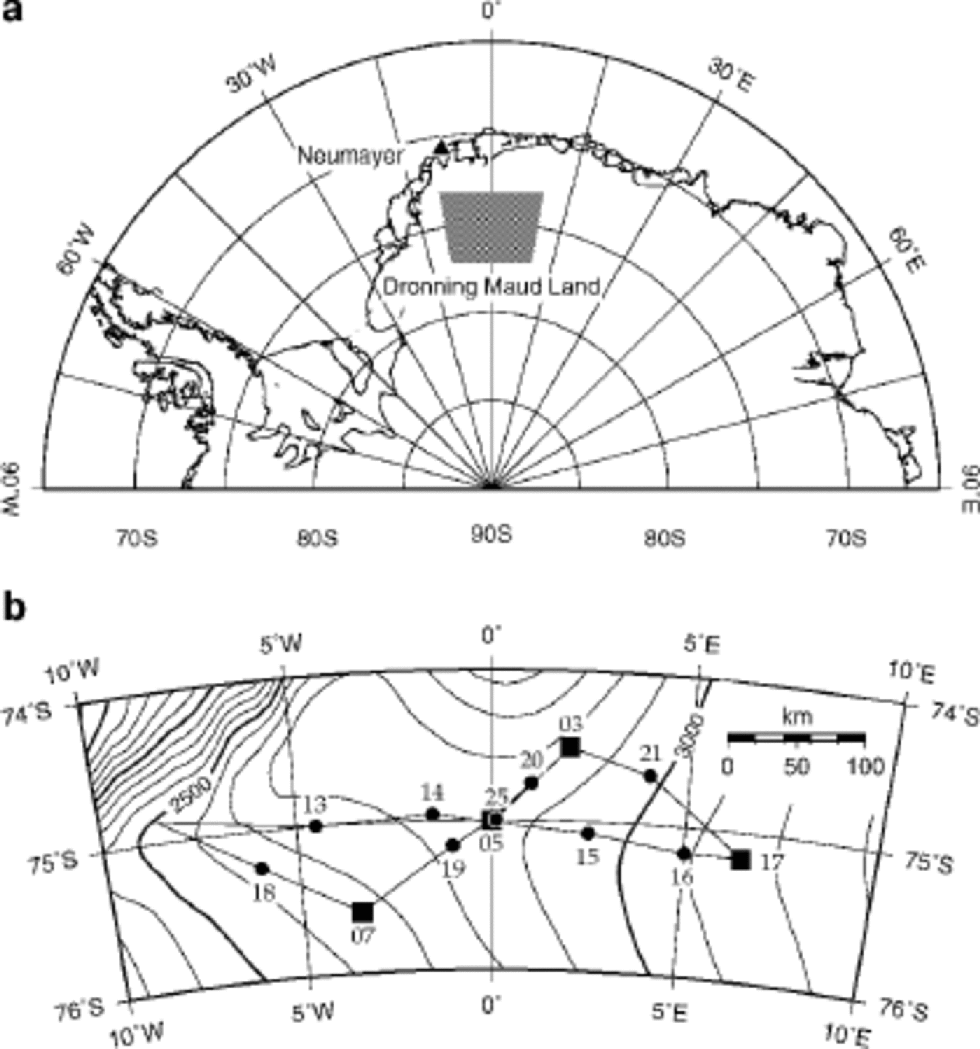
In order to study the glacio-chemical and glacio-meteorological characteristics of DML and to corroborate the interpretation of the coming deep ice-core record, a comprehensive pre-site survey has been carried out in this still unexplored area (Reference Oerter, Graf, Wilhelms, Minikin and MillerOerter and others, 1999, Reference Oerter2000). Up to now, chemical analyses have been performed on samples of four intermediate deep ice cores and fourteen snow pits taken during the 1997/98 and 1999/2000 field campaigns (Fig. 1b). Table 1compiles the information about geographical location and accumulation rate for each sampling site. In this paper we present seasonal variations and the spatial distribution of chemical species measured by ion chromatography (IC). We interpret these in terms of seasonally changing source conditions, transport pathways and aerosol deposition onto DML. Special emphasis will be put on the implications of these findings for the interpretation of the EPICA deep ice core to be drilled in this region.
Map of DML: (a) overview of Antarctica from 90˚W to 90˚ E, indicating the study area; (b) enlargement of the study area showing ice-core drilling (▪) and snow-pit (•) locations (Reference Oerter, Graf, Wilhelms, Minikin and MillerOerter and others, 1999, Reference Oerter2000).
Summary of the sampling sites in DML listing sample label, coordinates, altitude and accumulation rate (Oerter and others, 1999, 2000) for the snow-pit and ice-core locations

Methods
Sampling
Intermediate deep ice cores were drilled and snow-pit samples taken during the pre-site surveys in DML (Fig. 1b). the cores investigated here were drilled at sites DML05, DML07 and DML17 and are 150,115 and 130m long, respectively, covering 1600–2000 years. At DML03 a firn core 41 m long was drilled, covering >200 years. Because of the poor core quality of the uppermost metres of the cores, data for these depth intervals were taken from snow pits excavated at the drill sites. Unfortunately, the snow pit at DML03 was too shallow, causing a gap of 4 years (1990–93). Additionally, one snow pit (SS9908) located at the new EPICA deep drilling site in DML was sampled with high resolution in the 1999/ 2000 field season.
Snow pits were sampled using 60 mL polyethylene (PE) beakers. All beakers were rinsed with ultra-pure water (σ–1 >18 MΩ cm) until the electrical conductivity of water stored in the beakers dropped to values lower than 0.5 μS cm–1. After cleaning they were sealed in PE bags and only opened directly in the snow pit. the beakers, having a diameter of 44 mm, were pushed into the snow-pit wall at depth intervals of 30–40mm, thus slightly overlapping each other. for snow pit SS9908 snow in defined 2 cm increments was collected in pre-cleaned 250 mLPE beakers using a precleaned spatula. the beakers were closed very carefully and sealed again in PE bags for transportation back to Germany. the snow pits from the 1997/98 campaign cover a time period of 4–14 years back in time starting from December 1997; the two from 1999/2000 cover 10 (SS9908) and 11years (SS9901), starting from December 1999.
Ice cores were packed in PE bags in the field and transported to Neumayer station. All core material and pit samples were shipped in freezer facilities to Bremerhaven, Germany. In our cold laboratory the upper 7–10m of the cores at DML03, DML05, DML07 and DML17 were subsampled for chemical studies in 2 cm resolution (referred to below as high-resolution samples). With respect to the annual snow accumulation at the individual sites this corresponds to a resolution of approximately 5–9 samples per year. the high-resolution samples cover the time period 1945–90. the deeper parts of the cores were subdivided into one sample per year (referred to below as low-resolution samples) according to the records measured by continuous flow analysis (CFA), which show distinct annual cycles (Reference SommerSommer and others, 2000a).
All ice-core samples were thoroughly decontaminated under clean-room conditions using a contamination-free electromechanical plane (Reference Fischer, Wagenbach and KipfstuhlFischer and others, 1998). the decontaminated samples were packed in pre-cleaned PE bags, which had been rinsed with ultra-pure water. to check contamination during handling, ultra-pure water samples (referred to below as process blanks) were prepared, frozen and processed like the cores in the processing routine. Additionally, IC vials were filled with ultra-pure water to quantify the remnant ion concentrations of the ultra-pure water itself and the contamination introduced during the analysis (referred to below as vial blanks). After decontamination, all samples were melted under clean-room conditions and stored in pre-cleaned PE vials for analysis and as archive material.
Analysis
During the 1997/98 field season, CFA measurements were carried out on the core samples from DML03, DML05, DML07 and DML17 for Na+, Ca2+, NH4 2–, H2O2 and electrolytical conductivity at Neumayer station (Reference SommerSommer and others, 2000a,Reference Sommer, Wagenbach, Mulvaney and Fischerb). Additionally, IC analyses for methanesulphonate (MSA), Cl–,NO3 –, SO4 2– were performed at Neumayer station on samples taken from several of the snow pits (SS9803, SS9807, SS9805, SS9810).
All other snow-pit samples and all high-resolution core samples were analyzed for concentrations of MSA, Cl–, NO3 –, SO4 2–, Na+, NH4 +, K+, Mg2+ and Ca2+ using IC in the laboratory at the AlfredWegener Institute in Bremerhaven. the low-resolution core samples were measured for anions only. for those samples, sodium and calcium concentrations were taken from the CFA measurements (Sommer and others, 2000b). IC analyses of snow-pit and core samples were performed on Dionex 500 systems using an isocratic method for cations and a gradient method for anions equipped with a Dionex CS12 and a Dionex AS11 separator column, respectively. the cation system ran in the auto-suppression mode, while the anion system used an external ultra-pure water supply for the regeneration chamber of the suppression unit.
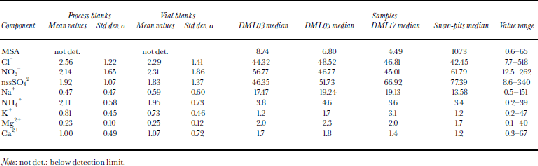
Average blank concentrations for 159 process blank samples and 449 vial blanks are listed inTable 2. Laboratory and process blank concentrations were below the lowest calibration levels and distinctively below the sample concentrations for all anion species. Comparison of process and vial blanks shows that any additional contamination introduced by the decontamination routine in the cold laboratory is negligible. Because of these low blank values, no corresponding blank correction was necessary for the presented ion concentrations. the analytical error of the IC measurements is better than 10% for all sample concentrations which are well above the blank level. However, despite the extremely low blank levels, the lower end of the sample-concentration range overlaps with the process blank values for NH4 +, K+, Mg2+ and Ca2+, significantly increasing the analytical error of such samples. In the following, only anion and Na+ concentrations are discussed.
Summary of ion concentrations (ng g–1) in process blanks (n =159), vial blanks (n =449) and samples. Listed are average concentrations and standard deviations of blank values, and for comparison the range of all sample concentrations as well as the typical concentration level found in the ice cores (time period 1865–1997) and snow pits (time period 1983–97)
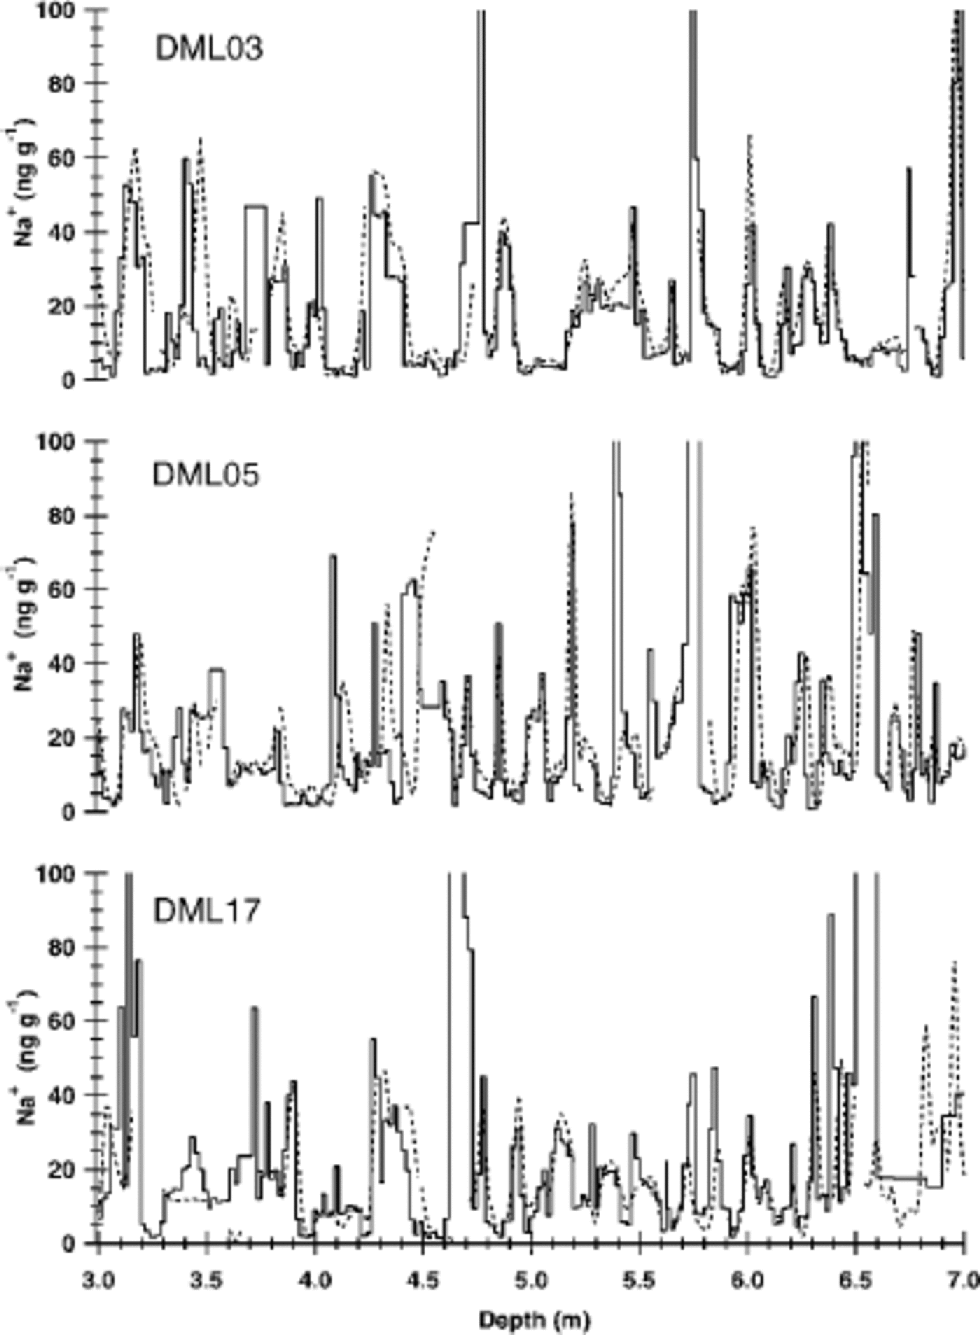
The sodium concentrations measured in high resolution by IC and CFA agree very well with each other (see Fig. 2). Average sample concentrations of both methods are equal on the 95% confidence level. Slight differences in the depth axes between the two methods can be attributed to variability in the flow velocity of the CFA and/or small losses of ice during the cutting of discrete samples. At certain depths the CFA shows gaps (Fig. 2), where data suspected of contamination had been removed from the CFA dataset. However, remeasuring these intervals in high resolution using IC proved these high values to be uncontaminated ion concentrations.
Comparison of sodium concentration profiles for cores at DML03, DML05 and DML17. the solid lines represent values determined by IC, the dotted lines by CFA measurements (Reference Sommer, Wagenbach, Mulvaney and FischerSommer and others, 2000b).
Dating
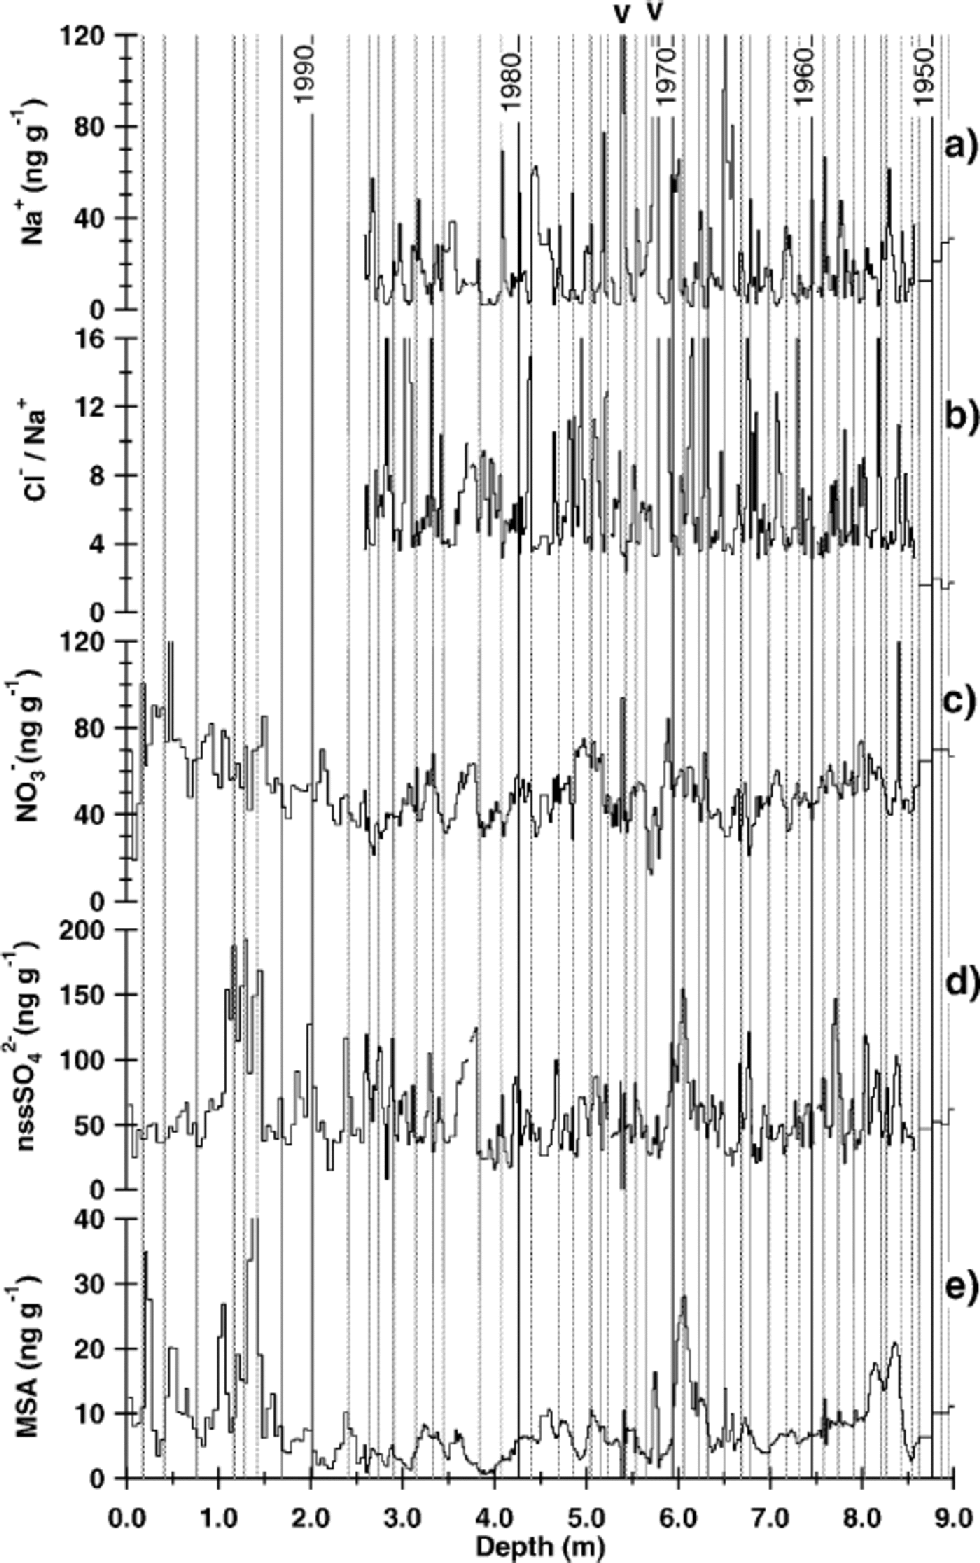
A preliminary dating by dielectric profiling was carried out, showing that the volcanic eruption of Tambora, Indonesia, in 1815 could be clearly detected in all cores. Accordingly, dating based on radioactive horizons of nuclear weapon tests in the 1950s and 60s, as used in an earlier study in this area (Reference Oerter, Graf, Wilhelms, Minikin and MillerOerter and others, 1999), was not performed here. Stratigraphic dating was accomplished by Reference SommerSommer and others (2000a) using a combination of annual-layer counting in the CFA records and identification of the most prominent historic volcanic horizons in the electrolytical conductivity profile. the latter are mainly related to high concentrations of sulphuric acid in the respective snow layers. In general, this dating was adopted for this study. Only slight corrections were made according to our high-resolution snow-chemistry profiles: for the high-resolution and snow-pit samples annual markers were set at the falling flank of Na+ and the rising flank of non-sea-salt (nss) sulphate (calculated by subtracting the sea-salt contribution from the total sulphate concentration according to [nssSO4 2–] = [SO4 2–] – 0.252 [Na+]), indicating the spring season (Fig. 3). Stable-isotope profiles were not considered because of resolution constraints and diffusional smoothing of the isotope record. Snow pit SS9908, which was sampled for isotope and chemistry analyses in high resolution (2 cm), was the only one dated by marking the summer maximum in δD for each year (Fig. 4b).
(a) Concentration of sodium, (b) Cl–/Na+ ratio, (c) concentrations of nitrate, (d) nss-sulphate and (e)MSAvs depth for the snow pit (SS9805) and core (B32) at DML05. the snow-pit data cover the top 2.58 m, the high-resolution sequence of core DML05 the interval from 2.58 down to 8.52 m. the arrows indicate the prominent double peak in sea-salt concentration occurring in all three cores. the vertical lines mark the time between the falling flank of Na+ and the rising flank of nssSO4 2–, indicating the spring season.
(a) Concentration of sodium and Cl–/Na+ ratio (dotted line), (b) δD (personal communication from W. Graf, 2001), (c) concentrations of nss-sulphate and (d) MSA vs depth for snow pit SS9908. In accordance with other high-altitude Antarctic sites (Reference Kirchner and Delmas.Kirchner and Delmas, 1988; Reference IsakssonIsaksson,1994; Reference Cole-Dai, Mosley-Thompson and Thompson.Cole-Dai and others, 1997; Reference StenbergStenberg and others, 1998), sea-salt sulphate explains only around 7–12% of the total sulphate concentration. the vertical lines mark the summer maximum in δD for each year.

Dating of the cores using the high-resolution CFA records was reliable within ±5 years (Reference SommerSommer and others, 2000a) over the last millennium. Dating of the DML05 core, however, had to be modified at one point. Reference SommerSommer and others (2000a) assigned a peak in the conductivity record at 6.12 m depth to the eruption of Mount Agung, Indonesia, in 1963, which was also observed at other Antarctic sites (Reference Delmas, Legrand, Aristarain and ZanoliniDelmas and others, 1985,Reference Delmas, Kirchner, Palais and Petit1992; Reference IsakssonIsaksson,1994). However, the coherent increase of MSA and nss-sulphate at this depth implies that the assigned peak in the DML05 core is mainly caused by biogenic sulphate input and not by a volcanic eruption. Additionally, an utmost prominent double peak in the sea-salt components was found in all cores, as indicated in Figure 3. This feature could only be aligned for all cores within the dating accuracy by shifting the eruption of Mount Agung in DML05 to another peak in the sulphate and conductivity profiles at 6.77 mdepth.
Results and Discussion
Seasonal variation
The high-resolution records of the chemical components in snow and ice show consistent seasonal variations in all three cores and snow pits. An example of these seasonal cycles is shown in Figure 4 for the high-resolution snow pit SS9908 and in Figure 3 for snow pit SS9805 (depth 0–2.58m) and core B32 (2.58–9m) at DML05. Figure 4b also shows the results for the isotopic signature of the ice acting as proxy thermometer. Automatic weather stations (AWS) deployed in central DML (Reference ReijmerReijmer, 2001) reveal a strong temperature maximum in December/January, and very cold conditions ranging from May to October. AWS snow-height measurements indicate that a few major precipitation events were responsible for most of the annual snow accumulation. for instance, in 1998 four snowfall events contributed about 80% of the annual snow accumulation (Reference Reijmer and van den Broeke.Reijmer and Van den Broeke, 2001). In principle, this is supported by modelling studies (Reference Noone, Turner and MulvaneyNoone and others, 1999;Reference ReijmerReijmer, 2001). Despite these event-like precipitation characteristics, δD shows a well-developed seasonal cycle, with maxima corresponding to the temperature maxima in summer and minima in winter. Due to the diffusional smoothing of the isotope record in the firn, however, single precipitation events cannot be distinguished in the δD record, and dating of the seasonal cycles in ion concentrations relative to the isotope record is only accurate to a few months. In the following, we distinguish only between the four major austral seasons, not referring to specific months.
In Figure 4a, sodium, which together with chloride is mainly derived from sea-salt aerosol, shows maximum ion concentrations on the rising flank of the δD record, indicating a sea-salt maximum in late winter/spring. This points to enhanced cyclonic activity over the South Atlantic region connected to higher transport of sea-salt aerosol onto DML during late winter/spring, despite the larger sea-ice coverage at this time of year. Higher storminess in this season is also indicated by faster air-mass transport in trajectory studies by Reference Reijmer and van den Broeke.Reijmer andVan den Broeke (2001).
MSA and nss-sulphate, which in Antarctica are essentially derived from the marine biogenic production of dimethylsulphide (DMS) (Reference Legrand and DelmasLegrand,1995; Reference StenbergStenberg and others, 1998), show a prominent maximum on the declining flank of the δD (Fig 4d and c) record equivalent to maximum concentrations in autumn. This is significantly later than the distinct biogenic sulphur maximum observed at the coastal Antarctic station Neumayer (Minikin and others, 1998) in summer when sea ice retreats for a short time. Such a phase shift may be attributed to the different source areas of biogenic sulphur relevant for DML compared to Neumayer (NM). While NM is more influenced by DMS production in high-latitude ocean areas relatively close to NM, trajectory studies for DML show that air masses originate as far away as 55˚ S 5 days back in time (Reference Reijmer and PReijmer and others, in press). In this area, biogenic productivity is extended to March/April (Minikin and others, 1998) in line with our MSA and nss-sulphate peak at that time of the year.
However, nss-sulphate also shows a second peak during late spring/summer in the high-resolution snow-pit record (Fig. 4c) which is only occasionally connected to elevated MSA levels. Due to the lower resolution of the core data compared to data from snow pit SS9908, the double peak in nss-sulphate concentrations is not always resolved in the cores. Based on aerosol measurements of the cosmogenic radioisotopes 10Be and 7Be performed at NM (Reference Wagenbach, Legrand, Fischer, Pichlermayer and WolffWagenbach and others, 1998), a stratospheric input of sulphate during summer seems very unlikely. Therefore, only biogenic sources appear to be able to explain such a sulphate input. A post-depositional migration of the MSA peak away from high-acidity layers (e.g. high sulphuric acid concentrations), which has been observed in ice cores from other Antarctic sites (Reference Ivey, Davies, Morganand and AyersIvey and others, 1986; Reference Minikin, Wagenbach, Graf and KipfstuhlMinikin and others 1994; Reference Pasteur and MulvaneyPasteur and Mulvaney, 2000), cannot be clearly seen in Figure 4d. However, post-depositional smoothing of the MSA record is observed below a few metres depth in Figure 3e.
Post-depositional effects were also observed for nitrate which originates from lightning-induced NO formation and intrusions of stratospheric air masses (Reference Wolff and DelmasWolff, 1995; Reference Wagenbach, Legrand, Fischer, Pichlermayer and WolffWagenbach and others, 1998). In contrast to results from firn cores retrieved at high-accumulation sites showing maximum nitrate concentrations in summer (Reference Minikin, Wagenbach, Graf and KipfstuhlMinikin and others, 1994; Hou and others,1999), it was not possible to detect any seasonality in our measured nitrate profiles. This can be attributed to a substantial post-depositional nitrate loss, which degrades any initially existing seasonal signal. the nitrate loss is up to 40%, which is estimated from the 40% lower mean nitrate concentration in core B32 compared with the mean concentation in snow pit SS9805 (upper 2.58m).
Spatial distribution
The dependence of average ion concentrations on the major geographical and glacio-meteorological parameters in the
All our drill sites are located on the Antarctic plateau and cover an altitude range between 2669m (DML07) and 3160 m (DML17) (Fig. 1b). At the same time the average annual snow accumulation covers a range from 89 kg m–2 a–1 (DML03) to 47 kg m–2 a–1 (DML17) (Table 1), with generally lower accumulation rates found at higher altitudes. Lower accumulation rates were also found on the lee side of the main ice divide (DML07 in Fig. 1b). Note that the snow pits cover an altitude range between 2630m (SS9802) and 3160 m (SS9810) (Fig.1b) but are limited in the time-span shared by all snow pits to only 4 years. Thus, the temporal representativeness of the pit averages (Fig. 5) is limited.
Geographical variation of average ion concentrations with altitude (a–d) and average annual snow accumulation (e–f) in the DML region. Crosses refer to snow pits (1997– 94), while squares indicate ice-core (1950–1865) averages. the standard deviation of the mean annual values for the ice cores are given by error bars. Also plotted are data for a DML ice core (rhombus) investigated by Reference IsakssonIsaksson (1994) covering the time period 1950–1865. DML region is shown in Figure 5. to distinguish surface snow and older firn strata, which might have been subject to post-depositional alterations, and to improve the spatial resolution, average ion concentrations both in the snow pits (for the common time period 1997–94) and in the ice cores (over the time period 1950–1865) are plotted in Figure 5. Data for the same period (1950–1865) from a DML ice core investigated by Reference IsakssonIsaksson (1994) are also plotted in Figure 5.
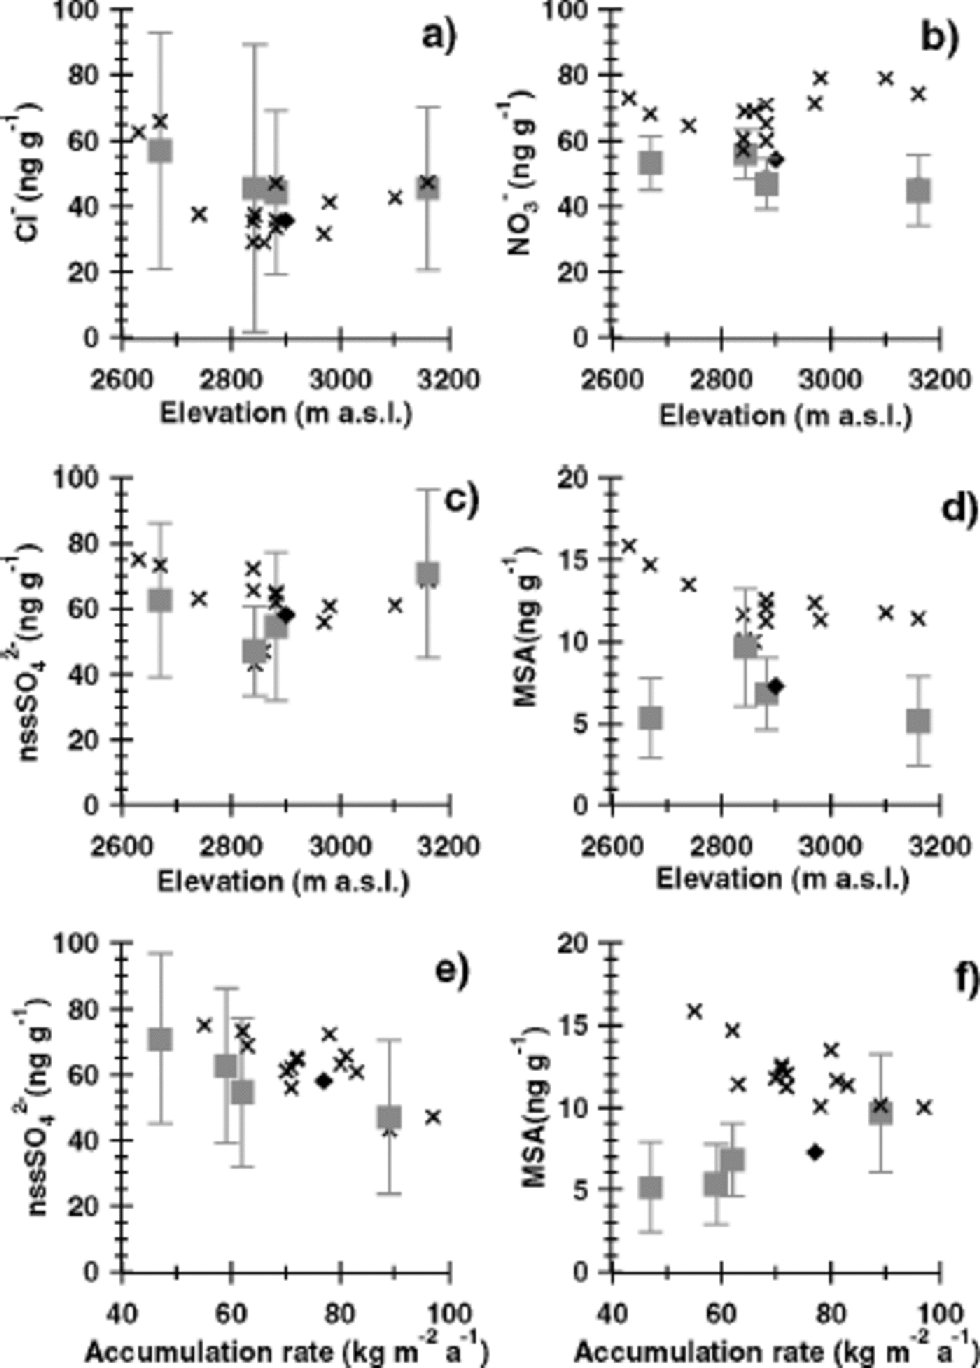
The long-term core averages in nss-sulphate show no clear relationship with altitude but a strong decline with higher accumulation rates (Fig. 5e). the recent snow-pit data essentially show the same feature, but with a somewhat higher concentration level reflecting the different time periods covered. Such a spatial decrease of sulphate concentration with higher snow accumulation can be expected from the dilution of dry-deposited sulphate aerosol by higher precipitation rates. Using the linear dependence of sulphate concentration on inverse snow accumulation as given by Reference Fischer, Wagenbach and KipfstuhlFischer and others (1998), a total dry-deposition flux of approximately 240 ng cm–2 a–1 can be deduced. This implies that about three-quarters of the total sulphate flux is due to dry deposition at the future EPICA drill site in DML (75˚00.10’ S, 0˚04.07’ E) with a long-term accumulation rate of 62 kg m–2 a–1.
In Figure 5d and f, MSA shows an exponential decrease with higher altitude and higher snow accumulation for the snow-pit data. However, in Figure 5f for the long-term core averages reflecting older firn the opposite relationship with snow accumulation is found. While the snow-pit data of MSA and nss-sulphate show a similar dependence on a change in accumulation rate, the opposite relationship was observed in the core data. Considering that the source of both MSA and the main part of nss-sulphate is the photo-oxidation of DMS (Reference Legrand and DelmasLegrand, 1995; Reference Saltzman and DelmasSaltzmann, 1995), similar transport and deposition mechanisms, and thus a similar geographical distribution, are expected. One reason for a difference in the spatial distribution of MSA and sulphate in the ice-core averages could be related to the different atmospheric residence times of MSA and nss-sulphate with their gaseous precursors in the atmosphere. Thephoto-oxidation mechanism of DMS is highly complex (Reference Yin, Grosjean and SeinfeldYin and others, 1990). In short, MSA is produced via short-lived transient intermediates, while formation of sulphate occurs via the more stable SO2, which considerably enlarges the effective atmospheric residence time of this branch of DMS oxidation. Thus, MSA concentrations may be subject to stronger depletion along an air-mass trajectory over the DML region. However, a 50% decline in the MSA ice-core averages appears to be far too large to be accounted for by this effect. A more important consideration seems to be that a difference in atmospheric residence time cannot explain the different spatial distribution of snow-pit and ice-core MSA data.
In view of the inconsistency between snow-pit and ice-core averages and considering the very large size of the spatialMSA decrease in the ice-core data in this geographically rather uniform area, only an accumulation-rate-dependent post-depositional loss of MSA could readily explain a net decrease of up to 50%. Such a loss of MSA has been reported from the low-accumulation site Vostok, East Antarctica, by Reference Wagnon, Delmas and LegrandWagnon and others (1999), who, however, pointed out that a re-evaporation of particulate MSA from the snowpack is difficult to achieve. Additionally, such a loss cannot be unambiguously detected in our pit profiles. There are somewhat higher MSA concentrations in the uppermost metre, from 1992 to 1997 (see Fig. 4d and 3e). However, higher MSA concentrations in these years may also be attributed to extraordinarily high DMS concentrations, possibly connected to El Niño events as proposed by Reference Legrand and Feniet-SaigneLegrand and Feniet-Saigne (1991) for South Pole snow and by Reference Isaksson, Karlén, Mayewski, Twickler and WhitlowIsaksson and others (2001) for Amundsenisen. Taking into account that intervals with higher MSA concentrations are also repeatedly found in deeper layers, the question of the existence of a post-depositional net loss of MSA remains open.
The sea-salt-derived components chloride (Fig. 5a) and sodium show an exponential decline with altitude with an e-folding height of approximately 1800 and 1300 m, respectively.The larger scaling height of chloride compared to sodium may reflect the additional transport of gaseous HCl onto the ice sheet, produced by an acid-induced release of HCl from sea-salt aerosol (Reference Legrand and Delmas.Legrand and Delmas, 1988). Such a HCl contribution is also supported by the existence of significant nss-chloride concentrations in the upper snow layers on the plateau. This effect is most prominent during summer, when biogenic sulphur species cause a substantial acidification of the atmospheric aerosol as reflected in summer peaks in the Cl–/Na+ ratio in our high-resolution records (Fig. 4a). the geographical decline in sea-salt aerosol essentially levels out on top of the DML region (Fig. 5a). Sea-salt concentrations in a core investigated by Reference IsakssonIsaksson (1994), covering the same time period as the cores studied here, are somewhat lower than our ice-core data. Note, however, that the concentrations of all other ion species agree well between the DML cores studied here and the one studied by Reference IsakssonIsaksson (1994).The lower sea-salt concentrations in the core studied by Reference IsakssonIsaksson (1994) can most likely be explained by the removal of very large concentration values in that core which were suspected to be contaminated (personal communication from E. Isaksson, 2001).
Nitrate shows a rather uniform spatial distribution in Figure 5b, with significantly higher nitrate concentrations in recent snow pits compared to the older ice-core data. We attribute this finding to post-depositional nitrate loss (Reference Legrand and Delmas.Legrand and Delmas, 1988; Reference Wolff and DelmasWolff, 1995; Reference Mulvaney, Wagenbach and WolffMulvaney and others, 1998), which levels the ion concentrations. the post-depositional loss in nitrate is discussed in detail by Reference RöthlisbergerRöthlisberger and others (2002). A post-depositional nitrate loss of the size observed by Reference RöthlisbergerRöthlisberger and others (2002) at ultra-low-accumulation sites like Dome Concordia (from 1000ppm at the surface down to15 ppm), however, is not observed in our cores. Nitrate concentrations in surface snow samples taken during the 2000/01 season at DML05 reach 263 ppb (personal communication from C. Piel, 2001), whereas average concentrations of about 56 ppb (at DML03), 47 ppb (at DML05), 53 ppb (at DML07) and 45 ppb (DML17) were found in the DML cores. the average nitrate concentrations at Dome C (Reference Legrand and DelmasLegrand and Delmas, 1986) after post-depositional alteration are less than a third of the values found in DML. Even taking into account a higher post-depositional loss of nitrate at Dome C, where the accumulation rate is approximately half of that in DML, the size of this decrease is extremely large. Accordingly, factors other than snow-accumulation rate, such as temperature, snow formation and recrystallization in the snowpack or wind speed, may additionally affect the post-depositional nitrate loss.
Conclusion
Seasonal and spatial variations of chemical snow parameters in DML have been discussed based on ion chromatographic analyses of four intermediate deep ice cores covering the last 140 years and 14 snow pits covering the time period 1994–97.
The seasonal and spatial variations show that the area under investigation in DML is well suited for the reconstruction of long-term chemical records from the new EPICA ice core. the snow-accumulation rate is large enough to ensure seasonal information while at the same time making it possible to reach far into the past. the seasonal signal is well archived for sulphate and sea-salt components, allowing for an accurate stratigraphic dating of the new deep core, at least for the Holocene period.
The variation in the spatial distribution of most chemical species on the DML plateau is mainly linked to the change in snow-accumulation rate and altitude. the ice velocity at the future EPICA drill site and upstream along the ice divide is on the order of 1 m a–1, which is lower as shown by balance-velocity calculations (Reference Huybrechts, Steinhage, Wilhelms and BamberHuybrechts and others, 2000). This means that for a time-span of 150 000 years the horizontal displacement from the original location, where the precipitation had been deposited, to the drill site is approximately 150 km or less. This means the catchment area for the deep ice core is roughly the area in between DML17 and DML05, with a rather uniform accumulation pattern (Reference OerterOerter and others, 2000). Thus, assuming a past dependence of ion concentrations on altitude and snow accumulation, similar to that shown in Figure 5, it is in principle possible to correct for minor spatial changes of ion concentrations. In any case, during the Holocene time interval the catchment area decreases to 10 km around the future deep drilling site, where spatial corrections are unnecessary. for nitrate and potentiallyMSA a post-depositional loss is found, which, however, is not as severe as that found at Dome Concordia. Nevertheless, the interpretation of these species in terms of atmospheric changes needs to be studied further in order to explain and quantify such re-evaporation effects.
Acknowledgements
This work is a contribution to the European Project for Ice Coring in Antarctica (EPICA), a joint European Science Foundation/European Commission (EC) scientific programme, funded by the EC and by national contributions from Belgium, Denmark, France, Germany, Italy, the Netherlands, Norway, Sweden, Switzerland and the United Kingdom.This is EPICA publication No. 40. Financial support by Deutsche Forschungsgemeinschaft (project OE 130/3) is gratefully acknowledged. We thank T. Bluszcz, M. Lelke andT.Max for excellent assistance in the laboratory. We also thank E. Isaksson and an unknown reviewer, as well as K. Goto-Azuma and E.W.Wolff, for comments that helped to improve the manuscript.



