


1. Introduction
Recent years have seen an increasing interest in corpus phonetics methods. Large comparative databases including audio recordings and detailed transcriptions, such as DoReCo (Seifart et al. Reference Seifart, Paschen and Stave2022), Multi-CAST (Haig & Schnell Reference Haig and Schnell2023), and VoxCommunis (Ahn & Chodroff Reference Ahn and Chodroff2022), among others, have made cross-linguistic phonetic studies more accessible than ever. Likewise, computational tools, especially forced alignment algorithms, have made it much faster to create text-to-audio time alignments that are needed for many types of phonetic study (McAuliffe et al. Reference McAuliffe, Socolof, Mihuc, Wagner and Sonderegger2017). As a result of these innovations and resources, new phonetic insights have been gleaned using large amounts of (often) natural speech audio recordings (Liberman Reference Liberman2019; Seifart Reference Seifart2021).
For fieldworkers, archiving collected data to preserve it for future use is a critical part of research; as a result, there are now decades of archived linguistic data from many under-researched, endangered, and sometimes extinct, languages of the world. While these archival deposits often require some additional processing before they are ready for phonetic analysis, the data available from these sources are invaluable, especially for comparative work, and can serve to expand the range of already existing phonetic databases.
Work on prosody and stress in endangered languages is not as common as other types of phonetic documentation (Whalen et al. Reference Whalen, DiCanio and Dockum2020; Macaulay Reference Macaulay2021). Studies concerning prosody in words and phrases have often required the creation of targeted experiments and the collection of novel data, making such studies less accessible for many languages with few or no speakers. Likewise, the nature of the methodologies used and language knowledge needed for these types of experiments reduces the accessibility of such work for researchers who want to document this aspect of language but do not specialize in phonetics or phonology, or those who are interested in typological work but are not highly knowledgeable in the language(s) of interest. Lexical stress typologies have largely focused on the phonological features of stress, such as foot structure, left-right alignment, quantity sensitivity, and so on, but fewer studies have considered the acoustic correlates of stress cross-linguistically. The most prominent cross-linguistic work of this type is Gordon & Roettger (Reference Gordon and Roettger2017), which presents a meta-study of stress correlates found in studies of 75 languages (see § 1.1 for more discussion).
This paper considers the phonetic typology of lexical stress correlates in a set of Australian languages. Most Australian languages (about 80%) have consistent initial lexical stress (Goedemans Reference Goedemans, van der Hulst, Goedemans and van Zanten2010; Fletcher & Butcher Reference Fletcher, Butcher, Nordlinger and Koch2014). However, as has been found in other cases of phonological uniformity, phonetic variation underlies this higher-level consistency in stress marking. The claim that is often made about Australian languages is that the primary acoustic correlate of initial stress is f0 (pitch), based on a handful of studies of individual languages,Footnote 1 but a comparative study of stress correlates across many languages has not been done (Jepson & Ennever Reference Jepson, Ennever and Bowern2023).
1.1. Phonetic stress typology
Duration, intensity, and fundamental frequency (f0) have been identified as potential correlates of stress since at least Fry (Reference Fry1958), whose experiments on English isolated each of these as salient stress cues. Since then, a number of other phonetic factors have been found to mark stress in some languages, including: onset consonant duration; post-tonic consonant duration; peripherality of vowels; spectral tilt; and others (Lehiste Reference Lehiste1970; Van Heuven Reference Van Heuven, Goedemans, Heinz and Van der Hulst2018).
While typological work on stress correlates is sparse, Gordon & Roettger (Reference Gordon and Roettger2017) is one meta-study that looks at acoustic stress correlates identified in 110 published studies of 75 languages. The authors find in their survey that measurements of duration, f0, intensity, vowel formants, and spectral tilt correlate with stress in 70 − 85% of the studies that measure them. However, these studies tend to measure only the acoustic factors that they first hypothesize are related to stress, so the prevalence of these acoustic correlates may be biased in this way. For example, while vowel formants are found to cue stress in 83% of studies that measure it, only 35 of 110 studies investigate this phonetic factor at all. On the other hand, duration is measured in 100 of the studies considered and is found to correlate with stress in 85 of them.
The studies included in Gordon & Roettger (Reference Gordon and Roettger2017) used widely differing methodologies, from the type of measurement taken (e.g. f0 peak versus f0 range) to the statistical models used, and these differences are likely to have an impact on the comparability of the results, as discussed in detail by the paper’s authors. In the present study, data processing and methods can be kept the same across languages, making the results more cross-linguistically comparable.
1.2. Description of stress in Australian languages
In most Australian languages, stress has been described as trochaic, left-aligned, and quantity insensitive (Goedemans Reference Goedemans, van der Hulst, Goedemans and van Zanten2010; Baker Reference Baker, Koch and Nordlinger2014; Fletcher & Butcher Reference Fletcher, Butcher, Nordlinger and Koch2014; Jepson & Ennever Reference Jepson, Ennever and Bowern2023). Stress falls on the initial syllable of the word or stem. There are some cases, especially in prefixing non-Pama Nyungan languages, of stress being attached to the root leaving prefixes unstressed (cf. Baker Reference Baker, Koch and Nordlinger2014: 156). A small number of Australian languages spoken in Arnhem Land have been reported to have right-aligned trochees (penultimate stress) (Goedemans Reference Goedemans, van der Hulst, Goedemans and van Zanten2010: 72). These languages are not included here as they tend to have more complex stress assignment rules warranting separate study.
The acoustic measurement that is most often found to correlate with stress in Australian languages is f0 (Goedemans Reference Goedemans, van der Hulst, Goedemans and van Zanten2010; Fletcher & Butcher Reference Fletcher, Butcher, Nordlinger and Koch2014; Jepson & Ennever Reference Jepson, Ennever and Bowern2023). However, many Australian languages have no phonetic description of stress, so whether this observation generalizes across Australia remains an open question. In addition to f0, acoustic dimensions that have been found to correlate with stress in at least some Australian languages include duration, intensity, onset duration, post-tonic consonant duration, vowel quality, and spectral tilt (cf. Fletcher & Evans Reference Fletcher and Evans2002; Bishop Reference Bishop2003; Simard Reference Simard2010; Fletcher et al. Reference Fletcher, Stoakes, Loakes and Singer2015; Jepson et al. Reference Jepson, Fletcher and Stoakes2019).
1.3. The present study
In what follows, I present the first comparative phonetic study of stress in a set of Australian languages which have been described as having fixed, word-initial prominence. Details on the languages included and notes on the processing of the archival recordings are described in § 2.1. The most commonly cited acoustic correlates of stress in these languages—fundamental frequency, vowel duration, preceding and following consonant durations, intensity, and vowel space—are tested; methods are summarized in § 2.2. Results are presented in § 3, and a discussion of these results and the variation observed across languages is presented in § 4.
It has been noted that previous language-specific studies of stress in Australian languages have relied primarily on elicited words in isolation, introducing confounds between word- and phrase-level prosodic phenomena (Fletcher & Butcher Reference Fletcher, Butcher, Nordlinger and Koch2014; Jepson & Ennever Reference Jepson, Ennever and Bowern2023). Languages without dedicated phonetic studies of stress, on the other hand, tend to have descriptions of stress based mainly on the documentary linguist’s intuitions, introducing potential errors due to the phenomenon of ‘stress ghosting’ (Tabain et al. Reference Tabain, Fletcher and Butcher2014). In the present study, the former shortcoming is overcome with the use of natural speech audio that contains words in a variety of phrasal positions and contexts. The issue of ‘stress ghosting’ is avoided by relying on a data-driven approach to identifying stress cues, while the previous descriptions of stress serve only as the hypotheses for stress position.
2. Materials and methods
Natural speech audio was sourced from deposits in three language archives: the Australian Institute of Aboriginal and Torres Strait Islander Studies (www.aiatsis.gov.au), the Endangered Languages Archive (www.elararchive.org), and the Pacific and Regional Archive for Digital Sources in Endangered Cultures (www.paradisec.org.au). The language sample was based on the availability of appropriate archival resources, namely narrative or conversational audio with time-aligned transcriptions at least at the utterance level. Data was obtained in accordance with the access conditions of the deposit, which were in some cases open-access and in others required further permissions. More information about the archival sources is available in Appendix A.
2.1. Languages
The thirteen languages included in this study are shown on the map in Figure 1. Seven languages are members of the Pama Nyungan family, while the remaining six are non-Pama Nyungan languages of Australia. Pama Nyungan languages have been described with consistent, word-initial lexical stress across the family (Fletcher & Butcher Reference Fletcher, Butcher, Nordlinger and Koch2014; Jepson & Ennever Reference Jepson, Ennever and Bowern2023). Among the non-Pama Nyungan languages, some languages and language groups seem to have other (primarily penultimate) stress patterns or potentially no lexical stress, e.g. Kunbarlang (Goedemans Reference Goedemans, van der Hulst, Goedemans and van Zanten2010), Wubuy (Baker et al. Reference Baker, Bundgaard-Nielsen, Babinski and Fletcher2019), Dalabon (Torres & Babinski Reference Torres and Babinski2024), and others. Only languages with a documented description of fixed and word initial lexical stress are considered here, for consistency in comparing phonetic cues.
Map of languages included in this study. Location information from the Chirila database (Bowern Reference Bowern2016).

Of the Pama Nyungan languages in this study, three are part of the Wati subgroup, situated within the Western Desert region. These languages—Warnman, Ngaanyatjarra, and Pitjantjatjara—represent the northern, central, and southern groups of Wati languages respectively (Babinski et al. Reference Babinski, Rojas-Berscia, Bowern and Bowern2023). Wanyjirra and Warlpiri are Ngumpin-Yapa languages, spoken in the northwest regions of Australia; Wanyjirra represents the Ngumpin subgroup, while Warlpiri represents the Yapa subgroup (Meakins et al. Reference Meakins, Ennever, Osgarby, Browne, Hamilton-Hollaway and Bowern2023). Wati and Ngumpin-Yapa languages are both part of the Nyungic branch of Western Pama Nyungan. Yannhangu represents the Yolngu subgroup, another group on the western branch of Pama Nyungan (Bowern & Atkinson Reference Bowern and Atkinson2012). Yidiny is a relative outlier in this group as a member of the Paman subgroup of the northern branch of the family.
The six non-Pama Nyungan languages in this study each come from smaller genetic groupings and are not related to one another. Kayardild, spoken on Bentinck and Mornington Islands in Queensland, is a Tangkic language, a small subgroup that has been alternately proposed to be a sister subgroup to or classified within Pama Nyungan (Bowern Reference Bowern2020). The remaining languages are spoken in the Kimberley and Arnhem Land regions of north central Australia: Bardi (Nyulnyulan), Burarra (Maningrida), Gija (Jarrakan), Malak Malak (Northern Daly), and Ngan’gi (Southern Daly). Despite their similar names, Northern Daly and Southern Daly languages are not considered to be historically related to one another (Evans Reference Evans2003; Nordlinger Reference Nordlinger2017).
2.2. Data processing
Most of the languages included in this study were transcribed by the linguist who collected the audio, with utterance-level alignments made in ELAN (ELAN 2018). These alignments, along with the audio, were used as input to the Montreal Forced Aligner (McAuliffe et al. Reference McAuliffe, Socolof, Mihuc, Wagner and Sonderegger2017) to generate word and segment alignments in Praat (Boersma & Weenink Reference Boersma and Weenink2013). Text was aligned to audio using the pretrained English language model and subsequently hand corrected.Footnote 2 An example of the resulting TextGrids aligned to audio is given in Figure 2. More information about the data processing method is outlined in Babinski et al. (Reference Babinski, Dockum, Hunter Craft, Fergus, Goldenberg and Bowern2019), which investigates the accuracy of forced alignment on the same Yidiny data included here.
Example of Malak Malak audio after word and segment-level alignment; lalarrk wamatelk algijbiwe ‘he gets the sores, the boy, delk - stay away (from the wallaby)’ (Hoffmann Reference Hoffmann2015).

2.3. Acoustic measurements
Potential acoustic correlates of stress were extracted from audio data using Praat scripts and normalized in R (Boersma & Weenink Reference Boersma and Weenink2013; R Core Development Team 2015). Praat scripts for measurement extraction were modified from Dicanio (Reference Dicanio2017). This subsection describes how each acoustic measurement was taken and how the measurements were normalized for the analysis. Consonantal durations were measured for testing the effect of stress on onset and post-tonic consonants, and all other measures focus on the vowel as the unit of analysis. Vowel measurements included duration, intensity, f0 measures, and vowel space, all of which are detailed here.
2.3.1. Duration
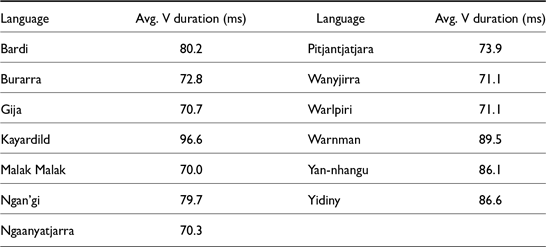
Consonant and vowel durations were extracted in milliseconds (ms). All duration measurements reported here are log normalized. For measurements of vowel duration, outliers shorter than 30 ms and longer than 200 ms were excluded from the analysis. Table 1 gives the average durations for vowels in each language. Vowel durations between 70 and 100 ms are typical of spontaneous speech, which is generally more compressed and less precise than elicited speech (DiCanio et al. Reference DiCanio, Nam, Amith, García and Whalen2015).
Average vowel durations, by language.

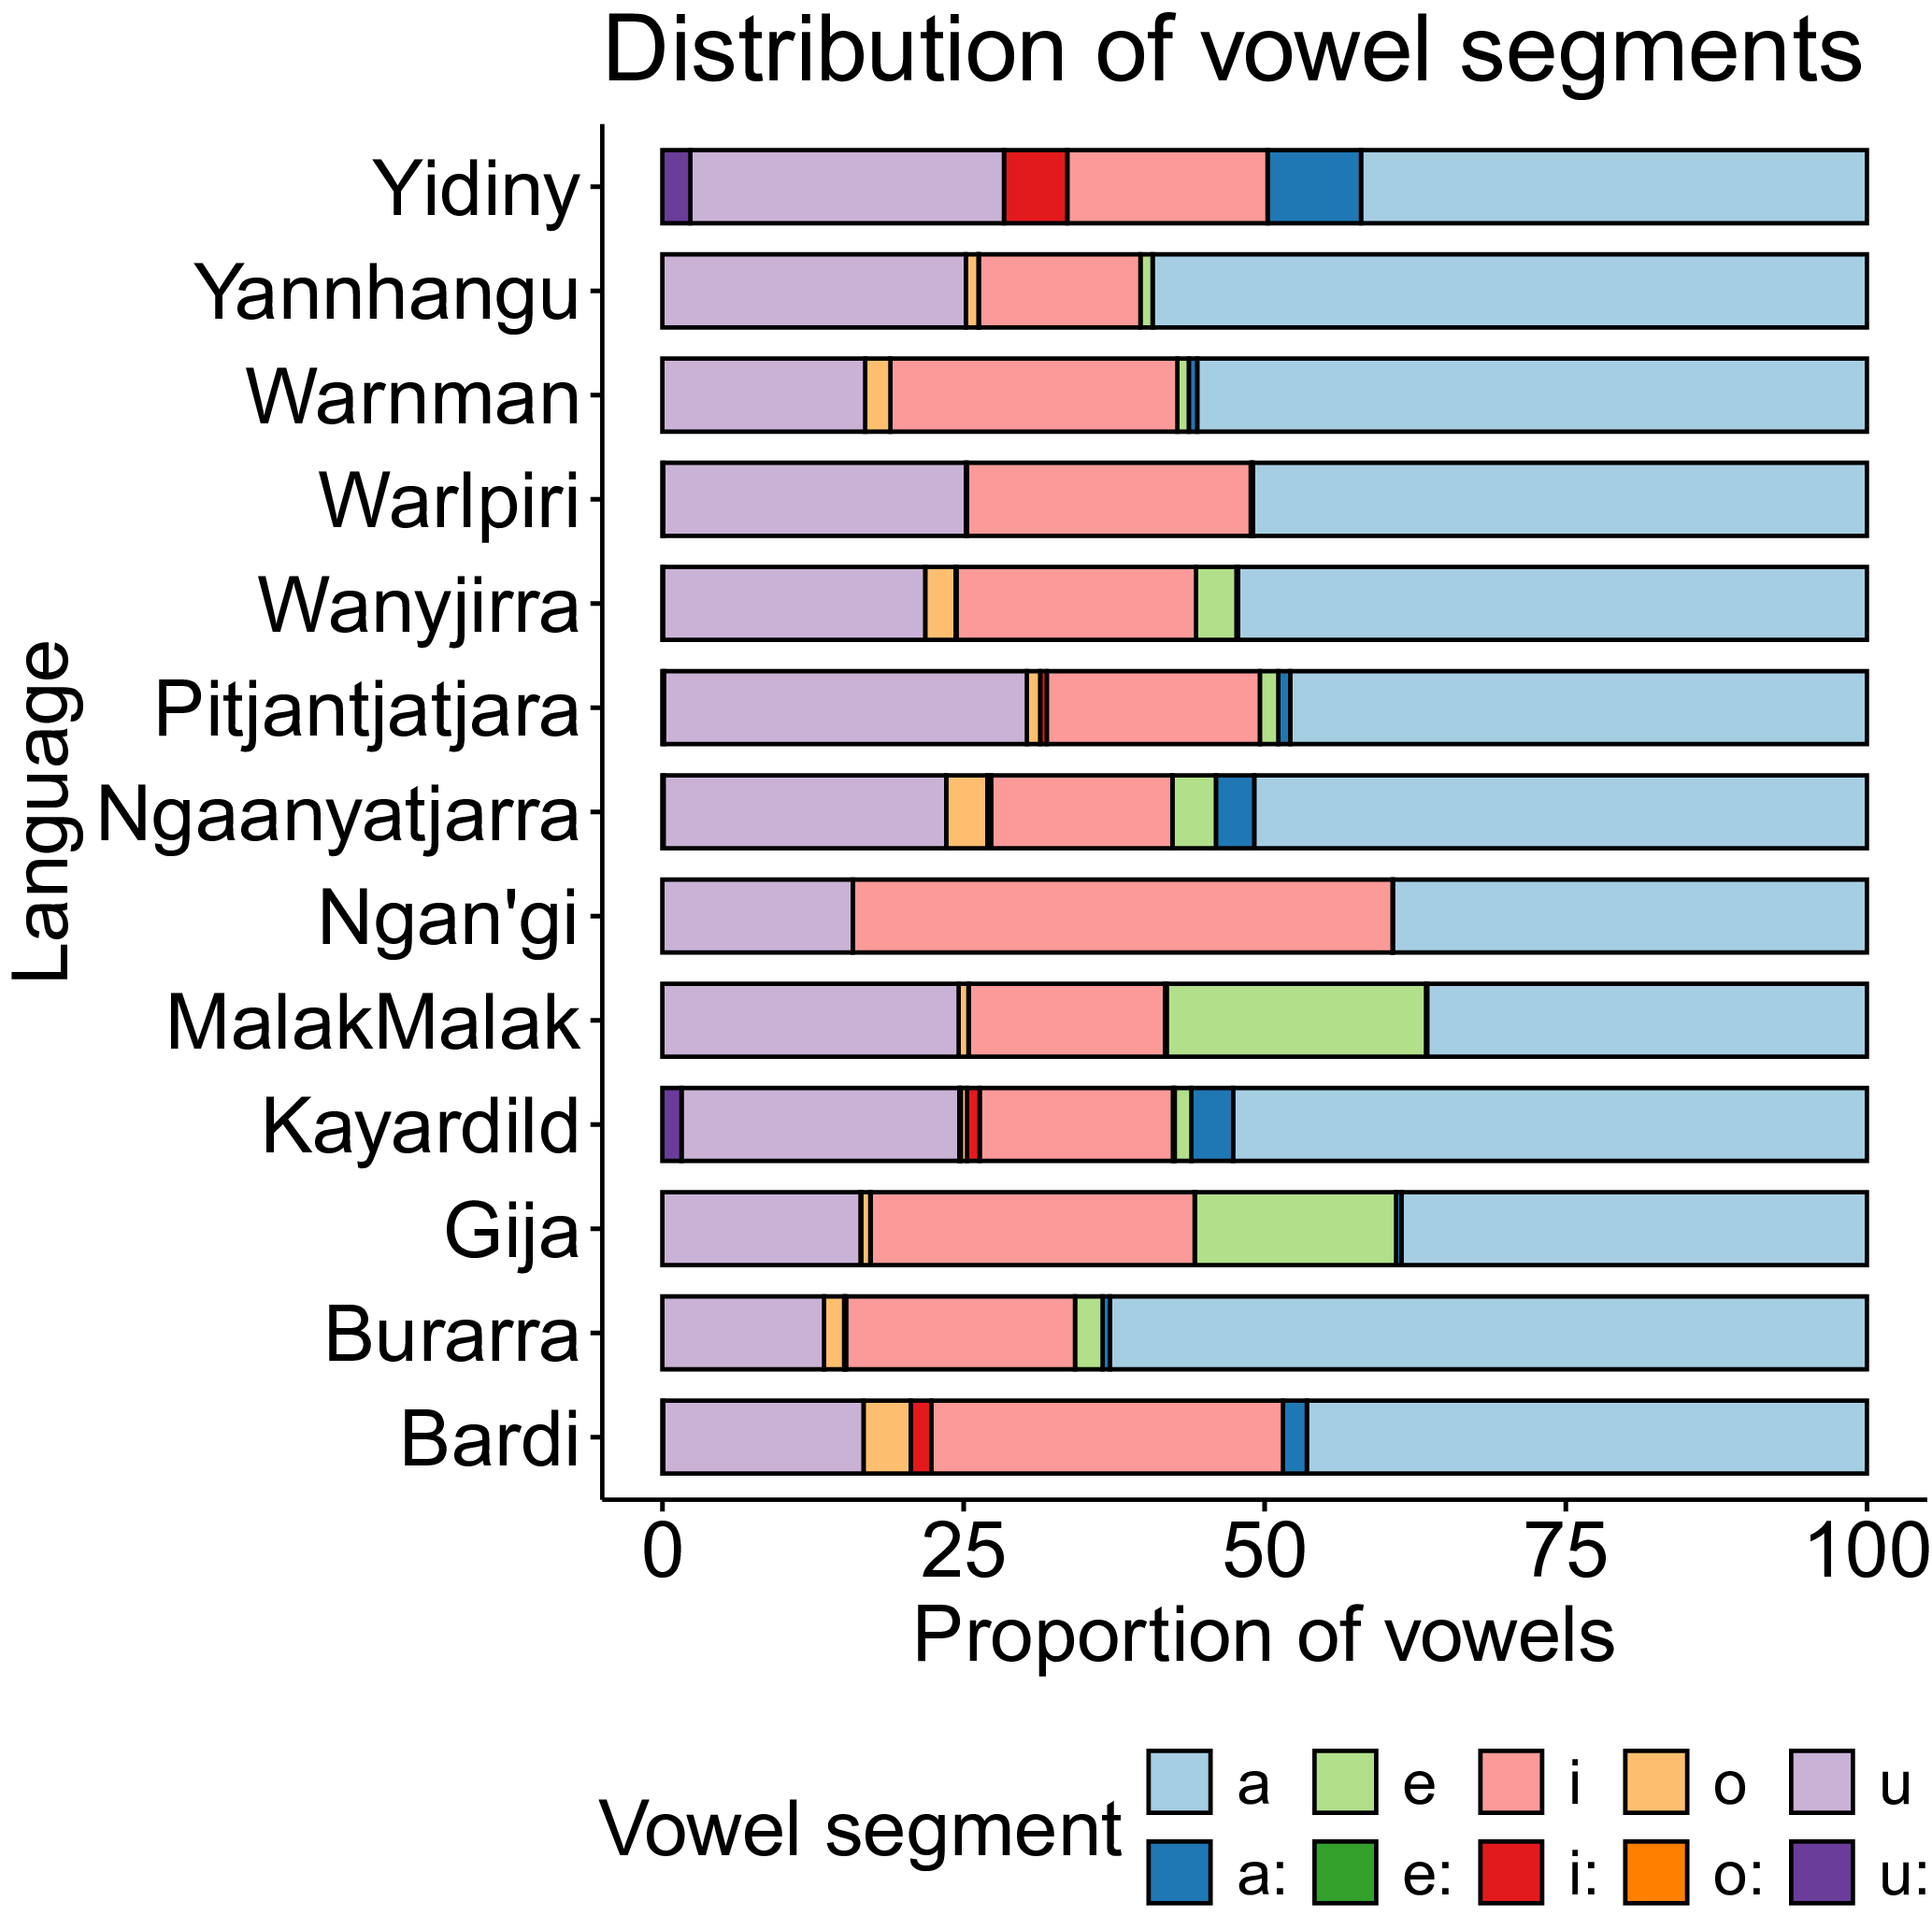
The distribution of vowel segments in Australian languages has been found in previous studies to be skewed toward /a/, with this segment often making up around half of all vowel segments and the remaining vowels (usually two, /i/ and /u/) making up smaller proportions (Tabain et al. Reference Tabain, Fletcher and Butcher2014; Billington et al. Reference Billington, Mansfield and Stoakes2022). This is also found to be broadly applicable to the languages in this study, as shown in Figure 3. The low vowel /a/ makes up at least 35% and up to 63% of vowel tokens in each language data set here.
Distribution of vowel segments as a proportion of total vowels, by language.

2.3.2. Intensity
Maximum and minimum intensity measurements were taken in decibels (dB). Maxima and minima were extracted for each vowel segment as well as each word. Amount of background noise, location of recording (e.g. indoors or outdoors), and distance between the speaker and the microphone all affect intensity measurements. While various normalization measures were considered, including relativizing the measure to the following vowel or to the maximum intensity of the word, the ultimate decision was to keep the raw dB measurements as input to the statistical models. The inclusion of a random intercept for each unique file in the regression model (see § 2.4) accounts for variation caused by the specifics of recording conditions during a particular field recording event.
2.3.3. Fundamental frequency (f0)
Maximum and minimum f0 measurements were taken in Hertz (Hz) for each vowel segment and each word in the corpus. These measurements were normalized to semitones using each speaker’s average pitch reading as the reference (cf. Zhang Reference Zhang2018). Measures used in the analysis include maximum f0 and f0 range across the vowel, both normalized in this way. Normalizing based on each speaker’s personal average f0 should mitigate effects of speaker gender, which is sometimes balanced and sometimes biased toward female speakers (cf. Appendix A), but the inclusion of speaker as a random intercept also accounts for differences across speakers.
2.3.4. Vowel formants
First and second formant measurements (Hz) were taken in Praat at the midpoint of the vowel. These measurements were then normalized using the average-spacing ΔF normalization method (Johnson Reference Johnson2020). This method was chosen for this study because of its cross-linguistic consistency and because it provides vowel extrinsic normalization that, unlike other methods of this sort, does not rely on ‘point’ vowels that are not uniform across languages and can make it difficult to compare normalized values in a typological study such as this one (cf. Fabricius et al. Reference Fabricius, Watt and Ezra Johnson2009; Lobanov Reference Lobanov2005; Nearey Reference Nearey1978). The values produced using this method are on the same measurement scale no matter the language, which makes differences across languages more directly comparable than they would be using other methods.
Vowel peripheralization is not a straightforward phonetic factor to measure. More peripheral high vowels have a lower F1, while more peripheral low vowels have higher F1, for example, and a similar trade-off relationship exists for F2 between front and back vowels. To determine a measure that can indicate a vowel’s distance from the center of the vowel space regardless of the direction of the distance (higher or lower, fronter or backer), Euclidean distance was calculated for each vowel token from the mean of the vowel space for each speaker in each language. The resulting absolute values are agnostic to the direction of the deviation from the center of the vowel space, only indicating distance. Along with this generalized measure, vowel quality must also be considered to account for average peripherality of each individual vowel in a language. This factor is included in the regression models as a random intercept of segment identity.
2.4. Statistical models for lexical stress
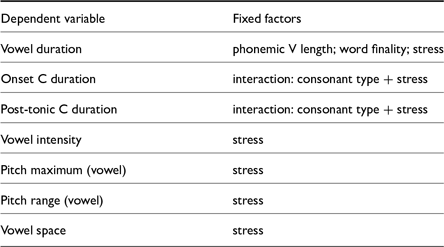
To determine the phonetic correlates of stress in each language, a series of mixed-effects linear regression models are run to investigate the relationship between stress status (0, unstressed, or 1, stressed) and the relevant acoustic measurement on its own terms. The potential acoustic correlates to stress that are considered are: vowel duration, f0 maximum, f0 range, intensity, vowel space, onset consonant duration, and post-tonic consonant duration (cf. Fletcher & Butcher Reference Fletcher, Butcher, Nordlinger and Koch2014; Jepson & Ennever Reference Jepson, Ennever and Bowern2023).
Stress correlates were determined for each language and each acoustic measurement individually. Mixed-effects linear regression models were run in R using the lmerTest package (Kuznetsova et al. Reference Kuznetsova, Brockhoff and Christensen2017) with the dependent variable being the acoustic measurement in question. This results in seven separate acoustic models for each language. Independent variables included random intercepts for speaker, file, phrasal position, word, and segment identity, and fixed effects of word finality and phonemic vowel length (when relevant), as well as the target factor, primary stress. Some factors were excluded from individual language models as determined by the result of a stepwise regression analysis implemented in ‘lmerTest’. In some cases, the fixed factor of interest (stress or word finality) does not contribute explanatory power to the acoustic model and is eliminated using this function, but these non-significant results are reported in § 3 and Appendix B for thoroughness. Random slopes were not included in these models, as they almost always resulted in singular model fits. Multicollinearity, one potential cause of these singular fits, was checked using Generalized Variance Inflation Factors (GVIF) (Fox & Monette Reference Fox and Monette1992) as implemented in the R package ‘car’ (Fox & Weisberg Reference Fox and Weisberg2019). GVIF values were consistently well below the commonly recommended thresholds for problematic collinearity across all models (Tomaschek et al. Reference Tomaschek, Hendrix and Harald Baayen2018). As multicollinearity did not seem to be the cause of singular model fits with random slopes, it was concluded that including random slopes was leading to overfitting in most cases, and slopes were therefore excluded from these models.
The fixed factors for each acoustic LMER model are summarized in Table 2. In the vowel duration models, a binary (0/1) factor ‘stress’ is included along with factors for phonemic vowel length, when applicable, and for word finality, which is another position in the word that may have some lengthening effects; both effects of stress and of word finality on vowel duration are presented in § 3. In the onset consonant and post-tonic consonant duration models, consonants were binned into categories based on manner of articulation: ‘stop’ (oral stops), ‘nasal’ (nasal stops), and ‘glide’, following Jepson et al. (Reference Jepson, Fletcher and Stoakes2019) and others who have observed different patterns across these consonant classes. This three-level factor was included as an interaction term with the ‘stress’ factor. To accurately present the difference between stressed and unstressed consonant types, the consonant duration results in § 3.3.3 and § 3.3.4 are presented as counterfactual comparisons of the interaction between consonant type and stress, where each estimate value indicates the difference in stressed and unstressed consonants of the same type.
Fixed factors in each acoustic LMER model.

In the remaining acoustic LMER models, ‘stress’ is the only fixed factor. This is coded as a binary (0/1) factor where the first syllable of each word is coded as 1. Words were orthographic words; while in some cases the phonological word may not be reflected in the orthography in this way, this should be a generally accurate metric for wordhood. The remaining independent variables in these models are random intercepts, which are shared across all of these models: segment, word, phrasal position, speaker, and file. These variables adjust intercepts as needed to account for intrinsic properties of segments, idiosyncratic variation in specific lexical items (including polysyllabic shortening), context in the phrase, and differences in speaker idiolects. Phrasal position was defined as position in the utterance as transcribed in the original archival materials; these are often, but not always, preceded and followed by a pause. In the absence of detailed knowledge of phrase structure in these languages, as well as the absence of linguistic descriptions of phrase structure across all languages equally, relying on the archival depositor’s judgment on grouping words into larger units serves as a standardized way to identify a phrase across the dataset. Phrasal position was coded as ‘initial’, ‘medial’, or ‘final’ and included as a random intercept in order to consider the overall effect of stress across phrasal positions while controlling for differences that are likely to be present.
To correct for multiple comparisons across models, measurements, and languages, Holm-Bonferroni correction was performed across all of these to adjust significance values taking the increased chance of Type I errors into account. In the results that follow, these adjusted p values are indicated with a star ( $\star$
) on figures as well as in the full model results in Appendix B.
$\star$
) on figures as well as in the full model results in Appendix B.
2.5. Limitations
The use of archival data and the inclusion of often under-described languages present several challenges, some of which can be addressed methodologically, and some of which are unavoidable. This section briefly addresses some of the limiting aspects of using archival data of this type.
2.5.1. Number of speakers
In four of the languages in this study, only one speaker is represented (see Appendix A). For three of these languages (Wanyjirra, Warnman, and Yannhangu), few or no speakers remain, and documentation is limited (Senge Reference Senge2016; Eberhard et al. Reference Eberhard, Simons and Fenning2021; Bowern Reference Bowern2007). Warlpiri is also represented by only one speaker, but this is a language that remains fairly robust today and has had relatively more documentation over the years; the sample used is what was accessible within the time frame of this project that consisted of narrative speech.
With only one speaker, the findings in this study may not be reliably generalizable to the language as a whole. Acoustic patterns that are unique to the speaker and patterns that are common across speakers cannot be teased apart in these cases. For this reason, the results presented for Wanyjirra, Warnman, Yannhangu, and Warlpiri are not as reliable as the results for the languages with multiple speakers, and these single-speaker results should be considered a working hypothesis of stress marking rather than a strong claim.
It is possible in each of these cases that additional narrative speech recordings exist that include speech from other speakers, and these materials could be relatively easily added to the existing data for a more robust analysis in the future. In the case of Warlpiri, new recordings of additional speakers may be made as well. In other cases, there is further audio documentation of these languages that is of a different speech type, such as elicitation, word list collection, or experimental data. Future analyses of these materials may serve as supporting or countering evidence for the stress correlates as presented in this study.
2.5.2. Data size
The audio materials in Warnman only consist of 428 vowel tokens, while the remaining languages have over 1,900 vowels and as many as 29,000 (see Appendix A). Dockum & Bowern (Reference Dockum and Bowern2018) investigated minimal data size requirements, finding that a data size of around 300–400 word tokens is sufficient for capturing the phonological diversity of a language. The Warnman data used here consists only of 131 word tokens and 428 vowel tokens, which is likely too small for reliable statistical estimation. Standard error estimates in § 3 reflect this, as Warnman has very large error estimates. Given the scarcity of data in Warnman specifically, the language was not excluded on this basis, but these limitations must be considered when interpreting these results.
2.5.3. Data variability
The use of archival fieldwork recordings raises a number of questions regarding the variability and quality of the data being analyzed. Fieldwork recording environments are often quite noisy, with background sounds, overlapping speech, and variation in the recording setup such as the speaker’s distance from the microphone. The linguists making these recordings used the best practices of their time, but some of the archival deposits used in this study include recordings that are decades old, when achieving high-quality audio recordings was substantially more challenging. Overall, however, any major disruptions to the integrity of the audio or mistakes in transcription would likely have been found during the manual correction process of the segment alignment, and measurement distributions were roughly what one would expect from spontaneous speech audio. In addition, variability that is consistent across one recording session (including differences in recording setup) is controlled for by including file name as a random factor in the statistical models.
Another question of variability is the potentially increased variability found in spontaneous, narrative speech as compared to elicited speech. Some of these factors can be controlled for in mixed effects modeling by including random effects for, e.g. word and segment, to avoid misleading effect estimates due to unbalanced data, and phrasal position, to adjust for contexts that are likely to have some prominence effects that should not be attributed to lexical phenomena.
3. Results
This section discusses the results of these LMER models; full summary results can be found in Appendix B.
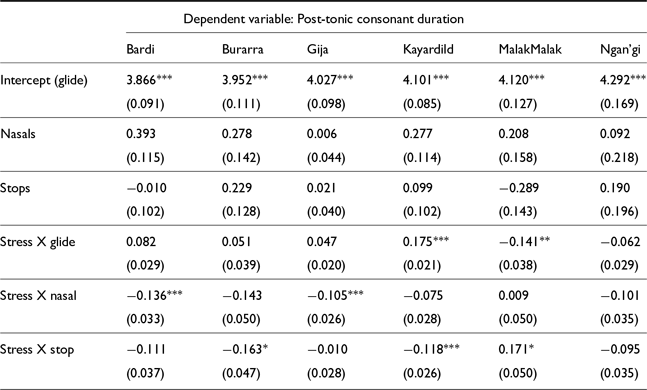
3.1. Intensity
Figure 4 shows the model estimates and standard errors for the factor ‘stress’ on the dependent variable, intensity (dB). Plots are split into two groups, Pama Nyungan and non-Pama Nyungan, to improve readability and comparability.
Vowel intensity model estimates and standard error values for binary factor ‘stress’ shown. Stars ( $\star$
) indicate significant results (
$\star$
) indicate significant results ( $p<0.05$
) after multiple comparisons correction.
$p<0.05$
) after multiple comparisons correction.

All languages saw a significant effect of stress on vowel intensity. However, the estimates for this effect are all quite small; the largest effect of stress on intensity is seen in Warlpiri, with an estimate of stressed vowels being 3.98 dB louder than their unstressed counterparts. It is generally thought that differences in intensity of around 1–2 dB are essentially imperceptible (Ortega-Llebaria & Prieto Reference Ortega-Llebaria and Prieto2011); for this reason, it is unlikely that intensity is a major cue to stress in any of these languages, with the possible exception of Warlpiri. Future work is needed to investigate the perceptual salience of these effects.
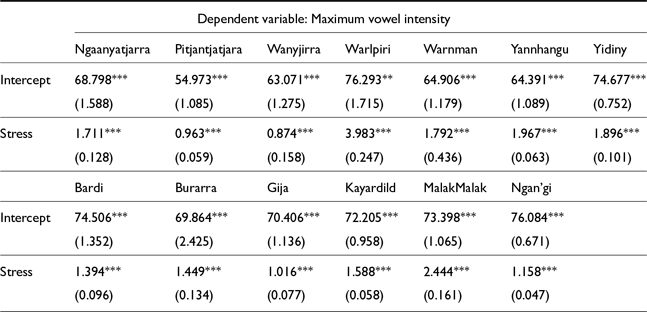
3.2. Fundamental frequency
Pitch (f0) peaks are very commonly correlated with stress, as Figure 5 shows. An increase of 1 semitone in stressed vowels corresponds to an increase in f0 of about 6%; most languages in this study have effects around this size, with the exception of Wanyjirra and Warnman, which have relatively more variable, and non-significant, results here. Yannhangu shows the strongest effect, with stressed syllables having a predicted 10% higher pitch maximum than unstressed syllables. These results are consistent with the previous claim that Australian languages frequently make use of f0 as a cue to initial stress (cf. Fletcher & Butcher Reference Fletcher, Butcher, Nordlinger and Koch2014, Tabain et al. Reference Tabain, Fletcher and Butcher2014; Jepson & Ennever Reference Jepson, Ennever and Bowern2023), and this claim seems to hold true in both Pama Nyungan and non-Pama Nyungan languages.
f0 maximum model estimate and standard error values for binary factor ‘stress.’

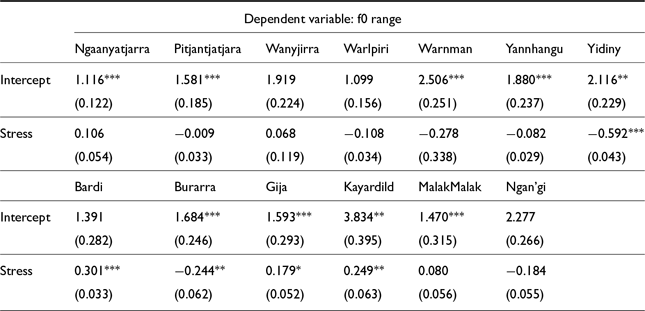
F0 peaks are not the only way that pitch can manifest as a cue to stress; f0 range—the difference between the minimum and maximum f0 values—can indicate changes in the shape of the pitch gesture that serve to mark a prominent vowel tonally. Figure 6 shows the effects found for stress on f0 range; most languages show no significant effect here, indicating that the shape of the tonal gesture does not change much in prominent syllables. In Bardi and Kayardild, f0 range is higher in stressed syllables, indicating a more extreme pitch excursion in prominent vowels. In Burarra and Yidiny, on the other hand, there are significant effects indicating a smaller f0 range in stressed syllables; this could indicate a steadier high tone on prominent syllables that varies less than in other contexts. However, any effects found here are relatively small, and it is not clear if strong conclusions can yet be drawn about the shape of pitch gestures.
f0 range model estimate and standard error values for binary factor ‘stress’ shown.

3.3. Duration
Here, all duration results are presented. First, the relationship between stress and vowel duration is presented in § 3.3.1; also relevant to vowel duration, word final lengthening is discussed in § 3.3.2. Then, results concerning the relationship between stress and consonant duration are presented in § 3.3.3 for onset lengthening and § 3.3.4 for post-tonic lengthening.
3.3.1. Vowel duration
Increased vowel duration is a common correlate of stress, as shown in Figure 7. Based on the logarithmic scale in duration values, an effect of +0.1 represents a roughly 10.5% increase in duration.Footnote 3 Most languages in this study, with the exception of Burarra, Wanyjirra, and Warnman, have a significant effect of stress on vowel duration. However, the magnitude of these effects varies by language. In four languages—Bardi, Malak Malak, Ngaanyatjarra, and Yidiny—the model predicts that stressed vowels will be around 20% longer on average, while the other languages show smaller effects.
Vowel duration model estimates and standard error values for binary factor ‘stress.’

These effect sizes may in some cases be too small to be meaningful. The average vowel durations shown in Table 1 (§ 2.3.1) are quite short, so that a 10% increase in duration may still be under 10 ms, generally considered to be the lowest perceptible difference in duration (Hirsh Reference Hirsh1959; Koffi Reference Koffi2018). The larger effects in Figure 7 may represent salient differences in duration, although perception studies would be needed to state this definitively.
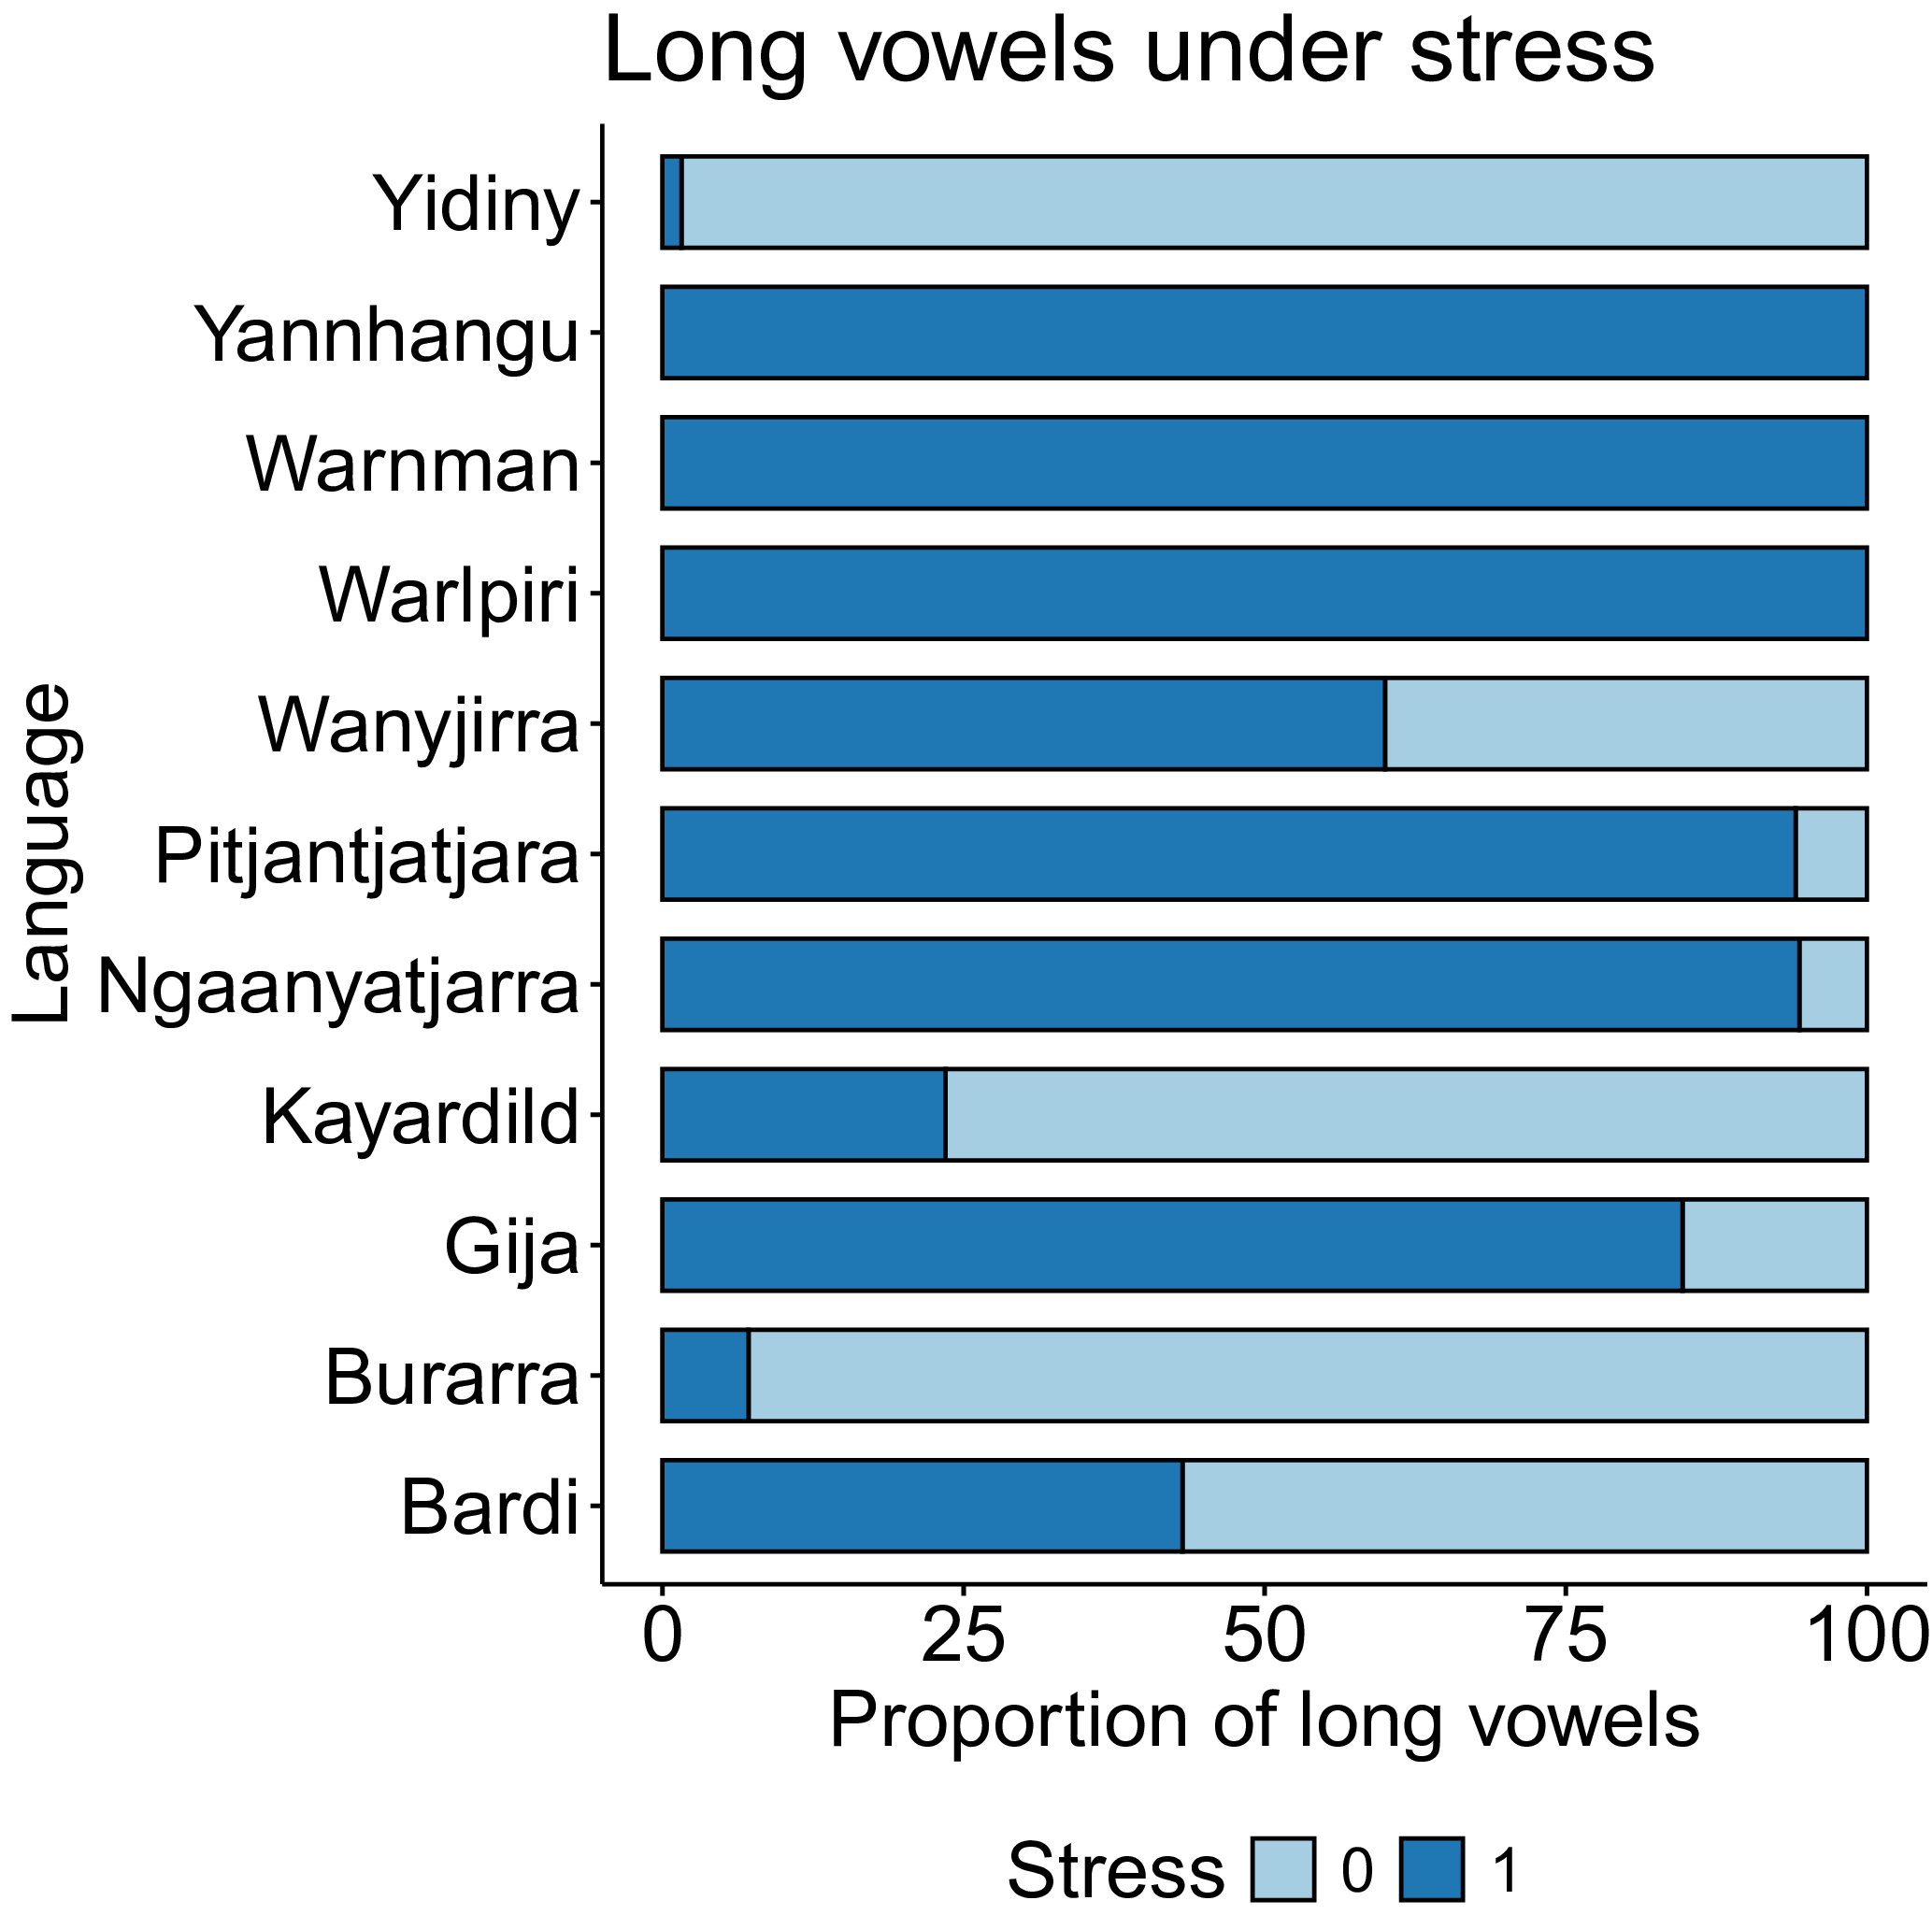
Another piece of the vowel duration puzzle in these languages is shown in Figure 8: in many of the languages with phonemically long vowels, most (and in some cases all) of them are stressed. In addition, long vowels are often infrequent overall, usually making up less than 5% of vowel tokens (cf. the distributions in Figure 3). This sort of distribution suggests some connection between vowel duration and stress, either by strengthening of vowel length in some stressed contexts, or by weakening of historically long vowels in unstressed syllables leading to the skewed distributions seen today.
Proportion of long vowels that are stressed and unstressed.

3.3.2. Word final lengthening
Languages often show increased duration in word final syllables, usually to mark word boundaries. As shown in Figure 9, almost all of the languages in this study show some effect of word final duration, except in the case of Warlpiri. Generally, word final vowels tend to be longer than non-final vowels. In fact, in many cases the effect of word final lengthening meets or even exceeds the effect of lengthening in stressed vowels. This is especially true for Warnman, which had no significant effect of stress on duration but shows a 43.6% increase in duration of word final vowels.
Vowel duration model estimates and standard error values for a binary factor indicating word finality.

Effects of word final lengthening exceed effects of stress on duration by at least a 5% margin in Wanyjirra, Warnman, Yannhangu, Yidiny, and Ngan’gi. Stress is a much stronger predictor of vowel duration in Warlpiri, Bardi, and Malak Malak, and in the remaining languages the two effects are within a 5% margin of difference from one another.
3.3.3. Consonant duration: onsets
Consonant duration results are presented for the interaction between manner of articulation and stress status in Figure 10. As has been noted for studies of onset lengthening in some Australian languages, in some cases only one or two of these consonant categories sees lengthening under stress, while other categories have no effect. This is true, for example, in Yidiny and Kayardild, which both have onset lengthening effects only in glide consonants and not in either stop series, although in Kayardild there is a very small significant effect in the oral stops. In both of these languages, glides that are the onset of a stressed syllable are lengthened by about 28%, compared to unstressed glide onsets. In Ngan’gi, on the other hand, oral and nasal stops see lengthening under stress while glides do not have any effect, and in Ngaanyatjarra there are lengthening effects in glides and oral stops but not nasals. Still, in other languages—Yannhangu, Pitjantjatjara, and Gija—consonants in all three categories see significant lengthening in stressed syllables.
Onset consonant duration model results, presented as counterfactual comparison of the interaction between consonant type and stress: each estimate represents the estimated difference between stressed and unstressed consonants of the relevant category.

3.3.4. Consonant duration: post-tonic
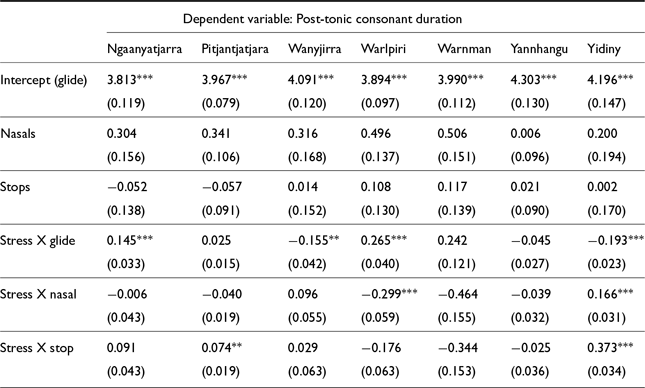
Post-tonic consonant lengthening was found to be less common than onset consonant lengthening, as Figure 11 shows. Only two languages, Ngaanyatjarra and Kayardild, had significant lengthening effects in consonants following a stressed vowel in all three consonant categories; however, in Kayardild the effect size for oral stops is quite small, while the other consonant types show post-tonic consonant lengthening of 15–30%. Effects were found only in oral stops in Yidiny and Pitjantjatjara, while in Warlpiri and Kayardild effects were only seen in glide consonants. In some cases, as with Yidiny glides or Ngan’gi oral and nasal stops, effects indicate shorter post-tonic consonants under stress, but this is an effect of the lengthened onset consonants as observed in Figure 10.
Post-tonic consonant duration model results, presented as counterfactual comparison of the interaction between consonant type and stress.

It is worth noting that effects of post-tonic consonant lengthening in previous studies of Australian languages have often found effects not for all words, but for words only of certain types or in certain positions in the phrase. In Djambarrpuyngu, for example, only disyllabic words show effects of oral stop lengthening (Jepson et al. Reference Jepson, Fletcher and Stoakes2019). It has also been found that in Warlpiri, consonant lengthening effects are more likely to occur in phrase-medial words; the role of phrasal position, while included in the regression models, is beyond the scope of this study and warrants more detailed analysis in future work.
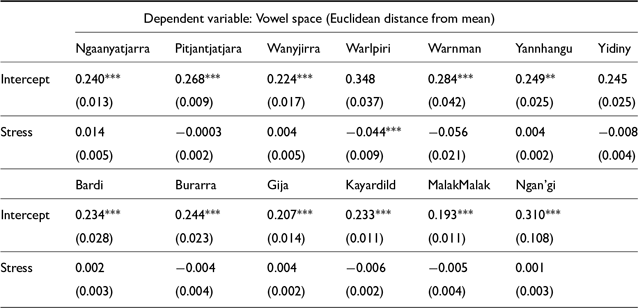
3.4. Vowel space
Effects of stress on vowel space were rare. Only in Warlpiri were differences in Euclidean distance from the mean significant, and the effect size (β = −0.044) is extremely small. The negative estimate value indicates that stressed vowels tend to be slightly closer to the mean than unstressed ones. This could perhaps indicate that unstressed vowels can be reduced so that they are further from a typical production of the vowel. A positive estimate here would indicate vowel peripheralization under stress, as is suggested for Ngaanyatjarra, though this effect was not found to be significant.
The results shown in Figure 12 are generally consistent with previous studies that have found some effects of vowel peripheralization in, e.g. high vowels, but no effects that are consistent across all vowels in the language. Future study might consider looking at individual vowels or vowel categories to investigate vowel space effects in more detail.
Vowel peripheralization model estimates and standard error values for binary factor ‘stress’ on the Euclidean distance from mean.

4. Summary and discussion
The correlates of word initial stress in these Australian languages show some major similarities, while also revealing points of substantial phonetic variation. A high f0 peak is found to correlate with stress in almost all 13 languages, regardless of historical relatedness; this supports the claim that has been made that f0 is the most common correlate of stress in Australia (Fletcher & Butcher Reference Fletcher, Butcher, Nordlinger and Koch2014). A similarly common correlate of stress was increased vowel duration, which has generally been considered less important in Australian languages in favor of consonantal phenomena (Pentland Reference Pentland2004; Butcher Reference Butcher, Harrington and Tabain2006; Jepson & Ennever Reference Jepson, Ennever and Bowern2023). In many of the languages in this study, stressed vowels were found to be 10−20% longer than unstressed vowels while taking phrasal position and word finality into account. Some of these durational effects are quite small and unlikely to be perceptually salient; the larger effects are more likely to be cognitively relevant for speakers, though perceptual studies are needed (when possible). In some of these languages, vowel lengthening at the ends of words is greater in magnitude than vowel lengthening under stress, but in other languages the opposite is true. While it may be tempting to conclude that the larger of these two effects is necessarily the more salient in speakers’ minds, it is just as probable that both effects exist perceptually and are relevant for word recognition and for word-level prominence, just as in many of these languages vowel duration can also mark phonemic vowel length.
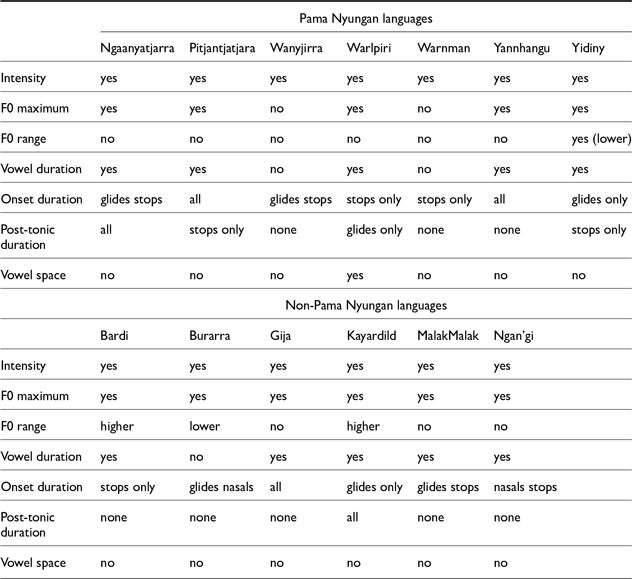
Somewhat less common were the effects of consonant lengthening that are often cited as a hallmark of stress marking in Australian languages. Among these results, we in fact see a substantial difference in the presence of these effects in Pama Nyungan versus non-Pama Nyungan languages. Almost all languages in this study show some effect of onset lengthening in stressed syllables, although in non-Pama Nyungan languages the effect sizes tend to be smaller. When it comes to post-tonic consonant lengthening, on the other hand, about half of Pama Nyungan languages have some effect, while only one non-Pama Nyungan language (Kayardild) shows a substantial lengthening effect in post-tonic consonants. Post-tonic consonant lengthening in particular is used as evidence for the ‘Place of Articulation Imperative’ put forth in Butcher (Reference Butcher, Harrington and Tabain2006), which states that Australian languages prefer a VC(V) phonological structure over CV(C) in order to maximize the salience of place of articulation contrasts, as these are often partially neutralized in word-initial position. This tendency can, as in the case of the Pama Nyungan language Arrernte, lead to the weakening and deletion of word-initial consonants as well as the strengthening of intervocalic consonants (Breen & Pensalfini Reference Breen and Pensalfini1999). The Place of Articulation Imperative suggests that these languages will mark intervocalic consonants as more salient in some way, and one of these strategies is to increase duration. Based on the sample of languages in the present study, it may be that these consonantal phenomena are more prevalent among Pama Nyungan languages specifically and are not as common in other languages of Australia. However, as onset consonant lengthening was found to be more common than post-tonic consonant lengthening overall, these effects do not themselves provide strong evidence for the Place of Articulation Imperative.
Table 3 presents a broad overview of all effects found across the languages in this study. While vowel space results were quite small overall, it is perhaps notable that only Pama Nyungan languages show any effect; further work into vowel peripheralization and centralization is needed to determine if these small effects reflect changes in only some vowel segments and not others. In another tenuous grouping based on small effect sizes, all Pama Nyungan languages that have an effect of stress on F0 range show a lower range in stressed vowels, indicating a more plateau-like pitch excursion than unstressed vowels. In non-Pama Nyungan languages, on the other hand, languages vary in whether they have lower or higher F0 range in stressed vowels. Both of these generalizations, while in need of further investigation, potentially point to some commonalities in Pama Nyungan languages.
Overall summary of potential stress-related effects, by language. Note that all effects are included here; the magnitude of these effects may vary.

A more striking pattern seen in Table 3 is that Pama Nyungan languages more often show post-tonic consonant lengthening in at least one consonant category. Only Kayardild has any post-tonic consonant lengthening, in glides only. It is also notable here that nasal consonants are rarely lengthened in onset or post-tonic contexts under stress, unless all consonants undergo lengthening.
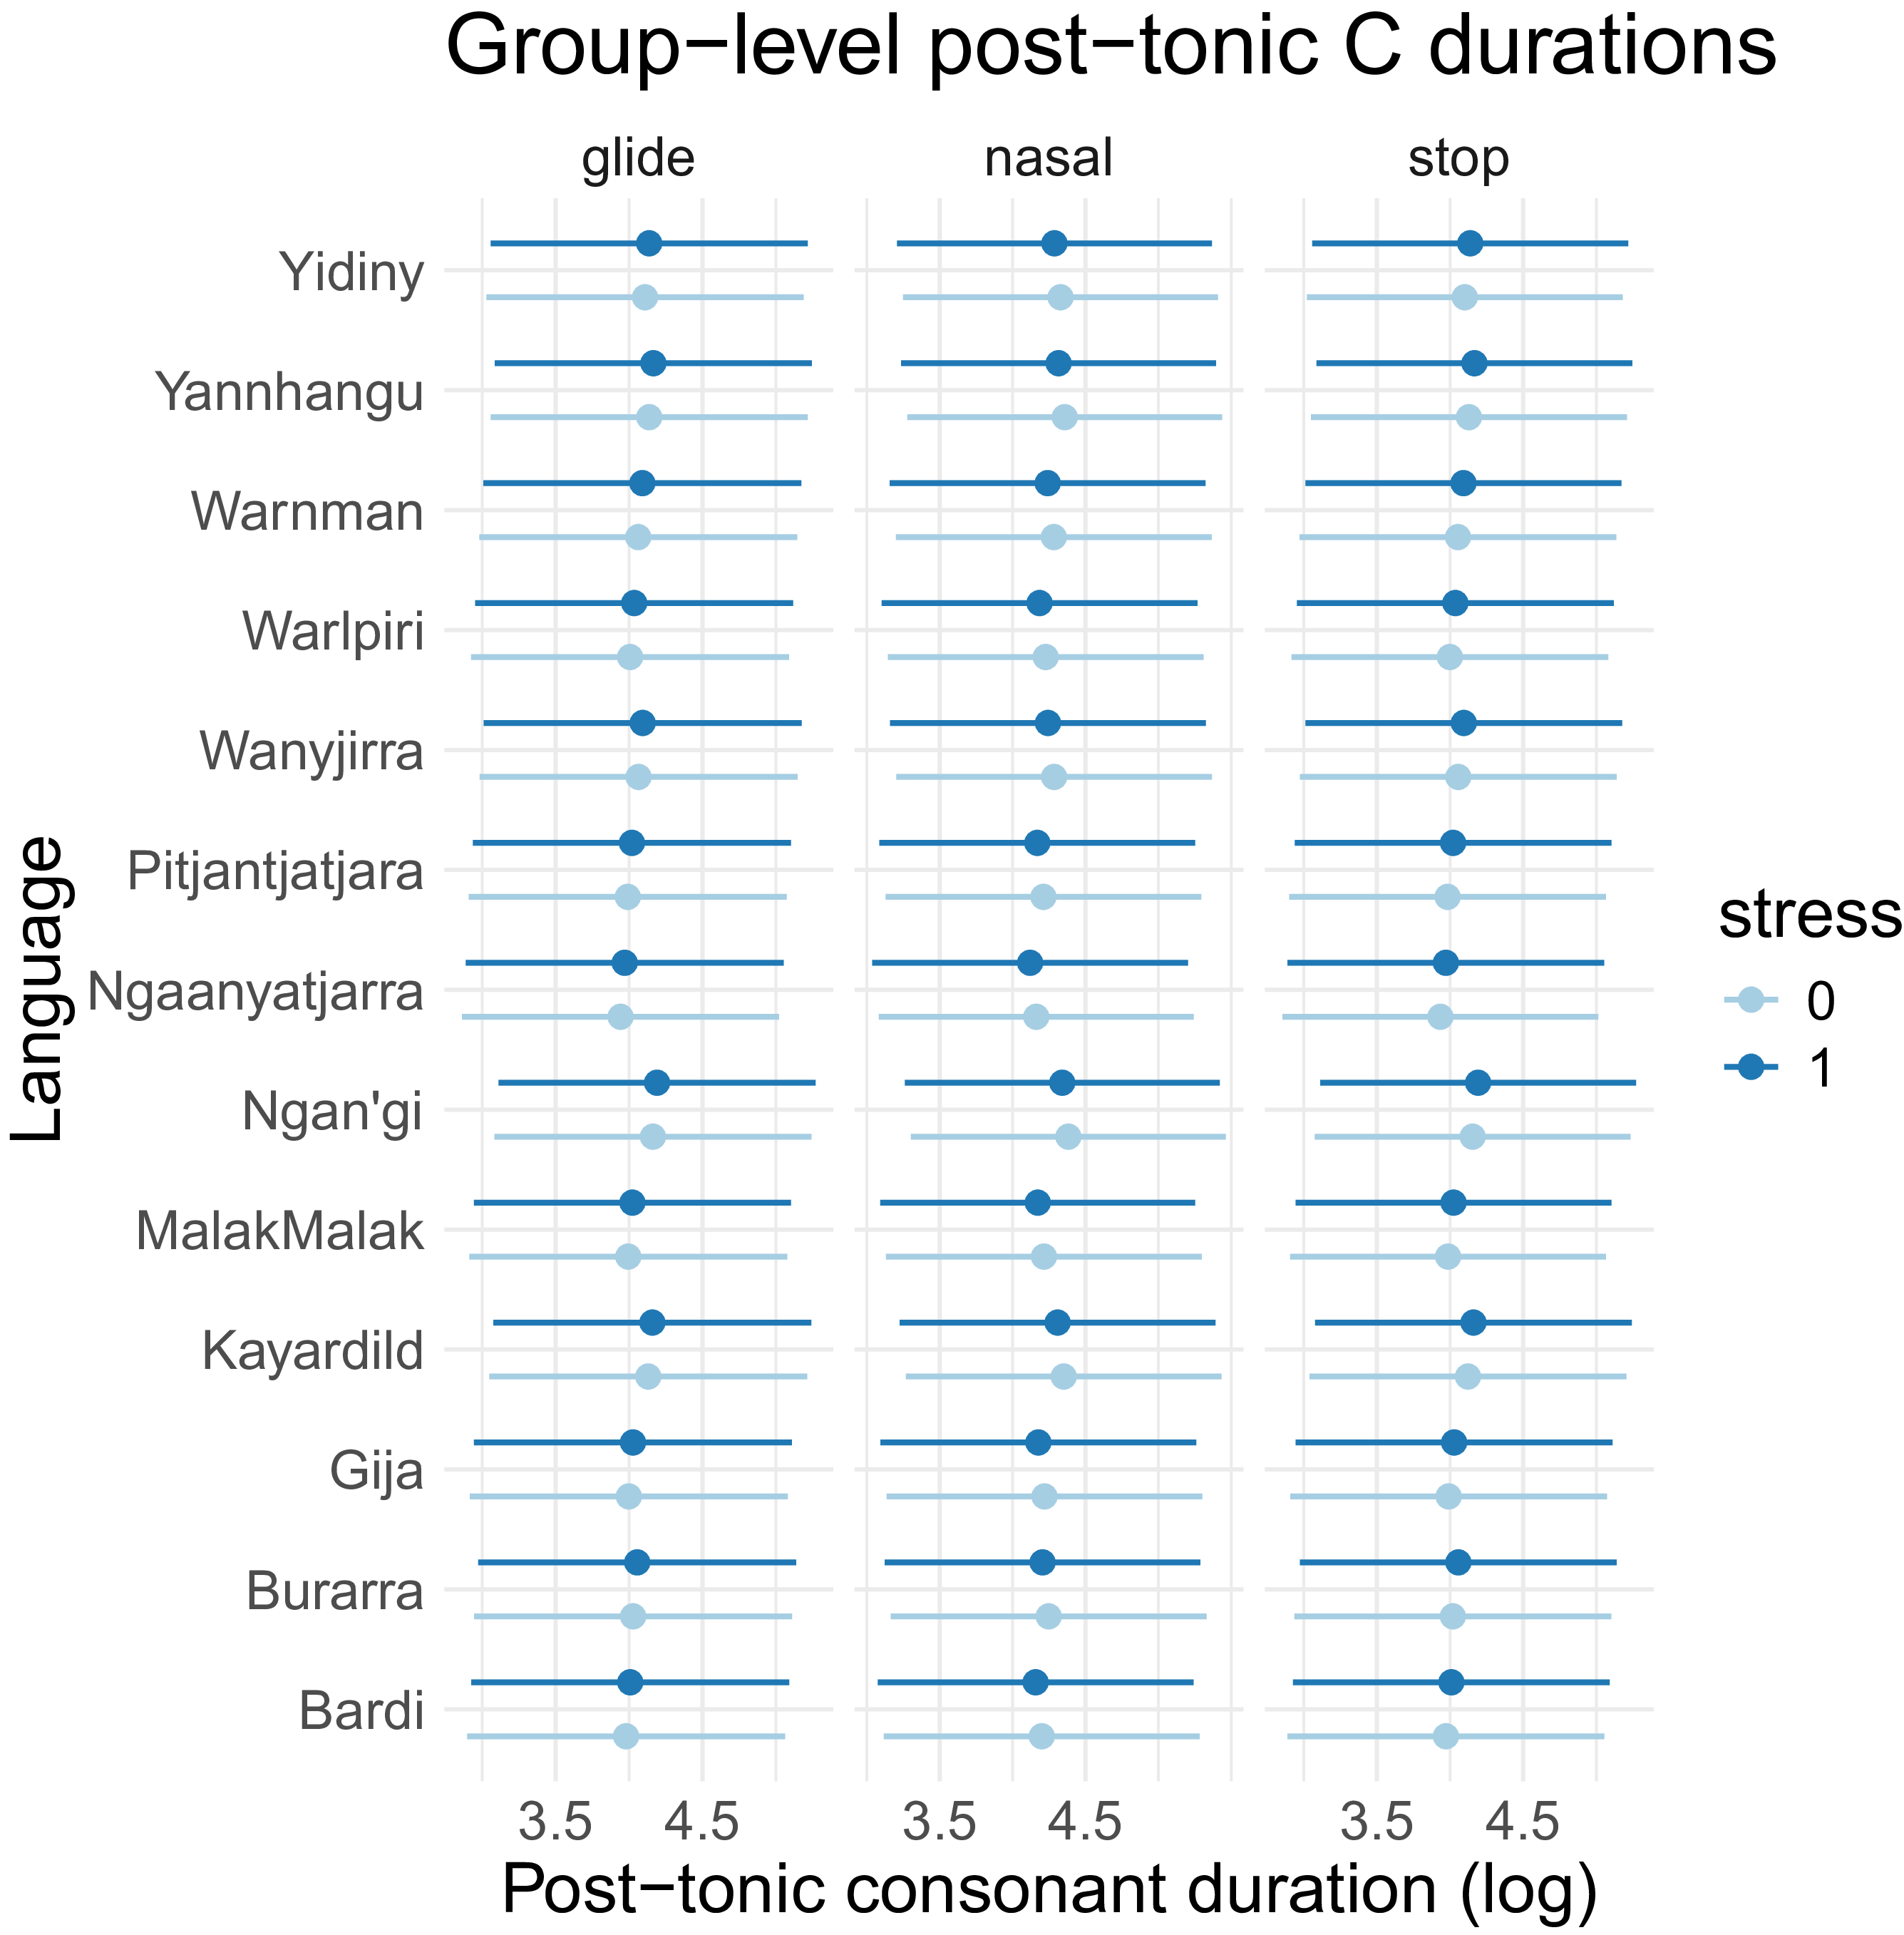
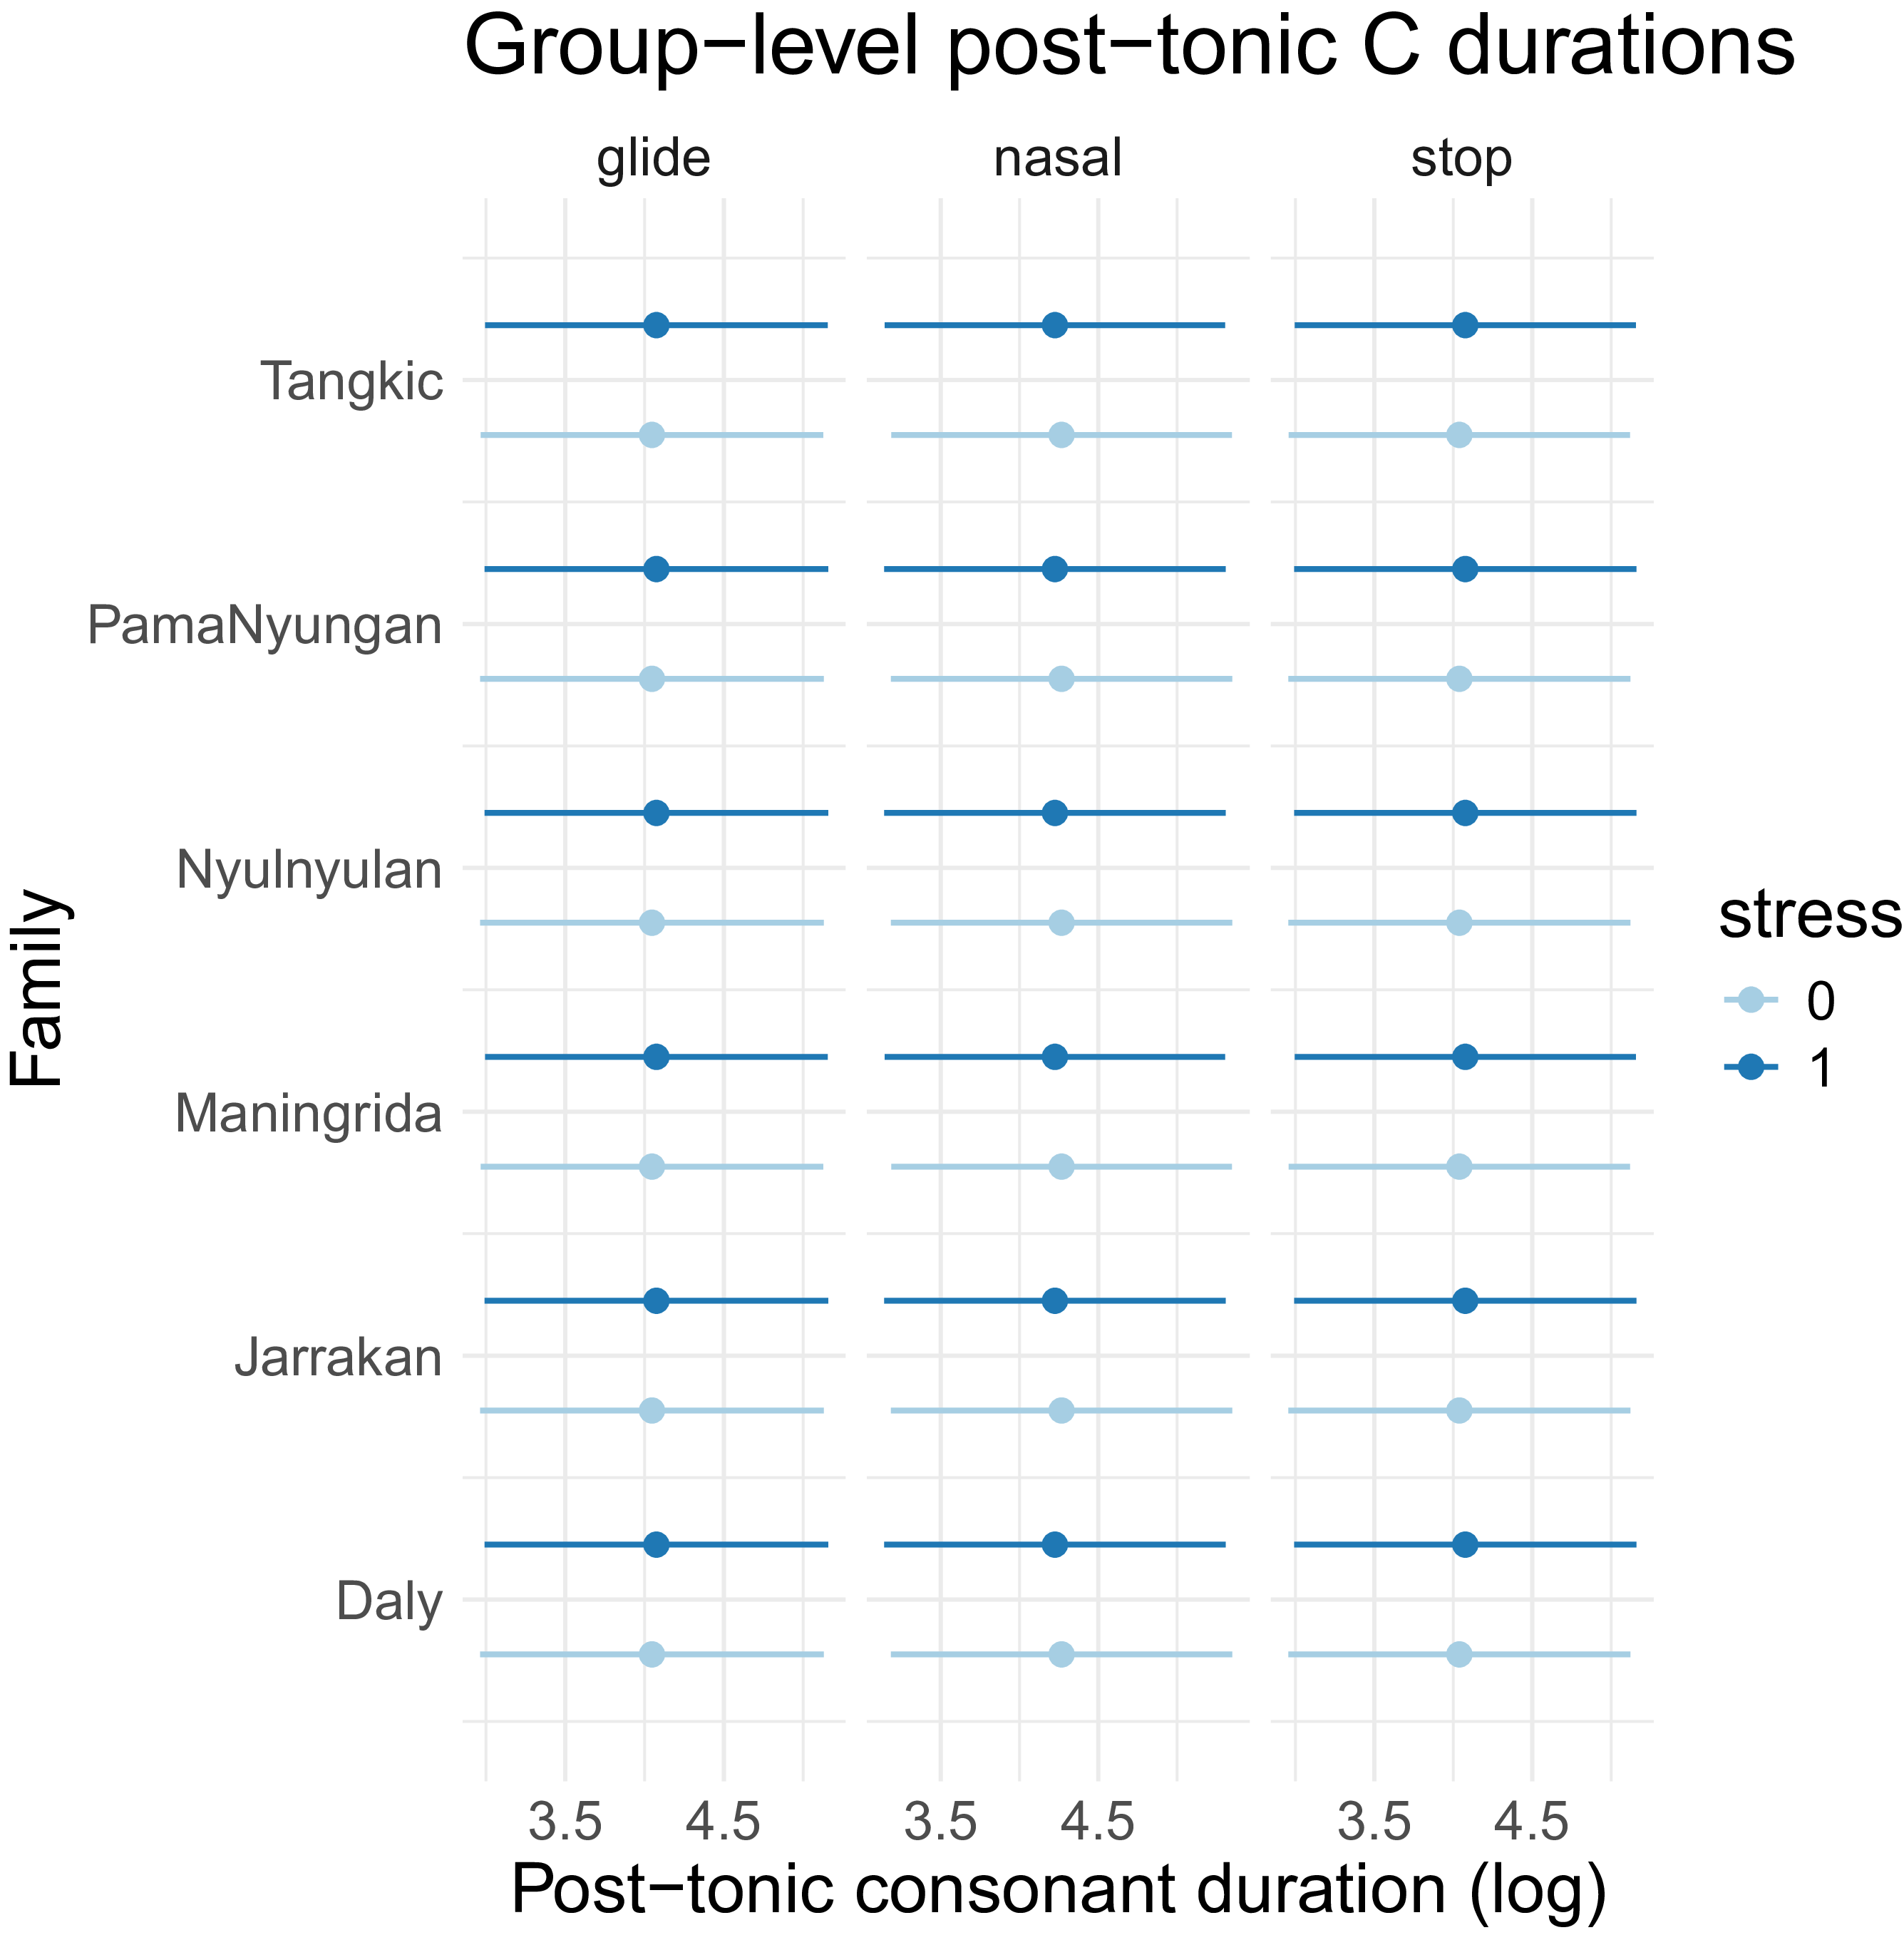
As a first attempt to quantify cross-linguistic differences more directly, group-level models were run on all language data, with random effects of both language and family, for post-tonic consonant duration, which qualitatively shows the most distinction between Pama Nyungan languages as separate from the non-Pama Nyungan languages in this study; the results across languages and families are shown in Figures 13 and 14, respectively. While the random effect of language was found to improve the model based on a stepwise regression analysis, language family did not improve the model, and predicted estimates across family were not found to differ very much. When considering family-level similarities and differences, however, perhaps considering only one acoustic feature at a time is not the appropriate metric. If related languages do indeed mark stress in similar ways that distinguish them from unrelated languages, this would apply across the constellation of acoustic features that can indicate prominence. For this reason, the modeling structure used here may not be the best approach to looking at family-level patterns directly. A more detailed study of variation in stress marking is needed that considers the population structure of multiple phonetic cues to stress at once to determine these higher-level patterns.
Predicted values of post-tonic consonant durations by stress, grouped by language.

Predicted values of post-tonic consonant durations by stress, grouped by language family.

The summary of results in Table 3 generally fit with the cross-linguistic patterns of stress marking found in Gordon & Roettger (Reference Gordon and Roettger2017)’s study, which found that vowel (and to a certain extent, onset consonant) lengthening was common, as was increased f0; on the other hand, measures of vowel space were generally small and/or limited. It seems, based on relative effect sizes, that f0 is the strongest cue to stress in these languages, or at least that high f0 is a stronger cue than lengthened vowels, a pattern that was also common in about half of the languages in which it was considered in Gordon & Roettger (Reference Gordon and Roettger2017)’s survey. The strength of these f0 effects also provides supporting evidence for the generalization that has been made about Australian languages (Fletcher & Butcher Reference Fletcher, Butcher, Nordlinger and Koch2014; Jepson & Ennever Reference Jepson, Ennever and Bowern2023).
While this study controlled for some common phrasal effects in its modeling by adjusting for initial, medial, and final phrasal positions, it did not address the question of whether word-initial f0 peaks are indeed cues to lexical stress rather than an edge-marking prosodic phenomenon that operates on the word level. To investigate whether the fixed, word-initial prominence patterns in these languages, which have generally been analyzed as lexical stress in the Australianist literature, should be considered a stress system rather than a more general system of word-boundary marking, a much more detailed study of f0 contours and alignment is needed, a task which I leave for future work.
This study provides the first phonetic typology of stress in Australian languages. The corpus phonetics methods used serve as an example of practical implementation of the type of broad comparative study suggested in Seifart (Reference Seifart2021) and others. Advances in automatic text-audio alignment and increasing archival language resources have contributed to the growing popularity of corpus phonetics studies and make cross-linguistic work such as this more feasible. The present study has made use of archival field recordings to study the phonetics of stress in naturalistic speech on a large scale, creating a phonetic corpus in the process which can be used for additional corpus phonetic study in the future.
Acknowledgments
I am extremely grateful to the fieldworkers whose archived recordings and transcriptions served as the basis of this analysis, and to the speakers and communities who chose to share their language. Many thanks also to those who contributed to the manual alignment correction process, namely Jeremiah Jewell, Shayley Martin, Ronnie Rodriguez, Rikker Dockum, and Claire Bowern. Thank you to all who have provided feedback at various stages of this project, especially Claire Bowern, Jason Shaw, Doug Whalen, and Natalie Weber, and to anonymous reviewers for their helpful comments.
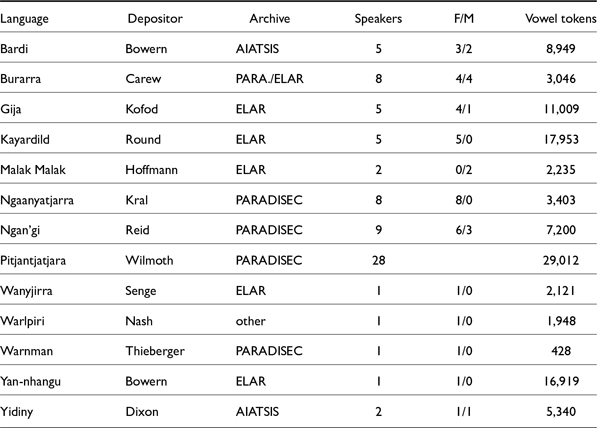
Appendix A. Language metadata
An overview of the languages in this study, their archival source, the archival depositor, number of speakers and vowel tokens is summarized in Table A1. For further information about these materials, refer to the original deposit, cited in full in the Bibliography.
Archival collections & languages included in the corpus.

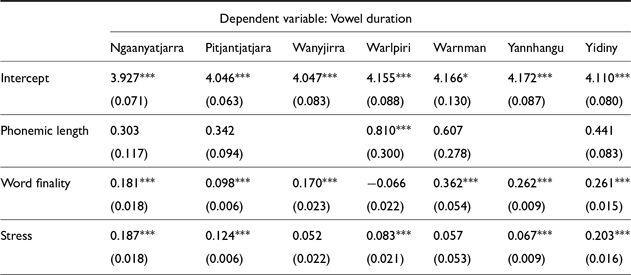
Fixed effects for vowel duration LMER models in Pama Nyungan languages. Note that phonemic length was not included for languages without long vowels and in some cases was eliminated in stepwise regression. (Holm-Bonferroni corrected significance values: * p<0.1; ** p<0.05; *** p<0.01)

Appendix B. Full model results
B1. Maximal models
Below are the maximal LMER models for each acoustic measure considered in this study. Each language’s model started with these maximal models, and independent variables were eliminated using stepwise backward regression.
Maximal vowel duration model
V duration ∼ (1|segment) + (1|word) + (1|phrasal.position) + (1|speaker) + (1|file) + phonemic.length + word.finality + stress
Maximal onset conosonant duration model
Onset C duration ∼ (1|vowel.segment) + (1|word) + (1|phrasal.position) + (1|speaker) + (1|file) + consonant.type:stress
Maximal post-tonic consonant duration model
Post-tonic C duration ∼ (1|vowel.segment) + (1|word) + (1|phrasal.position) + (1|speaker) + (1|file) + consonant.type:stress
Maximal vowel intensity model
V intensity ∼ (1|segment) + (1|word) + (1|phrasal.position) + (1|speaker) + (1|file) + stress
Maximal vowel F0 model
Max. f0 ∼ (1|segment) + (1|word) + (1|phrasal.position) + (1|speaker) + (1|file) + stress
Maximal F0 range model
F0.range ∼ (1|segment) + (1|word) + (1|phrasal.position) + (1|speaker) + (1|file) + stress
Maximal vowel space model
Vowel.space ∼ (1|segment) + (1|word) + (1|phrasal.position) + (1|speaker) + (1|file) + stress
B2. Model results
The following tables B1–B10 give summary model results for all of the LMER models, sorted by dependent variable.
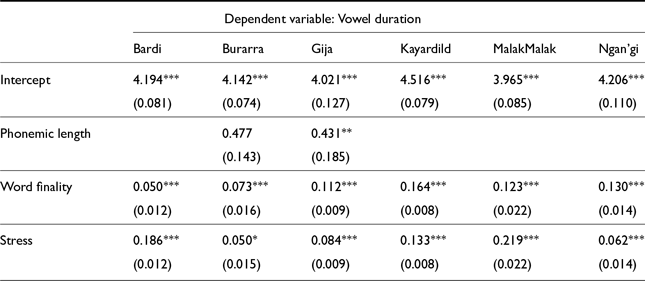
Fixed effects for vowel duration LMER models in non-Pama Nyungan languages. Note that phonemic length was not included for languages without long vowels and in some cases was eliminated in stepwise regression. (Holm-Bonferroni corrected significance values: * p<0.1; ** p<0.05; *** p<0.01)

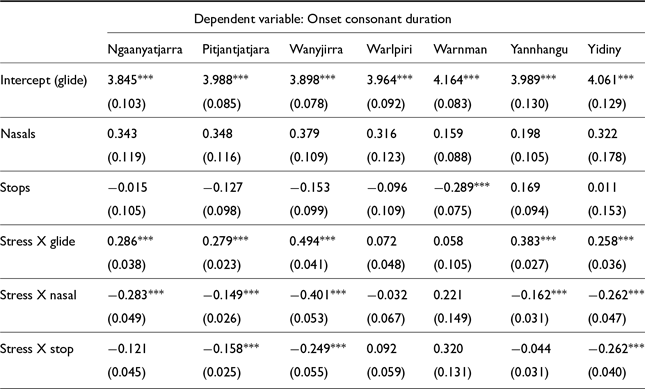
Fixed effects for onset consonant LMER models in Pama Nyungan languages. (Holm-Bonferroni corrected significance values: * p<0.1; ** p<0.05; *** p<0.01)

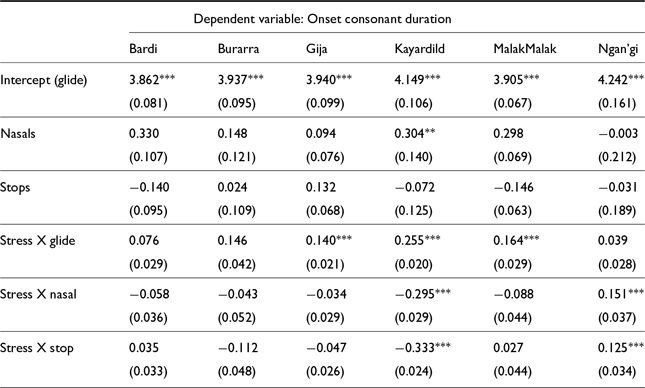
Fixed effects for onset consonant LMER models in non-Pama Nyungan languages. (Holm-Bonferroni corrected significance values: * p<0.1; ** p<0.05; *** p<0.01)

Fixed effects for post-tonic consonant LMER models in Pama Nyungan languages. (Holm-Bonferroni corrected significance values: * p<0.1; ** p<0.05; *** p<0.01)

Fixed effects for post-tonic consonant LMER models in non-Pama Nyungan languages. (Holm-Bonferroni corrected significance values: * p<0.1; ** p<0.05; *** p<0.01)

Fixed effects for vowel intensity LMER models in Pama Nyungan languages (top) and non-Pama Nyungan languages (bottom). (Holm-Bonferroni corrected significance values: * p<0.1; ** p<0.05; *** p<0.01)

Fixed effects for maximum F0 LMER models in Pama Nyungan languages (top) and non-Pama Nyungan languages (bottom). (Holm-Bonferroni corrected significance values: * p<0.1; ** p<0.05; *** p<0.01)

Fixed effects for F0 range LMER models in Pama Nyungan languages (top) and non-Pama Nyungan languages (bottom). (Holm-Bonferroni corrected significance values: * p<0.1; ** p<0.05; *** p<0.01)

Fixed effects for vowel space LMER models in Pama Nyungan languages (top) and non-Pama Nyungan languages (bottom). (Holm-Bonferroni corrected significance values: * p<0.1; ** p<0.05; *** p<0.01)


 Open access