


Sugar-sweetened beverages (SSB) contribute to weight gain and poor health. Reducing SSB consumption in randomised controlled trials decreases energy intake and BMI(Reference Ebbeling, Feldman and Osganian1). SSB consumption is positively associated with energy consumption, weight gain, overweight and obesity, and type-2 diabetes(Reference Ludwig, Peterson and Gortmaker2, Reference Schulze, Manson and Ludwig3). Levying a tax on SSB has been proposed as a strategy to reduce their consumption, and thereby reduce energy intake and ultimately obesity(Reference Brownell and Frieden4). SSB consumption displaces healthy dietary elements and leads to poor diet quality, and decreasing SSB consumption reduces overall energy intake(Reference Harnack, Stang and Story5, Reference Leahy, Birch and Rolls6). We evaluated the relationship between energy availability from SSB and total energy availability from food availability data in Canada collected over 30 years.
Methods
Data source
The Canadian Socio-Economic Information Management System (CANSIM) is Statistics Canada’s computerised database of time series covering a wide area of the social and economic aspects of Canadian life(7). The CANSIM database includes information on a variety of topics such as national accounts, labour, manufacturing, construction, trade, agriculture and finance. Food availability information in the CANSIM database is based on food disappearance and accounts for wastage in production and storage. The data are not the energy consumed and do not account for wastage in the home. Data from 1976 to 2007 were used in these analyses(7).
Energy availability
Energy availability is obtained by multiplying the quantity of a food by its unit energy content. For instance, the total available servings of ice cream in a year are multiplied by the energy content of one serving. Total available energy is obtained by summing the available energy over all available foods. Average daily per capita available energy is determined by dividing the total available daily energy in any year by 365 and the estimated Canadian population on 1 July of that year.
Soft drinks
Information on sugar-sweetened soft drink availability in CANSIM is obtained from total domestic sales, as provided by the Canadian Soft Drink Association. The information collected for sugar-sweetened soft drink availability includes the energy content and volume sold in Canada in any year. Average daily per capita available energy from sugar-sweetened soft drinks is determined by dividing the total available daily energy in any year by the estimated Canadian population on 1 July of that year. Average percentage of energy from sugar-sweetened soft drinks is obtained by dividing the average daily per capita available energy from soft drinks by the average daily per capita energy for each year.
Juices
Information on grapefruit, grape, lemon, orange and pineapple juice availability is obtained from the import and export data available from the International Trade Division of Statistics Canada. In the case of apple and tomato juices, information on production and stocks is available from the Manufacturing, Construction and Energy Division of Statistics Canada.
Alcoholic beverages
Estimates of availability were made from sales data provided by the Canadian Brewers’ Association for beer, by the Association of Distillers for liquor and by the Canadian Wine Institute for wine. Data based on sales from the Public Institutions Division of Statistics Canada were used to update these preliminary figures.
Statistical methods
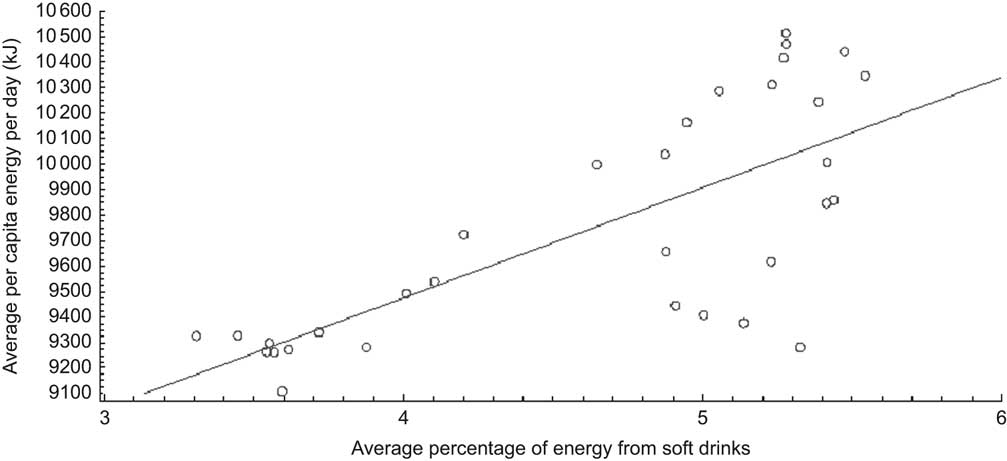
Average daily per capita available energy and average percentage of energy from sugar-sweetened soft drinks were computed. Average daily per capita available energy was plotted against the average percentage of energy from sugar-sweetened soft drinks in a scatter plot. A regression line was fitted with the average daily per capita available energy as the outcome and average percentage of energy from soft drinks as the predictor. SAS statistical software package version 9·0 (SAS Institute Inc., Cary, NC, USA) was used in the analysis.
Results
In 2007, the total available energy in Canada was 10 157 kJ (2429 kcal)/d per capita, of which approximately 13 % (1342 kJ (321 kcal)/d per capita) came from beverages and 4·6 % (464 kJ (111 kcal)/d per capita) from SSB. Between 1976 and 2007, there was an increase of 669 kJ (160 kcal)/d per capita in available energy, with 155 kJ (37 kcal)/d per capita in available energy from SSB and 59 kJ (14 kcal)/d per capita in available energy from juices.
There was a positive linear association between average total available energy and average percentage of energy from SSB. Total available energy was increased by 434 kJ (104 kcal)/d per capita for a one unit increase in average percentage of energy from SSB (Fig. 1).
Relationship between average per capita daily energy availability and percentage of energy (%E) from soft drinks (regression equation: average daily per capita energy = 7740+ 434 × average %E from soft drinks)
Discussion
Total available energy increased as the contribution of energy available from SSB increased. This increase was larger than that explained by energy availability from SSB alone. There are at least two plausible explanations for this finding. First, soft drinks are a marker of consumption of high-energy foods(Reference Bowman and Vinyard8). US adults who ate fast foods consumed twice as much energy from SSB and 15–22 % more energy overall(Reference Bowman and Vinyard8). Replacing SSB with diet beverages would still result in excess energy intake if this mechanism operated. Second, energy provided by SSB does not compensate for subsequent energy intake(Reference DiMeglio and Mattes9). This is consistent with the results of a crossover trial with ad libitum food consumption in which daily energy intake declined by 1629 kJ (389 kcal) in the group with less SSB(Reference Leahy, Birch and Rolls6). We can hypothesise, therefore, that reducing the energy available from SSB will reduce total available energy beyond that explained by SSB.
A limitation in the data of the present study is that energy availability is an ecological variable. The two main drawbacks of using ecological data are: (i) they could represent a characteristic of the environment not causally related to the outcome of interest; and (ii) they are aggregated at the community level, and do not represent individual behaviour. There are strong data indicating that SSB consumption increases overall energy intake and weight gain(Reference Malik, Schulze and Hu10). In a randomised control trial study, Chen et al. (Reference Chen, Appel and Loria11) showed that a 418 kJ (100 kcal) reduction in liquid energy resulted in a 0·25 kg weight loss at 6 months v. 0·06 kg for a 418 kJ (100 kcal) reduction in solid energy.
The association between beverage consumption and obesity has been questioned(Reference Drewnowski and Bellisle12). However, much of the data for these studies come from people consuming liquid meal replacements that are generally used for weight loss(Reference Drewnowski and Bellisle12, Reference Heymsfield, van Mierlo and van der Knaap13). As trying to lose weight is not a natural state for humans, these results might not be generalisable to free-living populations. Moreover, the studies were supported by the food industry, which tends to underestimate the contribution of SSB to poor health(Reference Vartanian, Schwartz and Brownell14).
Food availability has been shown to be correlated with individual intake in households and schools(Reference Fernandes15, Reference Naska, Oikonomou and Trichopoulou16). This is consistent with the emerging paradigm that contextual factors influence individual behaviour related to obesity, and that more available energy could lead to greater energy intake(Reference Kumanyika, Obarzanek and Stettler17).
There was more total energy available when the proportion of energy available from SSB was higher. This was larger than that explained by energy availability from SSB alone. Reducing energy from soft drinks may contribute to larger reductions in total energy available for consumption.
Acknowledgements
The present study was not supported by any funding. None of the authors had any competing interests. A.T.M. conceived the idea, participated in data analysis and wrote the paper. A.T. and F.P. collected and analysed the data, searched the literature and revised the manuscript.



