



Chronic kidney disease (CKD) is a condition in which kidneys are damaged, leading to loss of filtration capacity and the aggregation of excessive fluid and waste products in the blood(Reference Thomas, Kanso and Sedor1). The prevalence of CKD was less than 1 % of the population in 1990, but it increased up to 12 % in 2013, and it has now become a global health concern(Reference Bikbov, Purcell and Levey2). CKD is classified into stages 1–5 based on estimated glomerular filtration rate (eGFR)(Reference Levey, Coresh and Bolton3). Over time, progressive CKD can end up with irreversible end-stage renal disease (ESRD)(Reference Fox, Matsushita and Woodward4,Reference Fujii and Joki5) . ESRD patients have many co-morbidities affecting their quality of life. The main nutrition-related goals in CKD are slowing down the disease progress and attenuating uremic toxicity. Maintaining good nutritional status also lowers the risk of secondary complications, including CVD, anorexia, cachexia, bone disease, hyperlipidemia(Reference Thomas, Kanso and Sedor1), oedema, anaemia and hypertension(Reference Webster, Nagler and Morton6). Besides, there is an association between depression and reduced kidney function and increased mortality in these patients(Reference Wang, Liang and Zhu7,Reference Goh and Griva8) .
Medical nutrition therapy and medications are methods for controlling CKD. Medical nutrition therapy includes restriction in the intake of protein, Na, K, P and fluids(Reference Di Iorio, Di Micco and Marzocco9).Several studies have shown that restriction of protein and Na has a major role in controlling uremia and hypertension(Reference Bellizzi, Di Iorio and De Nicola10–Reference Kleinknecht, Salusky and Broyer12). Yet, altering the dietary pattern and lifestyle of CKD patients is a real challenge(Reference Banerjee, Liu and Crews13). A systematic review aiming to find benefits of multifactorial intervention (multi-nutrient or holistic approach to diet, lifestyle, etc.) practiced by dietitian on CKD suggested uncertain conclusion and called for more evidences(Reference Brown, Williams and Mafrici14). While no data have been published about the actual rate of CKD patient’s referral to dietitian in Iran or even globally, a French cohort study claimed that only 25 % of patients with CKD visited a nutritionist at least once. Despite compelling evidence for the effectiveness of dietary interventions in CKD, referral to dietitians may be limited(Reference Stengel, Metzger and Combe15).
Nutrition education can increase the patients’ adherence to the diet(Reference Morante, Sánchez-Villazala and Cutillas16–Reference Ebrahimi, Sadeghi and Amanpour18). However, no study has been conducted on assessing the efficacy of renal diet and nutritional education on CKD depression. Therefore, the present trial aims to assess the effect of renal diet therapy and nutritional education on eGFR, blood pressure (BP), malnutrition and depression among patients with CKD.
Methods
Study population
In this 24-week randomised controlled non-blinded trial, 120 CKD patients (stages 3 and 4) without co-morbidities (without diabetes, without heart failure and without dialysis) were selected from Shahid-Faghihi and Shahid-Motahari outpatient clinics affiliated to Shiraz University of Medical Sciences, in Iran. Recruitment of the patients was started in July 2019 and ended in August 2019. All 120 male and female patients with CKD were enrolled using block randomisation. The inclusion criteria were reduced renal function (15<eGFR < 60 (ml/min/1·73 m2)) and no change in the dosage of drugs during the past 6 months. Patients with infection, Alzheimer’s disease, AIDS, malignancy, diabetes mellitus, cancer, heart failure, impaired cognitive function or mental disorders, those on dialysis, those with rejected kidney transplants, pregnant women, and the patients who were planning to become pregnant were excluded from the study. Being unwilling to participate in the study, being on any type of diet over the past month, and showing an acute decrease in eGFR were the other exclusion criteria.
A sample size of fifty-three patients per group was calculated based on eGFR (as primary outcome) with mean (±sd) value of 8·51 ± 15·78 (ml/min/1·73 m2) and considering the power of 80 % and α = 0·05, according to a similar study(Reference Chen, Tsai and Sun19). After considering the 10 % dropout in participants, the study sample size was estimated as 120 patients (sixty patients in each group). Block randomisation method was done using online software applications, given a four sequences block size with thirty possible block combination of A or B, to assign participants to either group A or B. Eventually, sixty participants in each group were determined randomly according to the specified sequence(20).
Before the beginning of the study, the research methodology was explained to the participants and their informed consent forms were obtained. Moreover, the patients were ensured that their information would remain confidential in case they were not willing to continue the study. All participants were examined by a nephrologist and a renal dietitian at the beginning of the study. The follow-ups were planned to be every 4 weeks by the dietitian and also every 8 weeks by the nephrologist. The participants were asked not to change their usual medications (including antihypertensive drugs) and Ca and vitamin D supplements during the study. They were also asked not to take non-steroidal anti-inflammatory drugs. Afterwards, the patients were randomly assigned to an intervention and a control group (n 60 in each group) using block randomisation.
The dietary counselling consisted of an individualised dietary programme calculated by an experienced renal dietitian based on the recommendations of the National Kidney Foundation Kidney Disease Outcomes Quality Initiative (NKF KDOQI) 2000 edition nutrition guidelines(21). Therefore, for the patients of this study, dietary prescription included moderate protein intake of 0·75 g per desirable body weight/d, energy intake of 30–35 kcal/kg/d based on the patient’s nutritional status and low Na intake (less than 2000 mg/d) were considered. Clinical decisions for individualised modification of dietary potassium and phosphate were made based on a combination of the current dietary intakes and biochemical data, while the recommended potassium intake (2000–3000 mg/d)(Reference Cases, Cigarrán-Guldrís and Mas22) and phosphorus intake (10 mg/kg/d)(Reference Salomo, Kamper and Poulsen23) were considered by a dietitian at every follow-up visit. The target lab values for serum potassium and phosphate level were (3·5–5 mEq/l) and (3–4·5 mg/dl), respectively.
Different educational strategies were offered to intervention group to enhance the knowledge and understanding of the patients regarding their dietary habits and food intakes. One of these strategies was an individual class (15–20 min), in which the prescribed diet components were described in detail in face-to-face interviews. In this class, the potential benefits of this therapy and the reasons for reducing the consumption of food sources of protein and Na were discussed. The second strategy was a group class (groups of 9–10 participants in a 2-h session) aiming at enhancing the interaction between the dietitian and the patients. Lectures were given in an exegetical class using slides about the relevant topics in CKD by the same dietitian. Nutrition requirements, recommended food portions, renal exchange lists, cooking issues, renal recipes, illustrated food models and household measuring utensils were discussed in detail. The suggestions were reiterated at the end of the class, and the patients were encouraged to actively participate and give feedback to the lecturer. The classes were offered with self-management focus in order to amend the accuracy of the information collected via a 24-h food recall. The third strategy was using an educational booklet having pictures of portion sizes of foods and renal recipes modified according to domestic food items. The booklet was designed by the research team based on NKF KDOQI nutrition guidelines to increase the patients’ understanding of the importance of nutrition in CKD. It also provided access to the required information at home for both patients and caregivers (Fig. 2). Dietary adherence which ranged from 80 % to 90 % was assessed through subjective methods (self-reported adherence rate) and indirect techniques (via measuring the dietary intakes during the follow-ups and monitoring serum biochemical markers). The diet for all participants were adjusted by a renal dietitian at the beginning of the study and then every 4 week follow-ups. Additionally, the trend of changes in serum creatinine (Cr), P, K and Na were indicative of good adherence to the prescribed diet. After enrolment, the patients were requested to return to the CKD outpatient clinic every 4 weeks, depending on their schedule, to be counselled by the dietitian and to be evaluated regarding their adherence to the prescribed diet. The patients were also monitored via telephone contact for 20 min once a week during the study period. The control group was visited by the nephrologist every 8 weeks during the 24 weeks of the study to detect any unpredicted sudden crisis (abnormal changes in Cr, Ca and K levels) and monitor any health-related compromising events which could affect their compliance to study protocols.
All participants in the intervention group received all the educational strategies about nutritional cares in CKD, but the control group did not receive any educational programme. The common and general nutritional advice for reducing salt and meat intake was also provided for this group. However, they were not given any individualised renal diets or booklets.
This study was based on the Declaration of Helsinki and good clinical practice guidelines. Besides, the study protocols were accepted by the Ethics Committee of Shiraz University of Medical Sciences, Shiraz, Iran (IR.SUMS.REC.1398.531). The study was also registered in the Iranian Registry of Clinical Trials (IRCT2900223003408N6).
Measurements
Nutritional status, Subjective Global Assessment (SGA) questionnaire, blood parameters, Bioelectric Impedance Analysis (BIA) test, medication history, Short Form 12 (SF-12) questionnaire and Beck Depression Inventory (BDI) were recorded for each patient at the beginning and end of the research.
Anthropometric and body composition assessments
Anthropometric measurements were performed using calibrated tools. The patients’ weight was measured by a digital scale, and their height was recorded using a stadiometer in standing position without shoes. Then, BMI was computed as weight/(height)2. Furthermore, waist and hip circumferences were measured using a tape measure.
Body composition for each patient was measured using BIA method (InBody model: BPBIO320, Korea). Fat mass, body fat mass, total body water, skeletal muscle mass and percent of body fat (PBF) were recorded. Before the BIA test, the patients were asked to attain normal hydration and not to do vigorous exercises for 12 h. It should be noted that the BIA guidelines have been approved by the European Clinical and Metabolic Association.
Nutritional assessments
On the first and final days of this trial (two times), a triple 24-h food recall was obtained from all participants which was administered by a trained dietitian in an interview. The 3-d food recalls included two non-weekend days and one weekend day; then, the average of the three intake values were calculated and recorded. The food recalls were analysed by the Nutritionist IV Software (version 3.5.2; 1994, N-Squared Computing).
SGA questionnaire was used to evaluate malnutrition in the CKD patients. This questionnaire contained questions about the physical conditions of the body like muscle and subcutaneous fat wasting and oedema, diet and nutritional history like weight change within 2 weeks and 6 months, appetite status, food consumption, and gastrointestinal symptoms. The total scores of 10, 10–17 and above 17 were considered well-nourished, mildly malnourished and severely malnourished, respectively(Reference Nursal, Noyan and Tarim24).
Depression and quality of life
To assess the patients’ depression status, use was made of BDI that included multiple-choice items. The scores obtained were classified as follows: 0–9: no depression, 10–13: borderline, 14–19: mild depression, 20–28: moderate depression and 29–63: severe depression, and higher scores were indicative of more severe depression(Reference Cukor, Rosenthal and Jindal25–Reference Powles27).
Health status and quality of life were measured using the SF-12 questionnaire, which is a self-administered questionnaire scoring from 0 to 100(Reference Montazeri, Vahdaninia and Mousavi28). The questionnaire items were dichotomous (yes/no), ordinal (excellent to poor) or reported as frequency (always to never). This questionnaire was used to calculate the Physical Component Summary (PCS) and Mental Component Summary (MCS) scores. Accordingly, higher scores represented a better health status(Reference Ware, Kosinski and Keller29).
Blood sample collection, blood pressure and estimated glomerular filtration rate
Between 07:30 and 08:30 AM, after a 12–14 h of overnight fasting, a 10-ml blood sample was collected in clot tubes and another 3 ml was collected in EDTA containing tubes for the complete blood count including: erythrocytes, leucocytes, Hb, haematocrit and platelet’s test. The clot tubes were centrifuged at 2500 rpm at 4°C for 10 min. After separation, the sera were stored at −80°C until assay(Reference Zal, Mostafavi-Pour and Vessal30).
All serum biochemical levels were measured by standard commercial diagnostic kits using an auto-analyzer device. Besides, ferritin and vitamin D concentrations were measured using ELISA kits (Diagnostics Biochem Canada Inc.) according to the manufacturer’s instructions. Complete blood count was also counted using an automated hematology analyzer (Sysmex). Furthermore, systolic blood pressure (SBP) and diastolic blood pressure (DBP) were measured by a mercury sphygmomanometer (Riester). Blood pressure measurement was standarised(Reference Pickering, Hall and Appel31). The arm circumference:cuff width (AC:CW) ought to be about 0·40, and the cuff length ought to surround the AC from 80 to 100 %(Reference Pickering, Hall and Appel31). SBP and DBP measurements were repeated three times, and the mean of triplicate values was considered as BP for every one (SBP and DBP independently).
eGFR was calculated using CKD-Epi equation(Reference Levey, Stevens and Schmid32).
Statistical analysis
All statistical analyses were performed using the SPSS software, v. 20.0 (SPSS Inc.). P-values <0·05 were considered statistically significant. The results were expressed as mean ± standard error and 95 % CI. At first, one-sample Shapiro–Wilk test was performed to confirm the normal distribution of the data. Then, within-group changes were analysed using paired t test, while between-group differences were assessed by independent sample t test or Mann–Whitney U test, as appropriated. The main objective of the proposed study is to examine the effectiveness of diet therapy along with nutrition education on CKD patients, and it will be compared within and among the groups. ANCOVA was used to analyse the effectiveness of the intervention and comparing the mean values among the groups. Based on this analysis, three models were designed.
Results
Participants’ characteristics
As demonstrated in the flow diagram of the study (Fig. 1), during the treatment phase of the study, seven patients were excluded from the intervention group and eight from the control group. The reasons for these exclusions have been described in the flow diagram. After all, 105 participants completed the procedures. The mean age of the participants was 50·18 ± 1·96 years in the intervention group and 49·43 ± 1·85 years in the control group. The baseline demographic and laboratory characteristics of the patients in both groups are presented in Table 1. The results revealed no statistically significant differences between the two groups in terms of the baseline characteristics.
Consort flow diagram of the trial. *Monitoring for stopping the study: if the potassium and calcium or creatinine levels in blood pass the optimum levels and any sudden crisis for patient was detected by nephrologist. **Other causes include renal stone, polycystic kidney disease, pyelonephritis and glomerulonephritis.

Baseline demographic characteristics and the measured parameters in the patients
(Mean values with their standard errors)

eGFR, estimated glomerular filtration rate; BUN, blood urea nitrogen; HCT, haematocrit; PTH, parathyroid hormone; 25(OH)D, 25-hydroxy-vitamin D; TC, total cholesterol; SBP, systolic blood pressure; DBP, diastolic blood pressure; SGA, Subjective Global Assessment; PCS, Physical Component Summary; MCS, Mental Component Summary.
Main outcomes
The changes in the measured variables during the treatment phase of the study are shown in Table 2. The results indicated a significant difference between the two groups regarding eGFR, blood urea nitrogen (BUN) and Cr serum level at the end of the study (P < 0·001, P < 0·001 and P = 0·045, respectively). eGFR, as the primary outcome, increased significantly in the intervention group compared with the control group. Nutrition intervention also hindered the increase in the BUN level compared with the control group. In addition, although skeletal muscle mass remained unchanged during the study, a significant decline was found in the Cr serum level in the intervention group compared with the control group. Regarding the blood levels of other parameters measured as the secondary outcomes, no statistically significant differences were detected between the two groups. According to the results presented in Table 2, SBP and DBP decreased significantly in the intervention group, and the difference between the two groups was statistically significant (P < 0·05). Considering depression, the results showed significantly higher scores in the control group (P = 0·028) in comparison with the intervention group. Although the SGA scores increased in both groups compared with the baseline, between-group differences were not statistically significant. Moreover, the quality of life was not changed significantly in the two groups (Table 2). According to Fig. 3, the results revealed no changes in anthropometric measurements and body composition analysis of the participants in both groups at the end of the study compared with the baseline. The results also showed no significant differences between the two groups in this regard. These findings confirmed our success in maintaining the body fat mass and skeletal muscle mass unchanged during 24 weeks.
The effect of renal diet and nutrition education on the levels of the measured parameters in the patients*
(Mean values with their standard errors)
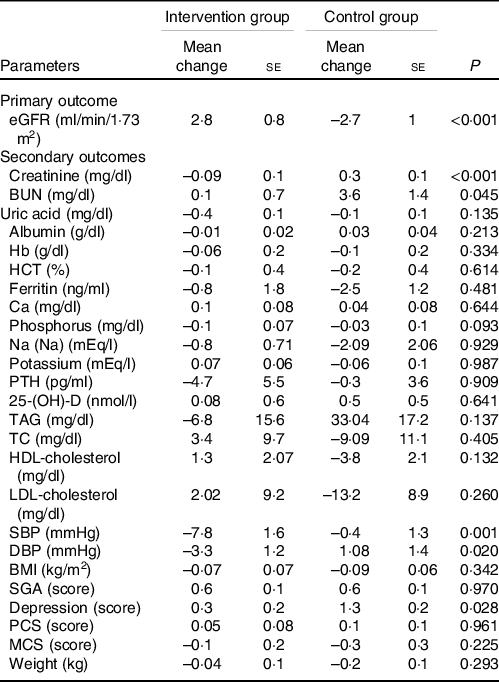
eGFR, estimated glomerular filtration rate; BUN, blood urea nitrogen; HCT, haematocrit; PTH, parathyroid hormone; 25(OH)D, 25-hydroxy-vitamin D; TC, total cholesterol; SBP, systolic blood pressure; DBP, diastolic blood pressure; SGA, Subjective Global Assessment; PCS, Physical Component Summary; MCS, Mental Component Summary.
eGFR was calculated using CKD-Epi equation(Reference Levey, Stevens and Schmid32).
* Mean change = mean after the experiment – mean before the experiment.
Flow chart of the detailed interventional strategies of the trial.

Anthropometric measurements, body composition analysis of the participants in both groups at baseline and after the intervention. SMM, skeletal muscle mass (kg); HC, hip circumferences (cm); TBW, total body water (l); BFM, body fat mass (kg); WC, waist circumferences (cm); PBF, percentage of body fat (%); FFM, fat-free mass (kg).

Analysis of the individualised prescribed diet for the intervention group has been depicted in Table 3. As it was planned according to the study protocols, intake of all dietary macronutrients was statistically changed in the intervention group. On the other hand, a significant decrease was found in the daily carbohydrate intake and, as a result, daily energy intake in the control group. Additionally, the comparison of the two groups revealed a dramatic decline in the daily intake of protein, Na, P and soluble fibre (Table 4). However, no significant intra- and inter-group differences were found with respect to the other micronutrients. Considering the role of alcohol consumption in energy intake and its remarkable effects on health parameters, the participants were questioned about their alcohol consumption habits. Only two participants reported very little consumption and the rest declared zero consumption (all the participants were Muslim). We used ANCOVA to analyse the differences in eGFR levels between the control and intervention groups after the intervention. As shown in Table 5, the eGFR of the control group was significantly lower than that of the intervention group (β = -5·06; 95 % CI (−8·203, −2·999)) (Table 5).

HBV, high biological value; LBV, low biological value.
* Servings are according to My Pyramid serving sizes and renal diet guidelines(Reference Morante, Sánchez-Villazala and Cutillas16).
Comparison of the study groups regarding the daily nutritional intake after the intervention*
(Mean values with their standard errors)

Data have been shown as mean change ± se (CI).
* Mean change = mean after the experiment – mean before the experiment.
Association between diet therapy along with nutrition education at baseline and change in estimated glomerular filtration rate after 24 months between groups
(Coefficient values, standard errors, 95 % confidence intervals)

SBP, systolic blood pressure; DBP, diastolic blood pressure; BUN, blood urea nitrogen.
* Models.
† Model 1 – unadjusted model.
‡ Model 2 – adjusted for age, sex and baseline BMI.
§ Model 3 – model 2 plus adjustment for baseline levels of depression, protein g/kg intake, Na intake (mg/d), SBP (mmHg), DBP (mmHg), creatinine (mg/dl), BUN (mg/dl) and baseline uric acid (mg/dl).
‖ β: Unstandardised coefficient of group model)n 105).
Discussion
The results of the current study showed a significant improvement in eGFR, BUN, Cr and BP of the patients with CKD who were mainly in stages 3 and 4 of the disease. Although no significant difference was observed between the two groups concerning the patients’ mental and physical health-related quality of life and SGA during the 24-week intervention, the treatment group showed remarkably better results in attenuating depression. Moreover, a balanced modification in the patients’ daily dietary macro- and micro-nutrients intake (lower protein and Na intake with adequate energy) together with individualised dietary consultation in the intervention group led to better management of this chronic condition, kidney function preservation.
Renal function improvement in terms of estimated glomerular filtration rate, blood urea nitrogen and creatinine
The significant improvements in eGFR, as the primary outcome, and other surrogate markers (BUN and Cr) could be related to the synergistic effects of some macro- and micro-nutrient modifications in the patients’ daily diets.
Estimated glomerular filtration rate
Patients with CKD are at increased risk of morbidity which eventually leads to ESRD(Reference Fox, Matsushita and Woodward4,Reference Fujii and Joki5) . Based on our findings, after treatment, the levels of eGFR in the intervention group were significantly higher than those in the control group. Based on our results, four patients in the intervention group had regressive stage transition during the 6 months of the intervention (change from stage 4 to stage 3), while in the control group this trend was different and from ten patients who had stage transition, eight of them progressed from stage 3 to stage 4 and just two of them regressed from stage 4 to stage 3. This stage transition was statistically significant according to Fisher’s exact test (P = 0·015), and also these eGFR changes when comparing the two groups during 6 months might be considered meaningful from a clinical perspective. As renal failure is a progressive disease, even maintaining the patients in their current stages of CKD is a success and could have clinical value(Reference Cortinovis, Ruggenenti and Remuzzi33), and evidence showed that annual eGFR reduction rate for each 1 ml/min/1·73 m2 increased the risk for incident ESRD 17 % more(Reference Tsai, I-Wen and Hung-Chieh34). Various clinical factors could affect the levels of eGFR such as use of medications that improve renal function or not taking nephrotoxic drugs(Reference Cortinovis, Ruggenenti and Remuzzi33), sudden acute kidney injury(Reference Levey, Coresh and Bolton3) and nutritional interventions(Reference Levey, Coresh and Bolton3). In this research, as the use of different drugs was the same between the two groups and also the absence of acute kidney injury patients during the trial, eGFR improvement might be indicative of the beneficial effects of nutritional intervention.
Protein
In this study, 0·75 g/kg/d protein was prescribed in the renal diet, at least 50 % of which was high biological value. Although the new updated 2020 NKF KDOQI guideline recommends 0·55 to 0·6 g/kg of protein intake in patients with non-diabetes and non-dialysis CKD stages 3–5(Reference Ikizler, Burrowes and Byham-Gray35), the previous recommended range of 0·6–0·8 g/kg according to 2000 NKF KDOQI guideline(21) suggested to be acceptable and useful as our findings showed significant improvement in eGFR. High protein intake has been thought to contribute to kidney malfunction through increased eGFR(Reference Schwingshackl and Hoffmann36), metabolic acidosis(Reference Fouque and Aparicio37) and oxidative stress(Reference Jarusiripipat, Shapiro and Chan38). Protein restriction (0·6 to 0·8 g/kg body weight or even fewer) has been basically offered for amelioration of proteinuria in pre-dialysis patients with CKD (stages 3–5)(Reference Fouque and Aparicio37,Reference Ash, Campbell and Bogard39) . Nonetheless, many physicians have opposed the prescription of low-protein diet regimen, especially after the Modification of Diet in Renal Disease (MDRD) Study 2, in which very-low-protein diets (0·3–0·4 g/kg/d) resulted in unfavourable prognosis(Reference Menon40). The patients’ adherence to very-low-protein diet was a big problem, as well(Reference Menon, Kopple and Wang41). Yet, because the effectiveness of protein-restricted dietary approaches appears to be uncertain, their rationality has been questioned repeatedly(Reference Thilly42–Reference Friedman44). In a meta-analysis(Reference Rhee, Ahmadi and Kovesdy45,Reference Yan, Su and Xu46) , restriction in protein intake (less than 0·8 g/kg/d) was associated with lower phosphorus and BUN levels as well as slower progression to ESRD without any incidence of malnutrition. These findings were similar to those of the current investigation, since the intervention involving the prescription of 0·75 g/kg/d protein for the patients was effective in improving eGFR, decreasing Cr serum level and suppressing the increase in BUN, which in turn delayed the progression of CKD. Reduced dietary protein intake would also improve the kidney function by limiting the accumulation of uremic toxins or waste. Some precursors of uremic toxins are the result of undigested dietary protein fermentation in the intestinal lumen where the proteolytic bacteria are present(Reference Cupisti, Bolasco and D’Alessandro47). It is important to remind that the reduction of every solute would lighten the impaired kidney overload(Reference Cupisti, Bolasco and D’Alessandro47).
Energy
In the present study, attempts were made to avoid protein-energy wasting in the participants by maintaining their usual energy intakes unchanged during the study concomitant with the adequacy of other nutrients. With regard to body composition analysis, the study results revealed success in maintaining the usual weight as well as lean body mass after 24 weeks of diet therapy in the intervention group. In fact, the total energy intake of 30–35 kcal/kg body weight was prescribed for the intervention group considering their adjusted ideal body weight to ensure the adequacy of energy intake and to avoid any probable weight loss. The fact is that while tissues are degrading, their components, such as amino acid metabolites, urea and potassium, are released in the blood. After this catabolism, the elevated function of the remaining nephrons would be required. Thus, maintaining the usual body weight and retaining lean body mass through providing adequate high-quality protein and proper amounts of energy content are of great benefit in CKD patients(Reference Kopple, Shaib and Monteon48). In the current research, improvement in eGFR and decrease in serum levels of urea and Cr could be related to the reduced intake of phosphorus, good control of hypertension and increased intake of soluble fibre during the 24-week intervention. Hyperphosphatemia and hypertension have been reported to accelerate the progression rate of CKD in pre-dialytic patients(Reference Voormolen, Noordzij and Grootendorst49–Reference Chue, Edwards and Davis55). When metabolised by the colonic microbiota, soluble fibres from plants cause a reduction in indoxyl sulphate and p-cresylsulphate, as nephrotoxic compounds made from amino acids(Reference Meijers and Evenepoel56).
Blood pressure
The findings of the current study showed a significant decrease in the patients’ both SBP and DBP in the intervention group compared with the control group. This finding can be explained mainly as the result of the reduced salt (Na) intake as recommended in the individualised consultation and diet therapy. In the following section, we discuss the possible roles of Na, fibre, K and protein intakes on BP in CKD patients.
Sodium and blood pressure
Reduced BP in the present study along with a significant reduction in Na intake after the intervention supported the idea that patients with CKD might be salt-sensitive, as suggested in other studies(Reference McMahon, Bauer and Hawley57). High-dietary Na intake could worsen the existing hypertension, which has been thought to be both a cause and a consequence of CKD(Reference Gansevoort, Correa-Rotter and Hemmelgarn58). High BP increases glomerular filtration and proteinuria, thereby accelerating the progression of CKD(Reference Hultström59). High BP causes remodelling kidney vessels, tubular atrophy and decreased filtration rate(Reference Hultström59). The current guidelines have recommended Na intake to be less than 2000 mg/d in CKD patients (stages 1–4)(Reference Snelson, Clarke and Coughlan60). In the present study, Na intake was dramatically reduced to 1640 mg/d in the intervention group at the end of the study, while this measure was reported to be more than 4000 mg/d in the control group. Bellizzi et al.(Reference Bellizzi, Di Iorio and De Nicola10) also found that the antihypertensive effect of a very-low-protein diet was possibly due to the reduced salt intake(Reference Bellizzi, Di Iorio and De Nicola10).
Restriction of Na intake in patients with CKD through the action of angiotensin-converting enzyme inhibitors reduces BP and proteinuria(Reference Slagman, Waanders and Hemmelder61).
Fibre and potassium effects on blood pressure
Although intake of potassium was not different between the two groups and remained unchanged without hyperkalemia during the study, sufficient amounts of soluble fibre and potassium were provided by moderate intakes of fruits and vegetables in the intervention group(Reference Khor, Tallman and Karupaiah62–Reference Mahan, Escott-Stump and Raymond64). Consequently, this intervention might have played a role in BP control(Reference Aleixandre and Miguel65).
Dietary protein and blood pressure
Reduced protein intake in the intervention group could lower BP through a decrease in the glomerular hydrostatic filtration pressure(Reference Bellizzi, Di Iorio and De Nicola10).
Depression
The current study findings revealed remarkably better results regarding the attenuation of depression in the treatment group compared with the control group. The increment in the depression score might have been prevented in the treatment group through a decrease in BUN and Cr levels, an increase in eGFR, higher intake of soluble fibre and better amino acid profile in the context of high biological value protein consumption. According to the review of the literature, this has been the first study assessing the effects of dietary intervention on depression among CKD patients. Depression in CKD patients might be attributed to uremic intoxication(Reference Baumgaertel, Kraemer and Berlit66), which could, in turn, exacerbate kidney failure and affect the feeling of well-being(Reference Kurtz67). It should be noted that increased contact with healthcare providers during the educational interventions may have a beneficial role in reducing depression in the patients of intervention group.
Nutrient intake
Based on the findings of the present study, modification in the treatment group’s diet (lower protein, fat, Na and P intakes with adequate energy and higher carbohydrate and soluble fibre intakes) led to better outcomes amongst the CKD patients.
Protein source
Balancing the animal and plant sources of protein intake is of paramount importance in CKD. Despite the proper high biological value protein intake, reasonable servings of fruits and vegetables were considered in the daily diet of the intervention group without adversely affecting serum phosphorus and potassium levels(Reference Edwards, Parrett and Khanna68).
Phosphorus
The significant reduction in phosphorus intake in the patients who adhered to the diet might probably be the result of the limited protein, legumes and nuts intake as well as the implementation of effective educational strategies related to dietary phosphorus sources. The patients in the intervention group were instructed to replace meat with egg white, which has the lowest phosphate:protein ratio. They were also asked to limit the foods with a high phosphate:protein ratio (such as cheese and egg yolk) and to avoid rich sources of phosphorus like legumes, nuts and inorganic phosphate additives(Reference Sinha and Prasad69).
Dietary fibre
Comparison of the two groups indicated that the intake of soluble fibre was significantly increased in the patients who had adhered to their diet. This finding could be reflective of adequate consumption of low biologic value protein while maintaining a good balance of serum potassium and phosphorus. Maximum tolerable fruit and vegetable intake (4/4 mean servings) together with moderate protein restriction (Table 3) was also suggested in this regimen, which were desirable according to the study results.
Nutrition education and consultation
According to the findings of this research, better clinical improvement in renal function would be achieved if modified renal diets were supported by adequate nutrition education and consultation. An adequate diet tailored personally would be more desirable if accompanied by sufficient education about why and how to achieve that. In fact, psychological factors (knowledge, attitude and satisfaction) have been expressed as the most important determinants of adherence to treatment. In the current research, the participants were educated about a clear and distinct vision in renal diet with a distinguished definition of suitable food items through booklets (self-education) and educational classes and were periodically followed via phone contact during the study(Reference Milas, Nowalk and Akpele70).
The current study had some limitations, the first of which being single measurements of serum Cr, BUN and skeletal muscle mass (SMM) during the study period (just before and after the study and not repeating the measurements for monitoring the trend). In addition, the urinary protein and urea were not measured. Considering the effect of increased contact with healthcare providers at intervention visits, which may play a supportive mental role in chronic diseases, it seems that lack of attention control group is another limitation. As the participants of this study were CKD patients without co-morbidities (diabetes, heart failure, etc.), results may not be generalised to people with CKD with complex chronic disease. Future studies are needed to evaluate the effects of renal diet therapy on inflammation and oxidative stress markers, muscle atrophy indices, and blood gas parameters for metabolic acidosis conditions. Assessing hard end points, such as progression to ESRD co-morbidities and survival, in combination with surrogate conventional biomarkers, is also suggested in long-term clinical trials.
Conclusions
According to our findings, nutritional treatment along with supportive education and counselling contributed to improvements in renal function and BP control.
In CKD, diet therapy can prevent disease progression and delay the initiation of renal replacement therapy through the modulation of the eGFR. Thus, commencing a nutritional treatment along with supportive education and consultation for better acceptance and adherence to the diet is recommended from the early stages of CKD. These comprehensive interventions can also impede the worsening of mental conditions associated with CKD-related depression.
Acknowledgements
The authors would like to thank Dr Nasrin Shokrpour at the Research Consultation Center of Shiraz University of Medical Sciences for improving the use of English in the manuscript.
This study was extracted from Maryam Hamidianshirazi’s MSc thesis in Nutrition, which was financially supported by the ViceChancellor for Research Affairs of Shiraz University of Medical Sciences (grant No. 97-01-84-19003).
Research idea and study design: M. H., M. S., M. E. and M. T.; data acquisition: M. H., M. S., M. E. and F. N.; data analysis/interpretation: M. H., M. E. and F. N.; statistical analysis: M. H., M. E. and F. N.; supervision or mentorship: M. S., M. E. and M. T. Each author contributed to the important intellectual content during manuscript drafting or revision and accepts accountability for the overall work by ensuring that questions pertaining to the accuracy or integrity of any portion of the work are appropriately investigated and resolved.
The authors declare that there are no conflicts of interest.



