

1. Introduction
Psychoses, in particular schizophrenia, are highly disabling disorders and associated with poor quality of life (QoL) and low self-rated health (SRH) [Reference Vigo, Thornicroft and Atun1]. QoL, the overall general, subjective evaluation of life as good and satisfactory, has been increasingly considered as an important treatment target [Reference van Knippenberg and de Haes2, Reference Brekke and Long3] for being an important predictor of functional outcomes in first-episode [Reference Malla and Payne4] and chronic [Reference Eack and Newhill5, Reference Saarni, Viertiö, Perälä, Koskinen, Lönnqvist and Suvisaari6] psychosis. Furthermore, poor QoL in psychosis patients was associated with more severe depressive, positive and negative symptoms, and comorbid personality disorder [Reference Cotton, Gleeson, Alvarez-Jimenez and McGorry7, Reference MacBeth, Gumley, Schwannauer and Fisher8]. In doing so, impairment of QoL may ameliorate across early stages of psychosis, with worse QoL in clinical high risk (CHR) and first-episode psychosis compared to chronic schizophrenia [Reference Priebe, Roeder-Wanner and Kaiser9, Reference Ruhrmann, Paruch, Bechdolf, Pukrop, Wagner and Berning10, Reference Bechdolf, Pukrop, Köhn, Tschinkel, Veith and Schultze-Lutter11], likely as a result of adaption to the illness over time and loss of insight, which commonly increases over the course of the illness [Reference Priebe, Roeder-Wanner and Kaiser9, Reference Margariti, Ploumpidis, Economou, Christodoulou and Papadimitriou12, Reference Aghababian, Auguier, Baumstark-Barrau and Lancon13].
Besides QoL, SRH is another important subjective construct to rate individuals’ current health status, both physical and mental [Reference Brooks14, Reference Rohrer, Young, Sicola and Houston15]. SRH has been used as a reliable, quick assessment for population health monitoring [Reference Mavaddat, Kinmonth, Sanderson, Surtees, Bingham and Khaw16], and frequently studied by epidemiologists in relation to mortality, morbidity, disability, and psychopathological symptom severity [Reference Idler and Benyamini17, Reference Alonso, Vilagut, Adroher, Chatterji, He and Andrade18]. For psychosis, esp. schizophrenia patients, high rates of poor physical health and premature mortality along with a substantially reduced average life expectancy [Reference Saha, Chant and McGrath19, Reference De Hert, Cohen, Bobes, Cetkovich-Bakmas and Leucht20] and, in comparison to mentally healthy controls, reduced SRH were reported [Reference Moreno, Nuevo, Chatterji, Verdes, Arango and Ayuso-Mateos21].
The majority of first-episode psychotic disorders are preceded by a prodromal phase in which a multitude of CHR symptoms, other mental health problems, psychosocial deficits, and, already, a reduction in QoL and SRH occur, and during which help may be sought [Reference Schultze-Lutter, Michel, Schmidt, Schimmelmann, Maric and Salokangas22–Reference Watson, Zhang, Rizvi, Tamaiev, Birnbaum and Kane25]. This phase offers an excellent starting point for an indicated prevention that, currently, aims at reducing CHR symptoms and, thereby, preventing transition to frank psychosis [Reference Schmidt, Schultze-Lutter, Schimmelmann, Maric, Salokangas and Riecher-Rössler26]. Currently, two major sets of CHR criteria are used to detect a putatively psychosis-prodromal phase: (i) symptomatic ultra-high risk (UHR) criteria, i.e., attenuated (APS) or brief intermittent psychotic symptoms (BIPS); and (ii) basic symptom criteria, i.e., Cognitive Disturbances (COGDIS) and Cognitive-Perceptive Basic Symptoms (COPER), including subjective disturbances in thought and perception processes [Reference Schultze-Lutter, Michel, Schmidt, Schimmelmann, Maric and Salokangas22, Reference Fusar-Poli, Rocchetti, Sardella, Avila, Brandizzi and Caverzasi24].
A recent meta-analysis found that the CHR state is also characterised by consistent and large impairments in QoL, compared to healthy controls [Reference Ruhrmann, Paruch, Bechdolf, Pukrop, Wagner and Berning10, Reference Fusar-Poli, Rocchetti, Sardella, Avila, Brandizzi and Caverzasi24, Reference Hui, Morcillo, Russo, Stochl, Shelley and Painter27] and other help seekers [Reference Granö, Karjalainen, Edlund, Saari, Itkonen and Anto28], that are independent of a transition to psychosis and as severe as QoL impairments in other psychiatric disorders [Reference Saarni, Viertiö, Perälä, Koskinen, Lönnqvist and Suvisaari6, Reference Fusar-Poli, Rocchetti, Sardella, Avila, Brandizzi and Caverzasi24]. Similar to psychosis patients, the association between QoL and psychopathology in CHR patients was related to the severity of both positive symptoms and unspecific, especially depressive symptoms, which were the most important predictors of poor QoL in CHR states [Reference Ruhrmann, Paruch, Bechdolf, Pukrop, Wagner and Berning10, Reference Bechdolf, Pukrop, Köhn, Tschinkel, Veith and Schultze-Lutter11, Reference Takahashi, Higuchi, Komori, Nishiyama, Nakamura and Sasabayashi29]. Furthermore, anxiety symptoms, cognitive impairments [Reference Takahashi, Higuchi, Komori, Nishiyama, Nakamura and Sasabayashi29], and poor functioning were also related to poor QoL in CHR states [Reference Fusar-Poli, Rocchetti, Sardella, Avila, Brandizzi and Caverzasi24, Reference Takahashi, Higuchi, Komori, Nishiyama, Nakamura and Sasabayashi29].
Low SRH, i.e., poor physical health and an unhealthy lifestyle, are common in UHR patients and should be monitored regularly [Reference Mittal, Gupta, Orr, Pelletier-Baldelli and Dean30, Reference Carney, Bradshaw and Yung31]. In recent community studies, the presence of psychotic experiences was associated with poorer SRH [Reference Alonso, Saha, Lim and Aguilar-Gaxiola32]. However, compared to research on QoL, little is known about factors influencing SRH and whether differential associations between these factors, CHR, and QoL/SRH exist. Moreover, the effect of UHR and basic symptoms on QoL and SRH has only cursory been investigated and only in clinical samples.
Therefore, the present study of QoL and SRH in a community sample investigated the relative contribution of their potential sociodemographic (age, gender, education) and clinical predictors (presence of non-psychotic axis-I disorders, UHR and basic symptoms), using both cross-sectional and longitudinal data. We used structural equation modelling (SEM) to simultaneously account for potential interrelations between all variables and outcomes [Reference Tomarken and Waller33]. We hypothesised that sociodemographic variables would play a minor role, while clinical variables, particularly affective and anxiety disorders, would have the strongest association with both QoL and SRH. For the assumed influence of insight on QoL in psychosis and because basic symptoms are experienced with immediate full insight into their abnormal nature by definition, we further assumed that, compared to UHR symptoms, basic symptoms would have a stronger negative effect on QoL and SRH.
2. Methods
2.1 Sample
The sample consisted of participants in the baseline and follow-up assessments of the ‘Bern Epidemiological At-Risk’ (BEAR) study [Reference Schultze-Lutter, Michel, Ruhrmann and Schimmelmann34], a representative random sample of the Bernese general population (see also eTexts 1 and 2). At baseline, a stratified sampling method was used to obtain a representative sample from the approximately 310,000 predominantly Caucasian individuals aged 16–40 years, registered in the semi-rural Canton Bern. The age range was selected because most first-episodes of affective and non-affective psychoses are reported to occur between 17 and 41 years of age [Reference Kirkbride, Fearon, Morgan, Dazzan, Morgan and Tarrant35, Reference McGrath, Saha, Al-Hamzawi, Alonso and Andrade36]. Participants were first recruited from 06/2011 to 11/2014 (N = 2683, response rate: 63.4%); a subsample of participants with CHR symptoms and age- and gender-matched controls was re-contacted from 06/2015 to 03/2018 (median follow-up 39 months, N = 829, response rate: 66.4%) and assessed using the Computer-Assisted Telephone Interviewing technique [Reference Schultze-Lutter, Michel, Ruhrmann and Schimmelmann34]. The ethics committee of the University of Bern approved both studies; participation in the telephone interview equalled informed consent. Interviews were aborted prematurely when respondents had (i) a lifetime diagnosis of psychosis [Reference Michel, Schimmelmann and Schultze-Lutter37] or (ii) insufficient language skills in German, French, or English. The semi-structured interviews lasted 43 min on average (SD: 20 min; range: 20–225 min).
2.2 Assessments
2.2.1 Assessment of mental disorders
Present DSM-IV non-substance-related axis-I disorders including affective, anxiety, eating, somatoform, obsessive-compulsive and post-traumatic stress disorder were assessed using the Mini-International Neuropsychiatric Interview (M.I.N.I.) [Reference Wang, Adair and Patten38], which had been previously applied successfully in telephone interviews of community samples [Reference Wang, Adair and Patten38]. The M.I.N.I. demonstrated good reliability, and good concurrent and predictive validity for assessing axis-I disorders [Reference Sheehan, Lecrubier, Sheehan, Amorim, Janavs and Weiller39].
2.2.2 Assessment of CHR symptoms
CHR symptoms and criteria (see eTable 1) were assessed using semi-structured interviews with good interrater reliability [Reference Schultze-Lutter, Addington, Ruhrmann and Klosterkötter40, Reference McGlashan, Walsh and Woods41]: the Structured Interview for Psychosis-Risk Syndromes (SIPS, version 5.0) [Reference McGlashan, Walsh and Woods41] for UHR symptoms and criteria, i.e. APS and the APS criterion, and psychotic symptoms and the BIPS criterion and the Schizophrenia Proneness Instrument, Adult version (SPI-A) [Reference Schultze-Lutter, Addington, Ruhrmann and Klosterkötter40] for predictive basic symptoms and related criteria, i.e. COPER and COGDIS [Reference Schultze-Lutter, Michel, Schmidt, Schimmelmann, Maric and Salokangas22]. Strictly, the definition of basic symptoms includes the requirement that the phenomenon in question presents a deviation from the ‘normal’ self. Nevertheless, the SPI-A also allows the rating of lifelong persistent complaints (i.e., ‘7′=‘has always been present in the same severity (trait)’); that, however, is not considered a basic symptom. The genetic risk-functional decline criterion was estimated only with a first-degree relative of psychosis serving as a genetic risk factor and being assessed with the SIPS; schizotypal personality disorder was not assessed because of the lack of an informant. The genetic risk-functional decline criterion was never met [Reference Schultze-Lutter, Michel, Ruhrmann and Schimmelmann34].
For the present analyses, CHR symptoms were defined by the presence of any one APS, BIPS, and/or basic symptom at baseline, irrespective of the onset/worsening and/or frequency requirements of related CHR criteria. CHR symptoms were only rated if the phenomenon in question was not fully and better explained by another non-psychotic disorder or psychotropic drug use [Reference Schultze-Lutter, Michel, Schmidt, Schimmelmann, Maric and Salokangas22, Reference McGlashan, Walsh and Woods41].
2.2.3 Assessment of quality of life and self-rated health
The Brief Multidimensional Life Satisfaction Scale (BMLSS) [Reference Büssing, Fischer, Haller, Heusser, Ostermann and Matthiessen42] was used to assess QoL, which demonstrated good psychometric properties and can be regarded as a brief, reliable, and valid measure of QoL [Reference Büssing, Fischer, Haller, Heusser, Ostermann and Matthiessen42]. The BMLSS assesses satisfaction in eight different life domains that are rated on a seven-point Likert-type scale ranging from ‘horrible’ = 0 to ‘very happy’ = 6. The eight-item BMLSS has a single-factor structure and addresses four main dimensions: intrinsic (myself, life in general), social (friendships, family life), external (work, housing), and perspective (finances, future) [Reference Büssing, Fischer, Haller, Heusser, Ostermann and Matthiessen42].
The three-level version of the EuroQoL-5D (EQ-5D-3 L) was used to assess SRH [Reference Brooks14]. An extensive body of literature supports the validity and reliability of the EQ-5D-3 L in various conditions and populations [Reference Janssen, Pickard, Golicki, Gudex, Niewada and Scalone43]. The EQ-5D-3 L comprises five items: mobility, self-care, usual activities, pain/discomfort, and anxiety/depression. Each item is rated on three levels: no, some, and extreme problems. We calculated an EQ-5D-3 L summary score according to Hinz et al. [Reference Hinz, Klaiberg, Brähler and König44] (100-(10x [value1+value2+value3+value4+value5-5])). An additional analogue scale records participants own judgements on their current health from ‘worst imaginable health state’ (0) to ‘best imaginable health state’ (100).
2.2.4 Quality assurance
Satisfying reliability of telephone assessments compared with face-to-face ones was demonstrated for mental disorders and CHR symptoms [Reference Rohde, Lewinsohn and Seeley45, Reference Michel, Schimmelmann, Kupferschmid, Siegwart and Schultze-Lutter46]. To achieve a ≥95% concordance rate with the trainers, both experts in the early detection of psychosis (F.S.-L. and C.M.), interviewers (all clinical psychologists) received intensive 3-month training, especially in the semi-structured, context-dependent assessment of CHR symptoms and mental disorders. Additionally, weekly supervision of all symptom ratings with the interviewers was performed by the two trainers to guarantee excellent, valid, and reliable data quality.
2.3 Statistical analyses
Differences in non-normally distributed continuous and ordinal data were assessed using the Wilcoxon Signed Ranked Test to compare QoL and SRH at baseline and follow-up. Prior to SEM, we computed orthogonal confirmatory factor analyses (CFA) with varimax rotation based on polychoric correlation matrices for QoL and SRH, to assure that both latent factors (i.e., QoL and SRH) were assessed reliably. We performed SEM with the weighted least squares and variance adjusted estimator (WLSMV) [Reference Brown47] based on diagonally weighted least squares (DWLS) for categorical and ordinal variables [Reference Hipp and Bollen48]. Missing data were deleted listwise (0.3% missing data in the cross-sectional and 0.2% in the longitudinal analyses). We assessed the model fit with five commonly used indices, as follows: the χ2 test, comparative fit index (CFI), Tucker‐Lewis index (TLI), standardised root mean square residual (SRMR), and root-mean-square error of approximation (RMSEA) including 90%-confidence interval (90% CI). A non-significant χ2-test, CFI ≥ 0.95, TLI ≥ 0.95, SRMR ≤ 0.08, and RMSEA ≤ 0.06 (90%CI should not contain 0.08) indicate good model fit [Reference Hooper, Coughlan and Mullen49, Reference Kline50]. In the evaluation of model fit, we focussed on CFI, TLI, SRMR, and RMSEA, because the χ2-test is sensitive to sample size, usually resulting in model rejection in large samples such as ours [Reference Bentler and Bonnet51].
Using cross-sectional baseline data, we first tested the hypothesised model including all associations between the predictors (modelled as manifest variables) and both QoL and SRH (modelled as two correlated latent variables; see eFig. 1). Covariates were allowed to covary with each other. Afterwards, we dropped non-significant associations from the model. For the prospective data, we used QoL and SRH assessed at follow-up as latent outcome variables and repeated these steps. Statistical analyses were conducted using SPSS 24.0 (Stata Corporation, College Station, TX, USA) and the lavaan package for R (R Core Team) [Reference lavaan52].
3. Results
Table 1 shows the clinical and sociodemographic characteristics of the baseline sample (N = 2683). Comparisons between baseline and follow-up did not reveal a significant difference in SRH (Table 2), yet slightly higher intrinsic and perspective BMLSS scores at follow-up with small effect sizes (Table 2).

Note: CHR: clinical high risk; APS: attenuated psychotic symptoms; BIPS: brief intermittent psychotic symptoms.
* An overlap between CHR symptoms and any current axis-I disorder was found for n = 116 (4.3%). Source: Bern Epidemiological At Risk (BEAR) Study (SNF project number: 135,381).

Note: EQ-5D-3L: 3-level version of EQ-5D; BMLSS: Brief Multidimensional Life Satisfaction Scale.
a parameter comparisons between baseline and follow-up; Rosenthal’s r of 0.1, 0.2, and 0.5 represent small, medium, and large effect size, respectively. Source: Bern Epidemiological At Risk (BEAR) Study (SNF project number: 135,381 and 155,951).
The initial cross-sectional model had a good model fit (eFig. 2, eTable 2), maintained after the elimination of nine insignificant paths (Fig. 1). In the final cross-sectional model, lower SRH had significant associations with older age, male gender, lower education, any affective disorder, any anxiety disorder, any somatoform disorder, and both UHR and basic symptoms; while lower QoL was significantly associated with any affective disorder, any anxiety disorder, any eating disorder, and both UHR and basic symptoms. Its clinical and sociodemographic predictors were significantly correlated with each other, though effects were commonly small (Table 3). Of the sociodemographic predictors, female gender had the strongest association with clinical variables (any anxiety disorder, any eating disorder, any somatoform disorder and UHR symptoms); while higher education was associated with both UHR and basic symptoms. Older age was exclusively associated with presence of basic symptoms (Table 3).
Results of the trimmed model with non-significant associations removed for the cross-sectional data (n = 2683).
Model fit indices: χ2(49) = 109.251, p < 0.001; CFI = 0.979; TLI = 0.971; SRMR = 0.024; RMSEA = 0.021 (90%CI = 0.016-0.027).
Explained variance (R2) for each endogenous variable in italics.
Note: rectangles represent observed variables, ovals represent unobserved latent variables; rounded arrows represent covariances; straight arrows represent regressions, black arrows represent significant; dashed arrows represent factor loadings.
UHR: ultra-high risk; EQ-5D-3L: 3-level version of the EQ-5D; BMLSS: Brief Multidimensional Life satisfaction Scale.


Note: UHR: ultra-high risk.
a 0=male, 1=female.
b 0=primary school/school for specific needs, 1=secondary school, 2=high school.
c 0=disorder absent, 1=disorder present.
Effect sizes r of 0.1, 0.2, and 0.5 represent small, medium, and large effect size, respectively; non-significant interrelations are in grey.
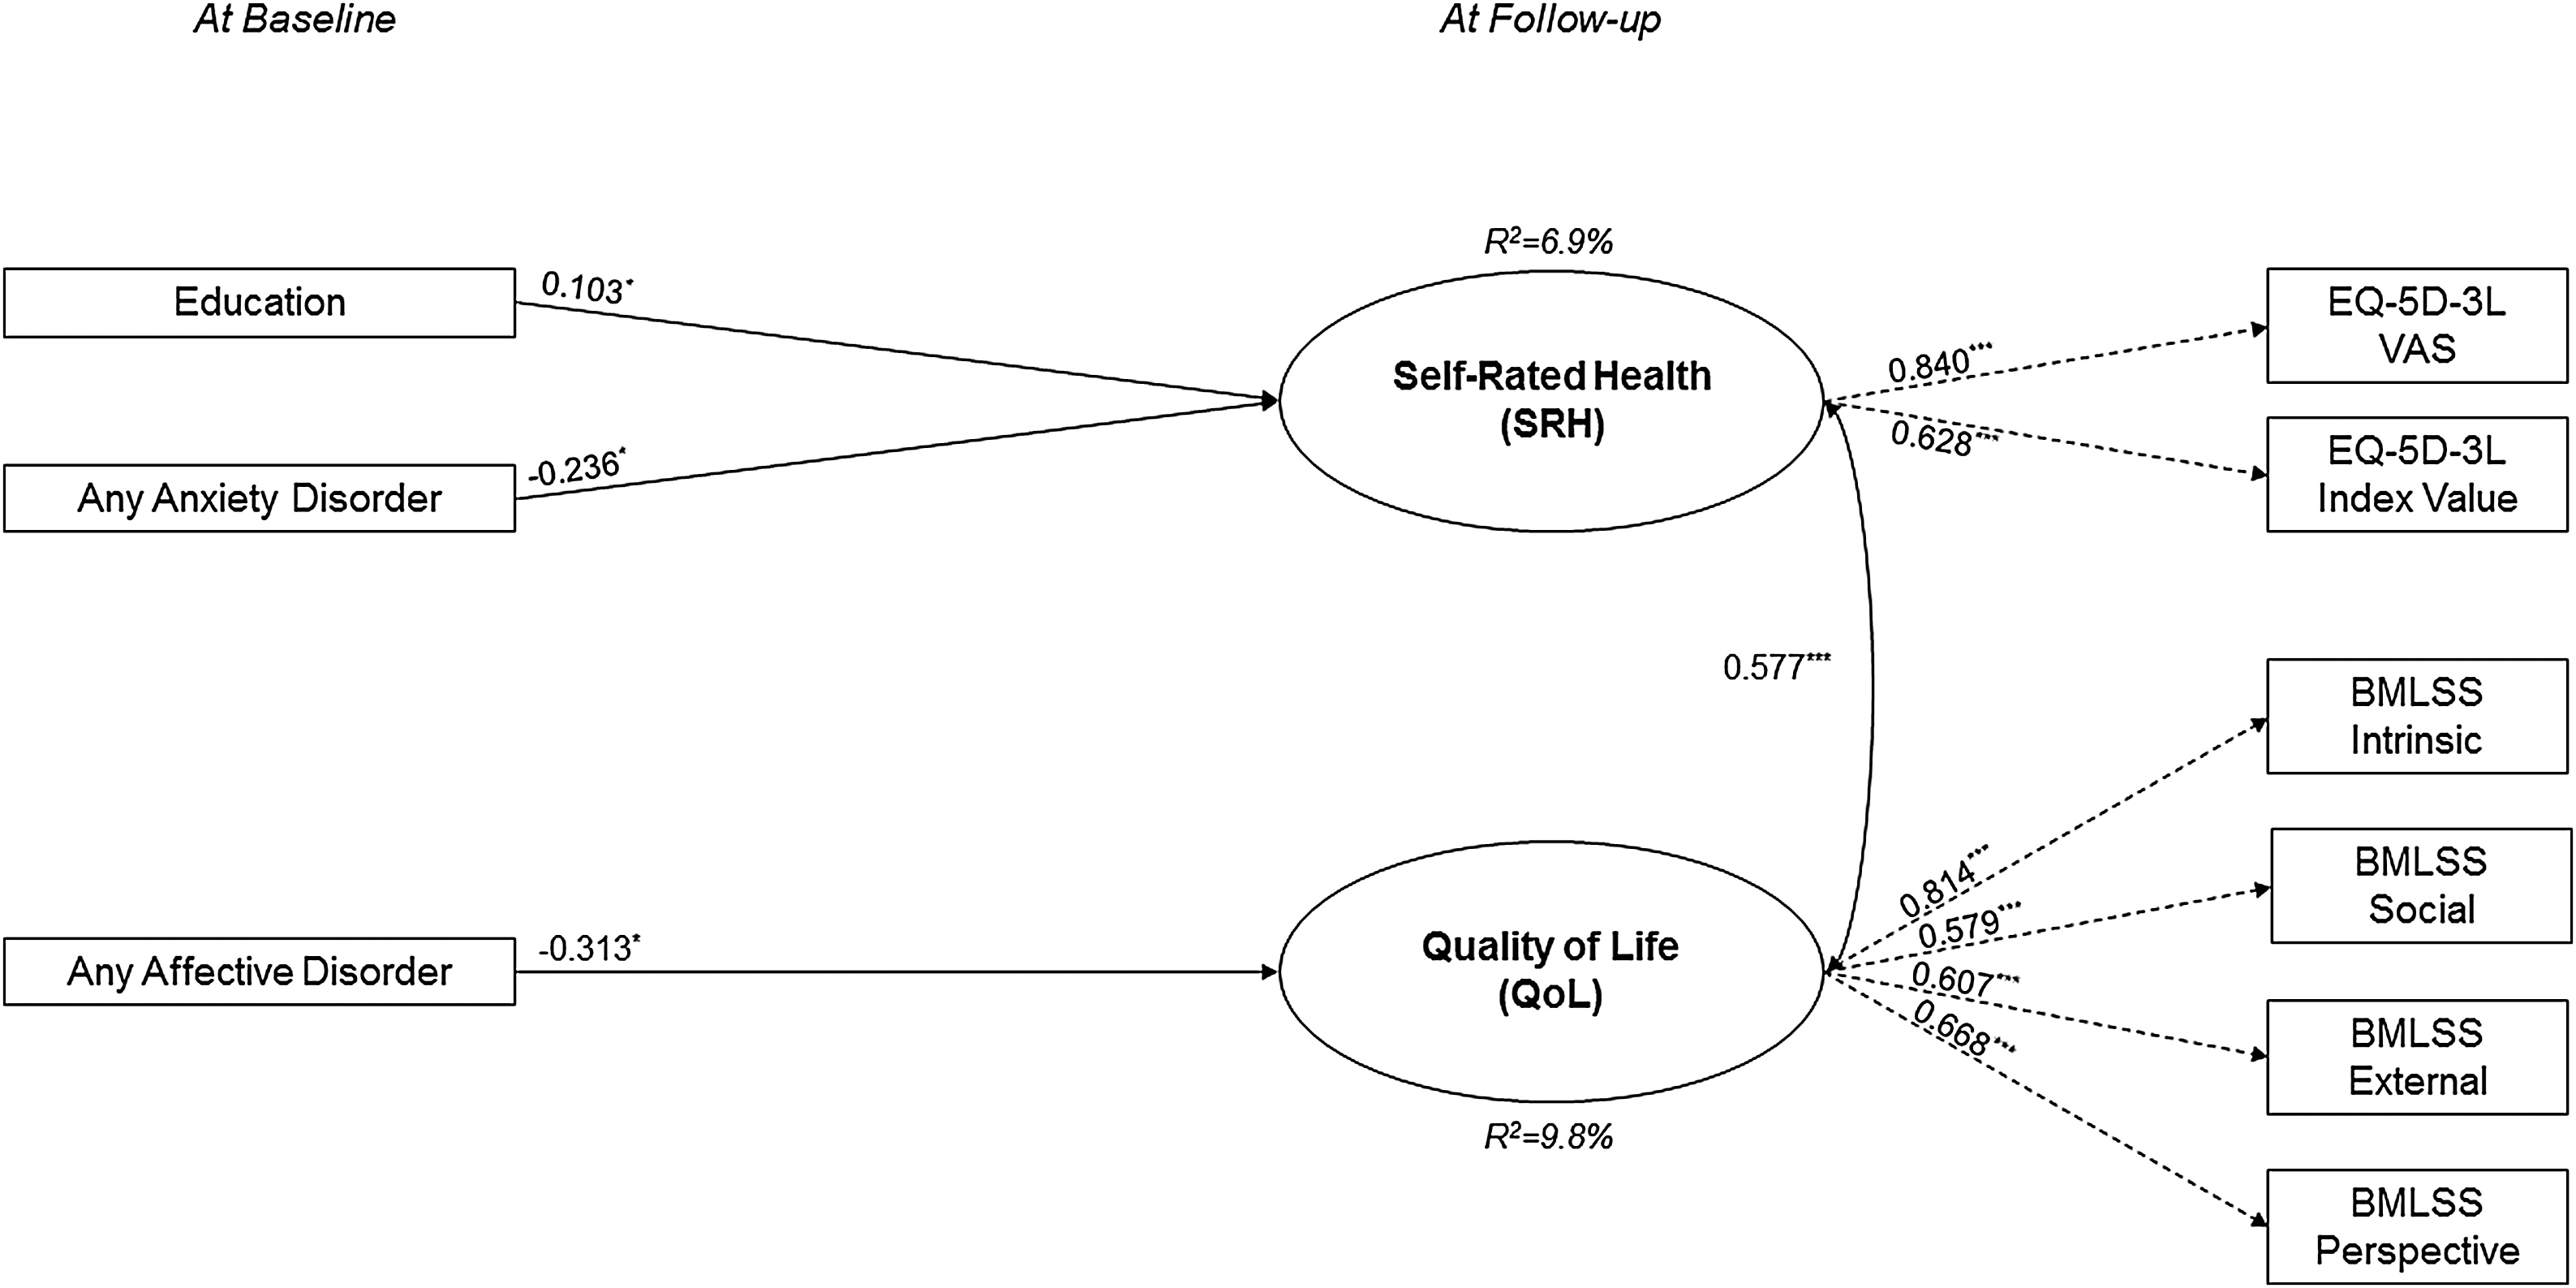
The initial longitudinal model demonstrated a good fit to the data (eFigure 3, eTable 3), which improved further after the elimination of sixteen insignificant paths (Fig. 2). In the final longitudinal model, lower SRH at follow-up was significantly predicted by lower education and any anxiety disorder at baseline, while lower QoL at follow-up was exclusively significantly predicted by any affective disorder at baseline. Its covariates, any affective disorder and any anxiety disorder, were significantly correlated with each other (r = 0.384, p ≤ 0.001) but neither of them with education.
Results of the trimmed model with non-significant associations removed for the longitudinal data (n = 829).
Model fit indices: χ2(23) = 0.624, p = 0.132; CFI = 0.990; TLI = 0.986; SRMR = 0.039; RMSEA = 0.020 (90%CI = 0.000-0.037).
*p ≤ 0.05, **p ≤ 0.01, ***p ≤ 0.001; standard error (SE) in parentheses; explained variance (R2) for each endogenous variable in italics.
Note: rectangles represent observed variables, ovals represent unobserved latent variables; rounded arrows represent covariances; straight arrows represent regressions, black arrows represent significant regressions; dashed arrows represent factor loadings.
OCD: obsessive-compulsive disorder; PTSD: posttraumatic stress disorder; UHR: ultra-high risk; EQ-5D-3L: 3-level version of the EQ-5D; BMLSS: Brief Multidimensional Life satisfaction Scale.
To account for the possible association between affective and anxiety disorders with SRH due to its anxiety/depression dimension, we performed additional sensitivity analyses of the two final models, wherein we excluded the anxiety/depression item from the EQ-5D-3 L summary score. These exclusions did not change the significant paths reported in Figs. 1 and 2.
Additionally, following the definition of the World Health Organization defining ‘Youth’ as the 15–24 age group (http://www.searo.who.int/entity/child_adolescent/topics/adolescent_health/en/), we examined separately if an age effect can be found. In the younger age group, we found significant paths for posttraumatic stress disorder with SRH and QoL in cross-sectional as well as longitudinal analyses which were not detected before (eTable 4). Further, UHR symptoms were no longer significantly associated with SRH or QoL. Basic symptoms had a significant association with both factors cross-sectionally and with QoL longitudinally (eTable 4, 5).
In the older age group, we found similar cross-sectional associations as in the whole sample (eTable 6). Additionally, any eating disorder and an obsessive-compulsive disorder were longitudinally significantly associated with QoL (eTable 7). Model fit indices for those age-adapted models were generally a bit lower than for the models with the whole sample.
Further we investigated if hallucinations (P4) and delusional ideas (P1-P3) were associated differentially to QoL and SRH. For the cross-sectional model we found an association of delusional ideas on SRH, while hallucinations were not significantly associated with neither QoL nor SRH (eTable 8). For the follow-up data the model did not change.
4. Discussion
Our unique community study on the association of sociodemographic variables, CHR symptoms, and mental disorders with QoL and SRH provides important new insights on the effect of UHR and basic symptoms on concurrent, but not prospective QoL and SRH. While age, gender, and education only had small effects, our results also highlight the relationship between mental disorders, particularly affective and anxiety disorders, and QoL and SHR both cross-sectionally and longitudinally.
4.1 Cross-sectional model
We identified significant cross-sectional associations between our clinical and sociodemographic variables with QoL and SRH, which differed slightly between QoL and SRH, especially regarding the sociodemographic variables.
As expected, sociodemographic variables only played a minor role and had a small effect on SRH but not QoL. In line with earlier studies in both younger [Reference Jörngården, Wettergen and von Essen53] and older samples [Reference König, Bernert and Angermeyer54, Reference König, Bernert, Angermeyer, Matschinger, Martinez and Vilagut55], we found an association between lower SRH and higher age. The frequent report of females exhibiting lower SRH, especially in physical health [Reference Ruhrmann, Paruch, Bechdolf, Pukrop, Wagner and Berning10, Reference König, Bernert and Angermeyer54, Reference Luo, Johnson, Shaw, Feeny and Coons56], was not supported by our data. On the contrary, in our sample, we found a weak association between lower SRH and male gender. This finding may be partly explained by the fact that in SEM, the association between two variables is estimated while simultaneously controlling for the influence of all other variables in the model. Therefore, the effect of female gender on SRH may have already been taken into account – and thus weakened – by the fact that anxiety and affective disorders as well as CHR symptoms, which all had stronger associations to SRH compared to gender, were positively correlated with female gender. The significant association between a lower educational level and lower SRH is in line with earlier studies [Reference König, Bernert and Angermeyer54–Reference Altenhöner, Philippi and Böcken58]. Lower SRH in persons with lower education has been related to fewer positive health behaviours, such as not smoking, observing healthy nutrition, exercising regularly, using sauna/massages, and taking vitamins, but not to a difference in preventive health care usage, such as medical check-ups [Reference Altenhöner, Philippi and Böcken58]. While these parameters were not assessed in our study, education was previously shown to be cross-sectionally unrelated to help-seeking for mental problems at baseline in the BEAR study [Reference Michel, Schnyder, Schmidt, Ochsenbein, Schimmelmann and Schultze-Lutter59], thus making it unlikely that an education-related under-use of health care played a role in the SRH-education relationship.
Mental disorders were most strongly associated with both QoL and SRH. Consequently, confirming our hypothesis and in line with previous findings, the largest effects on SRH and QoL were obtained for affective and anxiety disorders [Reference Brenes60–Reference Ambresin, Chondros, Dowrick, Herrman and Gunn62]. Additional significant, yet smaller effects were detected for somatoform disorders on SRH and eating disorders on QoL, despite the rather infrequent report of these disorders (somatoform disorders: n = 27; eating disorders: n = 12). The association between somatoform disorders and SRH concurs with other community surveys [Reference Mewton and Andrews63]. It might be conveyed by the inclusion of physical symptoms (e.g. pain/discomfort) in the EQ-5D-3 L, which, by definition, are also complained about by persons with somatoform disorders [Reference Rasmussen, Bernard and Harmsen64]. The effect of eating disorders on QoL supports earlier results on the impact of eating disorders on many domains of QoL [Reference de la Rie, Noordenbos and van Furth65]. This effect was still discernible against the effect of mood and anxiety disorders that were reported to be predictors of poor QoL in patients with eating disorders [Reference Martín, Padierna, Loroño, Muñoz and Quintana66].
In line with studies showing that QoL is generally poor in CHR samples [Reference Ruhrmann, Paruch, Bechdolf, Pukrop, Wagner and Berning10, Reference Bechdolf, Pukrop, Köhn, Tschinkel, Veith and Schultze-Lutter11, Reference Fusar-Poli, Rocchetti, Sardella, Avila, Brandizzi and Caverzasi24], we found significant associations of both UHR and basic symptoms with QoL and SRH. Partly confirming our expectations, basic symptoms had a stronger association with SRH than UHR symptoms, whereas for QoL, the association of UHR and basic symptoms did not differ. The sensitivity analyses revealed a stronger association between basic symptoms and SRH as well as between basic symptoms and QoL. Especially for the younger age group there was a strong effect which was also present longitudinally for basic symptoms and QoL. CHR individuals often report high levels of uncertainty and confusion because of the uncontrollable, inexplicable alterations in their mental processes that, consequently, interfere with QoL and SRH [Reference Klosterkötter67]. Such a ‘basal irritation’ resulting from the full insight in and self-experience of impairments in the early illness phase has been described within the conceptual framework of both basic symptoms [Reference Klosterkötter67] and the phenomenologically related self-disorders [Reference Schultze-Lutter and Theodoridou68] and likely conveys the poor QoL and low SHR associated with basic symptoms [Reference Priebe, Roeder-Wanner and Kaiser9, Reference Margariti, Ploumpidis, Economou, Christodoulou and Papadimitriou12, Reference Aghababian, Auguier, Baumstark-Barrau and Lancon13]. Because basic symptoms and also low-severity UHR symptoms do not necessarily interfere with functioning but are still experienced as ‘something not quite right’, the stronger effect on SRH compared with QoL might reflect the self-perception of a compromised mental health status. In contrast, QoL might rather be compromised by impaired functioning, which is more likely in the presence of both UHR and basic symptoms [Reference Schultze-Lutter, Michel, Ruhrmann and Schimmelmann34].
The most noteworthy result, however, is that CHR symptoms, even when they occur rather infrequently and below the threshold for psychosis-risk criteria, have a negative effect on both SRH and QoL in the community, which is independent of the effect of non-psychotic mental disorders. This emphasises their clinical relevance and the need to address these symptoms not only in specialized services, but in all mental health care [Reference Schultze-Lutter, Michel, Ruhrmann and Schimmelmann34, Reference Ruhrmann, Schultze-Lutter and Klosterkötter69].
The finding of differential effects of delusional ideas on SRH emphasizes the need to address the differential effects of perceptive and non-perceptive psychosis-risk phenomena. Our finding is in line with the finding that attenuated delusional ideas co-occur more likely with functional deficits [Reference Schimmelmann, Michel, Martz-Irngartinger, Linder and Schultze-Lutter70] and supports current critical discussion on the psychopathological value of hallucinatory experiences [Reference Zhang, Xu, Tang, Cui, Wei and Tang71].
4.2 Longitudinal findings
Overall, cross-sectional predictors assessed at baseline seem to have few long-lasting effects on both SHR and QoL over approximately three years. Thus, in the longitudinal model, lower SRH at follow-up was significantly predicted only by lower education and the presence of any anxiety disorder at baseline, while lower QoL at follow-up was significantly predicted exclusively by the presence of any affective disorder at baseline. In doing so, the explained variance of SHR and QoL at follow-up was reduced by more than half in comparison to the cross-sectional model.
The negative influence of low baseline educational level, in terms of highest school education, on SRH at follow-up can be assumed to be caused by the great stability of school educational level in a sample with an age range of 16–40 years at baseline, since the majority had already left school at baseline. Thus, this finding supports and extends previous cross-sectional findings on the association between low SHR and low education levels [Reference König, Bernert and Angermeyer54, Reference König, Bernert, Angermeyer, Matschinger, Martinez and Vilagut55, Reference Mielck, Reitmeir, Vogelmann and Leidl57].
The strong effect of affective and anxiety disorders on QoL and SRH might also be associated by a persistence of these disorders, but also supports their earlier reported strong influence on subjective well-being and health evaluation. A similar long-term influence of mental health problems on QoL was found in children and adolescents in the ‘BEfragung zum seeLischen WohLbefinden und VerhAlten’ (BELLA; English: ‘Survey on mental wellbeing and behaviour’) study [Reference Zhang, Xu, Tang, Cui, Wei and Tang71]. Both our findings and those of the BELLA study emphasize the long-term influence of mental health problems, especially affective and anxiety disorders, on QoL and SRH [Reference Otto, Haller, Klasen, Hölling and Bullinger72] and the particular persistent burden associated with these disorders [Reference Vigo, Thornicroft and Atun1]. The missing long-term effect of baseline CHR symptoms on QoL and SRH could be explained by the known state-like character of CHR symptoms and the high fluctuation and remission rates of these symptoms [Reference Michel, Ruhrmann, Schimmelmann, Klosterkötter and Schultze-Lutter73], with a tendency to be less frequent in older age groups [Reference Schimmelmann, Michel, Martz-Irngartinger, Linder and Schultze-Lutter70]. In our community sample only a small percentage of 2.4% fulfilled current CHR criteria (including onset or worsening within the past 12 months and at least weekly occurrence in the past month) [Reference Schultze-Lutter, Michel, Ruhrmann and Schimmelmann34]. A review of psychiatric comorbidity across different stages of schizophrenia showed that anxiety and depressive disorders frequently co-occur throughout the course of the illness, including the prodrome [Reference Buckley, Miller, Lehrer and Castle74], our results further support the idea of depression and/or anxiety being transdiagnostic markers of severity [Reference Schultze-Lutter, Klosterkötter, Gaebel and Schmidt75] rather than the far more infrequent CHR criteria being such a transdiagnostic marker.
Overall, our results indicate that, in addition to established mental disorders, CHR symptoms are important treatment targets to improve QoL and SRH over the short-term, while mental disorders, particularly depression and anxiety, should be targeted as early as possible, especially when combined with a low education level, to avoid long-term reductions of QoL and SRH.
4.3 Strengths and limitations
Alongside the strengths of our study, such as the large sample size and clinician-rated clinical assessments, the restricted age range (16–40 years at baseline) limits wider generalisability. This age span represents the period when psychotic symptoms and disorders have their onset [Reference Kirkbride, Fearon, Morgan, Dazzan, Morgan and Tarrant35, Reference McGrath, Saha, Al-Hamzawi, Alonso and Andrade36], which was the reason for its initial selection [Reference Schultze-Lutter, Michel, Ruhrmann and Schimmelmann34]. The availability of not only cross-sectional but also longitudinal data is another strength of our study, facilitating a first effort to disentangle cause and effect. Yet, the rather long observation period with a median duration of 39 months might have obscured effects that influence the state-dependent concepts of SRH and QoL over shorter time intervals.
Furthermore, the complex construct of QoL, which still lacks consensus on its definition, may be influenced by additional factors [Reference Post76] such as self-esteem, mastery, autonomy, and self-efficacy [Reference Zissi, Barry and Cochrane77] as well as social interactions perceived as stigma experiences [Reference Yanos, Rosenfield and Horwitz78]. These factors should be additionally considered in future studies.
Another strength of our study is the distinction between QoL and SRH that allowed us to detect differential relationships. If replicated, this distinction may also have important clinical implications, as it suggests tailoring interventions to improve QoL and SRH by targeting the factors most relevant for the respective construct.
4.4 Conclusion
Our community findings confirm that CHR symptoms already impose subjective burden and, therefore, are clinically relevant outside clinical samples, already when CHR criteria are not fulfilled. Yet, this negative effect might be restricted to the presence of frequently fluctuating or remitting CHR symptoms, thus not exerting a long-term impact on QoL and SRH. This was different with regard to the frequently untreated, rather persistent or even exacerbating affective and anxiety disorders in the community, which demonstrated both short- and long-term influence on QoL and SRH. The persistent influence of educational level on SRH, however, underlines the importance of information campaigns improving mental health literacy in individuals of all educational levels.
Declaration of Competing Interest
Drs Michel, Schmidt, Schnyder, Flückiger, and Schultze-Lutter, and Ms Käufeler (MSc) have declared that they have no conflicts of interest in relation to the subject of this study.
Dr Schimmelmann has been a consultant and/or advisor to, or has received honoraria from AstraZeneca, Bristol-Myers Squibb, Eli Lilly, Janssen, Novartis, and Shire.
Funding
This study was supported by two project-funding grants from the Swiss National Science Foundation (SNFS), grant number 32003B_135381 and 32003B_155951 (to Drs Schultze-Lutter and Schimmelmann).
Acknowledgement
None.
Appendix A Supplementary data
Supplementary data associated with this article can be found, in the online version, at doi:10.1016/j.eurpsy.2019.08.008.


Comments
No Comments have been published for this article.