


Introduction
Parasites are an essential part of biodiversity acting as ecological resource specialists in communities (Hoberg and Brooks, Reference Hoberg and Brooks2015; Hoberg et al., Reference Hoberg, Boeger, Brooks, Trivellone and Agosta2022a). Using parasites as probes for discovering biological diversity is an efficient way to explore biodiversity at large spatial and temporal scales and this also enables detailed investigations of host–parasite associations at the level of both communities and ecosystems (Gardner and Campbell, Reference Gardner and Campbell1992a, Reference Gardner and Campbell1992b). Because more than half of all species of animals have a parasitic life style, parasites are important components of ecosystems and contribute in myriad ways to ecosystem function (Gardner et al., Reference Gardner, Diamond and Racz2022). Parasitism applies selective pressure on hosts, and in some cases, it may eventually drive host evolution (Pilosof et al., Reference Pilosof, Fortuna, Cosson, Galan, Kittipong, Ribas, Segal, Krasnov, Morand and Bascompte2014, Reference Pilosof, Morand, Krasnov and Nunn2015; Runghen et al., Reference Runghen, Poulin, Monlleó-Borrull and Llopis-Belenguer2021). Due to the anthropogenic impacts caused by global climate change, deforestation and general global defaunation, the biosphere faces alteration of ecological functions and high-speed species loss with accelerating extinction events every year (Barnosky et al., Reference Barnosky, Matzke, Tomiya, Wogan, Swartz, Quental, Marshall, McGuire, Lindsey, Maguire, Mersey and Ferrer2011; Raven and Miller, Reference Raven and Miller2020; Wood et al., Reference Wood, Welicky, Preisser and Essington2023). From the levels of populations through ecosystems, climate change also appears to reshuffle mutualistic interactions among species (Bascompte et al., Reference Bascompte, Garcia, Ortega, Rezende and Pironon2019). It is clear that we are behind the curve in biodiversity inventories, with the earth losing species at ever-increasing rates, with no hope of it slowing down. Because time is short, with species vanishing rapidly, it appears that the methods of multi-species network analysis [sensu Bascompte et al. (Reference Bascompte, Garcia, Ortega, Rezende and Pironon2019)] may offer a partial solution to understanding global parasite biodiversity by mapping, visualizing and understanding ecological connectivity before the links are gone forever (Raven and Miller, Reference Raven and Miller2020).
Network structures describe overall patterns of interconnected biodiversity and help to provide an understanding of ecological patterns and processes in biological communities. Network analysis is a powerful tool that can be used to visualize how species interact and quantitatively describe these interactions, providing insights on both the resilience and stability of systems under study. In our work, we define community in the ecological sense as assemblages of individuals of several species that occur together (Poulin, Reference Poulin2010; Wiens, Reference Wiens1989). Criteria for the study of parasites and their hosts in a community/network analysis are based on 2 separate but related types of interactions including: (1) species of parasites found in multiple species of hosts and (2) species of parasites occurring in only a single species of host. In visualizing network modelling, networks are represented by nodes connected by links that signify interactions, describing ecological structures and biological patterns.
Bipartite network analysis (BNA) (Newman et al., Reference Newman, Barabási and Watts2006; Borgatti et al., Reference Borgatti, Mehra, Brass and Labianca2009; Dormann, Reference Dormann2020) is a quantitative method that can be used for integrating and synthesizing complicated datasets such as host–parasite or pollinator–plant assemblages in ecological communities. BNA is a robust analytical method that can be used to understand, anticipate and respond to accelerating environmental changes (Brooks et al., Reference Brooks, Hoberg, Gardner, Boeger, Galbreath, Herczeg, Mejía-Madrid, Racz and Dursahinhan2014, Reference Brooks, Boeger and Hoberg2022).
We used network methods to examine the intimate relationships among communities of subterranean rodents and their parasites as part of our work on global parasite biodiversity. In this work, we focus on subterranean rodents because this ecological partition was logistically more tractable than including all rodents, for example, and focusing on 1 zoogeographic region sequentially provided interesting questions related to biogeography, host range, ecological fitting and various questions relative to general host–parasite ecology and biodiversity. To accomplish this and targeting the niche space of parasites and their subterranean rodent hosts, we focused on these rodent/parasite relationships in the separate zoogeographic regions established most solidly by Wallace (Reference Wallace1876). From the Ethiopian zoogeographic region, we studied recorded parasite diversity from 10 species of rodents spanning 7 genera in 3 families (Bathyergidae, Chrysochloridae, Muridae). From the Neotropical region, 19 species of subterranean rodents of 2 genera in 2 families (Ctenomyidae, Octodontidae) were analysed. In the Palaearctic region, we obtained and studied parasite records from 17 species of rodents across 8 genera in 2 families (Cricetidae, Spalacidae). Finally, we studied parasite diversity in the Nearctic region by obtaining all available geomyid/helminth parasite records and we included in the analysis results from our own studies and included data on 19 species of hosts across 5 genera in the family Geomyidae (see summary in Dursahinhan et al., Reference Dursahinhan, Kenkel and Gardner2023).
The elimination of the tapeworm disease echinococcosis by the 1970s from the indigenous Yupik population of St. Lawrence Island, Alaska was executed in the DAMA protocol fashion by R. L. Rausch and colleagues starting in the early 1950s. Briefly, identification and documentation of disease caused by Echinococcus multilocularis in the Yupik population of the village of Gambell was made and the life cycle of the cestode was determined and monitored in the Arctic fox, domestic dog and vole population. New cases of the disease were eliminated by the 1970s with consistent application of deworming chemicals in the dogs as well as the introduction of snowmobiles supplanting dogs as transportation (Rausch and Fay, Reference Rausch, Fay, Craig and Pawlowski2002).
The current study applies the first and second steps of the DAMA protocol which was first fully implemented under that name in Budapest, Hungary, summarized by Földvári et al. (Reference Földvári, Rigó, Jablonszky, Biró, Majoros, Molnár and Toth2011, Reference Földvári, Szabó, Tóth, Lanszki, Zana, Varga and Kemenesi2022): here, Földvári documented the existence of a problem of transmission of spirochaetes (Borrelia spp.) to humans by ticks, then assessed and monitored the problem over time by additional collecting and identification. Finally, his group convinced the politicians to install public toilets which stopped the transmission of pathogens by decreasing exposure of people to infected ticks.
The protocol includes documentation, assessment, monitoring and action for biologists and managers to decrease or ameliorate biodiversity loss and its associated risks to human societies (Brooks et al., Reference Brooks, Hoberg, Gardner, Boeger, Galbreath, Herczeg, Mejía-Madrid, Racz and Dursahinhan2014). Implementation of the DAMA protocol is a several part processes outlined briefly as follows:
• Documentation: To understand complex biological interactions, we need to identify and document parasite distribution in as much detail as possible (Hoberg, Reference Hoberg, Reaka-Kudla, Wilson and Wilson1997; Brooks and Hoberg, Reference Brooks and Hoberg2000; Hoberg et al., Reference Hoberg, Kutz, Cook, Galaktionov, Haukisalmi, Henttonen, Laaksonen, Makarikov, Marcogliese and Meltofte2013). This part includes broad scale survey and inventories of host and parasite assemblages over geographic space [sensu Gardner and Campbell (Reference Gardner and Campbell1992a, Reference Gardner and Campbell1992b)].
• Assessment: The analysis of our findings is fundamental for biodiversity and ecological comparison. Complete documentation of helminth species diversity from all known distributed areas of subterranean rodents and their endoparasites provides an opportunity to assess their host–parasite interactions over time. Data collected from the documentation step of the protocol are used to create historical linkages and maps.
• Monitoring: Multiple complete and comprehensive studies must be carried out to achieve a successful monitoring phase, and the multilayer network offers that (Runghen et al., Reference Runghen, Poulin, Monlleó-Borrull and Llopis-Belenguer2021). This stage requires reassessing symbionts and recording any differences that appear from year to year. Furthermore, these studies need to be performed at regular intervals to observe the dynamics of the host–parasite interactions and detect any changes in the dynamics as soon as they occur.
• Action: Due to lack of research on variation of endoparasite diversity and interactions among subterranean communities, we cannot take proper proactive measures. However, with an integrated knowledge of past research, adequate documentation and comprehensive assessment, we can propose proactive steps to mitigate risks against unwanted results such as emerging infectious disease and extinctions of species among community members (Brooks et al., Reference Brooks, Hoberg, Gardner, Boeger, Galbreath, Herczeg, Mejía-Madrid, Racz and Dursahinhan2014).
This study investigates the interactions among subterranean rodents and their endoparasites at the species level from the 4 major zoogeographic regions using BNA to address the following questions.
(1) What are the network connections among subterranean rodents and their endoparasites? How can we visualize the complex connections among parasites and their host species of subterranean rodents?
(2) How are they connected? That is, are the parasites that occur in more than 1 species of subterranean rodent showing up in the network graphs because they currently or in the past share similar ecological niche space. This part of the analysis is really an investigation into ecological fitting (Janzen, Reference Janzen1985).
(3) Are there structural differences in the network among these geographically isolated subterranean communities? Or are the networks similar across different phylogenetically disparate but ecologically convergent rodent/parasite communities. Do the convergently similar subterranean rodents and their parasites show similar network structures, such as similar number of species of parasites shared among species of hosts, and similar number of helminth or protistan parasites occurring in phylogenetically disparate groups of rodents?
(4) What are the major parasite groups that are in the current assemblages?
(5) Can the risk of extinction of an ecological parasite lineage be estimated using the networks that we developed in this subterranean rodent system?
Materials and methods
From a review of the 131 available published papers on parasites from subterranean rodents from 4 zoogeographic regions, we accumulated data on 174 species of endoparasites from a potential of 163 total species of subterranean rodents. All parasite data/references can be accessed from Dursahinhan et al. (Reference Dursahinhan, Kenkel and Gardner2023). To describe and assess differences in zoogeographic space of how assemblages of subterranean rodents interact with their communities of parasites, we used a bipartite network modelling framework. Data were accumulated into a matrix of presence/absence notations (0 = absent; 1 = present) for each species of parasite for each species of host separated into their respective zoogeographic regions. These matrices are provided fully in Supplementary data tables (see hyperlinked tables: S1, S2, S3 and S4). Using the matrix set given, we applied the networklevel function of the R package bipartite (Dormann et al., Reference Dormann, Frueund, Bluethgen and Gruber2009; Poisot et al., Reference Poisot, Stouffer and Kéfi2016) to estimate 12 indexes describing the structure of each network; these parameters indicate the levels of specialization, compartmentalization, nestedness and risk of host/parasite extinction. For the networks of each zoogeographic region the following indexes were estimated:
• Connectance (CON): The proportion of realized pairwise host–parasite interactions among all potential interactions (Blüthgen et al., Reference Blüthgen, Menzel and Blüthgen2006; Runghen et al., Reference Runghen, Poulin, Monlleó-Borrull and Llopis-Belenguer2021).
• Compartment (C): A group of clustered host and parasite assemblages that are tightly linked to each other (Lewinsohn et al., Reference Lewinsohn, Prado, Jordano, Bascompte and Olesen2006). A network can have multiple compartments that represent subcommunities.
• The number of compartments (NC): The number of compartments determines the number of assemblages of recognizable subsets of interacting hosts and parasites more linked within than across subsets (Lewinsohn et al., Reference Lewinsohn, Prado, Jordano, Bascompte and Olesen2006).
• Compartment diversity (CD): Compartment diversity was determined by using the Shannon diversity index, and it indicates the probability level of differences between compartments (Shannon and Weaver, Reference Shannon and Weaver1949; Latham and Scully, Reference Latham and Scully2004).
• Links per species or linkage density (LD): The structural connections of the host–parasite interactions are measured by linkage density by calculating the number of links divided by the total number of nodes (Fath and Halnes, Reference Fath and Halnes2007). Linkage density is a critical parameter used to determine the degree of connectedness within the community (Gaedke, Reference Gaedke1995).
• Nestedness (NSD): Can occur when specialists (species of parasites associated with subsets of the host species) interact with more generalist parasite species (Bascompte et al., Reference Bascompte, Jordano, Melián and Olesen2003; Jordano et al., Reference Jordano, Bascompte, Olesen, Waser and Ollerton2006). Estimates of nestedness are used to compare common structures in mutualistic bipartite networks.
• NODF: Another way to test nestedness in networks is to measure a nestedness metric based on the overlap and decreasing fill (NODF) (Almeida-Neto et al., Reference Almeida-Neto, Guimarães, Guimarães, Loyola and Ulrich2008).
• Shannon diversity index (SDI): One of the commonly used indices is Shannon diversity. It obtains a quantitative estimation of biological variables to compare species in a community (Shannon and Weaver, Reference Shannon and Weaver1949; Clarke and Warwick, Reference Clarke and Warwick2001).
• C-score: The C-score calculates higher-level species and represents the average number of checkerboard units for each unique species pair in the community. The input matrix was set to host species as columns and to parasite species as rows (Stone and Roberts, Reference Stone and Roberts1990; Gotelli and Rohde, Reference Gotelli and Rohde2002).
• Extinction slope (ES): The BNA also simulates the extinction of a species from a community by randomly removing a participant host, and parasite species from the matrix. The process determines the sequence of extinctions represented by a slope (Memmott et al., Reference Memmott, Waser and Price2004).
• Robustness: A measure of the tolerance of the network to species extinction. Greater extent of connected components determines topological robustness by measuring degree of connectivity within the specified networks (Evans et al., Reference Evans, Pocock and Memmott2013; Sheykhali et al., Reference Sheykhali, Fernández-Gracia, Traveset, Ziegler, Voolstra, Duarte and Eguíluz2020).
• Vulnerability: The measure of vulnerability is another way to determine ecosystem stability and resilience in an active community. The metrics represent the weighted mean (across nodes within a community) of the number of effective partners (hosts in this analysis) (Bersier et al., Reference Bersier, Banašek-Richter and Cattin2002).
The materials used in this study were extracted from published parasite records (Dursahinhan et al., Reference Dursahinhan, Kenkel and Gardner2023). In addition, new data were included from collections we made in Oregon, Colorado, Nebraska, Mongolia, and Bolivia. All specimens of parasites collected during this study were deposited in the parasite collections of the H.W. Manter Laboratory of Parasitology, University of Nebraska State Museum. Specimens of mammals were deposited either in the Division of Zoology in the University of Nebraska State Museum, or the Division of Mammals in the Museum of Southwestern Biology, University of New Mexico (Yates et al., Reference Yates, Jones, Cook, Wilson, Cole, Nichols, Rudran and Foster1996; Galbreath et al., Reference Galbreath, Hoberg, Cook, Armién, Bell, Campbell, Dunnum, Dursahinhan, Eckerlin, Gardner and Greiman2019). All datasets are available through their respective museum collection database systems.
Results
A total of 282 host–parasite records were identified based on 174 endoparasite species collected and reported from 65 species of subterranean rodents from throughout 4 major zoogeographic regions. Across all 4 geographic areas that we studied, networks that were constructed show variation in structure, species diversity and unique combinations of connectance.
Ethiopian region
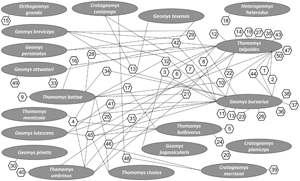
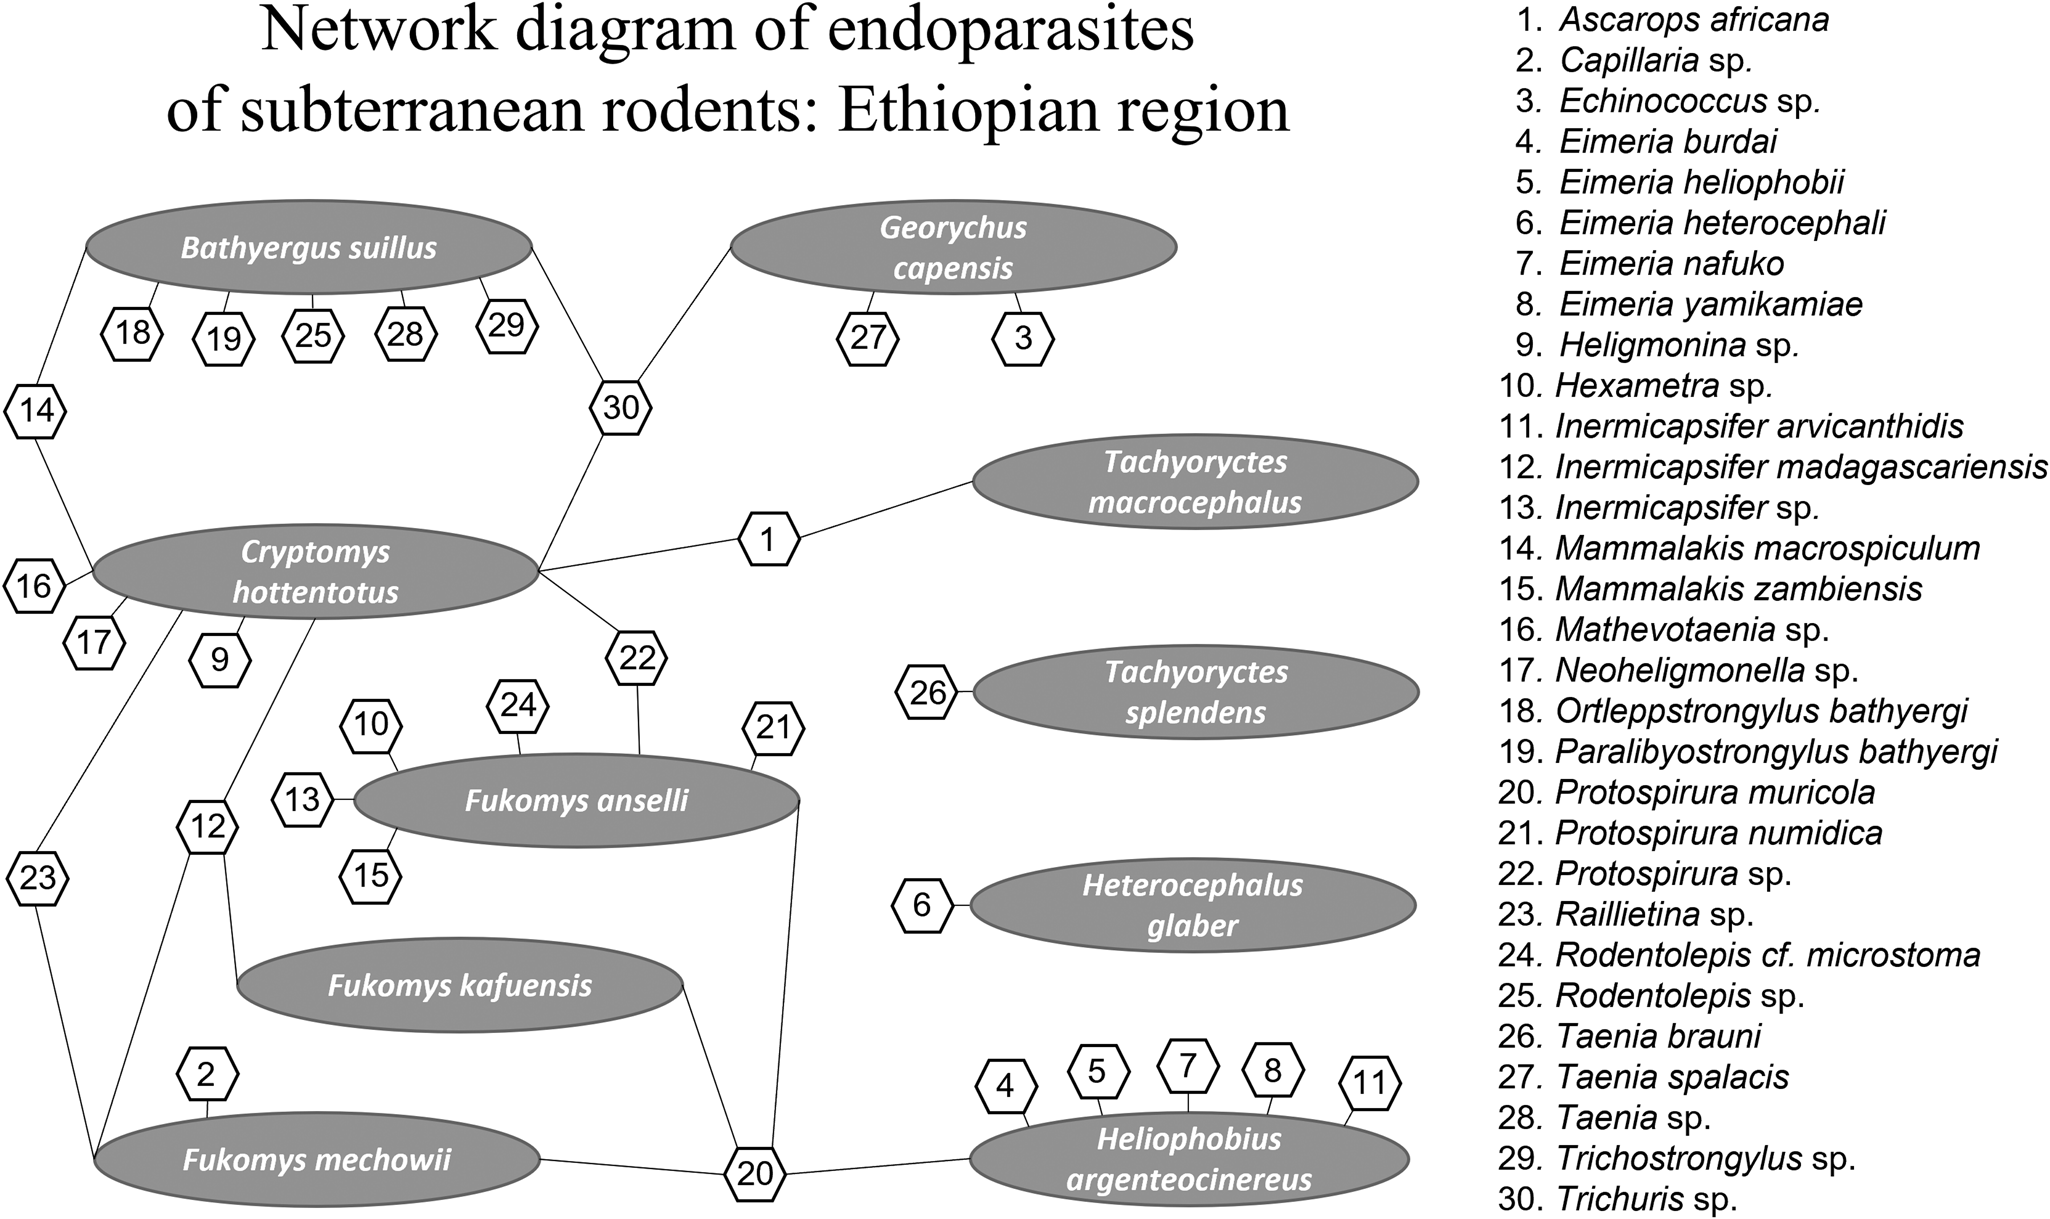
For the Ethiopian region network analysis, a total of 30 endoparasite species and 10 host species were included. Of those, 23 occur as single host–parasite associations, meaning that these species of parasites are not shared among various species of subterranean rodent hosts in Africa. Protospirura muricola, a nematode that occurs in the stomachs of rodents appears to be the most common parasite occurring in the subterranean Ethiopian rodent community. It is also the most connected of the species of parasites analysed and is known to have a complex life cycle, utilizing arthropods as intermediate hosts (Quentin, Reference Quentin1969). Thus, a total of 41 interactions were determined by connectance links among nodes with parasite species ranging from 1 to 4 per host (see Fig. 1). The greatest number of endoparasites in any 1 species of subterranean rodents in Africa was found in the common mole rat, Cryptomys hottentotus from which we recorded 9 helminth species. The second greatest number of helminth parasites recorded are from the cape dune mole rat, Bathyergus suillus and Ansell's mole rat, Fukomys anselli both having 7 species of endoparasites.
Network diagram plot derived from bipartite analysis of parasites of subterranean rodents in the Ethiopian region. Oval shapes indicate host species and hexagon shapes indicate parasite species. Numbers in hexagons indicate parasite species shown on the right side of the figure. Lines indicate links between and among hosts and parasites.
Endoparasite taxonomic summary
Subterranean rodent endoparasites in the Ethiopian region can be assigned to 14 families (see Fig. 1). Nematodes of the family Spiruridae showed 7 species interactions (17%) indicating that spirurids were the most commonly reported of the parasites, followed by 6 species interactions (15%) for cestodes of the family Anoplocephalidae. Nematodes of the families Ascarididae, Capillariidae and Molineidae are rare and showed only single-species interaction (1.2%) with their subterranean rodent hosts.
Palaearctic region
For the Palaearctic network analysis, a total of 71 endoparasite taxa and 17 host species were included. Of those, 60 species occur as single host–parasite associations, meaning that these species of parasites are not shared among various species of subterranean rodent hosts in the Palaearctic region. A total of 86 host–parasite interactions were found by connectance links with parasite species ranging from 1 to 4 per host (see Fig. 2). Larvae of E. multilocularis (Cestoda: Taeniidae) have been recorded from 4 species of subterranean rodents, and even though the adults occur in carnivores, it appears as the most generalist parasite in this rodent–host community as it shows little discrimination for infection of various species. The greatest number of endoparasite species was reported from the lesser mole rat, Nannospalax leucodon, which had 20 species. The second greatest was the middle-east blind mole rat, Nannospalax ehrenbergi, with 17 species of endoparasites being recorded.
Network analysis plot of endoparasites of subterranean rodents in the Palaearctic region. Oval shapes indicate host species and hexagon shapes indicate parasite species. Numbers in hexagons indicate each parasite species that corresponds to the parasite species list on the right side of the figure. Lines indicate links among hosts and parasites.

Endoparasite taxonomic summary
The total number of the endoparasite families was 19. The family Eimeriidae had 33 species interactions (37%) reported, followed by 12 species interactions (13%) from the family Taeniidae. The families Catenotaeniidae, Dicrocoeliidae, Mesocestoididae, Spirocercidae and Strongylidae each had only a single species of interaction (1.1%) reported.
Nearctic region
For the Nearctic region, a total of 50 species of endoparasites and 19 host species were analysed; of those, 25 occur as single host–parasite associations. A nematode species, Ransomus rodentorum Hall, Reference Hall1916 (Nemata: Strongylidae) found in 7 host species of the family Geomyidae, was the most generalist parasite in the community. A total of 97 interactions were determined by connectance links between nodes with parasite species ranging from 1 to 7 per host (see Fig. 3). The northern pocket gopher, Thomomys talpoides, had 23 species which is the highest number of endoparasites reported for the Nearctic region network. The second-highest number of parasite species occurred in the plains pocket gopher, Geomys bursarius, having 22 species of endoparasites reported.
Network analysis of endoparasites of subterranean rodents in the Nearctic region. Oval shapes indicate host species and hexagonal shapes indicate parasite species. Numbers in hexagons indicate each parasite species corresponding to the parasite species list in the figure. Lines indicate links among hosts and parasites.

Endoparasite taxonomic summary
Endoparasite species diversity was represented by 18 families. Anoplocephalidae and Hymenolepididae had 10 species interactions (21%) reported, followed by 5 species interactions (10%) from the family Eimeriidae. The families Ascarididae, Aspidoderidae, Heligmonellidae, Moniliformidae, Paruterinidae, Polymastigidae, Strongylidae, Taeniidae and Trichuridae each had only a single species of interaction (2%) reported.
Neotropical region
For the Neotropical region network analysis, a total of 27 endoparasite taxa and 19 host species were used; of these, 18 occurred as single host–parasite associations. In this group, the unidentified species of Paraspidodera sp. Travassos, 1914 (Aspidoderidae: Rhabditida), found in 8 host species, was the most generalist parasite in the community. In addition, a protozoan species, Eimeria opimi was found in 6 host species, determined as the second most generalist parasite in the community. A total of 50 interactions were indicated by connectance links between nodes with parasite species ranging from 1 to 8 per host (see Fig. 4). The Talas tuco-tuco, Ctenomys talarum had 11 species which is the highest number of endoparasites reported for the Neotropical network. The second-highest number of parasite species occurred in the highland tuco-tuco, Ctenomys opimus, having 7 endoparasite species.
Network analysis of endoparasites of subterranean rodents in the southern Neotropical region. Oval shapes indicate host species and hexagonal shapes indicate parasite species. Numbers in hexagons indicate each parasite species corresponding to the parasite species list on the left side of the figure. Lines indicate links among hosts and parasites.

Endoparasite taxonomic summary
The endoparasite species diversity was represented by 11 families. The families Trichuridae and Trichostrongylidae both had 5 species interactions (18.5%) reported, followed by 4 species interactions (14.8%) from Eimeriidae. The families Ancylostomatidae, Davaineidae, Heligmonellidae and Strongylidae each had only a single species of interaction (3.7%) reported.
Network index summary
We considered 22 index values that describe various levels of network connectivity resulting from analysis of the host–parasite associations we discovered during our work. To simultaneously describe the connectance among both host and parasite communities, 4 of these 22 indices were found to have greater meaning in interpretation of connectance between and among the host–parasite associations. This is because we focused on the change in the community of parasites in hosts over time. In addition, 4 indices were used for simultaneous assessment of both host and parasite communities. The network index parameters for all zoogeographic regions are presented in Table 1.
Indexes of subterranean rodent host–parasite networks from Palaearctic, Ethiopian, Nearctic and Neotropical regions

Some indices highlighted in bold are used in the network analysis to determine the network structure and associations of each subterranean rodent parasite and host communities.
The Ethiopian subterranean host–parasite community network shows a greater level of connectance (0.1367) and greater nestedness (host: 24.9981; parasite: 24.6716) than any other network that we analysed. However, our analysis showed that the Nearctic network was more nested than all others when compared using the NODF index (=26.1923). Also, the Nearctic network had a greater number of links per species (1.4058), a higher linkage density (8.1237) and a higher Shannon diversity index (4.5747) as compared to all other zoogeographic regional networks that we analysed. However, the lowest links per species (0.9773) were reported from Palaearctic host–parasite communities. The lowest linkage density (3.9024) and Shannon diversity index (3.7136) values were reported from Ethiopian host–parasite communities. The highest number (8) and diversity of compartments (2.5749) were found in the Palaearctic network system. In contrast, the lowest number of compartments (3) occurred in the Ethiopian network.
The highest C-score values were reported from the Palaearctic network for both hosts (0.9159) and parasites (0.8066). In contrast, the lowest C-score values were reported from the Neotropical subterranean host (0.7969) and Nearctic parasite (0.642) communities. The highest ES was recorded from the Nearctic host (1.5784) and Ethiopian parasite (2.6848) communities. Nevertheless, the smallest ESs were reported from the Palaearctic host (1.1243) and Neotropical parasite (1.9603) communities.
The Nearctic host (0.6132) and Ethiopian parasite (0.7173) communities reported the highest network robustness values. Conversely, the lowest robustness index was recorded from the Palaearctic host (0.5300) and Neotropical parasite (0.6596) communities. The vulnerability indices show that the Nearctic host (13.2887) and Neotropical parasite (4.8775) communities were most vulnerable. Nonetheless, the least vulnerability indices were reported in the Neotropical host (4.8000) and Palaearctic parasite (1.7111) communities (see Table 1).
Discussion
In the present study, we assessed subterranean rodent host–endoparasite network interactions and found several common patterns of similarity across all zoogeographic regions. Also, there was a high-level support of variation among these geographically isolated communities even though they all share the same niche of living in a subterranean ecotope.
No single species occurred in all subterranean rodent communities. However, numerous species in the genera Eimeria Schneider, 1875 (Eimeriidae: Eucoccidiorida), and Trichuris Roederer, 1761 occurred in all subterranean rodent communities.
Across all subterranean network communities in all zoogeographic regions, we detected a general pattern of pairings of a host species interacting with 1 parasite species (low levels of host range), and a host species interacting with numerous species of parasites (general or large-host range parasites). These patterns are relatively common in other non-subterranean host–parasite systems (Brooks and McLennan, Reference Brooks and McLennan1993).
We assessed the extinction measures with several other parameters on host and parasite interactions in each community. The ES parameter estimates how hosts and parasites themselves are prone to rapid secondary extinction through the network system. The Nearctic host (Geomyidae) and Ethiopian parasite communities showed the highest ES results. A possible explanation for this is based on the fossil and climate records because species diversity for example in the family Geomyidae has fluctuated several times over the past 36 million years (Cook et al., Reference Cook, Lessa, Hadly, Lacey, Patton and Cameron2000). While Cook et al. (Reference Cook, Lessa, Hadly, Lacey, Patton and Cameron2000) have illustrated pulses of speciation in the Geomyidae the reasons for this oscillation in species number appear to be linked to changes in global climate oscillations that resulted in ice-sheet advances and retreats occurring several times over the past 40 million years (Spradling et al., Reference Spradling, Brant, Hafner and Dickerson2004; Hoberg and Brooks, Reference Hoberg and Brooks2015). Speciation in the parasites of Geomyidae has not been thoroughly investigated, although we are making progress with this and additional focused studies.
The macroevolutionary pattern showed that there were always extinctions after rapid diversifications or periods of long stability. This pattern is known as the taxon pulse hypothesis, first proposed by Erwin (Reference Erwin and Ball1985) and later explained by the Stockholm paradigm by Brooks et al. (Reference Brooks, Hoberg and Boeger2019, Reference Brooks, Boeger and Hoberg2022). The threshold for extinction is still under debate. However, according to the Stockholm paradigm, the current status of the family Geomyidae met 2 of the critical criteria for diversity reduction: climate change and the most recent high rapid diversification in this group of hosts.
The second group (Ethiopian parasites) showed a high ES value. A possible explanation for this outcome is that many endoparasite species occurred in only a single species of host. This observation indicates that network stability here is weak, and they are at a high risk of losing connections in their current network community. However, in some cases, sampling bias could cause this outcome, this is because some areas of the earth have more or less field research and mammal parasite surveys that are being conducted. Although the parasite species can be at the risk of obliteration at a certain community level, the parasite species extinction will be less likely to happen due to their potential and opportunities for ecological fitting (Janzen, Reference Janzen1985; Brooks et al., Reference Brooks, Hoberg and Boeger2019). To quote Brooks et al. (Reference Brooks, Hoberg and Boeger2019) ‘when the opportunity arises, parasites can utilize new animal groups as hosts while retaining the original hosts’. This process will lead to a new community assemblage with new and potentially ramified connections among the members.
In contrast to the values found in the analyses of the Geomyidae in the Nearctic and the Bathyergidae in the Ethiopian regions, the lowest ESs were recorded from the Palaearctic host and Neotropical parasite communities. The Palaearctic host–parasite network showed the highest number and diversity of compartments. The highest C-score values (average number of checkerboard units for each unique species pair in the community) were also reported from the Palaearctic host–parasite network. In addition, the Palaearctic parasite community showed the greatest number of parasite species. Combining these high network indices indicates that the Palaearctic subterranean host–parasite community seems to be more stable than those in other zoogeographic regions.
A few anomalies occurred in some results that are potentially more difficult to interpret. One of these includes ES calculations for the species of Geomyidae in the Nearctic region with the ES measure being high even though the robustness index for both host and parasite are equal. The most parsimonious explanation for this discrepancy is that the vulnerability and ES indexes are not equal for all groups. In other words, in this case, these index values represent higher accuracy for the parasite groups than the host group because the existence of endoparasites fully depends on their host group and not vice versa. Such anomalies should potentially be resolved by including more data and merging other networks in our dataset (Fontaine et al., Reference Fontaine, Guimarães, Kéfi, Loeuille, Memmott, van der Putten, van Veen and Thébault2011).
The current study shows how host–parasite interactions can reveal subterranean rodents and their parasite community structures using bipartite host–parasite network analyses and their parameters to describe these structures. Repetition of these analyses using a multilayer network will show differences over time, which is the third step ‘monitor’ of the DAMA protocol (Brooks et al., Reference Brooks, Hoberg, Gardner, Boeger, Galbreath, Herczeg, Mejía-Madrid, Racz and Dursahinhan2014). High-quality museum voucher specimens of both hosts and parasites will play a critical role in this process to monitor biological diversity (Yates et al., Reference Yates, Jones, Cook, Wilson, Cole, Nichols, Rudran and Foster1996; Galbreath et al., Reference Galbreath, Hoberg, Cook, Armién, Bell, Campbell, Dunnum, Dursahinhan, Eckerlin, Gardner and Greiman2019). As these voucher specimens (with both morphological and molecular data) enable the estimation of phylogenies with high coverage and resolution for both parasites and hosts, a phylogenetic perspective on host range and network structure will add great significance to any studies which purport to estimate host–pathogen interactions for parasites and emerging infectious diseases (Brooks et al., Reference Brooks, Bilewitch, Charmaine, Evans, Folinsbee, Frobisch, Halas, Hill, McLennan, Mattern, Tsuji, Ward, Wahlberg, Zamparo and Zanatta2007; Hoberg et al., Reference Hoberg, Boeger, Molnár, Földvári, Gardner, Juarrero, Kharchenko, Ortiz, Trivellone and Brooks2022b). Furthermore, utilizing data accumulated during DAMA combined with phylogenetic analysis of all players in the system creates opportunities to shift parasitology from a descriptive to predictive science and this network analysis is one of the many other networks that are essential for biodiversity research (Fontaine et al., Reference Fontaine, Guimarães, Kéfi, Loeuille, Memmott, van der Putten, van Veen and Thébault2011; Runghen et al., Reference Runghen, Poulin, Monlleó-Borrull and Llopis-Belenguer2021).
Data Availability
All data that we used to estimate the network connections among hosts and parasites in this paper are freely available on our web site: https://lamarck.unl.edu/subterranean/ and by examining the literature cited section, noting especially: Dursahinhan, A.T.; Botero-Cañola, S; Gardner, S.L. 2023. Parasites of subterranean rodents of the world. Zookeys. 1151: 159–203.
Supplementary material
The supplementary material for this article can be found at https://doi.org/10.1017/S0031182023000148.
Acknowledgements
We thank all Mongolian Vertebrate Parasite Project (2009–2012) crew members who helped us collect and process samples from Mongolia. Special thanks go to Zeiss USA for the continued support of the Manter Laboratory.
Author's contribution
S. L. G. conceived the study of parasite biodiversity in Mongolia. S. L. G. and A. T. D. contributed to the field study involving collection of the vertebrates and their parasites. S. B.-C. organized the data and supervised the technical analysis in R. A. T. D. and S. L. G. wrote the article.
Financial support
The current research was made possible through the support of the U.S. National Science Foundation via grants DEB-0717214, DBI-0646356, DBI-9631295 and DBI-9411976 to S. L. G.
Conflict of interest
None.
Ethical standards
Collection of specimens of mammals was done in accordance with the Animal Care and Use protocol (07-06-028D) at the University of Nebraska-Lincoln, USA.


 Open access