


1 Introduction
Pipes transport fluids. Flow in pipes can be of simple Newtonian fluids or complex non-Newtonian fluids and applications range from the household to industry, both large scale and small. Pipes running full have piqued the interest of researchers for well over a century due to the geometric simplicity of this flow; the many important applications of this flow, and also the lack of a unifying theory able to explain what is observed outside of simple laminar flow. For example, transition to turbulence in pipe flow observed by Osborne Reynolds in the late 19th century (Reynolds Reference Reynolds1895) is still not completely understood to this day (Barkley Reference Barkley2016, provides a comprehensive review of current understanding). Pipes running partially full have received far less attention, yet this type of flow also has many important engineering applications in, for example, the nuclear and petro(chemical) industries, the transport of food and personal care products and the transport of wastewater in sewer flows. Typically, these applications involve non-Newtonian fluids and/or the transport of solids in solution. When solids are held in solution, they can be pumped, transported and stored with much less manual handling of the material of interest. During this process, a balance must be struck between clogging of the pipe network due to particulate deposition and unnecessary diluteness. In industries where the handling of hazardous materials are required (e.g. removing waste material during the decommissioning of nuclear power plants) neither outcome is desirable: a clogged pipe network would lead to overpressure and failure, however, unnecessary diluteness simply leads to the generation of more waste product that requires storage. As such, a safety margin is introduced by pumping the fluids in pipe networks that are only partially filled.
Fundamentally, the flow in a partially full pipe is different from the pressure-driven flow of a full pipe. In the fully developed flow of a full pipe, resistance is balanced by the pressure drop and the velocity profile becomes invariant with streamwise distance. When this flow is laminar, we have the celebrated Hagen–Poiseuille flow (Hagen Reference Hagen1839; Poiseuille Reference Poiseuille1840) for which exists an exact solution of the governing equations from which we have the velocity distribution. When the flow is turbulent, we have semi-empirical relationships that describe the velocity profile i.e. the logarithmic law of the wall (Izakson Reference Izakson1937; Millikan Reference Millikan1938).
When a pipe is flowing partially full, there is the presence of a free surface and the velocity distribution depends on the flow depth. As a result, the location of the maximum velocity no longer coincides with the pipe centreline, however, it is also not necessarily at the free surface. Yoon, Sung & Lee (Reference Yoon, Sung and Lee2012) measured the streamwise velocity distribution in a partially full pipe flow across transitional and turbulent Reynolds numbers and reported that the maximum velocity tends to be at the free surface when the flow depth is shallow and as the flow depth increases beyond half-full, the location of the maximum velocity moves away from the free surface towards the pipe centreline. This so-called ‘velocity dip’ phenomenon is known to occur in rectangular open channels and is caused by the presence of secondary currents when the free surface width
 $B$
to depth
$B$
to depth
 $d$
ratio is small
$d$
ratio is small
 $(B/d<5)$
as reported by Nezu (Reference Nezu2005).
$(B/d<5)$
as reported by Nezu (Reference Nezu2005).
In contrast to full pipe flow, a theoretical solution for laminar pipe flow running partially full has only recently been reported in Guo & Meroney (Reference Guo and Meroney2013) and subsequently in Fullard & Wake (Reference Fullard and Wake2015) who support their findings with numerical simulations performed using the commercial fluid dynamics code ANSYS Polyflow. No experimental validation of this solution is yet available. Furthermore, other numerical simulations remain limited to laminar flows (Davis & Mai Reference Davis and Mai1991; Ng, Lawrence & Hewitt Reference Ng, Lawrence and Hewitt2000) and high fidelity direct numerical simulations (DNS) – readily available for turbulent pipe flow running full (Wu & Moin Reference Wu and Moin2008; Chin et al. Reference Chin, Ooi, Marusic and Blackburn2010; Wu, Baltzer & Adrian Reference Wu, Baltzer and Adrian2012; Ahn et al. Reference Ahn, Lee, Jang and Sung2013; El Khoury et al. Reference El Khoury, Schlatter, Noorani, Fischer, Brethouwer and Johansson2013) – are lacking in the partially filled case. Experimental work focused directly on smooth-walled circular cross-section pipe flow running partially full is generally limited to studies of the bulk-flow behaviour, for example: Krishnakumar & Fields (Reference Krishnakumar and Fields1982) investigated the minimum flow rate required to fill horizontal and vertical flowing pipes; Clausnitzer & Hager (Reference Clausnitzer and Hager1997) studied the characteristics of the jets discharging from partially filled pipes, Stephenson (Reference Stephenson1957), Swaffield & Bridge (Reference Swaffield and Bridge1983) reviewed frictional losses in partially filled conduits and Enfinger & Kimborough (Reference Enfinger and Kimborough2004), Enfinger & Schutzbach (Reference Enfinger and Schutzbach2005) assessed the value of the Manning co-efficient for circular open channels. Measurements of the velocity distribution in partially full pipes/culverts are sparse: Knight & Sterling (Reference Knight and Sterling2000), Sterling & Knight (Reference Sterling and Knight2000) report the mean streamwise velocity distribution measured using a Pitot-static tube for a smooth circular pipe running partially full as part of a larger study on the effect of sediment bed height; Ead et al. (Reference Ead, Rajaratnam, Katopodis and Ade2000) report the mean streamwise velocity profiles at the centreline of a corrugated culvert; Clark & Kehler (Reference Clark and Kehler2011) report the mean velocity distribution and turbulent stress profiles in a corrugated culvert using acoustic Doppler velocimetry (ADV) and Yoon et al. (Reference Yoon, Sung and Lee2012) the mean streamwise velocity distribution in a smooth circular open channel measured using particle imaging velocimetry (PIV).
Knight & Sterling (Reference Knight and Sterling2000) and Yoon et al. (Reference Yoon, Sung and Lee2012) are the studies most closely related to this current work as both consider partially filled pipe flow over smooth walls and both studies report the measured mean streamwise velocity distributions for several flow depths. The presence of mean secondary motions are inferred from observation of the so-called velocity dip. In both those studies, the pipe flow facilities were gravity fed and, as such, flow depth and Reynolds number were not controlled independently with Reynolds numbers increasing between two- and fourfold between the lowest and highest flow depths. For example, Yoon et al. (Reference Yoon, Sung and Lee2012) reports data at
 $5693<Re_{H}<18974$
for flow depths between
$5693<Re_{H}<18974$
for flow depths between
 $30$
and
$30$
and
 $80\,\%$
and according to Yoon et al. (Reference Yoon, Sung and Lee2012), this threefold increase in Reynolds number covers flow regimes that are both transitional and fully turbulent. Knight & Sterling (Reference Knight and Sterling2000) reports higher Reynolds number data,
$80\,\%$
and according to Yoon et al. (Reference Yoon, Sung and Lee2012), this threefold increase in Reynolds number covers flow regimes that are both transitional and fully turbulent. Knight & Sterling (Reference Knight and Sterling2000) reports higher Reynolds number data,
 $64\,900<Re_{H}<150\,000$
for flow depths between
$64\,900<Re_{H}<150\,000$
for flow depths between
 $33$
and
$33$
and
 $83\,\%$
. All measurements reported in both studies were conducted in the subcritical flow regime i.e. where the Froude number
$83\,\%$
. All measurements reported in both studies were conducted in the subcritical flow regime i.e. where the Froude number
 $(Fr)$
is less than one. The current study will also be conducted in a smooth wall partially filled pipe, however, as our facility is pressure driven, we are able to control Reynolds number independent of flow depth (albeit for a limited range). Hence, we can investigate turbulent partially filled pipe flow at a nominally constant Reynolds number of
$(Fr)$
is less than one. The current study will also be conducted in a smooth wall partially filled pipe, however, as our facility is pressure driven, we are able to control Reynolds number independent of flow depth (albeit for a limited range). Hence, we can investigate turbulent partially filled pipe flow at a nominally constant Reynolds number of
 $Re_{H}\approx 30\,000\pm 5\,\%$
and are able to isolate the effects of changing flow depth from Reynolds number. Further, we also conduct velocity measurements in the laminar flow regime and compare our results to the theoretical solution recently reported by Guo & Meroney (Reference Guo and Meroney2013).
$Re_{H}\approx 30\,000\pm 5\,\%$
and are able to isolate the effects of changing flow depth from Reynolds number. Further, we also conduct velocity measurements in the laminar flow regime and compare our results to the theoretical solution recently reported by Guo & Meroney (Reference Guo and Meroney2013).
The aim of the current study is to investigate laminar and turbulent flow in a partially filled pipe, and here, we limit ourselves only to the study of single-phase Newtonian fluids. The large field-of-view (FOV) stereoscopic PIV (S-PIV) snapshots provide insight into the instantaneous events that result in the time-average secondary flows which are absent when the pipe is running full. We approach the problem from a wall-bounded turbulence research perspective (rather than that of hydraulics engineering) with a focus on turbulent flow structures whilst trying to place this work in the larger context of more recent developments in the former field: that of large-scale coherent turbulent motions.
In this paper we refer to both Cartesian and cylindrical coordinates where
 $x$
,
$x$
,
 $y$
and
$y$
and
 $z$
refer to the streamwise, spanwise and vertical directions with respect to the pipe vertical bisector;
$z$
refer to the streamwise, spanwise and vertical directions with respect to the pipe vertical bisector;
 $u$
,
$u$
,
 $v$
and
$v$
and
 $w$
the respective velocity components in Cartesian co-ordinates and
$w$
the respective velocity components in Cartesian co-ordinates and
 $r$
and
$r$
and
 $\unicode[STIX]{x1D703}$
represent the radial and azimuthal directions defined from the pipe centre axis. The paper is structured as follows: § 2 is a discussion of geometric considerations for the operation of partially filled pipes and introduces the definitions of the Reynolds number that shall subsequently be used; § 3 covers the experimental apparatus and methods; § 4 is a discussion of the limit imposed by the Froude number on the parameter space that we are able to explore, § 5 reports inferred friction factor data (estimated using the steady-flow energy equation) for a range of Reynolds numbers, flow depths and bulk Froude numbers. We then follow by comparing our measured streamwise velocity distribution in laminar partially filled pipe flow with the theoretical distributions first reported by Guo & Meroney (Reference Guo and Meroney2013) in § 6 and then the turbulent flow velocity measurements are presented in § 7. The large-scale structure of the turbulent flow is considered first by presenting pseudo-instantaneous velocity fields in § 8 and then the average flow structure inferred from two-point velocity correlations are discussed § 9. Finally conclusions are presented in § 10.
$\unicode[STIX]{x1D703}$
represent the radial and azimuthal directions defined from the pipe centre axis. The paper is structured as follows: § 2 is a discussion of geometric considerations for the operation of partially filled pipes and introduces the definitions of the Reynolds number that shall subsequently be used; § 3 covers the experimental apparatus and methods; § 4 is a discussion of the limit imposed by the Froude number on the parameter space that we are able to explore, § 5 reports inferred friction factor data (estimated using the steady-flow energy equation) for a range of Reynolds numbers, flow depths and bulk Froude numbers. We then follow by comparing our measured streamwise velocity distribution in laminar partially filled pipe flow with the theoretical distributions first reported by Guo & Meroney (Reference Guo and Meroney2013) in § 6 and then the turbulent flow velocity measurements are presented in § 7. The large-scale structure of the turbulent flow is considered first by presenting pseudo-instantaneous velocity fields in § 8 and then the average flow structure inferred from two-point velocity correlations are discussed § 9. Finally conclusions are presented in § 10.
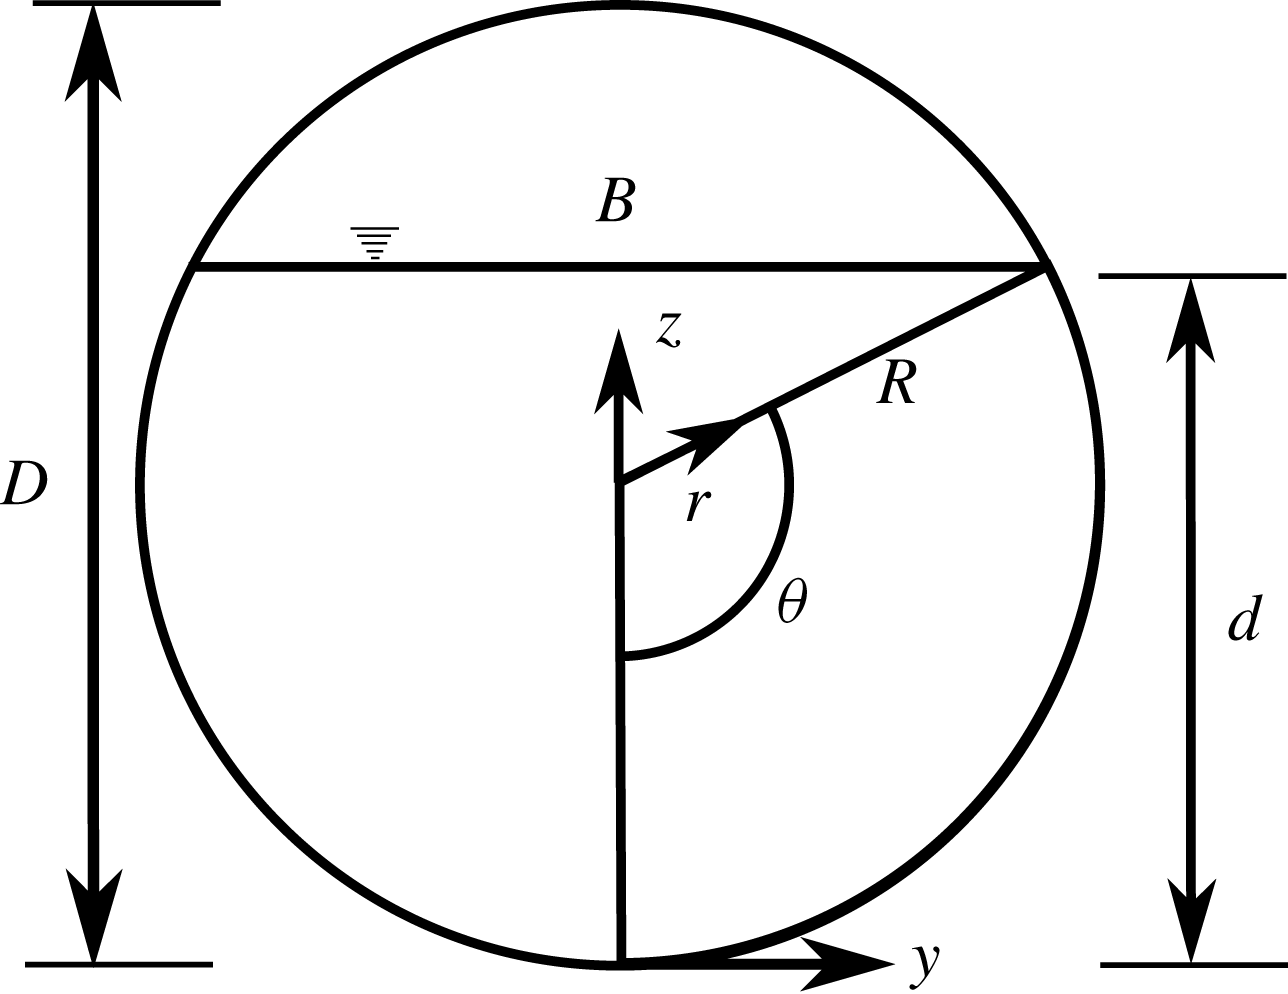
Cross-section of pipe showing definitions of depth and free surface width.
2 Geometric considerations for partially filled pipes
Figure 1 is a cross-section of the flow in a partially full pipe where we define the pipe radius as
 $R$
, flow depth along pipe vertical bisector as
$R$
, flow depth along pipe vertical bisector as
 $d$
and free surface width as
$d$
and free surface width as
 $B$
. Since flow depth varies across the free surface, we also introduce the hydraulic radius
$B$
. Since flow depth varies across the free surface, we also introduce the hydraulic radius
 $R_{h}=A/P_{w}$
where
$R_{h}=A/P_{w}$
where
 $A$
and
$A$
and
 $P_{w}$
are the flow cross-sectional area (which is dependent on depth in a partially filled pipe) and the wetted perimeter, respectively. From figure 1 it follows that;
$P_{w}$
are the flow cross-sectional area (which is dependent on depth in a partially filled pipe) and the wetted perimeter, respectively. From figure 1 it follows that;
 $$\begin{eqnarray}\cos \unicode[STIX]{x1D703}=\frac{R-d}{R},\end{eqnarray}$$
where
 $\unicode[STIX]{x1D703}$
has the range of
$\unicode[STIX]{x1D703}$
has the range of
 $0^{\circ }$
–
$0^{\circ }$
–
 $180^{\circ }$
, defined from bottom-dead-centre to top-dead-centre of the pipe cross-section. Flow cross-sectional area,
$180^{\circ }$
, defined from bottom-dead-centre to top-dead-centre of the pipe cross-section. Flow cross-sectional area,
 $A$
, and perimeter,
$A$
, and perimeter,
 $P_{w}$
are;
$P_{w}$
are;
 $$\begin{eqnarray}\displaystyle & \displaystyle A=R^{2}(\unicode[STIX]{x1D703}-\sin \unicode[STIX]{x1D703}\cos \unicode[STIX]{x1D703}), & \displaystyle\end{eqnarray}$$
 $$\begin{eqnarray}\displaystyle & \displaystyle P_{w}=2R\unicode[STIX]{x1D703}, & \displaystyle\end{eqnarray}$$
respectively, and finally hydraulic radius as a function of pipe radius and
 $\unicode[STIX]{x1D703}$
is;
$\unicode[STIX]{x1D703}$
is;
 $$\begin{eqnarray}R_{H}=\frac{A}{P_{w}}=\frac{R(\unicode[STIX]{x1D703}-\sin \unicode[STIX]{x1D703}\cos \unicode[STIX]{x1D703})}{2\unicode[STIX]{x1D703}}.\end{eqnarray}$$
With the hydraulic radius
 $R_{H}$
defined, we can then define the hydraulic Reynolds number;
$R_{H}$
defined, we can then define the hydraulic Reynolds number;
 $$\begin{eqnarray}Re_{H}=\frac{4R_{H}U_{b}}{\unicode[STIX]{x1D708}},\end{eqnarray}$$
where
 $U_{b}$
is the bulk velocity and
$U_{b}$
is the bulk velocity and
 $\unicode[STIX]{x1D708}$
the kinematic viscosity. Or alternatively using hydraulic diameter
$\unicode[STIX]{x1D708}$
the kinematic viscosity. Or alternatively using hydraulic diameter
 $D_{H}=4R_{H}$
;
$D_{H}=4R_{H}$
;
 $$\begin{eqnarray}Re_{H}=\frac{D_{H}U_{b}}{\unicode[STIX]{x1D708}}.\end{eqnarray}$$
Reynolds number defined using the hydraulic diameter as the length scale is typical practice in open channel flow, however, to facilitate a direct comparison with full pipe flow, we propose a Reynolds number based on equivalent diameter,
 $D_{EQ}$
, which is the diameter of a full pipe that would have the same flow cross-sectional area as the partially filled pipe flow used in this study i.e.;
$D_{EQ}$
, which is the diameter of a full pipe that would have the same flow cross-sectional area as the partially filled pipe flow used in this study i.e.;
 $$\begin{eqnarray}D_{EQ}=2\sqrt{\frac{A}{\unicode[STIX]{x03C0}}},\end{eqnarray}$$
leading to an equivalent Reynolds number
 $$\begin{eqnarray}Re_{EQ}=\frac{D_{EQ}U_{b}}{\unicode[STIX]{x1D708}}.\end{eqnarray}$$
From mass conservation;
 $$\begin{eqnarray}{\dot{m}}=\unicode[STIX]{x1D70C}AU_{b}.\end{eqnarray}$$
Combining (2.9) with (2.6) and rearranging we can write Reynolds number as a function of mass flow
 ${\dot{m}}$
, pipe radius and
${\dot{m}}$
, pipe radius and
 $\unicode[STIX]{x1D703}$
.
$\unicode[STIX]{x1D703}$
.
 $$\begin{eqnarray}Re_{H}=\frac{2{\dot{m}}}{\unicode[STIX]{x1D707}R\unicode[STIX]{x1D703}}.\end{eqnarray}$$
As there is a free surface present, the Froude number
 $Fr$
will be another important non-dimensional group. For free surface flows, the bulk Froude number can be defined as;
$Fr$
will be another important non-dimensional group. For free surface flows, the bulk Froude number can be defined as;
 $$\begin{eqnarray}Fr=\frac{U_{b}}{\sqrt{(g\times D_{m})}},\end{eqnarray}$$
where
 $U_{b}$
is bulk velocity,
$U_{b}$
is bulk velocity,
 $g$
gravitational acceleration and
$g$
gravitational acceleration and
 $D_{m}=A/B$
is hydraulic mean depth (French Reference French1985). Here we are considering only cylindrical pipes of constant cross-sectional area and so the Froude number can be re-written in terms of pipe radius
$D_{m}=A/B$
is hydraulic mean depth (French Reference French1985). Here we are considering only cylindrical pipes of constant cross-sectional area and so the Froude number can be re-written in terms of pipe radius
 $R$
and
$R$
and
 $\unicode[STIX]{x1D703}$
. Referring to figure 1;
$\unicode[STIX]{x1D703}$
. Referring to figure 1;
 $$\begin{eqnarray}R^{2}=(R-d)^{2}+(B/2)^{2},\end{eqnarray}$$
which can be rearranged to obtain;
 $$\begin{eqnarray}B=2R\sin \unicode[STIX]{x1D703}.\end{eqnarray}$$
 $$\begin{eqnarray}Fr=\frac{{\dot{m}}}{\unicode[STIX]{x1D70C}}\sqrt{\frac{B}{gA^{3}}}.\end{eqnarray}$$
Substituting (2.2) and (2.13) to obtain Froude number as a function of mass flow,
 $R$
and
$R$
and
 $\unicode[STIX]{x1D703}$
;
$\unicode[STIX]{x1D703}$
;
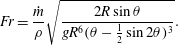 $$\begin{eqnarray}Fr=\frac{{\dot{m}}}{\unicode[STIX]{x1D70C}}\sqrt{\frac{2R\sin \unicode[STIX]{x1D703}}{gR^{6}(\unicode[STIX]{x1D703}-\frac{1}{2}\sin 2\unicode[STIX]{x1D703})^{3}}}.\end{eqnarray}$$
Clearly, the Reynolds number and Froude number cannot be varied independently in a single facility; we shall discuss the physical implications of this interdependence in the context of a partially filled pipe in § 4.
3 Experimental set-up
Measurements were conducted in the very-large-scale pipe flow (VLSPF) facility at the University of Liverpool, the same facility used in the work of Dennis & Sogaro (Reference Dennis and Sogaro2014). The modular working section is made from a set of precision bore, cylindrical borosilicate glass tubes with inner diameter of
 $D=100.4\pm 0.1~\text{mm}$
. Each glass tube is paired with a set of machined-to-fit stainless steel female/male flanges; and each tube is set in the matching flange pair on a jig using Devcon rubber to form the individual working-section modules. Each module has a pressure tapping inserted into the downstream flange at either the 1 o’clock or 11 o’clock position when looking down the axis of the pipe. These modules are aligned with a laser and bolted together so that the working section totals
$D=100.4\pm 0.1~\text{mm}$
. Each glass tube is paired with a set of machined-to-fit stainless steel female/male flanges; and each tube is set in the matching flange pair on a jig using Devcon rubber to form the individual working-section modules. Each module has a pressure tapping inserted into the downstream flange at either the 1 o’clock or 11 o’clock position when looking down the axis of the pipe. These modules are aligned with a laser and bolted together so that the working section totals
 $L=23.3~\text{m}$
in length resulting in a length-to-diameter ratio
$L=23.3~\text{m}$
in length resulting in a length-to-diameter ratio
 $L/D=233$
. Flow to the working section is supplied by a progressive cavity pump (Mono Type-101) fed from a 500 l stainless steel header tank. Prior to entering the working section, the working fluid is passed through three pulsation dampers and a Coriolis-type mass flow meter (Endress and Hauser Promass 63) and fed into a cylindrical plenum where the flow is fully reversed and passed through a set of screens to remove any residual swirl before reaching the working-section inlet. After the working section the fluid is fed back to the header tank through a flexible rubber hose, thus completing the flow loop. A schematic of the rig is shown in figure 2 – it is essentially an extended version of the facility reported in detail by Escudier, Presti & Smith (Reference Escudier, Presti and Smith1999).
$L/D=233$
. Flow to the working section is supplied by a progressive cavity pump (Mono Type-101) fed from a 500 l stainless steel header tank. Prior to entering the working section, the working fluid is passed through three pulsation dampers and a Coriolis-type mass flow meter (Endress and Hauser Promass 63) and fed into a cylindrical plenum where the flow is fully reversed and passed through a set of screens to remove any residual swirl before reaching the working-section inlet. After the working section the fluid is fed back to the header tank through a flexible rubber hose, thus completing the flow loop. A schematic of the rig is shown in figure 2 – it is essentially an extended version of the facility reported in detail by Escudier, Presti & Smith (Reference Escudier, Presti and Smith1999).
Schematic of VLSPF facility.
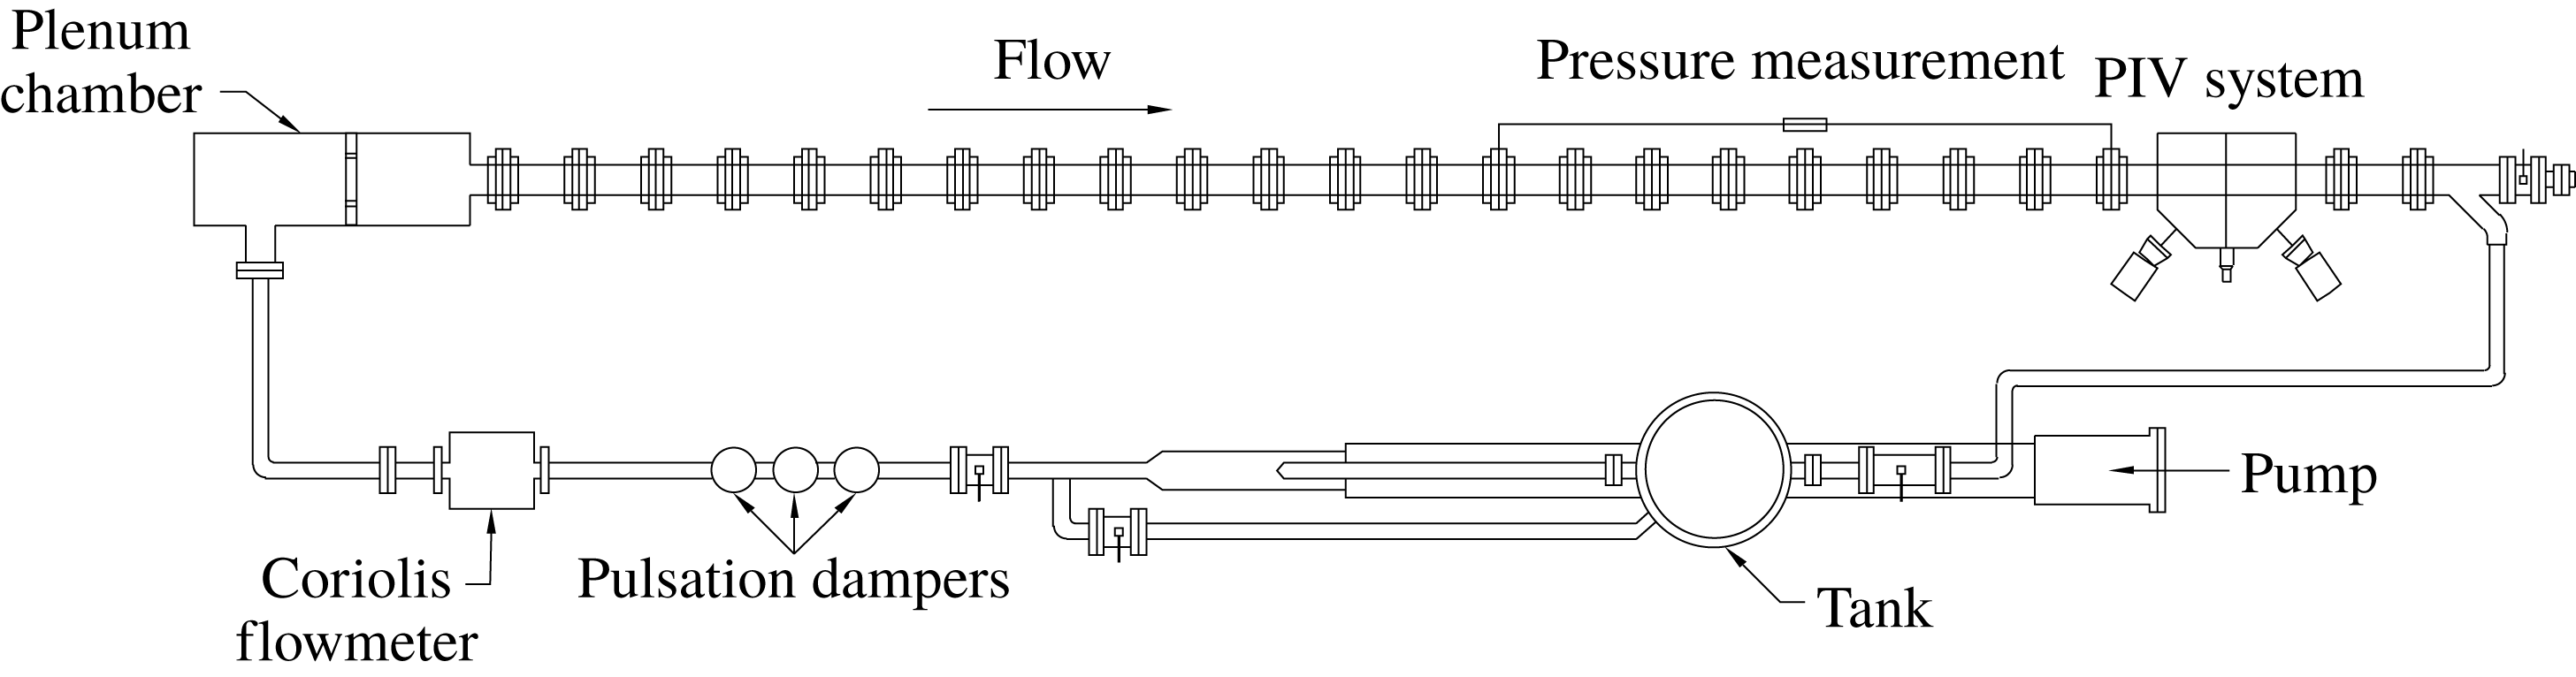
The pipe flow working section is horizontal and designed with full pressurised pipe flow in mind, so in order to control Reynolds number and flow depth independently, we used the following procedure: (i) the header tank was filled to a prescribed level; (ii) the pipe was then filled to the desired level under the action of hydrostatic pressure by allowing air to escape the pipe working section through the pressure tappings; (iii) once the desired initial depth was achieved, the pressure tappings were sealed to trap the remaining air in the pipe working section; (iv) the pump speed was then adjusted and the height monitored until the desired Reynolds number and flow depth was achieved.
As the pressure tappings in the working section were mounted at either the 11 o’clock or 1 o’clock positions, we could not measure the pressure drop in the fluid phase of the pipe when running partially full. Instead we relied on measurements of flow depth and mass flow rate to calculate bulk velocity,
 $U_{b}$
, Reynolds and Froude numbers. With optical access to most of the pipe working section, flow depths were measured periodically at various distances from the inlet using a graduated scale. Due to the absence of pressure-drop measurements in the fluid phase, we used the change in flow depth between
$U_{b}$
, Reynolds and Froude numbers. With optical access to most of the pipe working section, flow depths were measured periodically at various distances from the inlet using a graduated scale. Due to the absence of pressure-drop measurements in the fluid phase, we used the change in flow depth between
 $x/D=10$
and
$x/D=10$
and
 $210$
to estimate an inferred friction factor (see § 5 for methodology).
$210$
to estimate an inferred friction factor (see § 5 for methodology).
Stereoscopic particle imaging velocimetry (S-PIV) measurements are conducted in the radial–azimuthal (
 $r$
–
$r$
–
 $\unicode[STIX]{x1D703}$
) plane with the cameras and laser light sheet orientated in a similar manner as van Doorne & Westerweel (Reference van Doorne and Westerweel2007). The measurement plane is located at
$\unicode[STIX]{x1D703}$
) plane with the cameras and laser light sheet orientated in a similar manner as van Doorne & Westerweel (Reference van Doorne and Westerweel2007). The measurement plane is located at
 $x=220D$
downstream from inlet and the remaining set-up is identical to that reported in Dennis & Sogaro (Reference Dennis and Sogaro2014). The flow is seeded with silver-coated hollow glass spheres with an average diameter of
$x=220D$
downstream from inlet and the remaining set-up is identical to that reported in Dennis & Sogaro (Reference Dennis and Sogaro2014). The flow is seeded with silver-coated hollow glass spheres with an average diameter of
 $10~\unicode[STIX]{x03BC}\text{m}$
to facilitate the use of PIV. Particle images are captured using a pair of high-speed CMOS cameras (Phantom Miro M110) each with sensor resolution of
$10~\unicode[STIX]{x03BC}\text{m}$
to facilitate the use of PIV. Particle images are captured using a pair of high-speed CMOS cameras (Phantom Miro M110) each with sensor resolution of
 $1280\times 800$
pixels and a
$1280\times 800$
pixels and a
 $12$
-bit dynamic range. At full resolution, images can be acquired at a repetition rate of
$12$
-bit dynamic range. At full resolution, images can be acquired at a repetition rate of
 $f=1600~\text{Hz}$
which, given the range of Reynolds numbers we are able to run the pipe partially full, is more than sufficient to obtain time-resolved data which can then be used to reconstruct the pseudo-instantaneous three-dimensional flow field using Taylor’s hypothesis (Taylor Reference Taylor1938) which was shown by Dennis & Nickels (Reference Dennis and Nickels2008) to be a valid estimate for the large-scale motions which are of primary interest in this study. The measurement plane is viewed through a prism filled with the same working fluid as the pipe facility using Nikon Micro-Nikkor 60 mm camera lenses at an
$f=1600~\text{Hz}$
which, given the range of Reynolds numbers we are able to run the pipe partially full, is more than sufficient to obtain time-resolved data which can then be used to reconstruct the pseudo-instantaneous three-dimensional flow field using Taylor’s hypothesis (Taylor Reference Taylor1938) which was shown by Dennis & Nickels (Reference Dennis and Nickels2008) to be a valid estimate for the large-scale motions which are of primary interest in this study. The measurement plane is viewed through a prism filled with the same working fluid as the pipe facility using Nikon Micro-Nikkor 60 mm camera lenses at an
 $f$
-number of 4.0 with Scheimpflug mounts used to allow stereoscopic imaging. The cameras were synchronised with the laser light pulses emitted from an Nd:YAG laser (Lee Laser LDP-100MQG DUAL). A custom made two-level calibration target made up of a lattice of dots of known spacing with a
$f$
-number of 4.0 with Scheimpflug mounts used to allow stereoscopic imaging. The cameras were synchronised with the laser light pulses emitted from an Nd:YAG laser (Lee Laser LDP-100MQG DUAL). A custom made two-level calibration target made up of a lattice of dots of known spacing with a
 $x=3~\text{mm}$
axial offset is imaged prior to the flow measurements using S-PIV and reconstruction of the three component vector fields from the particle images were performed using Dantec Dynamics DynamicStudio 2015a with a final interrogation window size of
$x=3~\text{mm}$
axial offset is imaged prior to the flow measurements using S-PIV and reconstruction of the three component vector fields from the particle images were performed using Dantec Dynamics DynamicStudio 2015a with a final interrogation window size of
 $32\times 32$
pixels and
$32\times 32$
pixels and
 $50\,\%$
overlap which yielded an approximate measurement resolution of
$50\,\%$
overlap which yielded an approximate measurement resolution of
 $l=2~\text{mm}$
.
$l=2~\text{mm}$
.
Owing to the large diameter
 $(D=100~\text{mm})$
of the VLSPF facility, the viscosity of the working fluid had to be increased to reach the laminar flow regime. As such, the laminar flow velocity measurements were carried out using a 70:30 % by weight glycerine–water mixture, which had a dynamic viscosity of approximately
$(D=100~\text{mm})$
of the VLSPF facility, the viscosity of the working fluid had to be increased to reach the laminar flow regime. As such, the laminar flow velocity measurements were carried out using a 70:30 % by weight glycerine–water mixture, which had a dynamic viscosity of approximately
 $\unicode[STIX]{x1D707}=19.0~\text{mPa}~\text{s}$
and density
$\unicode[STIX]{x1D707}=19.0~\text{mPa}~\text{s}$
and density
 $\unicode[STIX]{x1D70C}=1180~\text{kg}~\text{m}^{-3}$
at a temperature of
$\unicode[STIX]{x1D70C}=1180~\text{kg}~\text{m}^{-3}$
at a temperature of
 $T=20.0\,^{\circ }\text{C}$
. The mean streamwise velocity distribution for the laminar flow was calculated from
$T=20.0\,^{\circ }\text{C}$
. The mean streamwise velocity distribution for the laminar flow was calculated from
 $300$
independent PIV image pairs acquired over a duration of
$300$
independent PIV image pairs acquired over a duration of
 $300~\text{s}$
with the Reynolds number kept below
$300~\text{s}$
with the Reynolds number kept below
 $Re_{H}<500$
for all flow depths investigated. For turbulent flow velocity measurements, the working fluid was replaced with water. The Weber number
$Re_{H}<500$
for all flow depths investigated. For turbulent flow velocity measurements, the working fluid was replaced with water. The Weber number
 $We=\unicode[STIX]{x1D70C}U_{b}^{2}B/\unicode[STIX]{x1D70E}$
was estimated (using
$We=\unicode[STIX]{x1D70C}U_{b}^{2}B/\unicode[STIX]{x1D70E}$
was estimated (using
 $\unicode[STIX]{x1D70E}=72.7~\text{mN}~\text{m}^{-1}$
(White Reference White2006, p. 51) the surface tension of water at
$\unicode[STIX]{x1D70E}=72.7~\text{mN}~\text{m}^{-1}$
(White Reference White2006, p. 51) the surface tension of water at
 $T=20.0\,^{\circ }\text{C}$
), yielding
$T=20.0\,^{\circ }\text{C}$
), yielding
 $We\approx 131$
at
$We\approx 131$
at
 $d/D=44\,\%$
, decreasing to
$d/D=44\,\%$
, decreasing to
 $We\approx 60$
at
$We\approx 60$
at
 $d/D=80\,\%$
. Hence, inertial forces remain prevalent relative to surface tension in the turbulent flow regime for the flow depths tested. The experimental conditions and S-PIV parameters for turbulent flow measurements are summarised in table 1.
$d/D=80\,\%$
. Hence, inertial forces remain prevalent relative to surface tension in the turbulent flow regime for the flow depths tested. The experimental conditions and S-PIV parameters for turbulent flow measurements are summarised in table 1.
Experimental conditions for turbulent flow velocity measurements.

a Data from Dennis & Sogaro (Reference Dennis and Sogaro2014).
4 Influence of Froude number on pipe filling
The Froude number plays an important part in open channel hydraulics and is associated with the state of the flow. When the Froude number is less than one, the flow is subcritical and when greater than one the flow is supercritical (White Reference White2008). Local flow depth versus local Reynolds number and corresponding plots of local Froude number versus local Reynolds number are plotted for two axial locations situated at
 $x/D=210$
and
$x/D=210$
and
 $x/D=230$
from pipe inlet in figures 3 and 4, respectively. These axial locations were chosen as they are the closest to the S-PIV measurement plane which we can directly measure the flow depth using a graduated scale. (The S-PIV measurement plane itself is encased in a fluid-filled prism which is used to reduce the effect of refractive index changes during S-PIV imaging). In these figures, each symbol represents a (measured) time-averaged value of local flow depth versus local Reynolds number or local Froude number versus local Reynolds number and each different symbol shape represents an independent set of measurements where the initial flow depth was set by choice. For example, the filled circles (●) represent a set of measurements where the initial flow depth was set to nominally
$x/D=230$
from pipe inlet in figures 3 and 4, respectively. These axial locations were chosen as they are the closest to the S-PIV measurement plane which we can directly measure the flow depth using a graduated scale. (The S-PIV measurement plane itself is encased in a fluid-filled prism which is used to reduce the effect of refractive index changes during S-PIV imaging). In these figures, each symbol represents a (measured) time-averaged value of local flow depth versus local Reynolds number or local Froude number versus local Reynolds number and each different symbol shape represents an independent set of measurements where the initial flow depth was set by choice. For example, the filled circles (●) represent a set of measurements where the initial flow depth was set to nominally
 $d/D=50\,\%$
(i.e. with the pump turned off, the pipe working section was allowed to fill under hydrostatic pressure to
$d/D=50\,\%$
(i.e. with the pump turned off, the pipe working section was allowed to fill under hydrostatic pressure to
 $d/D=50\,\%$
). The pump speed was then incrementally increased, and for each increment, the flow depth and mass flow rate are recorded over a period of 5 minutes and time averaged to compute
$d/D=50\,\%$
). The pump speed was then incrementally increased, and for each increment, the flow depth and mass flow rate are recorded over a period of 5 minutes and time averaged to compute
 $d/D$
,
$d/D$
,
 $Re_{H}$
and
$Re_{H}$
and
 $Fr$
; after which the pump speed was increased to the next predetermined level and measurements of flow depth and mass flow were again recorded. This process was carried out without attempting to maintain a constant flow depth (i.e. draining the pipe flow working section for each increment in pump speed), hence, the slight variation in level from
$Fr$
; after which the pump speed was increased to the next predetermined level and measurements of flow depth and mass flow were again recorded. This process was carried out without attempting to maintain a constant flow depth (i.e. draining the pipe flow working section for each increment in pump speed), hence, the slight variation in level from
 $d/D\approx 50\,\%$
at
$d/D\approx 50\,\%$
at
 $Re_{H}\approx 2000$
to
$Re_{H}\approx 2000$
to
 $d/D\approx 55\,\%$
at
$d/D\approx 55\,\%$
at
 $Re_{H}\approx 20\,000$
. The entire process is then repeated for different initial flow depths, i.e. filled upside-down triangles (▾) represent measurements where the initial flow depth was
$Re_{H}\approx 20\,000$
. The entire process is then repeated for different initial flow depths, i.e. filled upside-down triangles (▾) represent measurements where the initial flow depth was
 $d/D\approx 70\,\%$
and filled squares (▪) represent measurements for initial depth of
$d/D\approx 70\,\%$
and filled squares (▪) represent measurements for initial depth of
 $d/D\approx 80\,\%$
. In these figures, grayscale symbols are measurements from the current study and magenta and green symbols are the data of Knight & Sterling (Reference Knight and Sterling2000) and Yoon et al. (Reference Yoon, Sung and Lee2012), respectively. Each line represents
$d/D\approx 80\,\%$
. In these figures, grayscale symbols are measurements from the current study and magenta and green symbols are the data of Knight & Sterling (Reference Knight and Sterling2000) and Yoon et al. (Reference Yoon, Sung and Lee2012), respectively. Each line represents
 $Fr=1$
for the different pipe diameters for each of the data sets: (black, solid)
$Fr=1$
for the different pipe diameters for each of the data sets: (black, solid)
 $D=100~\text{mm}$
, VLSPF facility used in this study; (magenta, dot-dash)
$D=100~\text{mm}$
, VLSPF facility used in this study; (magenta, dot-dash)
 $D=25~\text{ mm}$
for Yoon et al. (Reference Yoon, Sung and Lee2012) and (green, dashed)
$D=25~\text{ mm}$
for Yoon et al. (Reference Yoon, Sung and Lee2012) and (green, dashed)
 $D=244~\text{ mm}$
for Knight & Sterling (Reference Knight and Sterling2000). The loci of
$D=244~\text{ mm}$
for Knight & Sterling (Reference Knight and Sterling2000). The loci of
 $Fr=1$
can be determined by setting the left-hand side of (2.15) to unity and solving for the mass flow rate given
$Fr=1$
can be determined by setting the left-hand side of (2.15) to unity and solving for the mass flow rate given
 $0\leqslant \unicode[STIX]{x1D703}\leqslant 180^{\circ }$
for a prescribed pipe radius
$0\leqslant \unicode[STIX]{x1D703}\leqslant 180^{\circ }$
for a prescribed pipe radius
 $R$
.
$R$
.
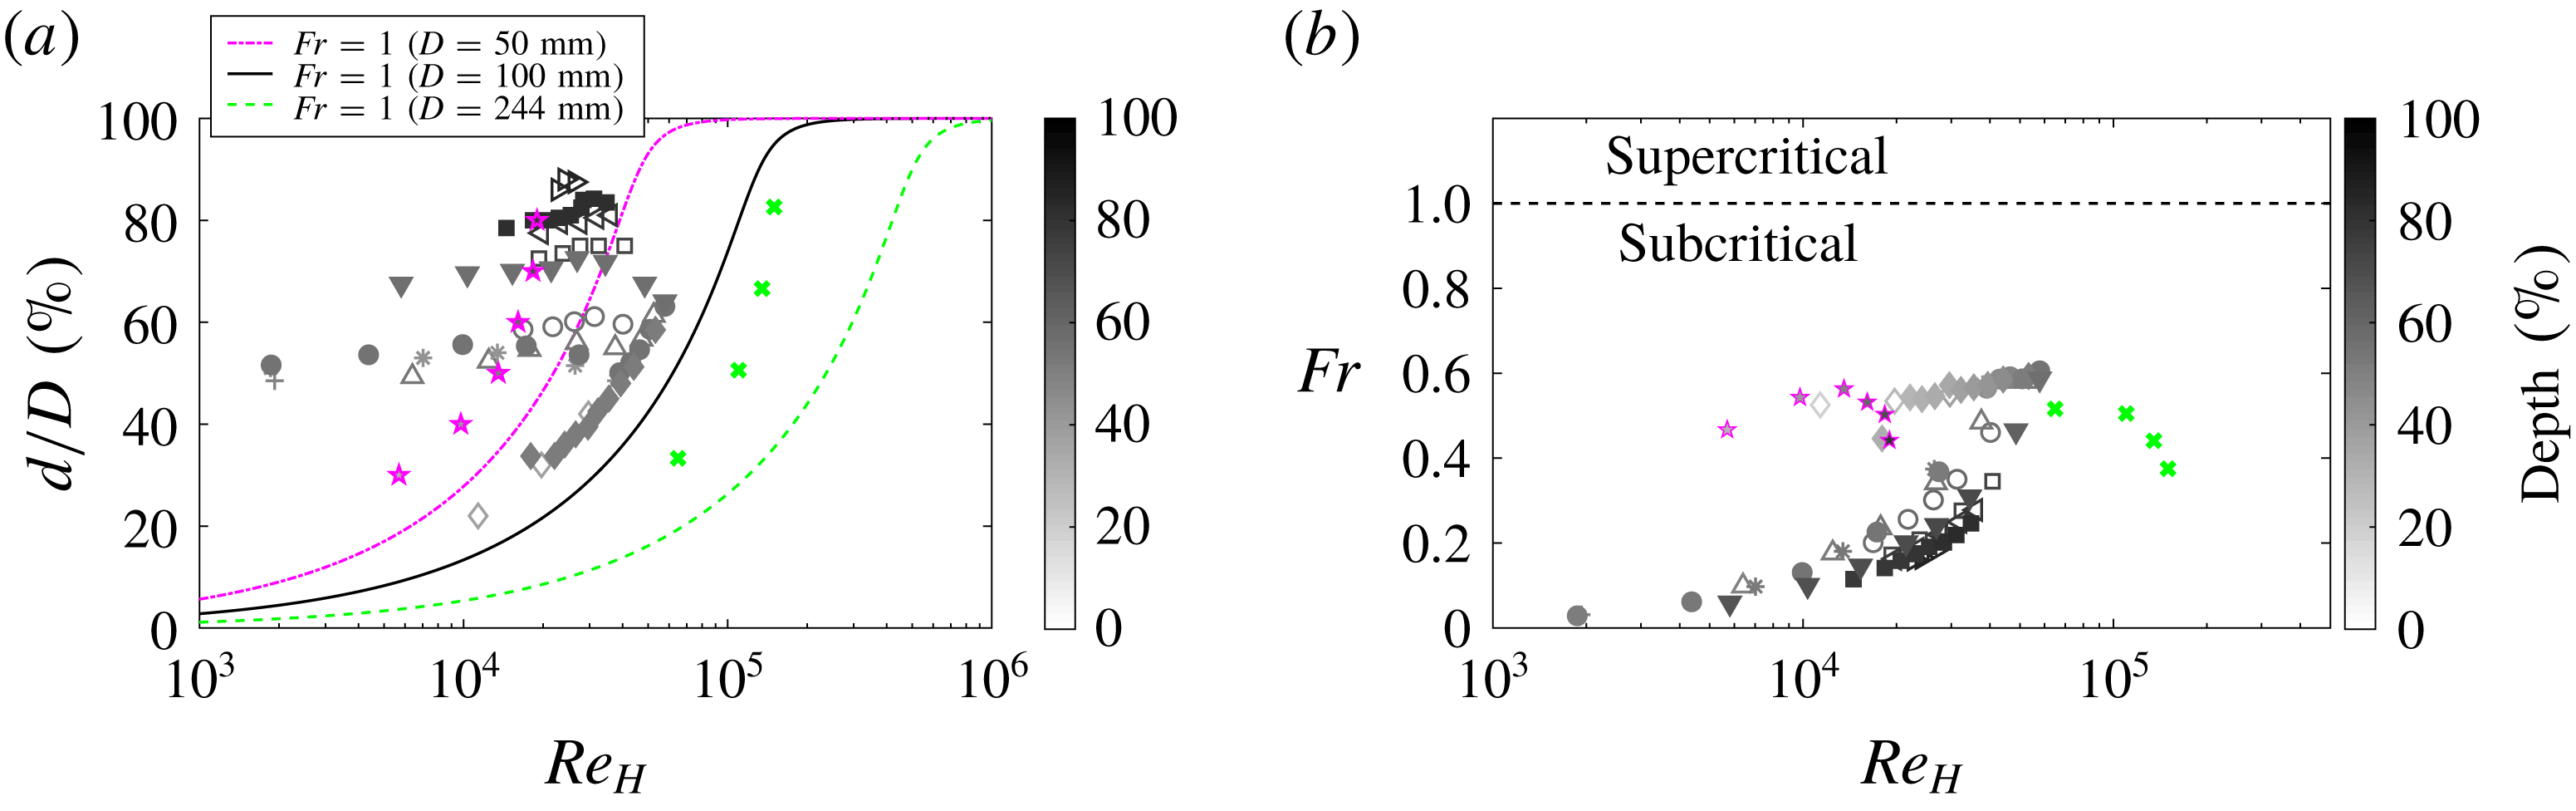
(a) Local flow depth and (b) local Froude number as a function of local Reynolds number
 $Re_{H}$
taken at
$Re_{H}$
taken at
 $x/D=210$
. Grey scale symbols: current study; green (
$x/D=210$
. Grey scale symbols: current study; green (
 $\times$
): data from Sterling & Knight (Reference Sterling and Knight2000) and magenta (
$\times$
): data from Sterling & Knight (Reference Sterling and Knight2000) and magenta (
 $\star$
): data from Yoon et al. (Reference Yoon, Sung and Lee2012). Lines represent locus of points for
$\star$
): data from Yoon et al. (Reference Yoon, Sung and Lee2012). Lines represent locus of points for
 $Fr=1$
calculated for pipe diameters,
$Fr=1$
calculated for pipe diameters,
 $D=50~\text{mm}$
(magenta, dot-dash);
$D=50~\text{mm}$
(magenta, dot-dash);
 $D=100~\text{ mm}$
(black, solid) and
$D=100~\text{ mm}$
(black, solid) and
 $D=244~\text{ mm}$
(green, dashed).
$D=244~\text{ mm}$
(green, dashed).
(a) Local flow depth and (b) local Froude number as a function of local Reynolds number
 $Re_{H}$
taken at
$Re_{H}$
taken at
 $x/D=230$
. All symbols coloured by depth.
$x/D=230$
. All symbols coloured by depth.
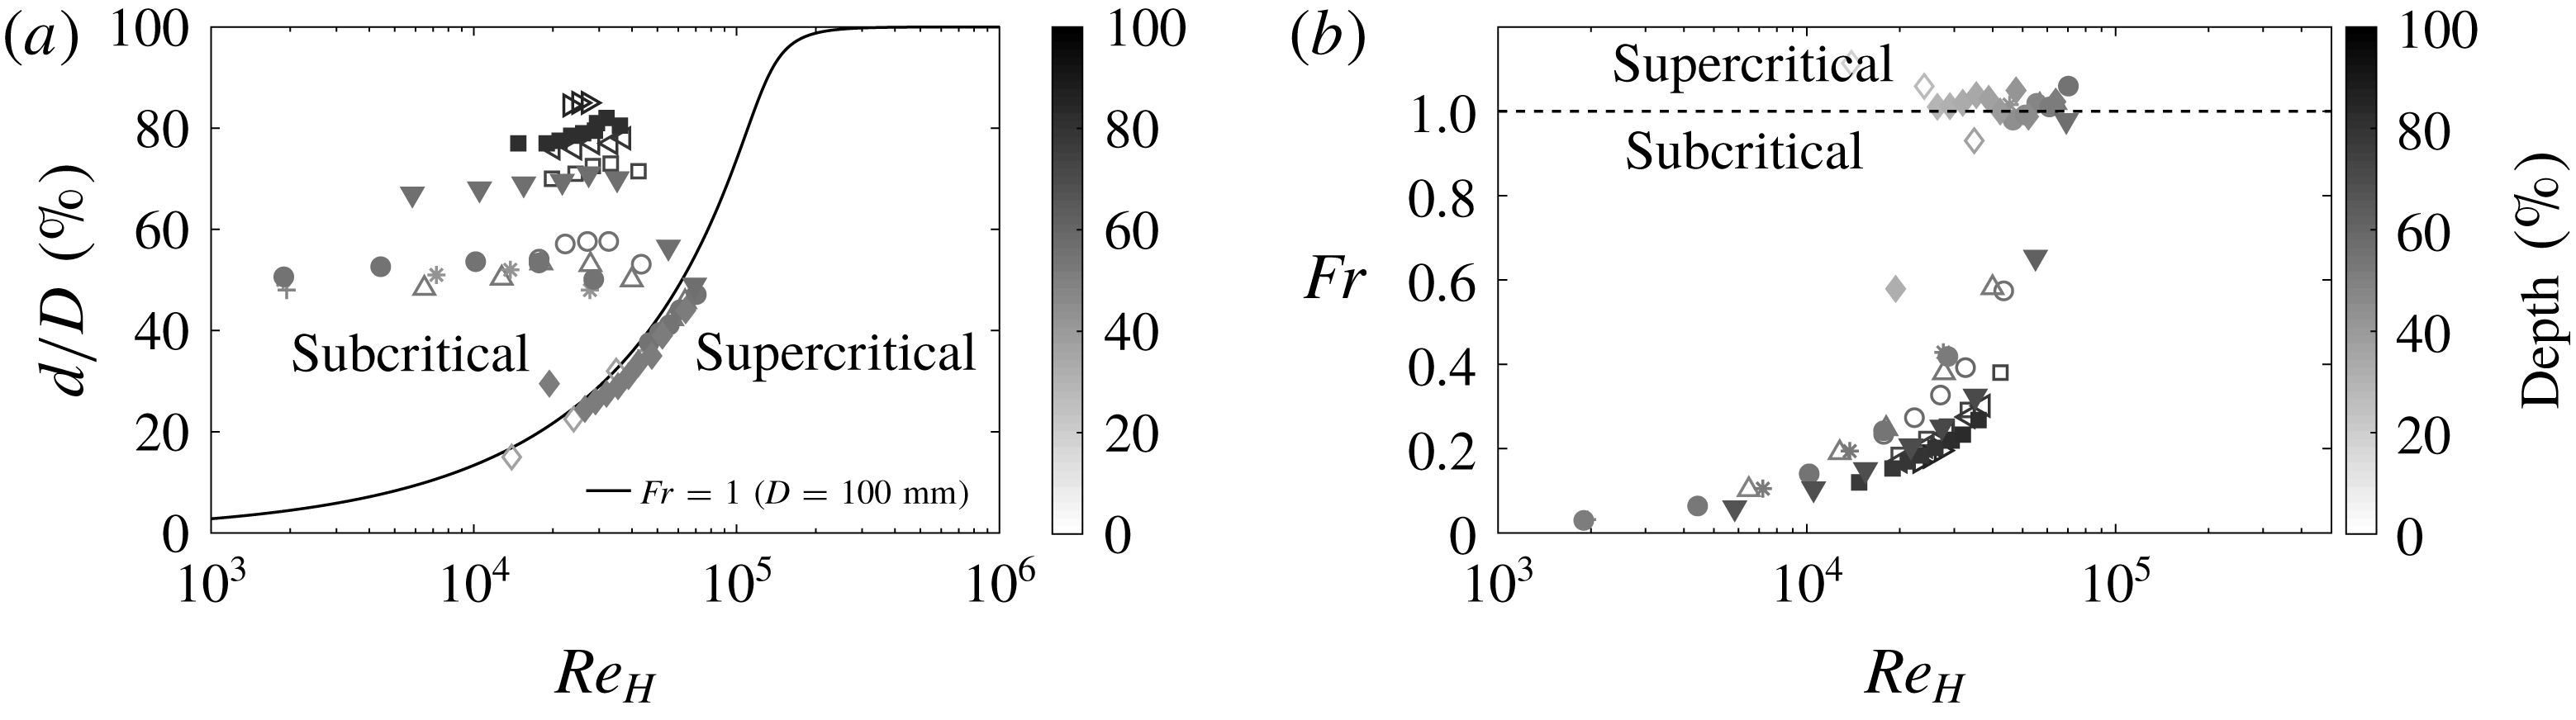
It can be seen in figure 3(a) that for flow depths
 $d/D\lesssim 40\,\%$
, the data collected from the VLSPF facility collapse onto a curve that represents a constant value of Froude number
$d/D\lesssim 40\,\%$
, the data collected from the VLSPF facility collapse onto a curve that represents a constant value of Froude number
 $(Fr\approx 0.6)$
– the value of which changes with axial location due to variation in depth and velocity. This can be seen clearly in figure 4(a), where as the Reynolds number is increasing, the data tend to a higher constant value of Froude number. We can see from figure 4 that the flow is weakly supercritical (
$(Fr\approx 0.6)$
– the value of which changes with axial location due to variation in depth and velocity. This can be seen clearly in figure 4(a), where as the Reynolds number is increasing, the data tend to a higher constant value of Froude number. We can see from figure 4 that the flow is weakly supercritical (
 $Fr>1$
) at
$Fr>1$
) at
 $x/D=230$
for depths
$x/D=230$
for depths
 $d/D\lesssim 40\,\%$
. Whenever the flow is supercritical
$d/D\lesssim 40\,\%$
. Whenever the flow is supercritical
 $(Fr>1)$
, standing waves appear on the free surface at the pipe exit (see for example: figure 5). Knight & Sterling (Reference Knight and Sterling2000) and Yoon et al. (Reference Yoon, Sung and Lee2012) conducted their experiments in gravity-driven facilities with different pipe diameters than used in this study, however, their data also appear to collapse onto corresponding lines of constant Froude numbers (see figure 3
a), similar to the behaviour observed when the VLSPF facility is running at less than
$(Fr>1)$
, standing waves appear on the free surface at the pipe exit (see for example: figure 5). Knight & Sterling (Reference Knight and Sterling2000) and Yoon et al. (Reference Yoon, Sung and Lee2012) conducted their experiments in gravity-driven facilities with different pipe diameters than used in this study, however, their data also appear to collapse onto corresponding lines of constant Froude numbers (see figure 3
a), similar to the behaviour observed when the VLSPF facility is running at less than
 $d/D=40\,\%$
. This suggests, under certain conditions, the flow at the end of our pressurized facility behaves in the same way as a flow discharging from a gravity driven facility.
$d/D=40\,\%$
. This suggests, under certain conditions, the flow at the end of our pressurized facility behaves in the same way as a flow discharging from a gravity driven facility.
Photo of example standing wave at pipe exit when flow is in super-critical regime.

When we have supercritical conditions the flow, of course, cannot discharge from our pressurised pipe facility. In fact our pressurised pipe facility begins to fill for constant pump speed and neither the mass flow rate nor the flow depth can be kept at a constant level. It was observed that over the course of
 $10$
minutes the flow depth would increase approximately
$10$
minutes the flow depth would increase approximately
 $1~\text{mm}$
(
$1~\text{mm}$
(
 $1\,\%$
), but the mass flow rate would increase on the order of
$1\,\%$
), but the mass flow rate would increase on the order of
 $10\,\%$
. This sets one of the physical limits we have on the parameter space in which we can operate the VLSPF rig partially full. The other physical limitation is taken from the pipe inlet: when the Reynolds number is increased for any given flow depth; the free surface must rise at the pipe inlet to preserve equilibrium. Thus when the pipe is nearly full, the usable range of Reynolds numbers is limited by the pipe filling at the inlet and when the pipe is very shallow it is limited by the flow becoming supercritical at the exit. Between these limits, approximately bounded by
$10\,\%$
. This sets one of the physical limits we have on the parameter space in which we can operate the VLSPF rig partially full. The other physical limitation is taken from the pipe inlet: when the Reynolds number is increased for any given flow depth; the free surface must rise at the pipe inlet to preserve equilibrium. Thus when the pipe is nearly full, the usable range of Reynolds numbers is limited by the pipe filling at the inlet and when the pipe is very shallow it is limited by the flow becoming supercritical at the exit. Between these limits, approximately bounded by
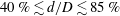 $40\,\%\lesssim d/D\lesssim 85\,\%$
, we have essentially independent control over flow depth and Reynolds number, albeit for a decreasing Reynolds number range with increasing flow depth.
$40\,\%\lesssim d/D\lesssim 85\,\%$
, we have essentially independent control over flow depth and Reynolds number, albeit for a decreasing Reynolds number range with increasing flow depth.
5 One-dimensional steady-flow energy equation estimate of friction factor
By assuming that the flow is one-dimensional, we are able to estimate the mean total resistance due to fluid friction in partially filled pipe flow using the steady-flow energy equation;
 $$\begin{eqnarray}\frac{P_{1}}{\unicode[STIX]{x1D70C}g}+\frac{V_{1}^{2}}{2g}+d_{1}=\frac{P_{2}}{\unicode[STIX]{x1D70C}g}+\frac{V_{2}^{2}}{2g}+d_{2}+h_{f},\end{eqnarray}$$
where
 $P$
is pressure,
$P$
is pressure,
 $V$
the local bulk velocity,
$V$
the local bulk velocity,
 $d$
the local depth (measured along the pipe vertical bisector),
$d$
the local depth (measured along the pipe vertical bisector),
 $g$
gravitational acceleration,
$g$
gravitational acceleration,
 $\unicode[STIX]{x1D70C}$
fluid density and
$\unicode[STIX]{x1D70C}$
fluid density and
 $h_{f}$
the frictional losses, with subscripts indicating different streamwise locations.
$h_{f}$
the frictional losses, with subscripts indicating different streamwise locations.
 $P$
,
$P$
,
 $V$
and
$V$
and
 $d$
are time-averaged values and, as we do not have high resolution measurements of surface fluctuations, we have assumed that the free surface level fluctuations are small relative to flow depth (which we can confirm from visual observation). With optical access to the working section, we are able to measure the flow depth at various locations along the pipe axis as outlined in § 3. From the flow depth we have the flow cross-sectional area and thus can deduce the local bulk velocity from the mass flow meter readings. Finally we measure the pressure in the air phase by connecting one port of a differential pressure transducer (MKS Baratron 398HD-01000SP05) to the pipe working-section pressure taps and leaving the other port open to atmosphere. In so doing it was observed that the air phase pressure was nominally constant (to within measurement uncertainty). Therefore, if we consider a streamline on the free surface, and rearrange (5.1), we obtain a simple relation for the estimated friction loss in the fluid phase;
$d$
are time-averaged values and, as we do not have high resolution measurements of surface fluctuations, we have assumed that the free surface level fluctuations are small relative to flow depth (which we can confirm from visual observation). With optical access to the working section, we are able to measure the flow depth at various locations along the pipe axis as outlined in § 3. From the flow depth we have the flow cross-sectional area and thus can deduce the local bulk velocity from the mass flow meter readings. Finally we measure the pressure in the air phase by connecting one port of a differential pressure transducer (MKS Baratron 398HD-01000SP05) to the pipe working-section pressure taps and leaving the other port open to atmosphere. In so doing it was observed that the air phase pressure was nominally constant (to within measurement uncertainty). Therefore, if we consider a streamline on the free surface, and rearrange (5.1), we obtain a simple relation for the estimated friction loss in the fluid phase;
 $$\begin{eqnarray}h_{f}=\frac{V_{1}^{2}-V_{2}^{2}}{2g}+(d_{1}-d_{2}),\end{eqnarray}$$
from which we can obtain a friction factor,
 $f_{H}$
, based on hydraulic diameter
$f_{H}$
, based on hydraulic diameter
 $D_{H}$
;
$D_{H}$
;
 $$\begin{eqnarray}f_{H}=\frac{h_{f}}{\displaystyle \frac{L}{D_{H,avg}}\frac{V_{avg}^{2}}{2g}},\end{eqnarray}$$
and similarly a friction factor,
 $f_{EQ}$
, based on equivalent diameter
$f_{EQ}$
, based on equivalent diameter
 $D_{EQ}$
 $$\begin{eqnarray}f_{EQ}=\frac{h_{f}}{\displaystyle \frac{L}{D_{EQ,avg}}\frac{V_{avg}^{2}}{2g}}.\end{eqnarray}$$
This ‘inferred’ friction factor measured at
 $x/D=210$
is plotted against both local hydraulic Reynolds number and local equivalent Reynolds number in figures 6(a) and 6(b), respectively. Each grey scale symbol represents a series of measurements with different initial water depths and all symbols are shaded by depth. The magenta stars and green crosses are data reported in Knight & Sterling (Reference Knight and Sterling2000) and Yoon et al. (Reference Yoon, Sung and Lee2012), respectively. The solid black line is the full pipe flow correlation of Blasius
$x/D=210$
is plotted against both local hydraulic Reynolds number and local equivalent Reynolds number in figures 6(a) and 6(b), respectively. Each grey scale symbol represents a series of measurements with different initial water depths and all symbols are shaded by depth. The magenta stars and green crosses are data reported in Knight & Sterling (Reference Knight and Sterling2000) and Yoon et al. (Reference Yoon, Sung and Lee2012), respectively. The solid black line is the full pipe flow correlation of Blasius
 $f=0.316Re^{-1/4}$
with error bars of
$f=0.316Re^{-1/4}$
with error bars of
 $\pm 15\,\%$
represented by the black dashed lines. Friction factor values calculated from pressure-drop measurements when the VLSPF facility was running full are plotted as red circles for comparison.
$\pm 15\,\%$
represented by the black dashed lines. Friction factor values calculated from pressure-drop measurements when the VLSPF facility was running full are plotted as red circles for comparison.
Inferred friction factor versus Reynolds number at
 $x/D=210$
, (a) using
$x/D=210$
, (a) using
 $D_{H}$
and (b) using
$D_{H}$
and (b) using
 $D_{EQ}$
(insets show the variation of
$D_{EQ}$
(insets show the variation of
 $D_{H}$
and
$D_{H}$
and
 $D_{EQ}$
with flow depth
$D_{EQ}$
with flow depth
 $d/D$
, respectively). Grey scale symbols: friction factor from partially filled pipe flow coloured by depth. Blue outlined symbols highlight data where
$d/D$
, respectively). Grey scale symbols: friction factor from partially filled pipe flow coloured by depth. Blue outlined symbols highlight data where
 $d/D=50\pm 2\,\%$
. Red circles: friction factor calculated from pressure-drop measurements in VLSPF facility running full. Green (
$d/D=50\pm 2\,\%$
. Red circles: friction factor calculated from pressure-drop measurements in VLSPF facility running full. Green (
 $\times$
): data from Sterling & Knight (Reference Sterling and Knight2000) and magenta (
$\times$
): data from Sterling & Knight (Reference Sterling and Knight2000) and magenta (
 $\star$
): data from Yoon et al. (Reference Yoon, Sung and Lee2012). Solid black line: Blasius correlation –
$\star$
): data from Yoon et al. (Reference Yoon, Sung and Lee2012). Solid black line: Blasius correlation –
 $f=0.316Re^{-1/4}$
and dashed lines:
$f=0.316Re^{-1/4}$
and dashed lines:
 $\pm 15\,\%$
error to Blasius correlation.
$\pm 15\,\%$
error to Blasius correlation.

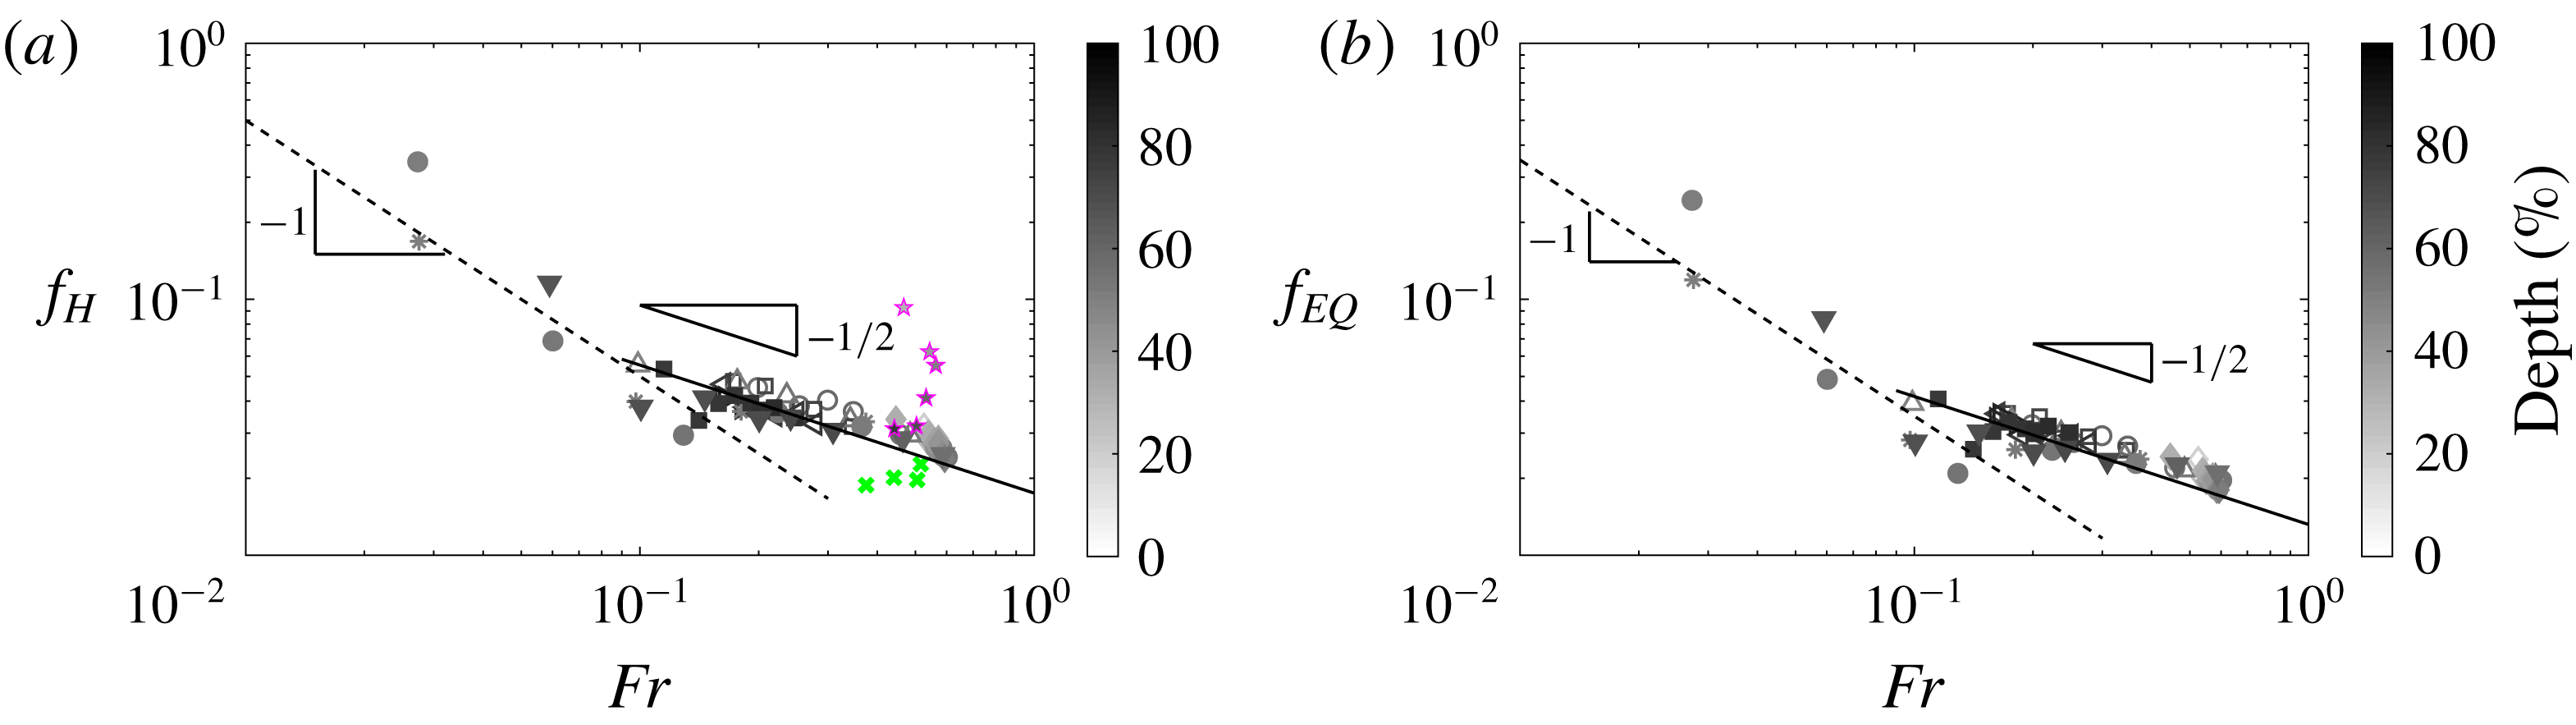
Inferred friction factor versus Froude number at
 $x/D=210$
. (a) using
$x/D=210$
. (a) using
 $D_{H}$
and (b) using
$D_{H}$
and (b) using
 $D_{EQ}$
. Grey scale symbols: friction factor from partially filled pipe flow coloured by depth. Green
$D_{EQ}$
. Grey scale symbols: friction factor from partially filled pipe flow coloured by depth. Green
 $(\times )$
: data from Sterling & Knight (Reference Sterling and Knight2000) and magenta
$(\times )$
: data from Sterling & Knight (Reference Sterling and Knight2000) and magenta
 $(\star )$
: data from Yoon et al. (Reference Yoon, Sung and Lee2012). Solid black line:
$(\star )$
: data from Yoon et al. (Reference Yoon, Sung and Lee2012). Solid black line:
 $f\sim Fr^{-1/2}$
and dashed black line
$f\sim Fr^{-1/2}$
and dashed black line
 $f\sim Fr^{-1}$
.
$f\sim Fr^{-1}$
.
It would appear that the friction factor is no longer a simple function of Reynolds number (regardless of the definition used). When the friction factor is plotted against
 $Re_{H}$
as in figure 6(a), we see that the friction factor approaches the Blasius correlation for full pipe flow with decreasing depth which is somewhat expected – at the shallow flow limit, the flow is similar to wide open channel flow and approaches two-dimensional flow. When the pipe is running nearly full, the flow is highly three-dimensional and we see that the friction factor is increasing with flow depth for constant Reynolds numbers. In laminar flow, the velocity is unidirectional i.e. (
$Re_{H}$
as in figure 6(a), we see that the friction factor approaches the Blasius correlation for full pipe flow with decreasing depth which is somewhat expected – at the shallow flow limit, the flow is similar to wide open channel flow and approaches two-dimensional flow. When the pipe is running nearly full, the flow is highly three-dimensional and we see that the friction factor is increasing with flow depth for constant Reynolds numbers. In laminar flow, the velocity is unidirectional i.e. (
 $v=w=0$
) but varies spatially over the cross-section of the pipe, however, the friction factor still decreases with Reynolds number at approximately
$v=w=0$
) but varies spatially over the cross-section of the pipe, however, the friction factor still decreases with Reynolds number at approximately
 $Re^{-1}$
as in a full pipe (trend line not shown in figure 6). The data from Yoon et al. (Reference Yoon, Sung and Lee2012) are in the transitional regime and appear to follow the same trends as our inferred friction factor for the same Reynolds numbers. The data from Knight & Sterling (Reference Knight and Sterling2000), however, do not appear to show a dependence on flow depth. In figure 6(b), where we have rescaled the inferred friction factor data and Reynolds number with the equivalent diameter defined in § 2, a different trend emerges. Generally speaking, the Blasius correlation for full pipe flow over-predicts the inferred friction factor for
$Re^{-1}$
as in a full pipe (trend line not shown in figure 6). The data from Yoon et al. (Reference Yoon, Sung and Lee2012) are in the transitional regime and appear to follow the same trends as our inferred friction factor for the same Reynolds numbers. The data from Knight & Sterling (Reference Knight and Sterling2000), however, do not appear to show a dependence on flow depth. In figure 6(b), where we have rescaled the inferred friction factor data and Reynolds number with the equivalent diameter defined in § 2, a different trend emerges. Generally speaking, the Blasius correlation for full pipe flow over-predicts the inferred friction factor for
 $d/D\lesssim 50\,\%$
and under-predicts the inferred friction factor for
$d/D\lesssim 50\,\%$
and under-predicts the inferred friction factor for
 $d/D\gtrsim 50\,\%$
. It is not clear why this is the case, but it does reveal that the friction factor versus Reynolds number scaling for full pipe flow does not appear to hold for partially filled pipe flow (based on our estimate of friction factor).
$d/D\gtrsim 50\,\%$
. It is not clear why this is the case, but it does reveal that the friction factor versus Reynolds number scaling for full pipe flow does not appear to hold for partially filled pipe flow (based on our estimate of friction factor).
We replot the inferred friction factor data as a function of Froude number in figure 7, where the friction factors in figure 7(a) are calculated using hydraulic diameter and in figure 7(b), friction factors are calculated using the equivalent diameter. The Froude number is calculated from the local bulk velocity and local hydraulic mean depth at
 $x/D=210$
. Our inferred friction factor appears to show two distinct trends. The data collapse well for Froude numbers between
$x/D=210$
. Our inferred friction factor appears to show two distinct trends. The data collapse well for Froude numbers between
 $0.1\lesssim Fr\lesssim 1$
where the friction factor appears to scale with Froude number according to
$0.1\lesssim Fr\lesssim 1$
where the friction factor appears to scale with Froude number according to
 $f\sim Fr^{-1/2}$
. There is more scatter in the data for
$f\sim Fr^{-1/2}$
. There is more scatter in the data for
 $Fr<0.1$
, but in this region friction factor appears to scale as
$Fr<0.1$
, but in this region friction factor appears to scale as
 $f\sim Fr^{-1}$
albeit with only a very limited amount of data. These trend lines are drawn in figure 7 as solid and dashed lines, respectively. From figures 6 and 7 it is clear that the friction factor in pressure-driven partially filled pipes is a function of both Reynolds and Froude numbers, although it is unclear as to why the data reported in Knight & Sterling (Reference Knight and Sterling2000) and Yoon et al. (Reference Yoon, Sung and Lee2012) do not show the same trends. This discrepancy may be due to some inherent difference between gravity-driven and pressure-driven flows or it may be that our method for estimating friction factor is too simplistic to capture certain subtle aspects of the flow.
$f\sim Fr^{-1}$
albeit with only a very limited amount of data. These trend lines are drawn in figure 7 as solid and dashed lines, respectively. From figures 6 and 7 it is clear that the friction factor in pressure-driven partially filled pipes is a function of both Reynolds and Froude numbers, although it is unclear as to why the data reported in Knight & Sterling (Reference Knight and Sterling2000) and Yoon et al. (Reference Yoon, Sung and Lee2012) do not show the same trends. This discrepancy may be due to some inherent difference between gravity-driven and pressure-driven flows or it may be that our method for estimating friction factor is too simplistic to capture certain subtle aspects of the flow.
Due to the relatively large uncertainty associated with this indirect method of obtaining the friction factor we refrain from presenting the velocity data scaled using wall variables and only non-dimensionalise our velocity data using outer variables; the appropriate scaling for the large-scale turbulent motions.
6 Laminar flow
The velocity profile in a full laminar circular pipe flow (Hagen–Poiseuille flow) is a textbook solution to the equations of Newtonian viscous fluid flows (White Reference White2006). However, until only recently, there were no theoretical solutions for laminar flow in partially full circular pipes. Guo & Meroney (Reference Guo and Meroney2013) were the first to realise a theoretical solution by introducing a free surface correction function linearly superposed onto the classical Hagen–Poiseuille flow. Their theoretical velocity distribution (included here for completeness):
 $$\begin{eqnarray}U=\frac{\sin \unicode[STIX]{x1D703}\sin (\unicode[STIX]{x1D702}-\unicode[STIX]{x1D703})}{2(\cosh \unicode[STIX]{x1D709}-\cos \unicode[STIX]{x1D702})}-\frac{\sin 2\unicode[STIX]{x1D703}}{2}\int _{0}^{\infty }\frac{\sinh k(\unicode[STIX]{x03C0}+\unicode[STIX]{x1D703}-\unicode[STIX]{x1D702})\cos k\unicode[STIX]{x1D709}}{\sinh k\unicode[STIX]{x03C0}\cosh k\unicode[STIX]{x1D6FC}}\,\text{d}k,\end{eqnarray}$$
is solved in a bipolar coordinate system,
 $(\unicode[STIX]{x1D709},\unicode[STIX]{x1D702})$
, where
$(\unicode[STIX]{x1D709},\unicode[STIX]{x1D702})$
, where
 $k$
is the transform variable for
$k$
is the transform variable for
 $\unicode[STIX]{x1D709}$
. The relationship between bipolar and Cartesian
$\unicode[STIX]{x1D709}$
. The relationship between bipolar and Cartesian
 $(y,z)$
coordinate systems is;
$(y,z)$
coordinate systems is;
 $$\begin{eqnarray}\frac{y}{R}=\frac{\sin \unicode[STIX]{x1D703}\sinh \unicode[STIX]{x1D709}}{\cosh \unicode[STIX]{x1D709}-\cos \unicode[STIX]{x1D702}},\end{eqnarray}$$
and
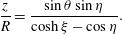 $$\begin{eqnarray}\frac{z}{R}=\frac{\sin \unicode[STIX]{x1D703}\sin \unicode[STIX]{x1D702}}{\cosh \unicode[STIX]{x1D709}-\cos \unicode[STIX]{x1D702}}.\end{eqnarray}$$
The work of Guo & Meroney (Reference Guo and Meroney2013) was subsequently extended by Fullard & Wake (Reference Fullard and Wake2015) who predicted that the velocity dip phenomenon would first appear for flow depths in excess of
 $d/D=86\,\%$
and that the maximum velocity increases with fill depth up to a maximum of around
$d/D=86\,\%$
and that the maximum velocity increases with fill depth up to a maximum of around
 $d/D=77\,\%$
. In this section we report measured streamwise velocity distributions for a range of flow depths in the laminar regime and attempt to experimentally verify the theoretical solutions put forward by Guo & Meroney (Reference Guo and Meroney2013) and Fullard & Wake (Reference Fullard and Wake2015). We take advantage of our one symmetry plane and symmetrise the measured streamwise velocity distributions about the pipe vertical bisector before comparison to the reported theoretical solutions. The Reynolds number for the laminar flow velocity measurements was kept below
$d/D=77\,\%$
. In this section we report measured streamwise velocity distributions for a range of flow depths in the laminar regime and attempt to experimentally verify the theoretical solutions put forward by Guo & Meroney (Reference Guo and Meroney2013) and Fullard & Wake (Reference Fullard and Wake2015). We take advantage of our one symmetry plane and symmetrise the measured streamwise velocity distributions about the pipe vertical bisector before comparison to the reported theoretical solutions. The Reynolds number for the laminar flow velocity measurements was kept below
 $Re_{H}=500$
so that we are far away from transitional Reynolds numbers; the maximum root mean square streamwise velocity fluctuations were no more than 4 % of
$Re_{H}=500$
so that we are far away from transitional Reynolds numbers; the maximum root mean square streamwise velocity fluctuations were no more than 4 % of
 $U_{max}$
(within the expected noise level of the S-PIV measurement system) so we can safely assume that the flow is indeed laminar.
$U_{max}$
(within the expected noise level of the S-PIV measurement system) so we can safely assume that the flow is indeed laminar.
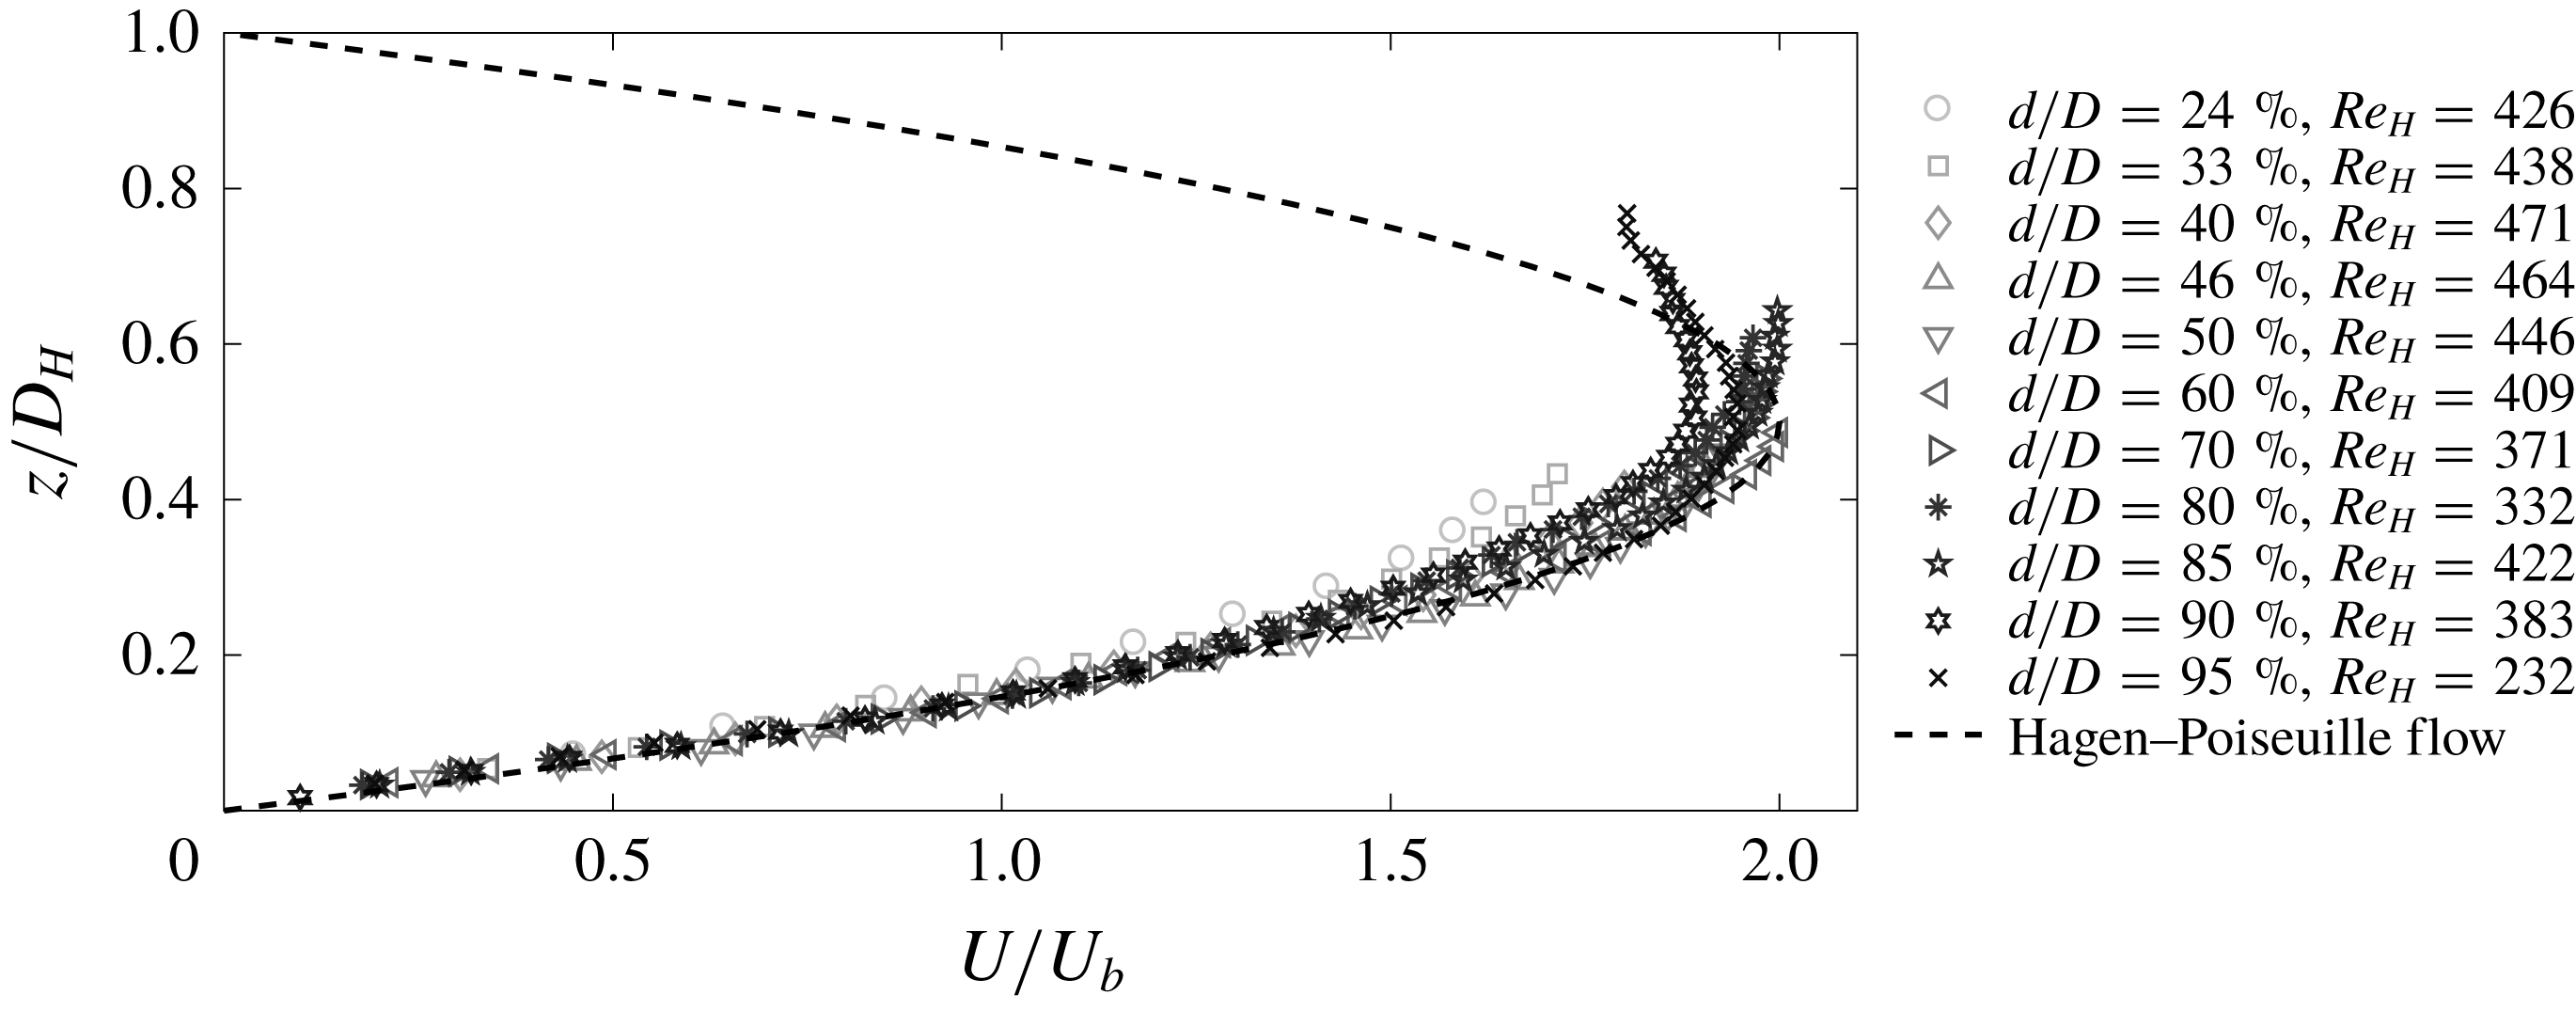
Streamwise mean velocity profiles at pipe vertical bisector
 $U/U_{b}$
.
$U/U_{b}$
.
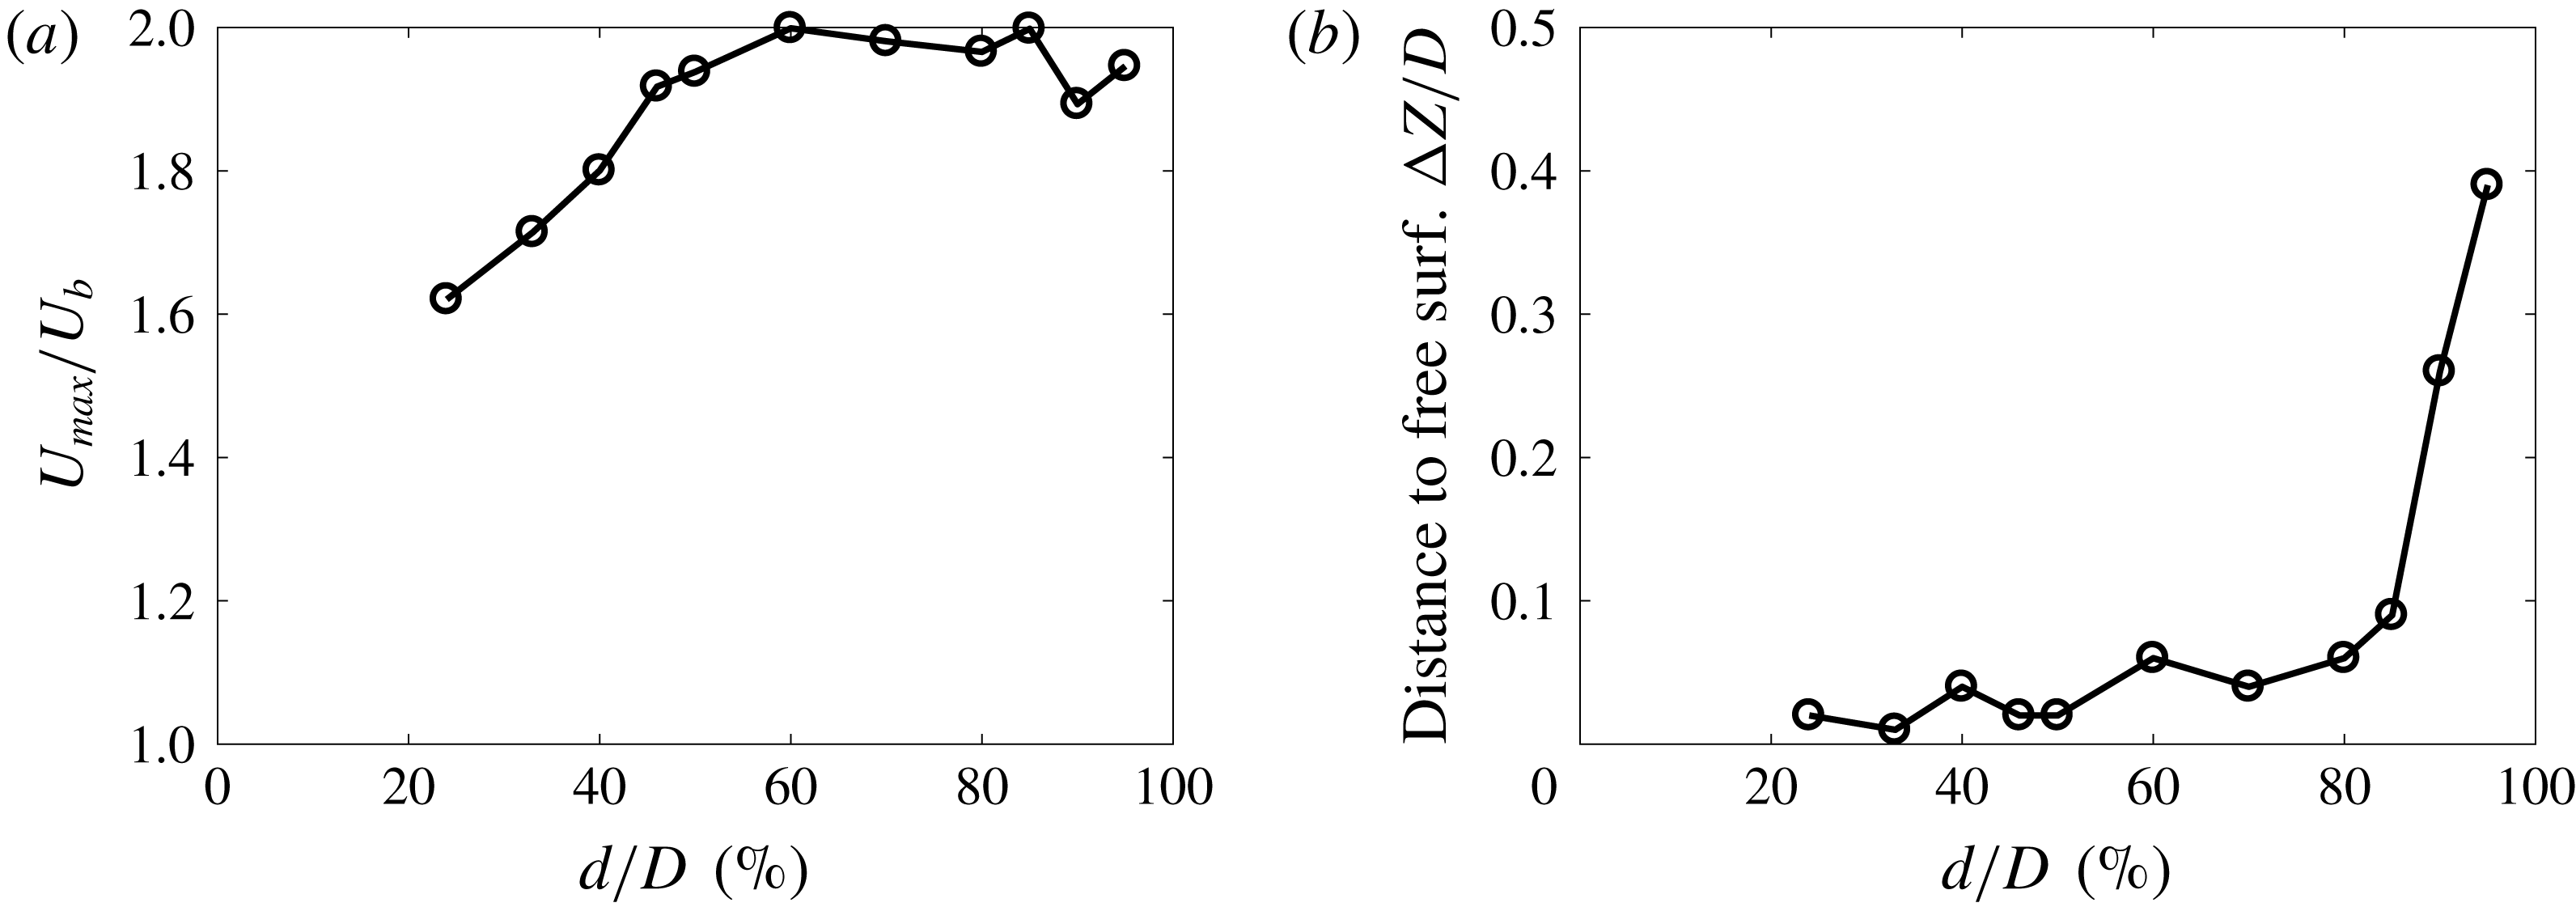
(a) Maximum streamwise velocity normalised by bulk velocity
 $U_{max}/U_{b}$
as a function of flow depth. (b) Location of maximum streamwise velocity as a function of flow depth.
$U_{max}/U_{b}$
as a function of flow depth. (b) Location of maximum streamwise velocity as a function of flow depth.
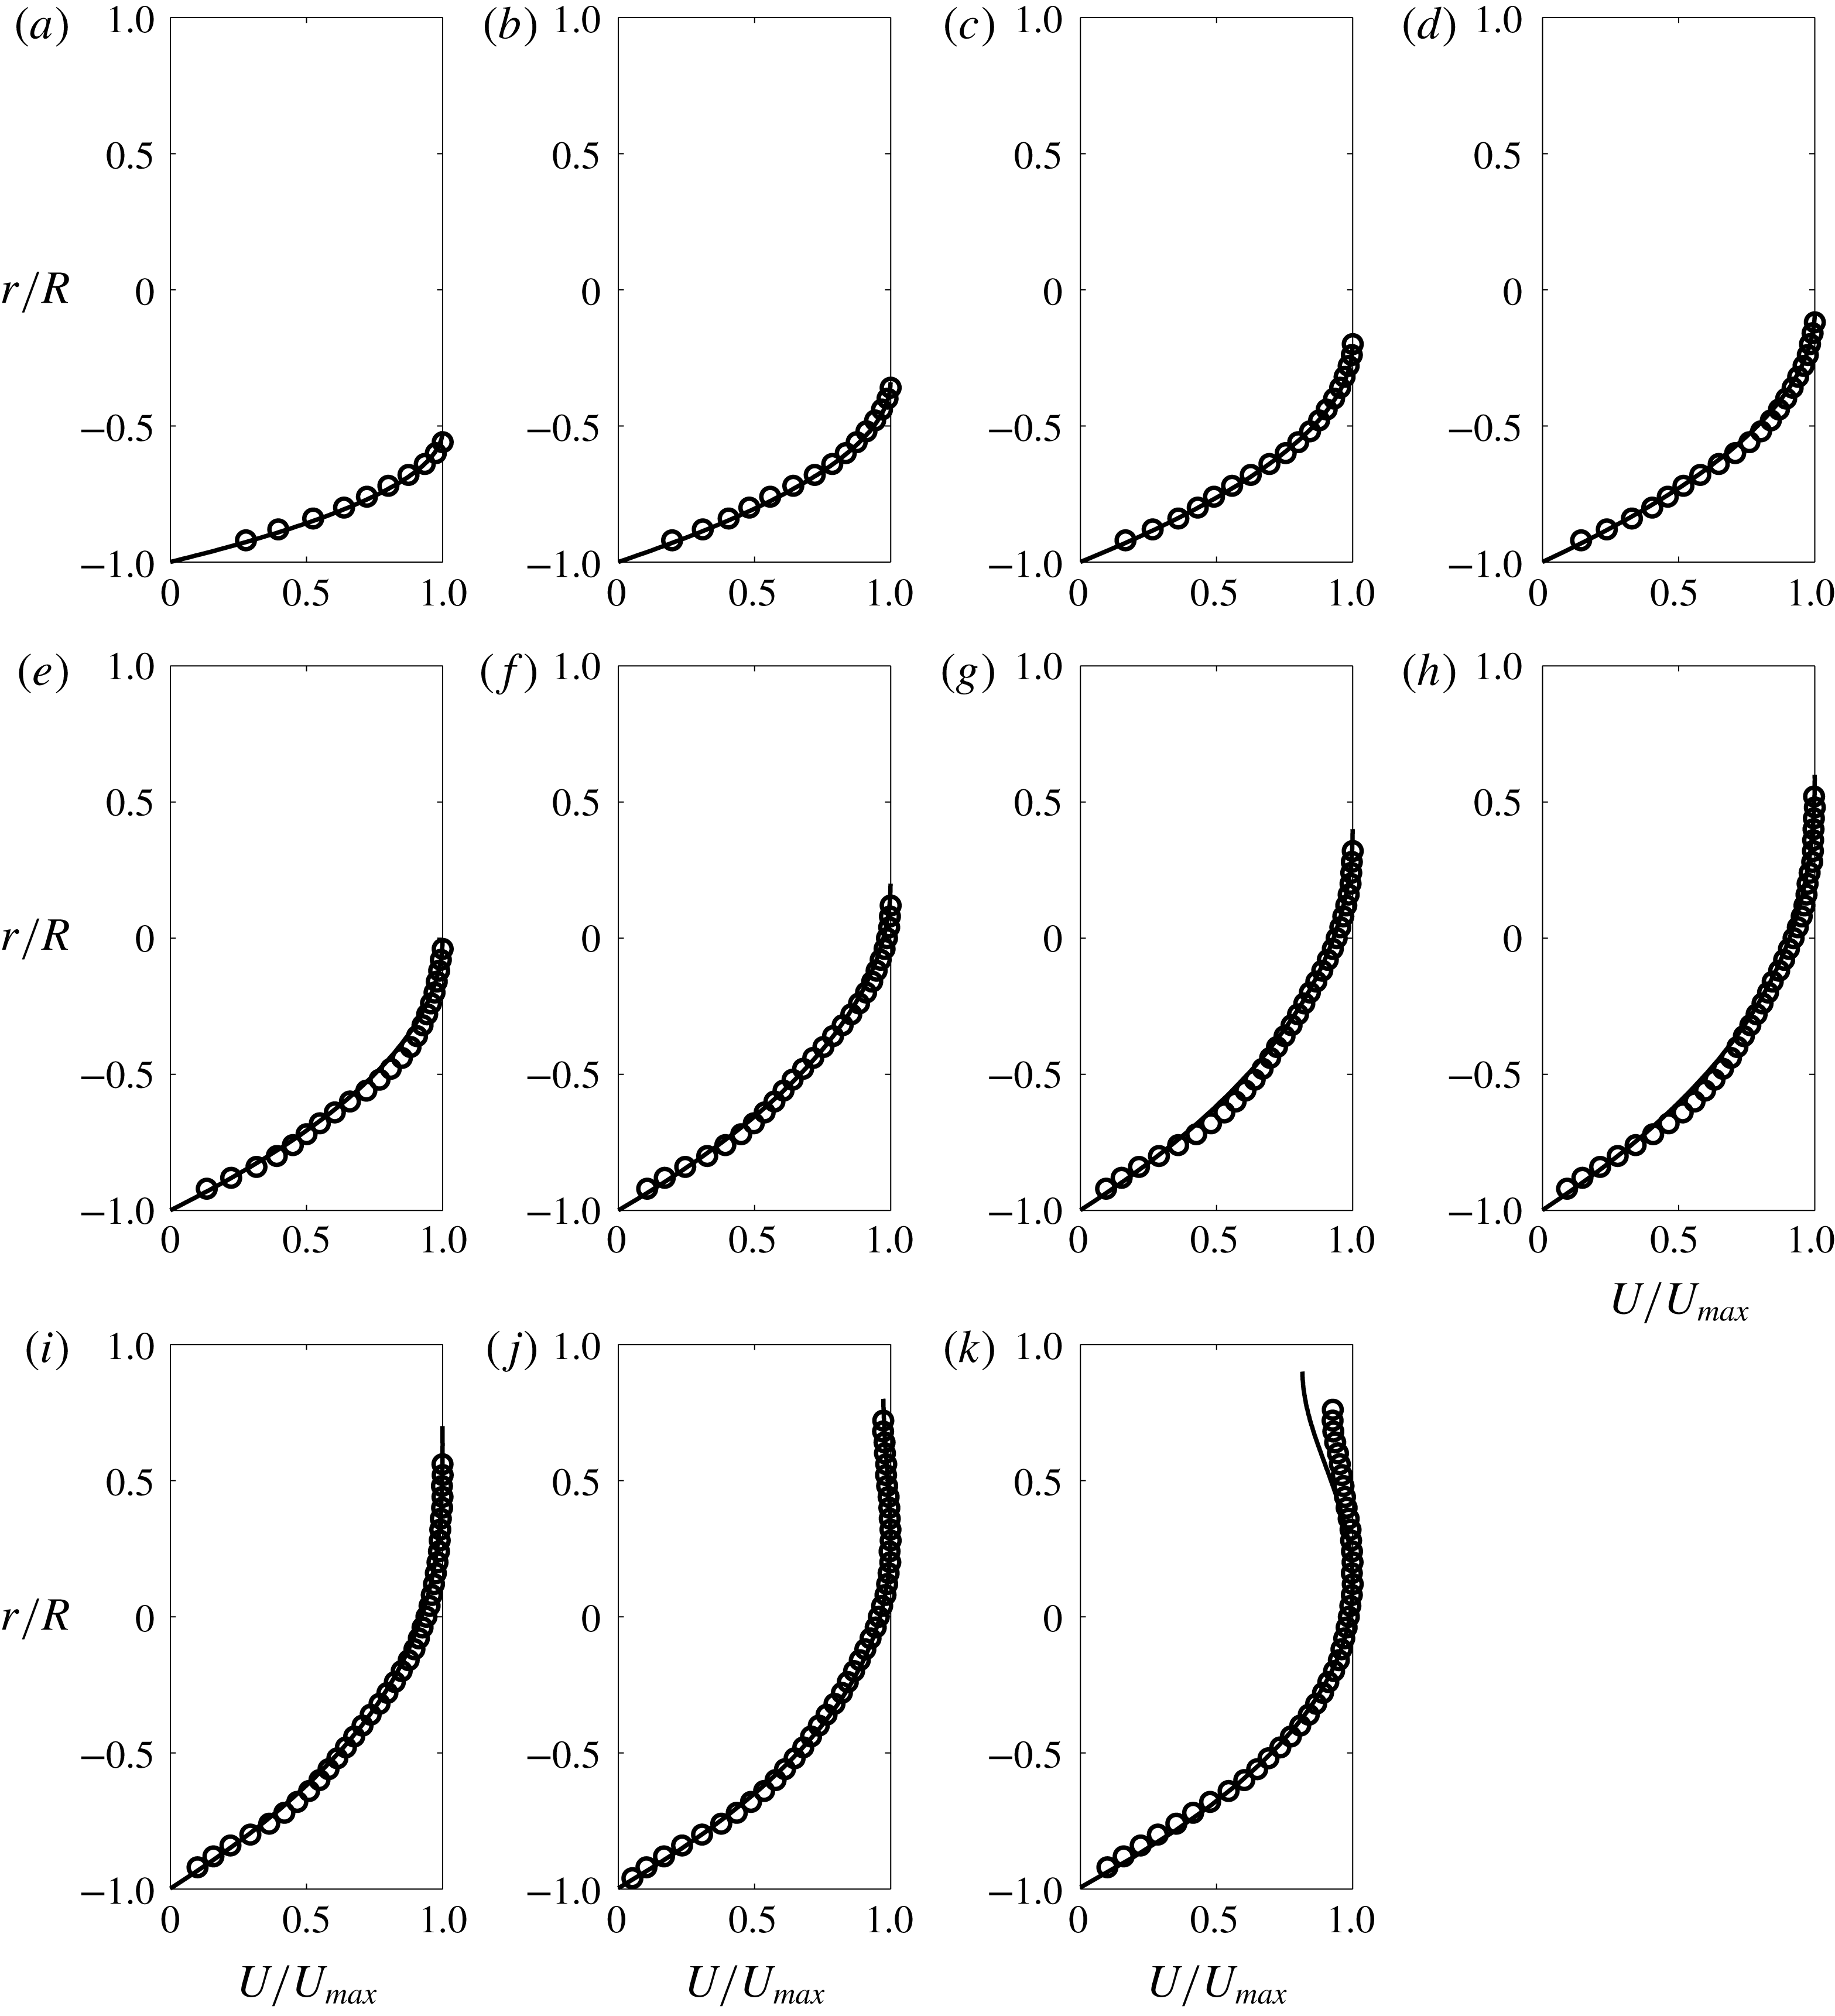
Streamwise mean velocity profiles at pipe vertical bisector
 $U/U_{max}$
: Black ○: experimental data and solid lines
$U/U_{max}$
: Black ○: experimental data and solid lines
 $(-)$
: theoretical profiles. (a)
$(-)$
: theoretical profiles. (a)
 $d/D=24\,\%$
 $(Re_{H}=426)$
; (b)
$(Re_{H}=426)$
; (b)
 $d/D=33\,\%$
 $(Re_{H}=438)$
; (c)
$(Re_{H}=438)$
; (c)
 $d/D=40\,\%$
 $(Re_{H}=471)$
; (d)
$(Re_{H}=471)$
; (d)
 $d/D=46\,\%$
 $(Re_{H}=464)$
; (e)
$(Re_{H}=464)$
; (e)
 $d/D=50\,\%$
 $(Re_{H}=446)$
; (f)
$(Re_{H}=446)$
; (f)
 $d/D=60\,\%$
 $(Re_{H}=409)$
; (g)
$(Re_{H}=409)$
; (g)
 $d/D=70\,\%$
 $(Re_{H}=371)$
; (h)
$(Re_{H}=371)$
; (h)
 $d/D=80\,\%$
 $(Re_{H}=332)$
; (i)
$(Re_{H}=332)$
; (i)
 $d/D=85\,\%$
 $(Re_{H}=422)$
; (j)
$(Re_{H}=422)$
; (j)
 $d/D=90\,\%$
 $(Re_{H}=383)$
and (k)
$(Re_{H}=383)$
and (k)
 $d/D=95\,\%$
 $(Re_{H}=232)$
.
$(Re_{H}=232)$
.
Measured streamwise velocity profiles along the pipe vertical bisector non-dimensionalised using hydraulic diameter,
 $D_{H}$
, and bulk velocity,
$D_{H}$
, and bulk velocity,
 $U_{b}$
, are plotted in figure 8. Here, we can see that at our lowest flow depth of
$U_{b}$
, are plotted in figure 8. Here, we can see that at our lowest flow depth of
 $d/D=24\,\%$
which has a corresponding free surface width
$d/D=24\,\%$
which has a corresponding free surface width
 $B/D=0.85$
, the maximum velocity is
$B/D=0.85$
, the maximum velocity is
 $U_{max}\approx 1.6U_{b}$
and the location of
$U_{max}\approx 1.6U_{b}$
and the location of
 $U_{max}$
appears at the free surface. As the flow depth is increased we continue to approach a maximum streamwise velocity of
$U_{max}$
appears at the free surface. As the flow depth is increased we continue to approach a maximum streamwise velocity of
 $U_{max}=2U_{b}$
with the location remaining at the free surface. At
$U_{max}=2U_{b}$
with the location remaining at the free surface. At
 $d/D=60\,\%$
, the maximum streamwise velocity is
$d/D=60\,\%$
, the maximum streamwise velocity is
 $U_{max}\approx 2U_{b}$
at the free surface and remains close to this value until
$U_{max}\approx 2U_{b}$
at the free surface and remains close to this value until
 $d/D\gtrsim 85\,\%$
. Beyond this flow depth, the maximum streamwise velocity appears below the free surface in what is commonly referred to in open channel flow literature as the ‘velocity dip’ phenomenon (Nezu Reference Nezu2005). The measured values of maximum streamwise velocity are plotted as a function of flow depth in figure 9(a) and the corresponding distance from the free surface plotted in figure 9(b). We can see in figure 9(a) that the maximum velocity increases with flow depth before plateauing between
$d/D\gtrsim 85\,\%$
. Beyond this flow depth, the maximum streamwise velocity appears below the free surface in what is commonly referred to in open channel flow literature as the ‘velocity dip’ phenomenon (Nezu Reference Nezu2005). The measured values of maximum streamwise velocity are plotted as a function of flow depth in figure 9(a) and the corresponding distance from the free surface plotted in figure 9(b). We can see in figure 9(a) that the maximum velocity increases with flow depth before plateauing between
 $60\,\%\lesssim d/D\lesssim 85\,\%$
before decreasing again for
$60\,\%\lesssim d/D\lesssim 85\,\%$
before decreasing again for
 $d/D=90\,\%$
. The slight increase in
$d/D=90\,\%$
. The slight increase in
 $U_{max}/U_{b}$
between
$U_{max}/U_{b}$
between
 $d/D=90$
and
$d/D=90$
and
 $95\,\%$
is due to a large relative error in flow rate measurements as when the pipe is running very full (
$95\,\%$
is due to a large relative error in flow rate measurements as when the pipe is running very full (
 $d/D\gtrsim 90\,\%$
) the bulk velocity is kept very low to prevent the pipe filling at inlet (see § 4). This small discrepancy should not take away from the trends observed: that the value of
$d/D\gtrsim 90\,\%$
) the bulk velocity is kept very low to prevent the pipe filling at inlet (see § 4). This small discrepancy should not take away from the trends observed: that the value of
 $U_{max}/U_{b}$
increase with flow depth before plateauing and then decreases again after the appearance of the ‘velocity dip’. In figure 9(b) we show the location of the maximum streamwise velocity in terms of distance from the free surface. We note that for flow depths
$U_{max}/U_{b}$
increase with flow depth before plateauing and then decreases again after the appearance of the ‘velocity dip’. In figure 9(b) we show the location of the maximum streamwise velocity in terms of distance from the free surface. We note that for flow depths
 $d/D\lesssim 85\,\%$
the distance of the maximum velocity to the free surface has taken on a small finite value (they should be zero) and this is due to the difference between our measurement of flow depth and how close the S-PIV can resolve velocities near the free surface. Overall, our measurements are in excellent agreement with the prediction of Fullard & Wake (Reference Fullard and Wake2015) who report that the velocity dip only appears in laminar partially filled pipes for flow depths
$d/D\lesssim 85\,\%$
the distance of the maximum velocity to the free surface has taken on a small finite value (they should be zero) and this is due to the difference between our measurement of flow depth and how close the S-PIV can resolve velocities near the free surface. Overall, our measurements are in excellent agreement with the prediction of Fullard & Wake (Reference Fullard and Wake2015) who report that the velocity dip only appears in laminar partially filled pipes for flow depths
 $d/D>86\,\%$
.
$d/D>86\,\%$
.
In figure 10 we plot the measured velocity profiles rescaled using
 $U_{max}$
together with velocity profiles calculated from the theoretical solution reported in Guo & Meroney (Reference Guo and Meroney2013) for each corresponding flow depth tested. The black symbols are the experimental data and the solid black lines are the theoretical distributions. We have very good agreement between experiments and theory, with the majority of each measured profile within
$U_{max}$
together with velocity profiles calculated from the theoretical solution reported in Guo & Meroney (Reference Guo and Meroney2013) for each corresponding flow depth tested. The black symbols are the experimental data and the solid black lines are the theoretical distributions. We have very good agreement between experiments and theory, with the majority of each measured profile within
 ${\approx}\pm 3\,\%$
of the theoretical profile (i.e. within
${\approx}\pm 3\,\%$
of the theoretical profile (i.e. within
 $5\,\%$
of
$5\,\%$
of
 $U_{max}$
); where the largest discrepancies between experiments and theory are near the wall where it is well known that uncertainties in PIV measurement techniques will necessarily increase due to the inhomogeneous displacement of paired particle images in the presence of the mean velocity gradient (Raffel et al.
Reference Raffel, Willert, Wereley and Kompenhans2007). At a flow depth of
$U_{max}$
); where the largest discrepancies between experiments and theory are near the wall where it is well known that uncertainties in PIV measurement techniques will necessarily increase due to the inhomogeneous displacement of paired particle images in the presence of the mean velocity gradient (Raffel et al.
Reference Raffel, Willert, Wereley and Kompenhans2007). At a flow depth of
 $d/D=95\,\%$
(figure 10
k) the largest discrepancy between the measured and theoretical profiles is near the free surface which can be accounted for by the influence of surface tension. For this case (where free surface width
$d/D=95\,\%$
(figure 10
k) the largest discrepancy between the measured and theoretical profiles is near the free surface which can be accounted for by the influence of surface tension. For this case (where free surface width
 $B$
approaches zero), the Weber number estimated using
$B$
approaches zero), the Weber number estimated using
 $We=\unicode[STIX]{x1D70C}U_{b}^{2}B/\unicode[STIX]{x1D70E}$
(where
$We=\unicode[STIX]{x1D70C}U_{b}^{2}B/\unicode[STIX]{x1D70E}$
(where
 $\unicode[STIX]{x1D70E}$
is surface tension) was less than unity suggesting that surface tension is important.
$\unicode[STIX]{x1D70E}$
is surface tension) was less than unity suggesting that surface tension is important.
Streamwise mean velocity profiles at pipe vertical bisector
 $U/U_{max}$
.
$U/U_{max}$
.
Contours of
 $U/U_{max}=[0:0.1:1]$
. Filled contours: experimental data and solid blue lines: theoretical distributions. (a)
$U/U_{max}=[0:0.1:1]$
. Filled contours: experimental data and solid blue lines: theoretical distributions. (a)
 $d/D=24\,\%$
 $(Re_{H}=426)$
; (b)
$(Re_{H}=426)$
; (b)
 $d/D=33\,\%$
 $(Re_{H}=438)$
; (c)
$(Re_{H}=438)$
; (c)
 $d/D=40\,\%$
 $(Re_{H}=471)$
; (d)
$(Re_{H}=471)$
; (d)
 $d/D=46\,\%$
 $(Re_{H}=464)$
; (e)
$(Re_{H}=464)$
; (e)
 $d/D=50\,\%$
 $(Re_{H}=446)$
; (f)
$(Re_{H}=446)$
; (f)
 $d/D=60\,\%$
 $(Re_{H}=409)$
; (h)
$(Re_{H}=409)$
; (h)
 $d/D=70\,\%$
 $(Re_{H}=371)$
; (i)
$(Re_{H}=371)$
; (i)
 $d/D=80\,\%$
 $(Re_{H}=332)$
; (j)
$(Re_{H}=332)$
; (j)
 $d/D=85\,\%$
 $(Re_{H}=422)$
; (k)
$(Re_{H}=422)$
; (k)
 $d/D=90\,\%$
 $(Re_{H}=383)$
(l)
$(Re_{H}=383)$
(l)
 $d/D=95\,\%$
 $(Re_{H}=232)$
and
$(Re_{H}=232)$
and
 $d/D=100\,\%$
 $(Re_{H}=575)$
.
$(Re_{H}=575)$
.

If we now show the profiles in figure 10 all together as in figure 11 a peculiar trend emerges. The profiles tend to collapse onto a single curve for
 $z/D_{H}<0.2$
then the data branch off and follow two distinct curves for
$z/D_{H}<0.2$
then the data branch off and follow two distinct curves for
 $0.2\lesssim z/D_{H}\lesssim 0.5$
. The lower of these two branches contains the data for all flow depths up to
$0.2\lesssim z/D_{H}\lesssim 0.5$
. The lower of these two branches contains the data for all flow depths up to
 $d/D=50\,\%$
in addition to
$d/D=50\,\%$
in addition to
 $d/D=95\,\%$
and the upper branch contains all data
$d/D=95\,\%$
and the upper branch contains all data
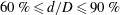 $60\,\%\leqslant d/D\leqslant 90\,\%$
. To make sense of this behaviour, it is perhaps best to consider the whole velocity distribution for each flow depth which we plot as contours in figure 12. Here, the filled contours are the experimental data and the solid blue line contours are the theoretical distributions (with symmetry along the vertical bisector, we plot only half of the theoretical distributions to improve visibility). The full laminar pipe flow velocity distribution has been included for comparison. It can be seen in figure 12 that we have very good-to-excellent agreement between the measured and theoretical distributions for all flow depths tested. We can see that for all flow depths prior to the appearance of the ‘velocity dip’ the maximum streamwise velocity appears at the free surface along the vertical bisector. For flow depths up to half-full, the contour lines resemble concentric circles that terminate at the free surface, and thus the effect of the free surface is minimal. When the flow depth is
$60\,\%\leqslant d/D\leqslant 90\,\%$
. To make sense of this behaviour, it is perhaps best to consider the whole velocity distribution for each flow depth which we plot as contours in figure 12. Here, the filled contours are the experimental data and the solid blue line contours are the theoretical distributions (with symmetry along the vertical bisector, we plot only half of the theoretical distributions to improve visibility). The full laminar pipe flow velocity distribution has been included for comparison. It can be seen in figure 12 that we have very good-to-excellent agreement between the measured and theoretical distributions for all flow depths tested. We can see that for all flow depths prior to the appearance of the ‘velocity dip’ the maximum streamwise velocity appears at the free surface along the vertical bisector. For flow depths up to half-full, the contour lines resemble concentric circles that terminate at the free surface, and thus the effect of the free surface is minimal. When the flow depth is
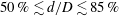 $50\,\%\lesssim d/D\lesssim 85\,\%$
the maximum streamwise velocity still appears at the free surface and thus we see that the contour lines no longer assume the shape of concentric circles. As such, when scaled with
$50\,\%\lesssim d/D\lesssim 85\,\%$
the maximum streamwise velocity still appears at the free surface and thus we see that the contour lines no longer assume the shape of concentric circles. As such, when scaled with
 $U_{max}$
and
$U_{max}$
and
 $D_{H}$
the mean velocity gradient along the vertical bisector must be steeper in order for the maximum velocity to appear at the free surface, hence the upper branch in figure 11. When we approach full pipe flow, the velocity dip appears and the maximum velocity moves away from the free surface hence dropping the velocity profile for
$D_{H}$
the mean velocity gradient along the vertical bisector must be steeper in order for the maximum velocity to appear at the free surface, hence the upper branch in figure 11. When we approach full pipe flow, the velocity dip appears and the maximum velocity moves away from the free surface hence dropping the velocity profile for
 $d/D=95\,\%$
back onto the lower branch in figure 11. Interestingly, the full laminar pipe flow velocity profile lies between the two ‘branches’. Our measured velocity distributions compare very favourably with the theoretical solution of Guo & Meroney (Reference Guo and Meroney2013) and largely confirm their conclusion that the free surface correction term has only a small effect when the pipe is less than half-full and that the velocity dip phenomenon is only seen when the pipe is running very full for laminar flow due to the absence of secondary currents.
$d/D=95\,\%$
back onto the lower branch in figure 11. Interestingly, the full laminar pipe flow velocity profile lies between the two ‘branches’. Our measured velocity distributions compare very favourably with the theoretical solution of Guo & Meroney (Reference Guo and Meroney2013) and largely confirm their conclusion that the free surface correction term has only a small effect when the pipe is less than half-full and that the velocity dip phenomenon is only seen when the pipe is running very full for laminar flow due to the absence of secondary currents.
(a–c) Mean velocity profiles taken along pipe vertical bisector
 $(y/R=0)$
for flow depths
$(y/R=0)$
for flow depths
 $d/D=44\,\%$
,
$d/D=44\,\%$
,
 $62\,\%$
and
$62\,\%$
and
 $80\,\%$
. Black circles are for current study:
$80\,\%$
. Black circles are for current study:
 $Re_{H}\approx 30\,000$
. Grey squares are data published in Yoon et al. (Reference Yoon, Sung and Lee2012) for flow depths
$Re_{H}\approx 30\,000$
. Grey squares are data published in Yoon et al. (Reference Yoon, Sung and Lee2012) for flow depths
 $d/D=40\,\%$
,
$d/D=40\,\%$
,
 $60\,\%$
and
$60\,\%$
and
 $80\,\%$
at
$80\,\%$
at
 $Re_{H}=9766$
,
$Re_{H}=9766$
,
 $16\,088$
and
$16\,088$
and
 $18\,974$
, respectively.
$18\,974$
, respectively.
7 Turbulent flow
7.1 Mean velocity field
We demonstrated in § 6 that for a laminar partially filled pipe flow the ‘velocity dip’ phenomenon only appears for flow depths
 $d/D\gtrsim 85\,\%$
. Our experimental data agree well with the theoretical solutions of Guo & Meroney (Reference Guo and Meroney2013) and Fullard & Wake (Reference Fullard and Wake2015) and serve as validation of our experimental set-up and measurement technique. In this section we will present the measured velocity distribution for turbulent partially filled pipe flow for flow depths between
$d/D\gtrsim 85\,\%$
. Our experimental data agree well with the theoretical solutions of Guo & Meroney (Reference Guo and Meroney2013) and Fullard & Wake (Reference Fullard and Wake2015) and serve as validation of our experimental set-up and measurement technique. In this section we will present the measured velocity distribution for turbulent partially filled pipe flow for flow depths between
 $44\,\%\leqslant d/D\leqslant 80\,\%$
at a nominally constant Reynolds number of
$44\,\%\leqslant d/D\leqslant 80\,\%$
at a nominally constant Reynolds number of
 $Re_{H}\approx 30\,000$
. Figure 13 compares our measured streamwise velocity profiles along the pipe vertical bisector with those published in Yoon et al. (Reference Yoon, Sung and Lee2012) where black circles are data from the current study and blue squares are those data from Yoon et al. (Reference Yoon, Sung and Lee2012). There is some discrepancy between our data and the Yoon et al. (Reference Yoon, Sung and Lee2012) data for
$Re_{H}\approx 30\,000$
. Figure 13 compares our measured streamwise velocity profiles along the pipe vertical bisector with those published in Yoon et al. (Reference Yoon, Sung and Lee2012) where black circles are data from the current study and blue squares are those data from Yoon et al. (Reference Yoon, Sung and Lee2012). There is some discrepancy between our data and the Yoon et al. (Reference Yoon, Sung and Lee2012) data for
 $d/D\approx 40\,\%$
(figure 13
a) but this is likely due to their significantly lower Reynolds number (
$d/D\approx 40\,\%$
(figure 13
a) but this is likely due to their significantly lower Reynolds number (
 $Re_{H}=9766$
versus
$Re_{H}=9766$
versus
 $Re_{H}\approx 30\,000$
in current work) which they claim puts their flow into the transitional regime. For flow depths
$Re_{H}\approx 30\,000$
in current work) which they claim puts their flow into the transitional regime. For flow depths
 $d/D\approx 60\,\%$
(figure 13
b) and
$d/D\approx 60\,\%$
(figure 13
b) and
 $d/D\approx 80\,\%$
(figure 13
c) we have better agreement (both data sets are measured in fully turbulent flow) and clearly the maximum streamwise velocity appears below the free surface for these cases. Furthermore, our data acquired in the VLSPF facility reveal that the mean streamwise velocity gradient approaches zero near the free surface as expected.
$d/D\approx 80\,\%$
(figure 13
c) we have better agreement (both data sets are measured in fully turbulent flow) and clearly the maximum streamwise velocity appears below the free surface for these cases. Furthermore, our data acquired in the VLSPF facility reveal that the mean streamwise velocity gradient approaches zero near the free surface as expected.
(a–c) Mean streamwise velocity along vertical bisector scaled with maximum streamwise velocity
 $U_{max}$
and (a) flow depth
$U_{max}$
and (a) flow depth
 $d$
; (b) pipe diameter
$d$
; (b) pipe diameter
 $D$
and (c) hydraulic diameter
$D$
and (c) hydraulic diameter
 $D_{H}$
, respectively. (d–f) Mean streamwise velocity along vertical bisector scaled with bulk velocity
$D_{H}$
, respectively. (d–f) Mean streamwise velocity along vertical bisector scaled with bulk velocity
 $U_{b}$
and (d) flow depth
$U_{b}$
and (d) flow depth
 $d$
; (e) pipe diameter
$d$
; (e) pipe diameter
 $D$
and (f) hydraulic diameter
$D$
and (f) hydraulic diameter
 $D_{H}$
, respectively. (○):
$D_{H}$
, respectively. (○):
 $d/D=44\,\%$
; (▫):
$d/D=44\,\%$
; (▫):
 $d/D=52\,\%$
; (♢):
$d/D=52\,\%$
; (♢):
 $d/D=62\,\%$
; (▵):
$d/D=62\,\%$
; (▵):
 $d/D=70\,\%$
; (▿):
$d/D=70\,\%$
; (▿):
 $d=80\,\%$
and (
$d=80\,\%$
and (
 $\star$
):
$\star$
):
 $d/D=100\,\%$
. Grey scale shading increases with increasing flow depth.
$d/D=100\,\%$
. Grey scale shading increases with increasing flow depth.
The mean streamwise velocity profiles measured at the pipe vertical bisector in this current work are shown together in figure 14. These data are presented using both
 $U_{max}$
and
$U_{max}$
and
 $U_{b}$
as the velocity scale and the flow depth
$U_{b}$
as the velocity scale and the flow depth
 $d$
, pipe diameter
$d$
, pipe diameter
 $D$
and hydraulic diameter
$D$
and hydraulic diameter
 $D_{H}$
are used as length scales. The full pipe flow velocity profile (taken from data acquired in the VLSPF facility by Dennis & Sogaro Reference Dennis and Sogaro2014) is included for comparison. Regardless of the scaling employed, three things are immediately clear from figure 14.
$D_{H}$
are used as length scales. The full pipe flow velocity profile (taken from data acquired in the VLSPF facility by Dennis & Sogaro Reference Dennis and Sogaro2014) is included for comparison. Regardless of the scaling employed, three things are immediately clear from figure 14.
(i) For all partially filled pipe runs
 $(44\,\%\leqslant d/D\leqslant 80\,\%)$
, we observe the so-called ‘velocity dip’ phenomenon where the location of the maximum streamwise velocity occurs below the free surface. This is in contrast to the laminar flow results presented in § 6 where a velocity dip only occurs for
$d/D>85\,\%$
in agreement with theoretical prediction.
$(44\,\%\leqslant d/D\leqslant 80\,\%)$
, we observe the so-called ‘velocity dip’ phenomenon where the location of the maximum streamwise velocity occurs below the free surface. This is in contrast to the laminar flow results presented in § 6 where a velocity dip only occurs for
$d/D>85\,\%$
in agreement with theoretical prediction.(ii) The streamwise velocity becomes almost invariant with wall distance when nearing the free surface (best viewed when scaled with flow depth
$d$
in figure 14
a,d) implying that there is zero mean shear and that the air/fluid interface in our pipe working section represents a ‘true’ stress free surface.(iii) Unsurprisingly neither of the six available scaling permutations can collapse the data over the whole profile, indicating some kind of mixed scaling.


We see in figure 14(a) that the partially filled pipe flow data collapse with the full pipe profile and that the location of
 $U_{max}$
is at half the flow depth
$U_{max}$
is at half the flow depth
 $(z/d\approx 0.5)$
for runs where
$(z/d\approx 0.5)$
for runs where
 $d/D\geqslant 50\,\%$
, whereas when the pipe is less than half-full, the maximum streamwise velocity is closer to the free surface. This observation is reinforced in figure 14(b) where the location of
$d/D\geqslant 50\,\%$
, whereas when the pipe is less than half-full, the maximum streamwise velocity is closer to the free surface. This observation is reinforced in figure 14(b) where the location of
 $U_{max}$
increases monotonically with flow depth towards
$U_{max}$
increases monotonically with flow depth towards
 $z/D=0.5$
for the full pipe flow when the velocity profile is scaled with pipe diameter
$z/D=0.5$
for the full pipe flow when the velocity profile is scaled with pipe diameter
 $D$
. In figure 14(c), the length scale is the hydraulic diameter, which is harder to interpret because it is non-monotonic with flow depth, (see inset in figure 6
a), but appears to be the most appropriate length scale for the partially filled pipe flow. From figure 14(d) we can see that the proportion of the velocity profile that is above the mean velocity i.e.
$D$
. In figure 14(c), the length scale is the hydraulic diameter, which is harder to interpret because it is non-monotonic with flow depth, (see inset in figure 6
a), but appears to be the most appropriate length scale for the partially filled pipe flow. From figure 14(d) we can see that the proportion of the velocity profile that is above the mean velocity i.e.
 $U/U_{b}>1$
increases with flow depth, but remains constant with regard to pipe diameter
$U/U_{b}>1$
increases with flow depth, but remains constant with regard to pipe diameter
 $D$
(figure 14
e); and in this figure the effect of the free surface becomes clear; near the no-slip wall, in what would be considered the ‘inner region’ of the full pipe flow
$D$
(figure 14
e); and in this figure the effect of the free surface becomes clear; near the no-slip wall, in what would be considered the ‘inner region’ of the full pipe flow
 $(z/D\lesssim 0.2)$
, the symmetry plane of partially filled pipe (vertical bisector) behaves in a very similar manner to that of axisymmetric pipe flow. As the free surface is approached, the mean velocity profiles for the partially filled pipe flow is distorted and ‘peels off’ the full pipe flow profile with this peel-off delayed with greater flow depth. Figure 14(f) displays the velocity profiles scaled with
$(z/D\lesssim 0.2)$
, the symmetry plane of partially filled pipe (vertical bisector) behaves in a very similar manner to that of axisymmetric pipe flow. As the free surface is approached, the mean velocity profiles for the partially filled pipe flow is distorted and ‘peels off’ the full pipe flow profile with this peel-off delayed with greater flow depth. Figure 14(f) displays the velocity profiles scaled with
 $U_{b}$
and
$U_{b}$
and
 $D_{H}$
. With no appreciable trends, it would appear that this choice of scaling variables is the least appropriate of our permutations.
$D_{H}$
. With no appreciable trends, it would appear that this choice of scaling variables is the least appropriate of our permutations.
Contours of time-averaged streamwise velocity normalised with bulk velocity
 $U/U_{b}$
for flow depths: (a)
$U/U_{b}$
for flow depths: (a)
 $d/D=44\,\%$
; (b)
$d/D=44\,\%$
; (b)
 $d/D=52\,\%$
; (c)
$d/D=52\,\%$
; (c)
 $d/D=62\,\%$
; (d)
$d/D=62\,\%$
; (d)
 $d/D=70\,\%$
and (e)
$d/D=70\,\%$
and (e)
 $dc=80\,\%$
at
$dc=80\,\%$
at
 $Re_{H}\approx 30\,000$
. The time-averaged in-plane motion is superimposed. (f) (○) maximum magnitude of in-plane motion,
$Re_{H}\approx 30\,000$
. The time-averaged in-plane motion is superimposed. (f) (○) maximum magnitude of in-plane motion,
 $V_{S,max}$
, and (▫) the total non-dimensional mean axial vorticity,
$V_{S,max}$
, and (▫) the total non-dimensional mean axial vorticity,
 $|\overline{\unicode[STIX]{x1D6FA}_{x}}|\times D/U_{b}$
, as a function of flow depth
$|\overline{\unicode[STIX]{x1D6FA}_{x}}|\times D/U_{b}$
, as a function of flow depth
 $d/D$
and aspect ratio
$d/D$
and aspect ratio
 $B/d$
.
$B/d$
.

The distortion of the mean streamwise velocity distribution is, of course, not confined only to the vertical bisector. Figure 15 shows filled contours of the time-averaged streamwise velocity, along with the corresponding in-plane velocity vectors. We have exploited the symmetry of the flow about the vertical bisector to improve the statistics. These plots clearly show the ‘velocity dip’ phenomenon where the maximum streamwise velocity occurs below the free surface even when the flow depth is
 $d/D<50\,\%$
. None of the velocity contours for
$d/D<50\,\%$
. None of the velocity contours for
 $U/U_{b}>1$
resemble concentric circles, a result of breaking azimuthal symmetry due the presence of the free surface and an indication of the three-dimensional nature of the flow. A mean secondary flow is observed near the free surface with each of the counter-rotating rolls filling the half-width of the pipe. Due to the absence of streamline curvature (as we have a straight pipe run) the secondary flow observed here is driven by turbulence anisotropy and spatial gradients of the Reynolds shear stresses (the latter of which is not present in axisymmetric full pipe flow). These secondary flows are often referred to as Prandtl’s secondary flow of the second kind (Prandtl Reference Prandtl1952). While secondary flows have been inferred from the distortion of the mean streamwise velocity distribution (i.e. ‘velocity dip’ phenomenon) in partially filled pipes (Knight & Sterling Reference Knight and Sterling2000; Yoon et al.
Reference Yoon, Sung and Lee2012), direct measurements are uncommon. Only Clark & Kehler (Reference Clark and Kehler2011) report experimentally measured secondary flows (using ADV), although that study was conducted in a corrugated metal culvert and flow depths did not exceed
$U/U_{b}>1$
resemble concentric circles, a result of breaking azimuthal symmetry due the presence of the free surface and an indication of the three-dimensional nature of the flow. A mean secondary flow is observed near the free surface with each of the counter-rotating rolls filling the half-width of the pipe. Due to the absence of streamline curvature (as we have a straight pipe run) the secondary flow observed here is driven by turbulence anisotropy and spatial gradients of the Reynolds shear stresses (the latter of which is not present in axisymmetric full pipe flow). These secondary flows are often referred to as Prandtl’s secondary flow of the second kind (Prandtl Reference Prandtl1952). While secondary flows have been inferred from the distortion of the mean streamwise velocity distribution (i.e. ‘velocity dip’ phenomenon) in partially filled pipes (Knight & Sterling Reference Knight and Sterling2000; Yoon et al.
Reference Yoon, Sung and Lee2012), direct measurements are uncommon. Only Clark & Kehler (Reference Clark and Kehler2011) report experimentally measured secondary flows (using ADV), although that study was conducted in a corrugated metal culvert and flow depths did not exceed
 $d/D=52\,\%$
. Here we observe the presence of large-scale counter-rotating rolls near the free surface region up to flow depths of
$d/D=52\,\%$
. Here we observe the presence of large-scale counter-rotating rolls near the free surface region up to flow depths of
 $d/D=80\,\%$
. Unlike fully turbulent flow in straight pressurized ducts of non-circular cross-section where the measured secondary flow cells appear in pairs about corner bisectors (see for example: Gessner & Jones Reference Gessner and Jones1965; Perkins Reference Perkins1970; Demuren & Rodi Reference Demuren and Rodi1984; Khalifa & Trupp Reference Khalifa and Trupp1988), or in rectangular and compound open channels where multiple pairs of secondary flow cells are set-up depending on the particular geometry and/or aspect ratio (see for example: Tominaga et al.
Reference Tominaga, Nezu, Ezaki and Nakagawa1989; Nezu & Nakayama Reference Nezu and Nakayama1997; Tamburrino & Gulliver Reference Tamburrino and Gulliver1999; Nezu Reference Nezu2005) the mean secondary motion observed here manifests only as a single pair of vortices mirrored about the pipe vertical bisector (insofar is what our S-PIV measurements can resolve), a result consistent with the study of Clark & Kehler (Reference Clark and Kehler2011) in circular corrugated culverts.
$d/D=80\,\%$
. Unlike fully turbulent flow in straight pressurized ducts of non-circular cross-section where the measured secondary flow cells appear in pairs about corner bisectors (see for example: Gessner & Jones Reference Gessner and Jones1965; Perkins Reference Perkins1970; Demuren & Rodi Reference Demuren and Rodi1984; Khalifa & Trupp Reference Khalifa and Trupp1988), or in rectangular and compound open channels where multiple pairs of secondary flow cells are set-up depending on the particular geometry and/or aspect ratio (see for example: Tominaga et al.
Reference Tominaga, Nezu, Ezaki and Nakagawa1989; Nezu & Nakayama Reference Nezu and Nakayama1997; Tamburrino & Gulliver Reference Tamburrino and Gulliver1999; Nezu Reference Nezu2005) the mean secondary motion observed here manifests only as a single pair of vortices mirrored about the pipe vertical bisector (insofar is what our S-PIV measurements can resolve), a result consistent with the study of Clark & Kehler (Reference Clark and Kehler2011) in circular corrugated culverts.
To characterise the strength of the mean secondary flow we calculate the maximum in-plane velocity which, following Johnston (Reference Johnston1978), is defined as:
 $V_{S,max}=|\sqrt{V^{2}+W^{2}}|_{max}$
. We also characterise the secondary flow strength using an integral measure which we have chosen as the magnitude of the mean axial vorticity,
$V_{S,max}=|\sqrt{V^{2}+W^{2}}|_{max}$
. We also characterise the secondary flow strength using an integral measure which we have chosen as the magnitude of the mean axial vorticity,
 $|\overline{\unicode[STIX]{x1D6FA}_{x}}|$
(the total mean axial vorticity will be zero as the secondary flow cells have opposing sense of rotation, so we sum the magnitude of the mean vorticity calculated for half of the pipe on either side of the vertical bisector). Each of these quantities are plotted in the bottom right corner of figure 15 against both flow depth
$|\overline{\unicode[STIX]{x1D6FA}_{x}}|$
(the total mean axial vorticity will be zero as the secondary flow cells have opposing sense of rotation, so we sum the magnitude of the mean vorticity calculated for half of the pipe on either side of the vertical bisector). Each of these quantities are plotted in the bottom right corner of figure 15 against both flow depth
 $d/D$
and flow aspect ratio
$d/D$
and flow aspect ratio
 $B/d$
, where circles represent
$B/d$
, where circles represent
 $V_{S,max}$
, and squares represent
$V_{S,max}$
, and squares represent
 $|\overline{\unicode[STIX]{x1D6FA}_{x}}|$
, respectively. Here we see that
$|\overline{\unicode[STIX]{x1D6FA}_{x}}|$
, respectively. Here we see that
 $0.03\lesssim V_{S,max}/U_{b}\lesssim 0.04$
(equivalent to
$0.03\lesssim V_{S,max}/U_{b}\lesssim 0.04$
(equivalent to
 $0.02\lesssim V_{S,max}/U_{max}\lesssim 0.03$
) which lies within the range of values reported in the literature, for example, Nezu (Reference Nezu2005) reports
$0.02\lesssim V_{S,max}/U_{max}\lesssim 0.03$
) which lies within the range of values reported in the literature, for example, Nezu (Reference Nezu2005) reports
 $V_{S,max}\approx 0.02U_{max}$
for laser Doppler anemometer (LDA) measurements in a rectangular open channel, Owolabi, Poole & Dennis (Reference Owolabi, Poole and Dennis2016) report
$V_{S,max}\approx 0.02U_{max}$
for laser Doppler anemometer (LDA) measurements in a rectangular open channel, Owolabi, Poole & Dennis (Reference Owolabi, Poole and Dennis2016) report
 $V_{S,max}\approx 0.03U_{b}$
for LDA measurements in a marginally turbulent square duct and Clark & Kehler (Reference Clark and Kehler2011) reports values of up to
$V_{S,max}\approx 0.03U_{b}$
for LDA measurements in a marginally turbulent square duct and Clark & Kehler (Reference Clark and Kehler2011) reports values of up to
 $V_{S,max}\approx 0.05U_{max}$
for their ADV measurements in a circular corrugated culvert. In the current study,
$V_{S,max}\approx 0.05U_{max}$
for their ADV measurements in a circular corrugated culvert. In the current study,
 $V_{S,max}$
appears to increase weakly from
$V_{S,max}$
appears to increase weakly from
 $d/D=44\,\%$
to
$d/D=44\,\%$
to
 $60\,\%$
before plateauing, however, the total increase is small
$60\,\%$
before plateauing, however, the total increase is small
 $({\approx}1\,\%U_{b})$
. When considering the mean axial vorticity
$({\approx}1\,\%U_{b})$
. When considering the mean axial vorticity
 $|\overline{\unicode[STIX]{x1D6FA}_{x}}|$
we see a clear monotonic decrease with flow depth. Since
$|\overline{\unicode[STIX]{x1D6FA}_{x}}|$
we see a clear monotonic decrease with flow depth. Since
 $|\overline{\unicode[STIX]{x1D6FA}_{x}}|=|\unicode[STIX]{x1D6E4}|/A$
, where
$|\overline{\unicode[STIX]{x1D6FA}_{x}}|=|\unicode[STIX]{x1D6E4}|/A$
, where
 $\unicode[STIX]{x1D6E4}$
is circulation and
$\unicode[STIX]{x1D6E4}$
is circulation and
 $A$
the flow cross-sectional area, we can surmise that the average mean secondary flow strength is approximately constant (which we have confirmed from calculating
$A$
the flow cross-sectional area, we can surmise that the average mean secondary flow strength is approximately constant (which we have confirmed from calculating
 $\unicode[STIX]{x1D6E4}$
) and that the mean axial vorticity decreases with increasing flow depth due to the attendant increase in flow cross-sectional area. Interestingly, the centres of secondary flow cells appear to remain at a constant distance from the free surface.
$\unicode[STIX]{x1D6E4}$
) and that the mean axial vorticity decreases with increasing flow depth due to the attendant increase in flow cross-sectional area. Interestingly, the centres of secondary flow cells appear to remain at a constant distance from the free surface.
Figure 16(a) plots the distance from the free surface of the secondary flow cell centres (circles), as well as the distance from free surface of the maximum streamwise velocity (squares). While the secondary flow cells remain near the free surface
 $\unicode[STIX]{x0394}Z\approx 0.1D$
, the distance from the free surface of the position of the maximum streamwise velocity increases linearly with flow depth. In figure 16(b) we plot the distance from the vertical bisector of the secondary flow cell centres (circles) and the location of the maximum streamwise velocity (squares). We see that the secondary flow cell centres move slightly apart with increasing depth for the range of depths tested
$\unicode[STIX]{x0394}Z\approx 0.1D$
, the distance from the free surface of the position of the maximum streamwise velocity increases linearly with flow depth. In figure 16(b) we plot the distance from the vertical bisector of the secondary flow cell centres (circles) and the location of the maximum streamwise velocity (squares). We see that the secondary flow cell centres move slightly apart with increasing depth for the range of depths tested
 $44\,\%\leqslant d/D\leqslant 80\,\%$
and in showing that the location of the maximum streamwise velocity lies on the vertical bisector we simply confirm that that is the symmetry plane for this flow.
$44\,\%\leqslant d/D\leqslant 80\,\%$
and in showing that the location of the maximum streamwise velocity lies on the vertical bisector we simply confirm that that is the symmetry plane for this flow.
(a) Distance to free surface and (b) distance to vertical bisector of the secondary flow cell centres (○) and location of maximum streamwise velocity (▫). All normalised by pipe diameter
 $D$
.
$D$
.
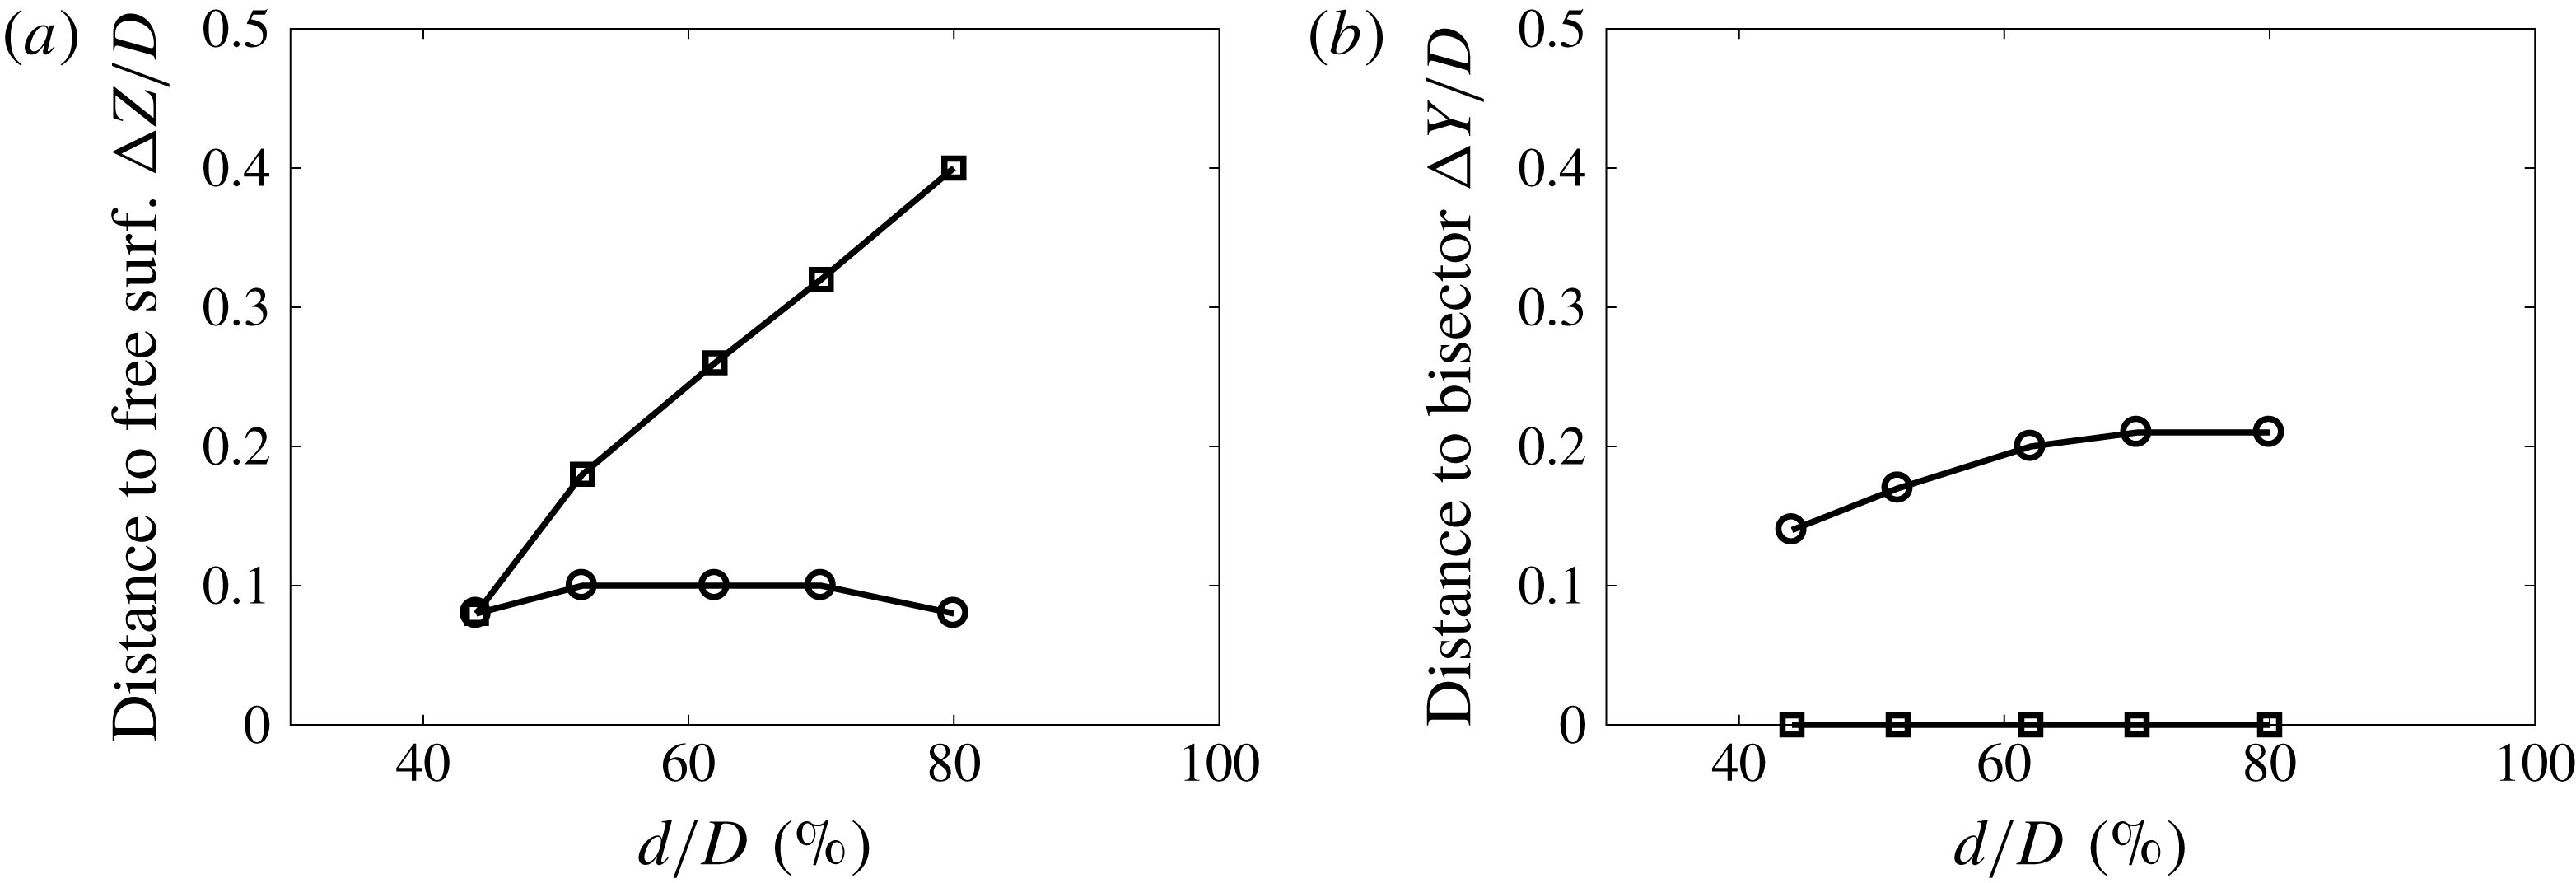
Contours of time-averaged streamwise Reynolds normal stress normalised with bulk velocity
 $\overline{u^{2}}/U_{b}^{2}$
for flow depths: (a)
$\overline{u^{2}}/U_{b}^{2}$
for flow depths: (a)
 $d/D=44\,\%$
; (b)
$d/D=44\,\%$
; (b)
 $d/D=52\,\%$
; (c)
$d/D=52\,\%$
; (c)
 $d/D=62\,\%$
; (d)
$d/D=62\,\%$
; (d)
 $d/D=70\,\%$
and (e)
$d/D=70\,\%$
and (e)
 $d/D=80\,\%$
at
$d/D=80\,\%$
at
 $Re_{H}\approx 30\,000$
.
$Re_{H}\approx 30\,000$
.
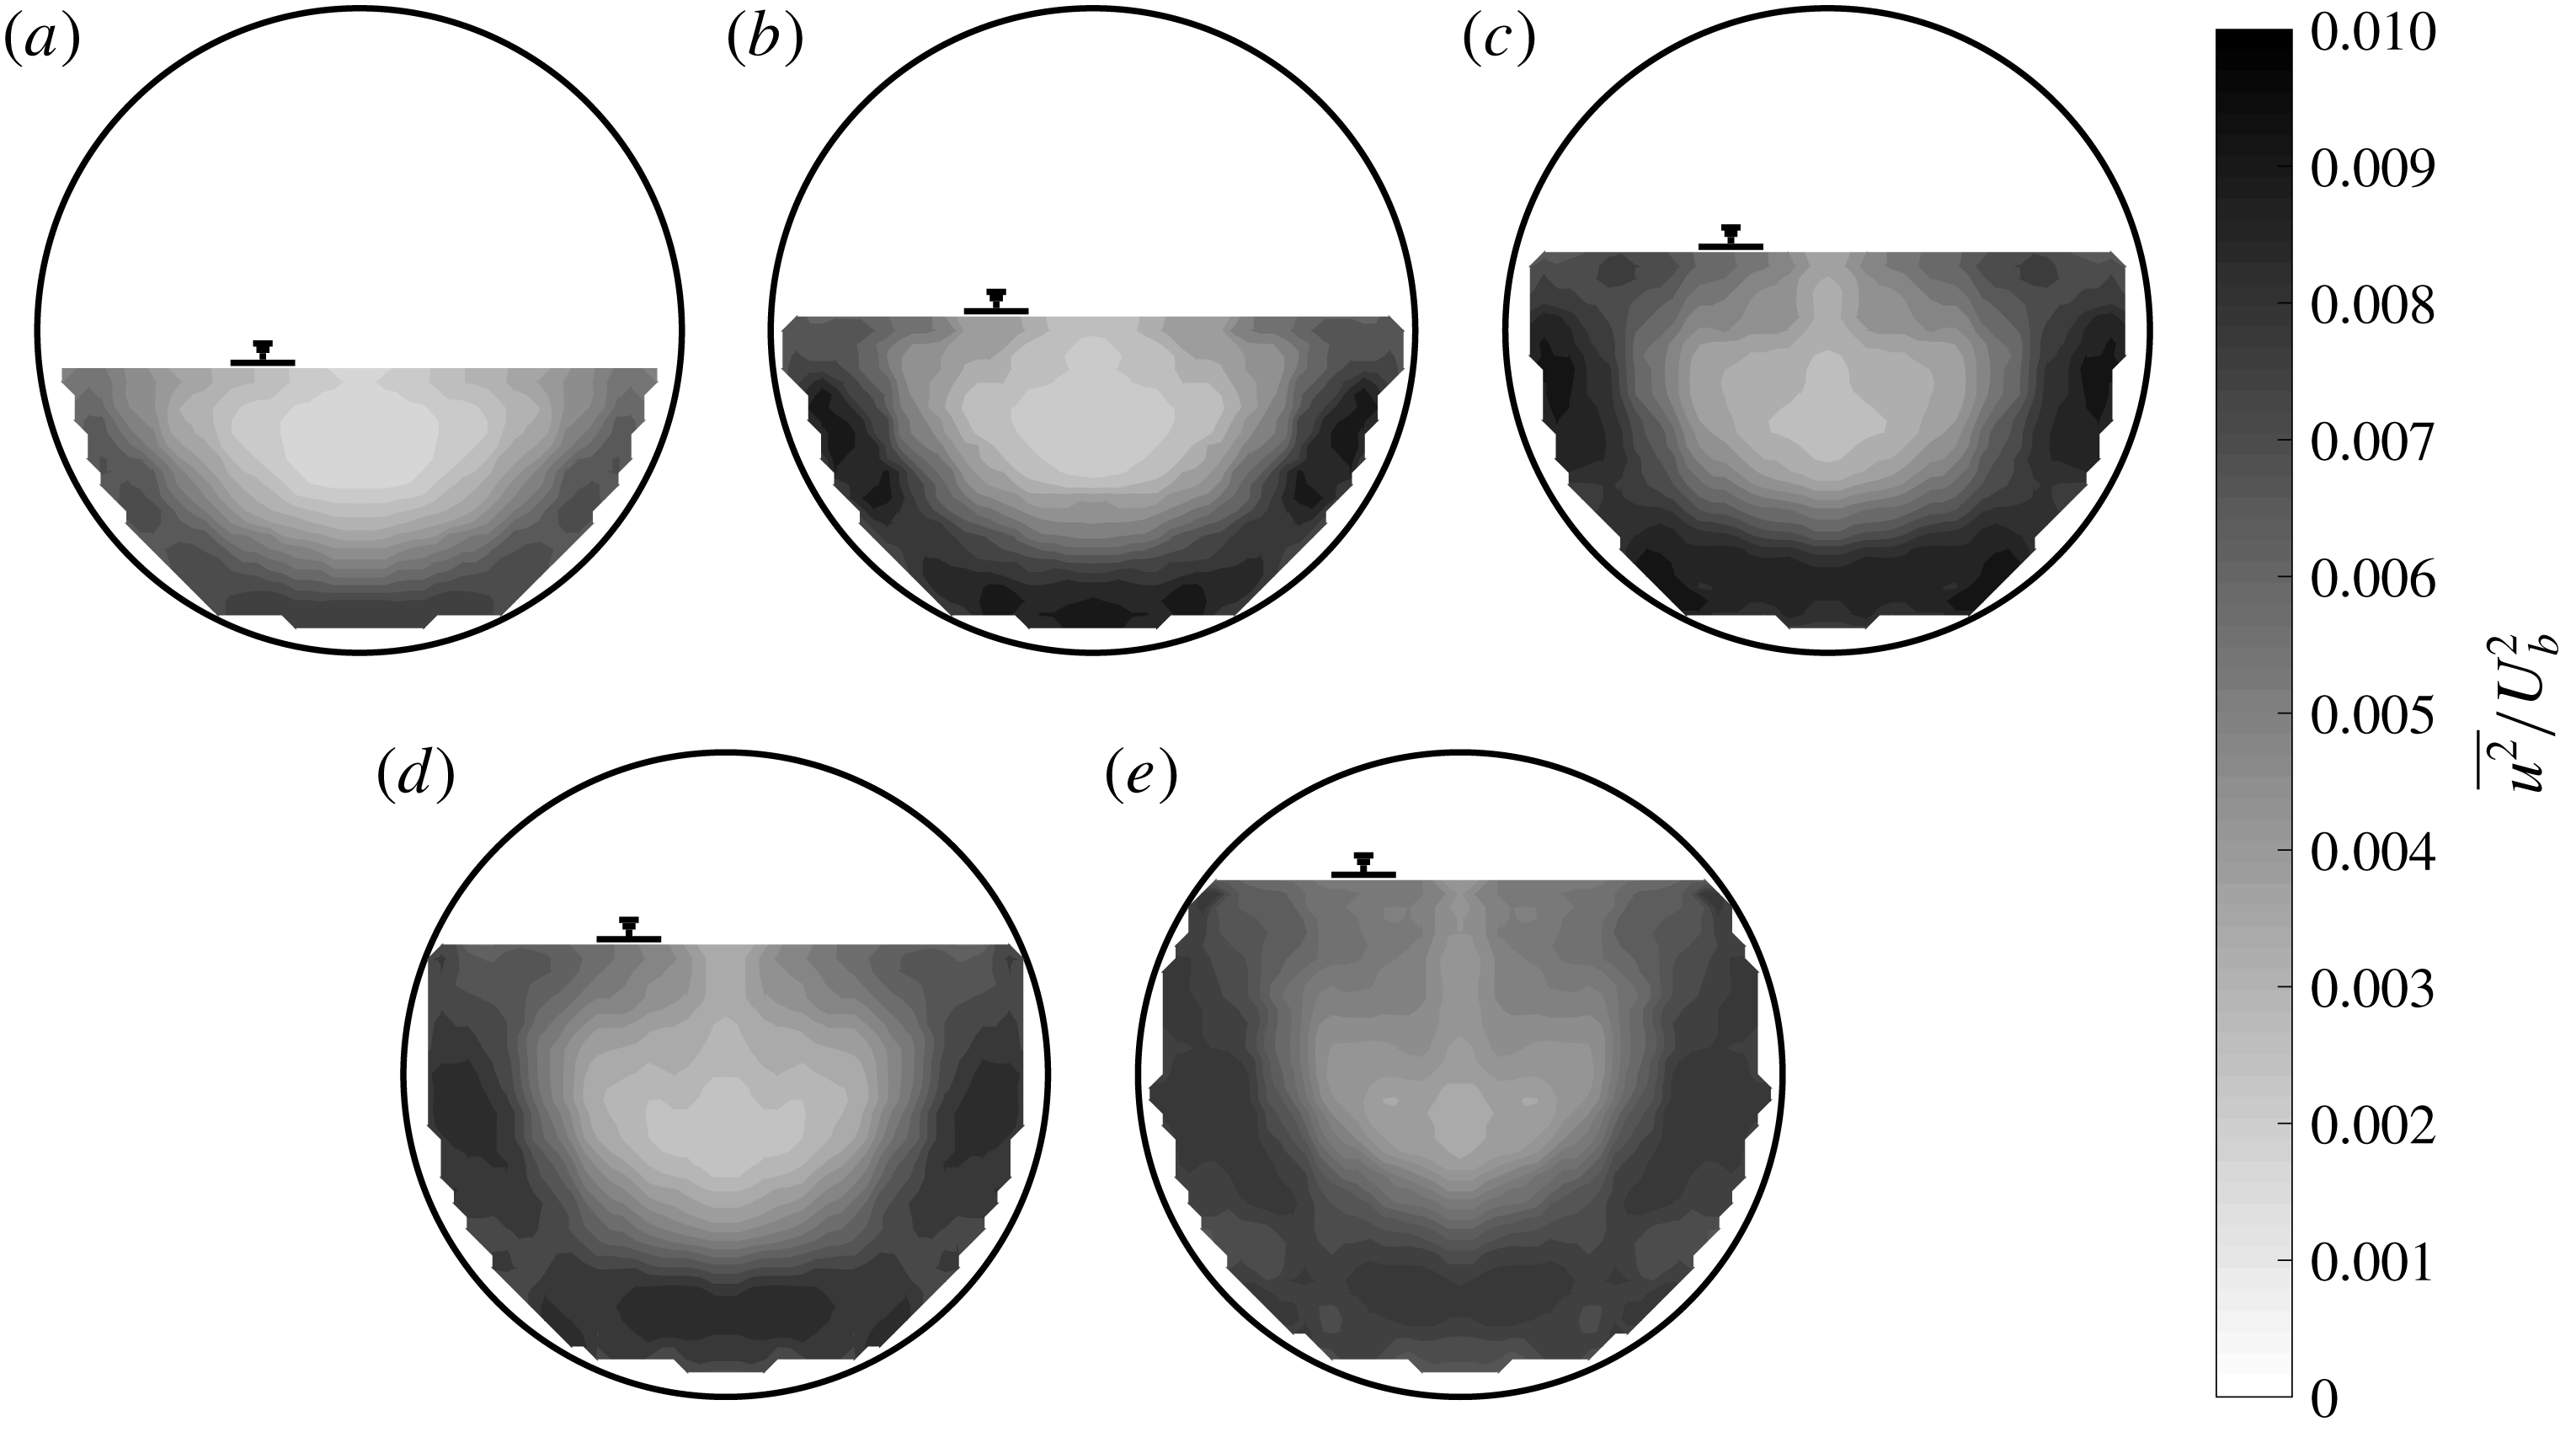
7.2 Streamwise Reynolds normal stress and turbulent kinetic energy
In this section we examine the spatial distribution of the streamwise Reynolds normal stress
 $\overline{u^{2}}$
and the turbulent kinetic energy
$\overline{u^{2}}$
and the turbulent kinetic energy
 $TKE=0.5(\overline{u^{2}}+\overline{v^{2}}+\overline{w^{2}})$
. We have again exploited symmetry about the vertical bisector, and furthermore, as our primary interest is in the large scales, a median filter with a kernel size of
$TKE=0.5(\overline{u^{2}}+\overline{v^{2}}+\overline{w^{2}})$
. We have again exploited symmetry about the vertical bisector, and furthermore, as our primary interest is in the large scales, a median filter with a kernel size of
 $0.06\times 0.06D$
was employed to smooth the distributions for presentation. The spatially filtered streamwise Reynolds normal stress normalised with bulk velocity
$0.06\times 0.06D$
was employed to smooth the distributions for presentation. The spatially filtered streamwise Reynolds normal stress normalised with bulk velocity
 $\overline{u^{2}}/U_{b}^{2}$
is shown as filled contours in figure 17. The filtering will attenuate the small scales and hence the magnitude of the measured Reynolds normal stress (and TKE), however, since our Reynolds number is constant, the effect of spatial filtering is constant for each of the flow depths and we focus only on the spatial distribution of the stresses relative to a full pipe flow. In a full pipe flow (at comparable Reynolds numbers
$\overline{u^{2}}/U_{b}^{2}$
is shown as filled contours in figure 17. The filtering will attenuate the small scales and hence the magnitude of the measured Reynolds normal stress (and TKE), however, since our Reynolds number is constant, the effect of spatial filtering is constant for each of the flow depths and we focus only on the spatial distribution of the stresses relative to a full pipe flow. In a full pipe flow (at comparable Reynolds numbers
 $Re_{\unicode[STIX]{x1D70F}}=RU_{\unicode[STIX]{x1D70F}}/\unicode[STIX]{x1D708}\approx O(10^{2}{-}10^{3})$
where
$Re_{\unicode[STIX]{x1D70F}}=RU_{\unicode[STIX]{x1D70F}}/\unicode[STIX]{x1D708}\approx O(10^{2}{-}10^{3})$
where
 $U_{\unicode[STIX]{x1D70F}}$
is the friction velocity), it is known that the streamwise normal stress peaks at a inner-scaled wall distance of
$U_{\unicode[STIX]{x1D70F}}$
is the friction velocity), it is known that the streamwise normal stress peaks at a inner-scaled wall distance of
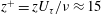 $z^{+}=zU_{\unicode[STIX]{x1D70F}}/\unicode[STIX]{x1D708}\approx 15$
(where
$z^{+}=zU_{\unicode[STIX]{x1D70F}}/\unicode[STIX]{x1D708}\approx 15$
(where
 $z=R-r$
), before decreasing with wall distance until plateauing within the logarithmic region and then monotonically decreasing to a minimum at the pipe centreline. Although the measured magnitude of the near wall peak in streamwise Reynolds normal stress varies in the literature (see, for example: Hultmark, Bailey & Smits Reference Hultmark, Bailey and Smits2010; Ng et al.
Reference Ng, Monty, Hutchins, Chong and Marusic2011; Örlü & Alfredsson Reference Örlü and Alfredsson2013), the general shape of the distribution as described is confirmed from many experimental (for example: Lawn Reference Lawn1971; Perry & Abell Reference Perry and Abell1975; Durst, Jovanovic & Sender Reference Durst, Jovanovic and Sender1995; den Toonder & Nieuwstadt Reference den Toonder and Nieuwstadt1997; Monty et al.
Reference Monty, Hutchins, Ng, Marusic and Chong2009) and DNS databases (e.g.: Sillero, Jimenez & Moser Reference Sillero, Jimenez and Moser2013; Chin et al.
Reference Chin, Ng, Blackburn, Monty and Ooi2015). As a full pipe flow is, of course, axisymmetric, the spatial distribution of any turbulence statistic can only depend on the wall distance. In a partially filled pipe, we break azimuthal symmetry and our only symmetry plane is the vertical bisector. The effect of broken symmetry on the streamwise Reynolds normal stress is immediately clear in figure 17 where there is now a pronounced azimuthal variation. By referring back to the streamwise velocity distributions in figure 15 we can see that the streamwise Reynolds normal stress is minimum where streamwise velocity is maximum. The regions of maximum streamwise Reynolds normal stress appear around the periphery of the pipe as expected and not near the free surface which will have much less mean shear than near the no-slip boundary. Interestingly, the regions of high stress (dark shaded regions) do not form a continuous band around the azimuth of the pipe near the wall even when far away from the free surface. For flow depths
$z=R-r$
), before decreasing with wall distance until plateauing within the logarithmic region and then monotonically decreasing to a minimum at the pipe centreline. Although the measured magnitude of the near wall peak in streamwise Reynolds normal stress varies in the literature (see, for example: Hultmark, Bailey & Smits Reference Hultmark, Bailey and Smits2010; Ng et al.
Reference Ng, Monty, Hutchins, Chong and Marusic2011; Örlü & Alfredsson Reference Örlü and Alfredsson2013), the general shape of the distribution as described is confirmed from many experimental (for example: Lawn Reference Lawn1971; Perry & Abell Reference Perry and Abell1975; Durst, Jovanovic & Sender Reference Durst, Jovanovic and Sender1995; den Toonder & Nieuwstadt Reference den Toonder and Nieuwstadt1997; Monty et al.
Reference Monty, Hutchins, Ng, Marusic and Chong2009) and DNS databases (e.g.: Sillero, Jimenez & Moser Reference Sillero, Jimenez and Moser2013; Chin et al.
Reference Chin, Ng, Blackburn, Monty and Ooi2015). As a full pipe flow is, of course, axisymmetric, the spatial distribution of any turbulence statistic can only depend on the wall distance. In a partially filled pipe, we break azimuthal symmetry and our only symmetry plane is the vertical bisector. The effect of broken symmetry on the streamwise Reynolds normal stress is immediately clear in figure 17 where there is now a pronounced azimuthal variation. By referring back to the streamwise velocity distributions in figure 15 we can see that the streamwise Reynolds normal stress is minimum where streamwise velocity is maximum. The regions of maximum streamwise Reynolds normal stress appear around the periphery of the pipe as expected and not near the free surface which will have much less mean shear than near the no-slip boundary. Interestingly, the regions of high stress (dark shaded regions) do not form a continuous band around the azimuth of the pipe near the wall even when far away from the free surface. For flow depths
 $d/D\geqslant 50\,\%$
, the regions of maximum stress are at the bottom of the pipe
$d/D\geqslant 50\,\%$
, the regions of maximum stress are at the bottom of the pipe
 $\unicode[STIX]{x1D703}=0^{\circ }$
and also off to either side
$\unicode[STIX]{x1D703}=0^{\circ }$
and also off to either side
 $\unicode[STIX]{x1D703}\pm 90^{\circ }$
. In a region close to the
$\unicode[STIX]{x1D703}\pm 90^{\circ }$
. In a region close to the
 $\unicode[STIX]{x1D703}\pm 45^{\circ }$
bisectors, the stress is lower. Figure 18 shows contours of the filtered turbulent kinetic energy normalised with bulk velocity,
$\unicode[STIX]{x1D703}\pm 45^{\circ }$
bisectors, the stress is lower. Figure 18 shows contours of the filtered turbulent kinetic energy normalised with bulk velocity,
 $TKE/U_{b}^{2}$
. The distribution of TKE is qualitatively very similar to the distribution of the streamwise Reynolds normal stress indicating that streamwise normal stress remains the dominant component even with a mean secondary flow present. In the TKE distributions, the most energetic locations are found near the pipe bottom
$TKE/U_{b}^{2}$
. The distribution of TKE is qualitatively very similar to the distribution of the streamwise Reynolds normal stress indicating that streamwise normal stress remains the dominant component even with a mean secondary flow present. In the TKE distributions, the most energetic locations are found near the pipe bottom
 $\unicode[STIX]{x1D703}=0^{\circ }$
and towards the sides
$\unicode[STIX]{x1D703}=0^{\circ }$
and towards the sides
 $\unicode[STIX]{x1D703}\pm 90^{\circ }$
with low energy near the free surface and near the
$\unicode[STIX]{x1D703}\pm 90^{\circ }$
with low energy near the free surface and near the
 $\unicode[STIX]{x1D703}\pm 45^{\circ }$
bisectors. This is the same pattern as for the streamwise Reynolds normal stress distributions and indicative of a preferential arrangement of the turbulent motions in the presence of the mean secondary flow.
$\unicode[STIX]{x1D703}\pm 45^{\circ }$
bisectors. This is the same pattern as for the streamwise Reynolds normal stress distributions and indicative of a preferential arrangement of the turbulent motions in the presence of the mean secondary flow.
Contours of time-averaged turbulent kinetic energy (TKE) normalised with bulk velocity
 $\overline{TKE}/U_{b}^{2}$
for flow depths: (a)
$\overline{TKE}/U_{b}^{2}$
for flow depths: (a)
 $d/D=44\,\%$
; (b)
$d/D=44\,\%$
; (b)
 $d/D=52\,\%$
; (c)
$d/D=52\,\%$
; (c)
 $d/D=62\,\%$
; (d)
$d/D=62\,\%$
; (d)
 $d/D=70\,\%$
and (e)
$d/D=70\,\%$
and (e)
 $d/D=80\,\%$
at
$d/D=80\,\%$
at
 $Re_{H}\approx 30\,000$
.
$Re_{H}\approx 30\,000$
.
Figure 19 shows profiles of turbulence statistics (normalised with bulk velocity) taken along the pipe vertical bisector scaled with the flow depth
 $d$
. We can see that each of the Reynolds normal stresses,
$d$
. We can see that each of the Reynolds normal stresses,
 $\overline{u^{2}}$
;
$\overline{u^{2}}$
;
 $\overline{v^{2}}$
and
$\overline{v^{2}}$
and
 $\overline{w^{2}}$
, as well as the Reynolds shear stress
$\overline{w^{2}}$
, as well as the Reynolds shear stress
 $-\overline{uw}$
and TKE all peak at approximately
$-\overline{uw}$
and TKE all peak at approximately
 $z/d=0.2$
. This in itself is interesting because if we treat flow depth
$z/d=0.2$
. This in itself is interesting because if we treat flow depth
 $d$
as the outer length scale, then
$d$
as the outer length scale, then
 $z/d=0.2$
would be notionally equivalent to
$z/d=0.2$
would be notionally equivalent to
 $z/\unicode[STIX]{x1D6FF}=0.2$
, typically considered the edge of the outer region in canonical wall-bounded flows (where
$z/\unicode[STIX]{x1D6FF}=0.2$
, typically considered the edge of the outer region in canonical wall-bounded flows (where
 $\unicode[STIX]{x1D6FF}$
would represent the boundary layer thickness for a two-dimensional boundary layer, equivalent to
$\unicode[STIX]{x1D6FF}$
would represent the boundary layer thickness for a two-dimensional boundary layer, equivalent to
 $R$
and
$R$
and
 $h$
, the pipe radius or channel half-height, in fully developed internal flows). After peaking at
$h$
, the pipe radius or channel half-height, in fully developed internal flows). After peaking at
 $z/d\approx 0.2$
, the streamwise Reynolds normal stress,
$z/d\approx 0.2$
, the streamwise Reynolds normal stress,
 $\overline{u^{2}}$
, then decreases linearly with depth between
$\overline{u^{2}}$
, then decreases linearly with depth between
 $0.2<z/d<0.5$
.
$0.2<z/d<0.5$
.
 $\overline{v^{2}}$
also appears to follow a near-linear decrease between
$\overline{v^{2}}$
also appears to follow a near-linear decrease between
 $0.2<z/d<0.5$
. From figure 14(a) we can see that
$0.2<z/d<0.5$
. From figure 14(a) we can see that
 $z/d\approx 0.5$
coincides with the location of maximum streamwise velocity. Interestingly, however, both
$z/d\approx 0.5$
coincides with the location of maximum streamwise velocity. Interestingly, however, both
 $\overline{u^{2}}$
and
$\overline{u^{2}}$
and
 $\overline{v^{2}}$
increase again slightly between
$\overline{v^{2}}$
increase again slightly between
 $z/d\gtrsim 0.5$
and the free surface suggesting turbulence production due to the mean secondary motion. When we consider TKE plotted in figure 19(d), this production becomes more apparent; the TKE profile peaks at approximately
$z/d\gtrsim 0.5$
and the free surface suggesting turbulence production due to the mean secondary motion. When we consider TKE plotted in figure 19(d), this production becomes more apparent; the TKE profile peaks at approximately
 $z/d=0.2$
and then decreases linearly with increasing
$z/d=0.2$
and then decreases linearly with increasing
 $z/d$
until reaching a minimum at around
$z/d$
until reaching a minimum at around
 $z/d=0.5$
. For
$z/d=0.5$
. For
 $z/d>0.5$
, a peculiar trend emerges; up to a flow depth of
$z/d>0.5$
, a peculiar trend emerges; up to a flow depth of
 $d/D=52\,\%$
, TKE remains constant from
$d/D=52\,\%$
, TKE remains constant from
 $z/d=0.5$
until the free surface. For flow depths greater than
$z/d=0.5$
until the free surface. For flow depths greater than
 $d/D=52\,\%$
, the TKE increases between
$d/D=52\,\%$
, the TKE increases between
 $z/d=0.5$
and the free surface, the magnitude of which is increasing with increasing flow depth. The Reynolds shear stress
$z/d=0.5$
and the free surface, the magnitude of which is increasing with increasing flow depth. The Reynolds shear stress
 $-\overline{uw}$
is plotted in figure 19(e). The profiles of
$-\overline{uw}$
is plotted in figure 19(e). The profiles of
 $-\overline{uw}$
all peak at approximately
$-\overline{uw}$
all peak at approximately
 $z/d=0.2$
and then begin to decrease with increasing
$z/d=0.2$
and then begin to decrease with increasing
 $z/d$
, and for all flow depths except
$z/d$
, and for all flow depths except
 $d/D=44\,\%$
the Reynolds shear stress changes sign between
$d/D=44\,\%$
the Reynolds shear stress changes sign between
 $0.4<z/d<0.6$
which is approximately where the gradient in the streamwise velocity profile becomes negative. From approximately,
$0.4<z/d<0.6$
which is approximately where the gradient in the streamwise velocity profile becomes negative. From approximately,
 $z/d=0.5$
to
$z/d=0.5$
to
 $z/d=0.75$
,
$z/d=0.75$
,
 $-\overline{uw}$
becomes increasingly negative and the strength of the Reynolds shear stress increases with increasing flow depth. This is not surprising as the mean streamwise velocity gradient also increases with increasing flow depth. At
$-\overline{uw}$
becomes increasingly negative and the strength of the Reynolds shear stress increases with increasing flow depth. This is not surprising as the mean streamwise velocity gradient also increases with increasing flow depth. At
 $z/d$
very close to unity, the Reynolds shear stress returns to zero as expected. These findings are completely consistent with the ADV measurements of Clark & Kehler (Reference Clark and Kehler2011) for a partially filled corrugated metal culvert and are markedly different to fully developed pipe flow and channel flow (see, for example: Pope Reference Pope2000, ch. 7). That the TKE and Reynolds normal and shear stress distributions are different to canonical pipe flow is not surprising. By reducing flow depth and introducing a free surface, the boundary condition for the upper part of the flow changes from no-slip wall to that of no mean shear. When
$z/d$
very close to unity, the Reynolds shear stress returns to zero as expected. These findings are completely consistent with the ADV measurements of Clark & Kehler (Reference Clark and Kehler2011) for a partially filled corrugated metal culvert and are markedly different to fully developed pipe flow and channel flow (see, for example: Pope Reference Pope2000, ch. 7). That the TKE and Reynolds normal and shear stress distributions are different to canonical pipe flow is not surprising. By reducing flow depth and introducing a free surface, the boundary condition for the upper part of the flow changes from no-slip wall to that of no mean shear. When
 $z/d$
approaches unity, turbulence production tends to zero (at least along the vertical bisector) leading to the reduction in the TKE, turbulence intensities and Reynolds shear stress in the upper part of the flow. The streamwise component of turbulence intensity is the strongest, followed by the spanwise and wall normal components. Unlike fully developed pipe or channel flow, the mean fluctuations do not take on the same value at the location of maximum streamwise velocity (i.e. centreline in a full pipe) indicating that even along the symmetry plane, flow in a partially filled pipe is highly anisotropic and also that there does not appear to be a quiescent core region that one finds in full pipe flow or channel flow.
$z/d$
approaches unity, turbulence production tends to zero (at least along the vertical bisector) leading to the reduction in the TKE, turbulence intensities and Reynolds shear stress in the upper part of the flow. The streamwise component of turbulence intensity is the strongest, followed by the spanwise and wall normal components. Unlike fully developed pipe or channel flow, the mean fluctuations do not take on the same value at the location of maximum streamwise velocity (i.e. centreline in a full pipe) indicating that even along the symmetry plane, flow in a partially filled pipe is highly anisotropic and also that there does not appear to be a quiescent core region that one finds in full pipe flow or channel flow.
Profiles of (a)
 $\overline{u^{2}}/U_{b}^{2}$
; (b)
$\overline{u^{2}}/U_{b}^{2}$
; (b)
 $\overline{v^{2}}/U_{b}^{2}$
; (c)
$\overline{v^{2}}/U_{b}^{2}$
; (c)
 $\overline{w^{2}}/U_{b}^{2}$
; (d) turbulent kinetic energy
$\overline{w^{2}}/U_{b}^{2}$
; (d) turbulent kinetic energy
 $\overline{TKE^{2}}/U_{b}^{2}$
and (e) Reynolds shear stress
$\overline{TKE^{2}}/U_{b}^{2}$
and (e) Reynolds shear stress
 $-\overline{uw}/U_{b}^{2}$
along vertical bisector plotted as a function of flow depth. (○):
$-\overline{uw}/U_{b}^{2}$
along vertical bisector plotted as a function of flow depth. (○):
 $d/D=44\,\%$
; (▫):
$d/D=44\,\%$
; (▫):
 $d/D=52\,\%$
; (♢):
$d/D=52\,\%$
; (♢):
 $d/D=62\,\%$
; (△):
$d/D=62\,\%$
; (△):
 $d/D=70\,\%$
and (▽):
$d/D=70\,\%$
and (▽):
 $d/D=80\,\%$
. Grayscale shading increases with increasing flow depth.
$d/D=80\,\%$
. Grayscale shading increases with increasing flow depth.
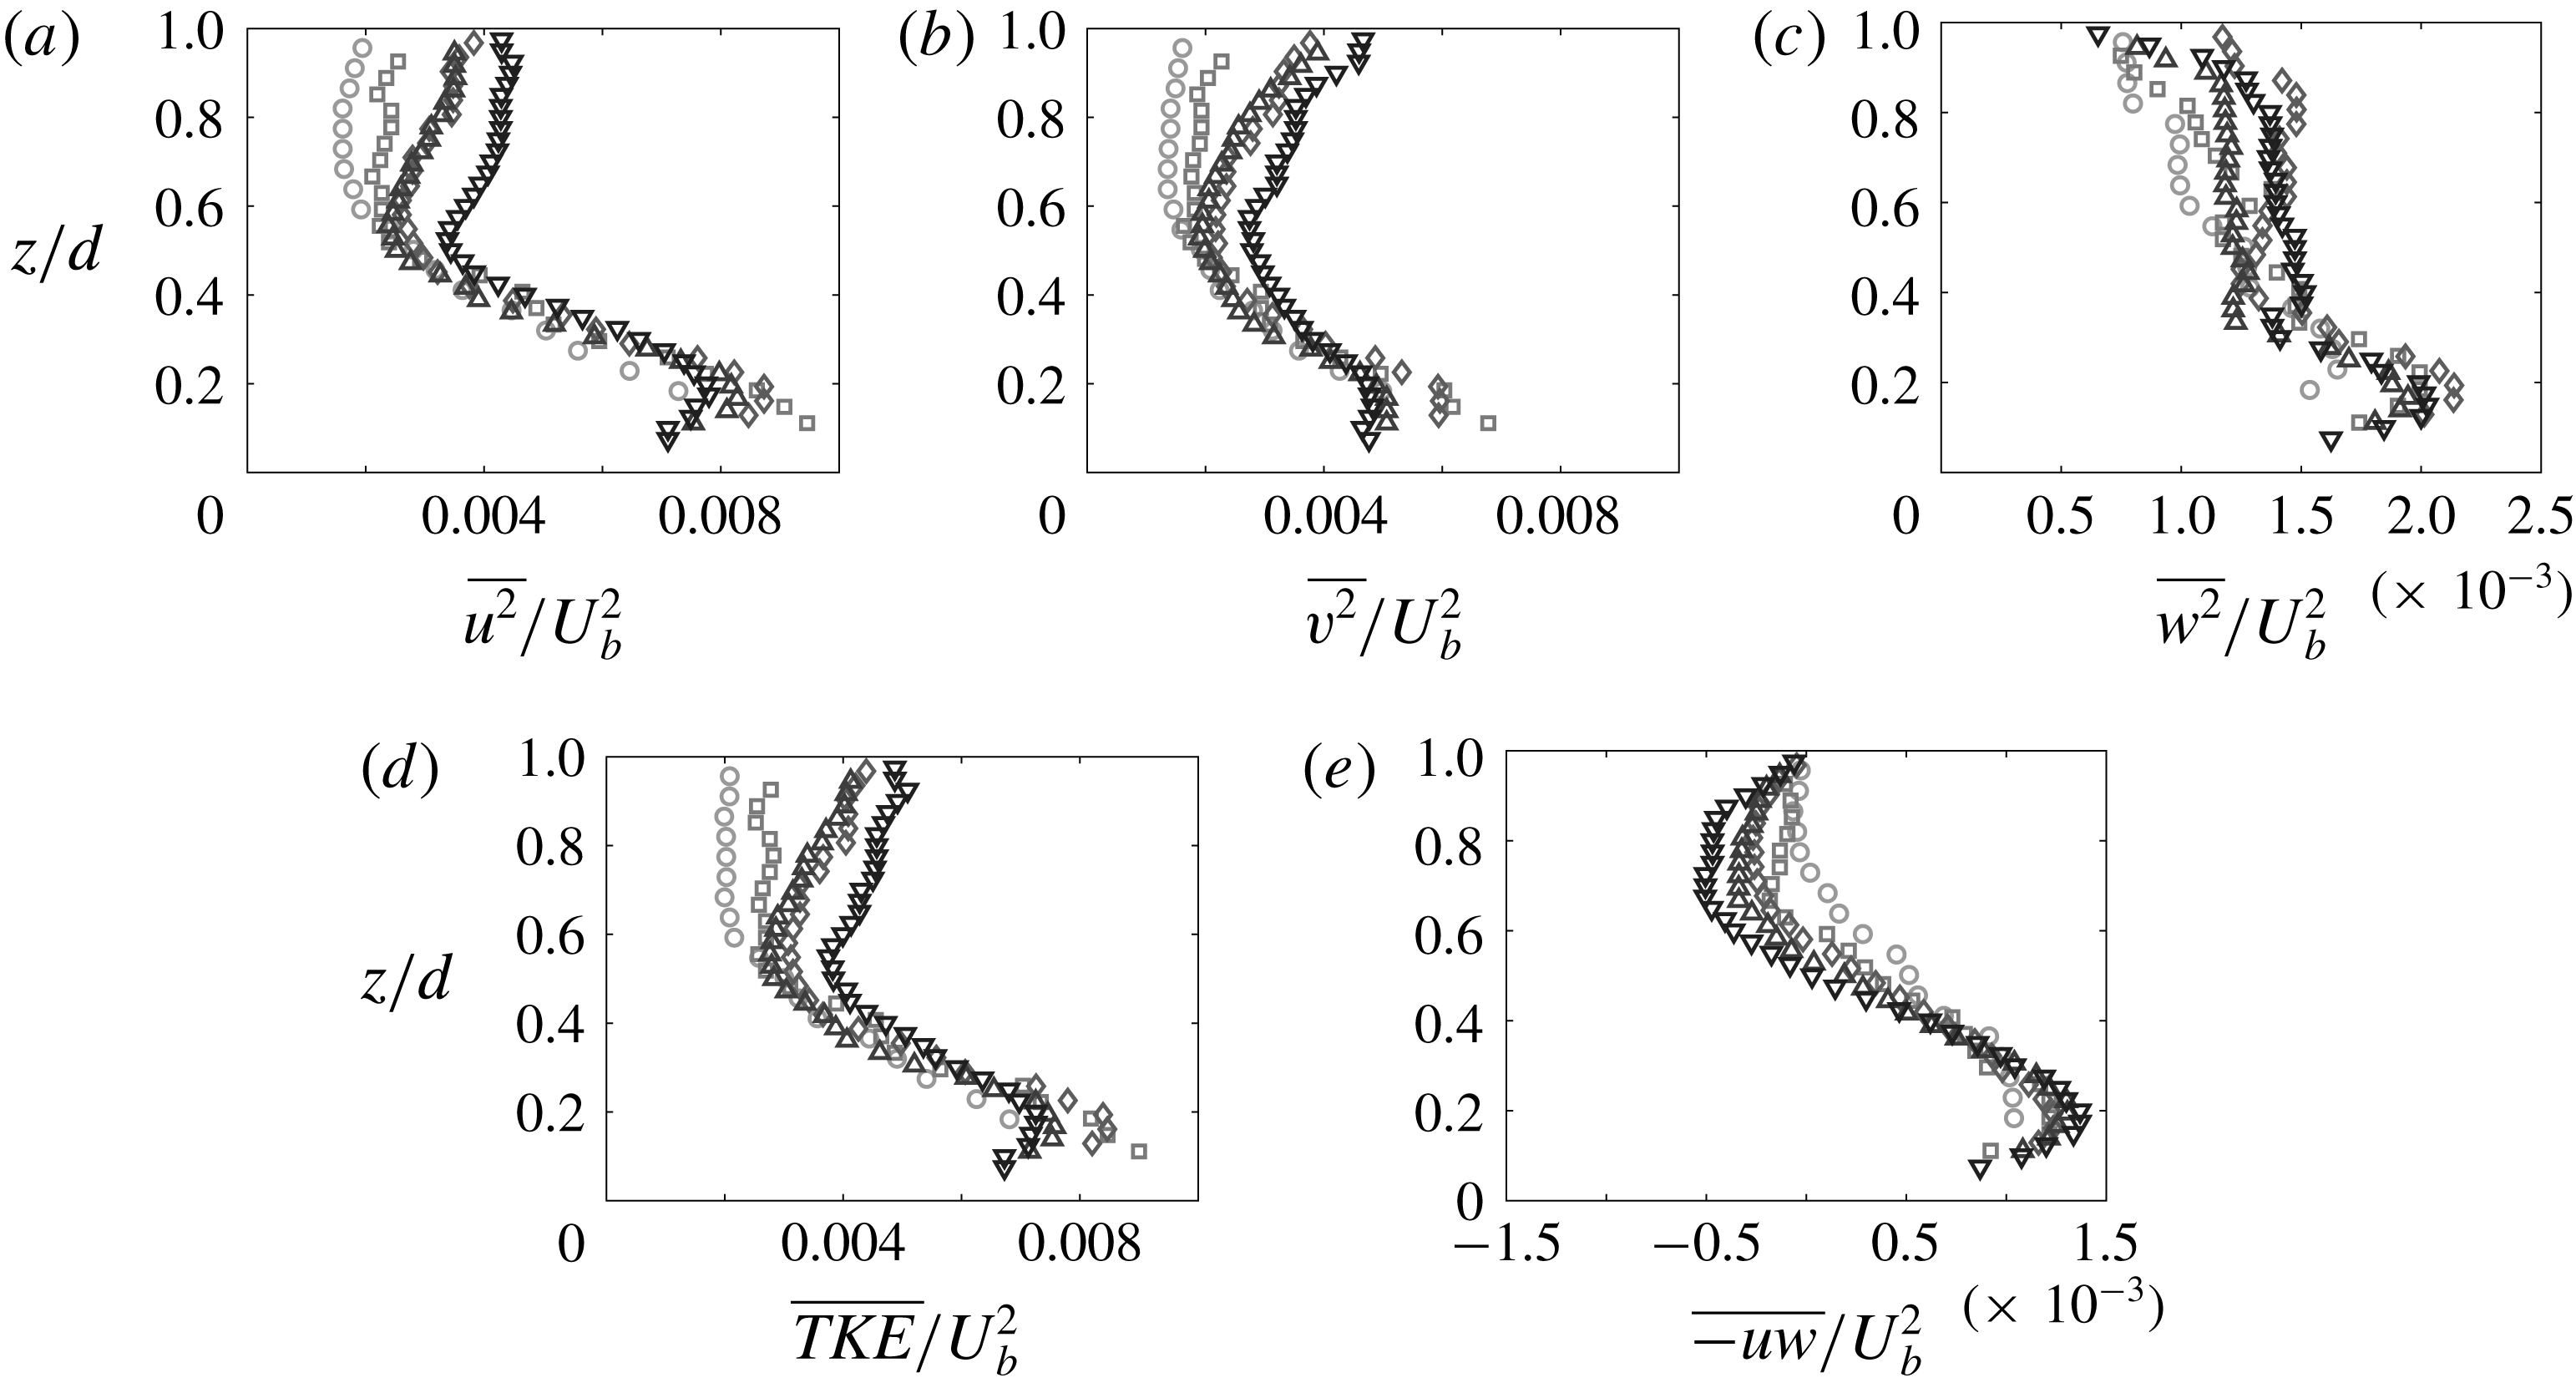
8 Instantaneous turbulent velocity fields
In this section we present example pseudo-instantaneous fields of streamwise velocity fluctuations reconstructed using Taylor’s frozen turbulence hypothesis (Taylor Reference Taylor1938). This method of obtaining spatial information from two-dimensional three-component (2D-3C) PIV measurements was discussed in detail in Dennis & Nickels (Reference Dennis and Nickels2008) and was shown to be valid for moderate projection distances. In all pseudo-instantaneous fields which rely on Taylor’s hypothesis flow will be from left-to-right with
 $\unicode[STIX]{x0394}TU_{b}/R$
increasing. Figure 20 shows azimuthal planes at a constant wall distance of
$\unicode[STIX]{x0394}TU_{b}/R$
increasing. Figure 20 shows azimuthal planes at a constant wall distance of
 $r/R=0.80$
, where
$r/R=0.80$
, where
 $r$
is radial distance from pipe centreline and
$r$
is radial distance from pipe centreline and
 $R$
is pipe radius. In figure 20(a), which is taken from the full pipe flow data set of Dennis & Sogaro (Reference Dennis and Sogaro2014), we note the presence of very long, streamwise-aligned streaky structure characterised by streamwise velocity fluctuations alternating from positive–negative–positive (or vice versa) and with lengths
$R$
is pipe radius. In figure 20(a), which is taken from the full pipe flow data set of Dennis & Sogaro (Reference Dennis and Sogaro2014), we note the presence of very long, streamwise-aligned streaky structure characterised by streamwise velocity fluctuations alternating from positive–negative–positive (or vice versa) and with lengths
 $O(10R)$
. As reported in that study, these features are the instantaneous signature of the large- and very-large-scale motions (LSM/VLSMs) in pipe flows first reported by Kim & Adrian (Reference Kim and Adrian1999) and subsequently in both pipes and channels, from experimental and numerical databases by Guala, Hommema & Adrian (Reference Guala, Hommema and Adrian2006), Balakumar & Adrian (Reference Balakumar and Adrian2007), Monty et al. (Reference Monty, Stewart, Williams and Chong2007), Wu et al. (Reference Wu, Baltzer and Adrian2012), Lee & Sung (Reference Lee and Sung2014) among others. Dennis (Reference Dennis2015) provides a recent review of coherent structures in wall turbulence and we know that the aforementioned LSM and VLSMs in pipes and channels are analogous to ‘superstructures’ that were reported in boundary layers by Hutchins & Marusic (Reference Hutchins and Marusic2007). The LSM/VLSMs and superstructures are known to exist up to the edge of the inner layer in a range of canonical wall-bounded turbulent flows. A recent numerical study by Lee, Ahn & Sung (Reference Lee, Ahn and Sung2015) revealed subtle, yet important, differences in the LSM and VLSM found in channels and pipes and that crucially, the spatial extents of the large-scale coherent motions and their contribution to turbulence statistics was dependent on wall geometry. When we reduce the flow depth we are effectively changing wall geometry and boundary conditions. Figures 20(b)–20(d) are the instantaneous fields at constant
$O(10R)$
. As reported in that study, these features are the instantaneous signature of the large- and very-large-scale motions (LSM/VLSMs) in pipe flows first reported by Kim & Adrian (Reference Kim and Adrian1999) and subsequently in both pipes and channels, from experimental and numerical databases by Guala, Hommema & Adrian (Reference Guala, Hommema and Adrian2006), Balakumar & Adrian (Reference Balakumar and Adrian2007), Monty et al. (Reference Monty, Stewart, Williams and Chong2007), Wu et al. (Reference Wu, Baltzer and Adrian2012), Lee & Sung (Reference Lee and Sung2014) among others. Dennis (Reference Dennis2015) provides a recent review of coherent structures in wall turbulence and we know that the aforementioned LSM and VLSMs in pipes and channels are analogous to ‘superstructures’ that were reported in boundary layers by Hutchins & Marusic (Reference Hutchins and Marusic2007). The LSM/VLSMs and superstructures are known to exist up to the edge of the inner layer in a range of canonical wall-bounded turbulent flows. A recent numerical study by Lee, Ahn & Sung (Reference Lee, Ahn and Sung2015) revealed subtle, yet important, differences in the LSM and VLSM found in channels and pipes and that crucially, the spatial extents of the large-scale coherent motions and their contribution to turbulence statistics was dependent on wall geometry. When we reduce the flow depth we are effectively changing wall geometry and boundary conditions. Figures 20(b)–20(d) are the instantaneous fields at constant
 $r/R=0.80$
for flow depths
$r/R=0.80$
for flow depths
 $d/D=80\,\%$
,
$d/D=80\,\%$
,
 $62\,\%$
and
$62\,\%$
and
 $44\,\%$
, respectively. For each of these flow depths, the instantaneous signature of the LSMs and VLSMs remain, although the velocity fluctuations appear marginally weaker.
$44\,\%$
, respectively. For each of these flow depths, the instantaneous signature of the LSMs and VLSMs remain, although the velocity fluctuations appear marginally weaker.
Slices of pseudo-instantaneous streamwise velocity fluctuation
 $u/U$
taken at constant radius
$u/U$
taken at constant radius
 $r/R=0.80$
for flow depths: (a)
$r/R=0.80$
for flow depths: (a)
 $d/D=100\,\%$
; (b)
$d/D=100\,\%$
; (b)
 $d/D=80\,\%$
; (c)
$d/D=80\,\%$
; (c)
 $d/D=62\,\%$
and (d)
$d/D=62\,\%$
and (d)
 $d/D=44\,\%$
.
$d/D=44\,\%$
.

Slices of pseudo-instantaneous streamwise velocity fluctuation
 $u/U$
taken along pipe vertical bisector for flow depths: (a)
$u/U$
taken along pipe vertical bisector for flow depths: (a)
 $d/D=100\,\%$
; (b)
$d/D=100\,\%$
; (b)
 $d/D=80\,\%$
; (c)
$d/D=80\,\%$
; (c)
 $d/D=62\,\%$
and (d)
$d/D=62\,\%$
and (d)
 $d/D=44\,\%$
.
$d/D=44\,\%$
.

Figure 21 shows the plane along the vertical bisector for the same data sets. In figure 21(a), where we plot the full pipe data, the top and bottom edge of this panel is a no-slip boundary (pipe wall). The predominant feature here is that the instantaneous flow structures are not wall parallel but appear to lift off the wall at an angle. This inclination angle was originally studied using two-point measurements of wall shear stress and streamwise velocity in boundary layer flow (Brown & Thomas Reference Brown and Thomas1977; Wark & Nagib Reference Wark and Nagib1991) along with flow visualisation studies (Bandyopadhyay Reference Bandyopadhyay1980). Later, the structure inclination angle in boundary layers was studied using PIV (by, for example: Adrian, Meinhart & Tomkins Reference Adrian, Meinhart and Tomkins2000b
; Ganapathisubramani, Longmire & Marusic Reference Ganapathisubramani, Longmire and Marusic2003; Hutchins, Hambleton & Marusic Reference Hutchins, Hambleton and Marusic2005, among others) and was later found to be common to boundary layers, pipes and channels (Christensen & Adrian Reference Christensen and Adrian2001; Baltzer, Adrian & Wu Reference Baltzer, Adrian and Wu2013). Typically, inclination angles are reported to be between
 $10$
to
$10$
to
 $15^{\circ }$
and it has been shown that the inclination angles are associated with the formation of hairpin packets (Zhou et al.
Reference Zhou, Adrian, Balachandar and Kendall1999; Adrian Reference Adrian2007). When the flow depth is reduced, (figure 21
b–d) the bottom edge is, of course, still a no-slip boundary, but the top edge is now a nominally shear free boundary (free-surface). At the bottom of the partially filled pipe where the flow is bounded by a no-slip wall, the instantaneous structures remain similar to a full pipe flow. For example; if we concentrate on a small region in figure 21(b) between
$15^{\circ }$
and it has been shown that the inclination angles are associated with the formation of hairpin packets (Zhou et al.
Reference Zhou, Adrian, Balachandar and Kendall1999; Adrian Reference Adrian2007). When the flow depth is reduced, (figure 21
b–d) the bottom edge is, of course, still a no-slip boundary, but the top edge is now a nominally shear free boundary (free-surface). At the bottom of the partially filled pipe where the flow is bounded by a no-slip wall, the instantaneous structures remain similar to a full pipe flow. For example; if we concentrate on a small region in figure 21(b) between
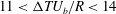 $11<\unicode[STIX]{x0394}TU_{b}/R<14$
, we can see a strong negative streamwise velocity fluctuation. This segment is shown in figure 22. Streamwise velocity fluctuations with in-plane velocities superimposed are plotted for a plane taken along the vertical bisector are shown in figure 22(a) and the corresponding free surface parallel plane taken at a
$11<\unicode[STIX]{x0394}TU_{b}/R<14$
, we can see a strong negative streamwise velocity fluctuation. This segment is shown in figure 22. Streamwise velocity fluctuations with in-plane velocities superimposed are plotted for a plane taken along the vertical bisector are shown in figure 22(a) and the corresponding free surface parallel plane taken at a
 $d/D=0.76$
(i.e. at a distance of
$d/D=0.76$
(i.e. at a distance of
 $\unicode[STIX]{x0394}Z/D=0.04$
from the free surface) is shown in figure 22(c). The corresponding in-plane signed swirling strength,
$\unicode[STIX]{x0394}Z/D=0.04$
from the free surface) is shown in figure 22(c). The corresponding in-plane signed swirling strength,
 $\unicode[STIX]{x1D706}_{S}=\unicode[STIX]{x1D706}_{ci}\times \unicode[STIX]{x1D6FA}/|\unicode[STIX]{x1D6FA}|$
, (coloured by the sign of vorticity) with in-plane velocities superimposed are plotted in figures 22(b) and 22(d), respectively. Following Adrian, Christensen & Liu (Reference Adrian, Christensen and Liu2000a
),
$\unicode[STIX]{x1D706}_{S}=\unicode[STIX]{x1D706}_{ci}\times \unicode[STIX]{x1D6FA}/|\unicode[STIX]{x1D6FA}|$
, (coloured by the sign of vorticity) with in-plane velocities superimposed are plotted in figures 22(b) and 22(d), respectively. Following Adrian, Christensen & Liu (Reference Adrian, Christensen and Liu2000a
),
 $\unicode[STIX]{x1D706}_{ci}$
is the imaginary part of the complex eigenvalue calculated from the two-dimensional velocity gradient tensor in the plane of interest, and in order to recover sign information, we multiply
$\unicode[STIX]{x1D706}_{ci}$
is the imaginary part of the complex eigenvalue calculated from the two-dimensional velocity gradient tensor in the plane of interest, and in order to recover sign information, we multiply
 $\unicode[STIX]{x1D706}_{ci}$
by the sign of the local in-plane vorticity
$\unicode[STIX]{x1D706}_{ci}$
by the sign of the local in-plane vorticity
 $\unicode[STIX]{x1D6FA}/|\unicode[STIX]{x1D6FA}|$
to obtain
$\unicode[STIX]{x1D6FA}/|\unicode[STIX]{x1D6FA}|$
to obtain
 $\unicode[STIX]{x1D706}_{S}$
. In figure 22(a,b), we see the signature of an LSM event extending from
$\unicode[STIX]{x1D706}_{S}$
. In figure 22(a,b), we see the signature of an LSM event extending from
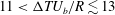 $11<\unicode[STIX]{x0394}TU_{b}/R\lesssim 13$
with the in-plane swirling strength in figure 22(b) indicating the location of several hairpin vortex heads, which we can see are arranged in an inclined manner from the wall. In the corresponding free surface parallel planes (figure 22
c,d), we can see free surface normal vortical motions termed ‘whirlpools’ by Banerjee (Reference Banerjee1994), one of the dominant features of free surface turbulence in the absence of strong mean shear (i.e. the lack of imposed shear, for example, in the case of wind blowing over the surface of the ocean). These motions are attributed to vortices attached to the free surface which have been shown in experiments (for example: Rashidi Reference Rashidi1997; Kumar, Gupta & Banerjee Reference Kumar, Gupta and Banerjee1998; Nezu & Sanjou Reference Nezu and Sanjou2011) and DNS of wide open channels and shear layers (Komori et al.
Reference Komori, Nagaosa, Murakami, Chiba, Ishii and Kuwahara1993; Pan & Banerjee Reference Pan and Banerjee1995; Tsai Reference Tsai1998) to be the legs of horseshoe- or hairpin-vortex-like structures that form at the wall. These studies have shown that when a hairpin-vortex-like structure forms at the wall, it rises up and impinges upon the free surface, upon which the head of the hairpin vortex ‘splats’ and dissipates laterally, leaving behind the legs which remain attached to the free surface and appear as coherent vertical vortical structures perpendicular to the free surface. Another prominent feature of free surface turbulence is the appearance of so-called ‘upwellings’ and ‘downdrafts’. Banerjee (Reference Banerjee1994) describes the signatures of the ‘upwellings’ as regions on or very near the free surface where the ‘streamlines radiate outwards’ and ‘downdrafts’ as regions where ‘streamlines converge forming what look like lines of stagnation flow’. We can see from figure 22(c,d) that this is indeed the case for the free surface in the partially filled pipe flow where the signatures of upwelling and downdrafts are clear. When the flow depth is reduced to
$11<\unicode[STIX]{x0394}TU_{b}/R\lesssim 13$
with the in-plane swirling strength in figure 22(b) indicating the location of several hairpin vortex heads, which we can see are arranged in an inclined manner from the wall. In the corresponding free surface parallel planes (figure 22
c,d), we can see free surface normal vortical motions termed ‘whirlpools’ by Banerjee (Reference Banerjee1994), one of the dominant features of free surface turbulence in the absence of strong mean shear (i.e. the lack of imposed shear, for example, in the case of wind blowing over the surface of the ocean). These motions are attributed to vortices attached to the free surface which have been shown in experiments (for example: Rashidi Reference Rashidi1997; Kumar, Gupta & Banerjee Reference Kumar, Gupta and Banerjee1998; Nezu & Sanjou Reference Nezu and Sanjou2011) and DNS of wide open channels and shear layers (Komori et al.
Reference Komori, Nagaosa, Murakami, Chiba, Ishii and Kuwahara1993; Pan & Banerjee Reference Pan and Banerjee1995; Tsai Reference Tsai1998) to be the legs of horseshoe- or hairpin-vortex-like structures that form at the wall. These studies have shown that when a hairpin-vortex-like structure forms at the wall, it rises up and impinges upon the free surface, upon which the head of the hairpin vortex ‘splats’ and dissipates laterally, leaving behind the legs which remain attached to the free surface and appear as coherent vertical vortical structures perpendicular to the free surface. Another prominent feature of free surface turbulence is the appearance of so-called ‘upwellings’ and ‘downdrafts’. Banerjee (Reference Banerjee1994) describes the signatures of the ‘upwellings’ as regions on or very near the free surface where the ‘streamlines radiate outwards’ and ‘downdrafts’ as regions where ‘streamlines converge forming what look like lines of stagnation flow’. We can see from figure 22(c,d) that this is indeed the case for the free surface in the partially filled pipe flow where the signatures of upwelling and downdrafts are clear. When the flow depth is reduced to
 $d/D=44\,\%$
as in figure 21(d), we see qualitatively very similar behaviour as shown in figure 23 where we have again focused on one segment
$d/D=44\,\%$
as in figure 21(d), we see qualitatively very similar behaviour as shown in figure 23 where we have again focused on one segment
 $(4<\unicode[STIX]{x0394}TU_{b}/R<7)$
and plotted the velocity fluctuations and swirling strength in planes along the bisector and in a free surface parallel plane at depth
$(4<\unicode[STIX]{x0394}TU_{b}/R<7)$
and plotted the velocity fluctuations and swirling strength in planes along the bisector and in a free surface parallel plane at depth
 $d/D=42\,\%$
 $(\unicode[STIX]{x0394}Z/D=0.02)$
. Again, the signatures of whirlpools, upwellings and downdrafts are all present.
$(\unicode[STIX]{x0394}Z/D=0.02)$
. Again, the signatures of whirlpools, upwellings and downdrafts are all present.
Subset of data from figure 21(b). (a,c) Streamwise velocity fluctuations with in-plane velocity vectors superimposed. (b,d) Swirling strength coloured by vorticity with in-plane velocity vectors superimposed.

Subset of data from figure 21(d). (a,c) Streamwise velocity fluctuations with in-plane velocity vectors superimposed. (b,d) Swirling strength coloured by vorticity with in-plane velocity vectors superimposed.

Example sequence of instantaneous flow fields for
 $d/D=44\,\%$
and
$d/D=44\,\%$
and
 $Re_{H}\approx 30\,000$
. Colour contours show instantaneous streamwise velocity fluctuations
$Re_{H}\approx 30\,000$
. Colour contours show instantaneous streamwise velocity fluctuations
 $u/U$
and arrows indicate the instantaneous in-plane velocities
$u/U$
and arrows indicate the instantaneous in-plane velocities
 $V$
and
$V$
and
 $W$
.
$W$
.

We next turn our attention to the in-plane motions in the cross-section of the pipe. Figure 24 shows an example series of instantaneous velocity vector fields. These data are independent of those which were shown in figure 22. Here, red and blue filled contours represent streamwise velocity fluctuations with instantaneous in-plane motion superimposed. It is apparent that there are large-scale coherent vortical motions near the free surface and that these cellular structures persist for some time. These are the so-called instantaneous ‘roll cells’ that are reported in Onitsuka & Nezu (Reference Onitsuka, Nezu and Kambe2001) who conducted PIV measurements in rectangular open channels and found that these instantaneous roll cells appeared regardless of the channel aspect ratio even in the absence of a long-time-average mean secondary flow. In the example shown in figure 24, we can see that at
 $\unicode[STIX]{x0394}TU_{b}/R=0$
there is a bursting event near the ‘corner’ where the no-slip wall meets the free surface on the left-hand side of the pipe. This bursting or ‘upwelling’ then interacts with the free surface and is dispersed laterally, forming a large streamwise-aligned vortex with clockwise rotation. At
$\unicode[STIX]{x0394}TU_{b}/R=0$
there is a bursting event near the ‘corner’ where the no-slip wall meets the free surface on the left-hand side of the pipe. This bursting or ‘upwelling’ then interacts with the free surface and is dispersed laterally, forming a large streamwise-aligned vortex with clockwise rotation. At
 $\unicode[STIX]{x0394}TU_{b}/R=0.08$
, the upwelling remains and the instantaneous roll cell moves towards the vertical bisector; at
$\unicode[STIX]{x0394}TU_{b}/R=0.08$
, the upwelling remains and the instantaneous roll cell moves towards the vertical bisector; at
 $\unicode[STIX]{x0394}TU_{b}/R=0.16$
the bursting motion is no longer present but the instantaneous roll cell remains and continues to move laterally towards the vertical bisector while remaining near the free surface; and from
$\unicode[STIX]{x0394}TU_{b}/R=0.16$
the bursting motion is no longer present but the instantaneous roll cell remains and continues to move laterally towards the vertical bisector while remaining near the free surface; and from
 $0.24<\unicode[STIX]{x0394}TU_{b}/R<0.4$
the instantaneous roll cell continues towards the vertical bisector whilst the signature of an upwelling appears again near the free surface on the left-hand side of the pipe. Another prominent feature that we observe from figure 24 is that the instantaneous roll cell described above coincides with regions where the spatial gradients of streamwise velocity fluctuations are large. That the ‘core’ of the roll cell appears to track closely with
$0.24<\unicode[STIX]{x0394}TU_{b}/R<0.4$
the instantaneous roll cell continues towards the vertical bisector whilst the signature of an upwelling appears again near the free surface on the left-hand side of the pipe. Another prominent feature that we observe from figure 24 is that the instantaneous roll cell described above coincides with regions where the spatial gradients of streamwise velocity fluctuations are large. That the ‘core’ of the roll cell appears to track closely with
 $u/U\approx 0$
as it moves from the wall to the bisector implies that these coherent features play a significant role in the transfer of streamwise velocity momentum. Reviews of open channel flow literature by Nezu (Reference Nezu2005) and Adrian & Marusic (Reference Adrian and Marusic2012) suggest that these instantaneous cellular secondary currents are related to the mean secondary flows, but are difficult to detect in the long time averages for wide channels
$u/U\approx 0$
as it moves from the wall to the bisector implies that these coherent features play a significant role in the transfer of streamwise velocity momentum. Reviews of open channel flow literature by Nezu (Reference Nezu2005) and Adrian & Marusic (Reference Adrian and Marusic2012) suggest that these instantaneous cellular secondary currents are related to the mean secondary flows, but are difficult to detect in the long time averages for wide channels
 $(B/d>5)$
as these features meander in space and time. The aspect ratios for the flow depths tested in this study range from
$(B/d>5)$
as these features meander in space and time. The aspect ratios for the flow depths tested in this study range from
 $1<B/d\lesssim 2.5$
and so the appearance of a long-time-averaged mean secondary flow is consistent with open channel flow where it was reported that a mean secondary flow was only observed for aspect ratios
$1<B/d\lesssim 2.5$
and so the appearance of a long-time-averaged mean secondary flow is consistent with open channel flow where it was reported that a mean secondary flow was only observed for aspect ratios
 $B/d\leqslant 5$
. Unlike rectangular open channels where multiple pairs of mean secondary roll cells will appear depending on aspect ratio, our S-PIV measurements have only been able to resolve one pair of rollers appearing in the long-time average in the partially filled pipe. This pair of mean secondary flow cells remains at a nominally constant distance from the free surface. We hypothesise that this is a geometric phenomenon peculiar to partially filled pipe flow. As we have seen, the instantaneous secondary cellular structures are associated with upwellings that originate at the no-slip wall. Due to wall curvature, a bursting motion at the no-slip wall will always be more likely to reach the free surface (and become an upwelling) near the corners where the free surface and no-slip wall coincide. This is a geometric constraint that is true except at the limits of very shallow flow depths or very full flow depths. As the upwelling impinges upon the free surface, lateral spreading occurs and an instantaneous roll pair forms. Since the upwellings are more likely to occur in the ‘corners’, one of the instantaneous roll cells is bounded by the no-slip wall and dies out, but the other is free to move laterally towards the vertical bisector. We postulate that this geometric constraint is the reason that only one pair of roll cells is observed near the free surface in the long-time-averaged velocity field and may also provide an explanation for the sense of rotation of the roll cells themselves.
$B/d\leqslant 5$
. Unlike rectangular open channels where multiple pairs of mean secondary roll cells will appear depending on aspect ratio, our S-PIV measurements have only been able to resolve one pair of rollers appearing in the long-time average in the partially filled pipe. This pair of mean secondary flow cells remains at a nominally constant distance from the free surface. We hypothesise that this is a geometric phenomenon peculiar to partially filled pipe flow. As we have seen, the instantaneous secondary cellular structures are associated with upwellings that originate at the no-slip wall. Due to wall curvature, a bursting motion at the no-slip wall will always be more likely to reach the free surface (and become an upwelling) near the corners where the free surface and no-slip wall coincide. This is a geometric constraint that is true except at the limits of very shallow flow depths or very full flow depths. As the upwelling impinges upon the free surface, lateral spreading occurs and an instantaneous roll pair forms. Since the upwellings are more likely to occur in the ‘corners’, one of the instantaneous roll cells is bounded by the no-slip wall and dies out, but the other is free to move laterally towards the vertical bisector. We postulate that this geometric constraint is the reason that only one pair of roll cells is observed near the free surface in the long-time-averaged velocity field and may also provide an explanation for the sense of rotation of the roll cells themselves.
9 Streamwise velocity correlations
So far, we have discussed the signatures of coherent structures in the instantaneous fields only on a qualitative basis; and have seen that when we are close to the no-slip boundaries but far from the free surface, the flow appears similar to full pipe flow with the footprint of LSM and VLSM structures apparent in the instantaneous snapshots. When we are close to the free surface, we observe free-surface-turbulence-like phenomenon, namely upwellings, downdrafts and whirlpools. The upwellings and downdrafts appear one after another in the streamwise direction with Adrian & Marusic (Reference Adrian and Marusic2012) reporting that these structures correspond to the LSM in pipes or bulges in turbulent boundary layers. To establish average structure characteristics we utilise the two-point spatio-temporal correlation of streamwise velocity fluctuations calculated using (9.1), where the zero subscripts denote the centre of the correlation and the streamwise extent is inferred using Taylor’s hypothesis.
 $$\begin{eqnarray}R_{uu}(\unicode[STIX]{x0394}x,\unicode[STIX]{x0394}y,\unicode[STIX]{x0394}z)=\frac{\overline{u(x_{0}+\unicode[STIX]{x0394}x,y_{0}+\unicode[STIX]{x0394}y,z_{0}+\unicode[STIX]{x0394}z)u(x_{0},y_{0},z_{0})}}{u_{rms}^{2}}.\end{eqnarray}$$
We begin by examining the two-dimensional spatial correlation in the radial–azimuthal plane calculated from S-PIV snapshots acquired at a low repetition rate (refer table 1). Figures 25–27 display the two-point correlations calculated at a constant wall distance of
 $r/R=0.8$
at the vertical bisector; a
$r/R=0.8$
at the vertical bisector; a
 $45^{\circ }$
bisector;
$45^{\circ }$
bisector;
 $10\,\%$
of flow depth from free surface and at
$10\,\%$
of flow depth from free surface and at
 $10\,\%$
of flow depth from free surface along the vertical bisector for flow depths of
$10\,\%$
of flow depth from free surface along the vertical bisector for flow depths of
 $d/D=44\,\%$
,
$d/D=44\,\%$
,
 $62\,\%$
and
$62\,\%$
and
 $80\,\%$
, respectively. In these plots, red indicates a positive correlation and blue a negative correlation with
$80\,\%$
, respectively. In these plots, red indicates a positive correlation and blue a negative correlation with
 $R_{uu}=\pm 0.1$
highlighted with the solid and dashed black lines, respectively. When we are at
$R_{uu}=\pm 0.1$
highlighted with the solid and dashed black lines, respectively. When we are at
 $r/R=0.8$
along the vertical bisector (the symmetry plane in this flow), we see that the correlated regions are symmetric; a region of positive correlation, flanked by regions of negative correlation. At first glance, this is similar to what has been reported in full pipe flow, channel flow and turbulent boundary layers, respectively, (for example: Monty et al.
Reference Monty, Stewart, Williams and Chong2007; Bailey & Smits Reference Bailey and Smits2010; Dennis & Nickels Reference Dennis and Nickels2011a
) and is the correlation pattern associated with hairpin vortex packets. When we move to the correlation calculated at
$r/R=0.8$
along the vertical bisector (the symmetry plane in this flow), we see that the correlated regions are symmetric; a region of positive correlation, flanked by regions of negative correlation. At first glance, this is similar to what has been reported in full pipe flow, channel flow and turbulent boundary layers, respectively, (for example: Monty et al.
Reference Monty, Stewart, Williams and Chong2007; Bailey & Smits Reference Bailey and Smits2010; Dennis & Nickels Reference Dennis and Nickels2011a
) and is the correlation pattern associated with hairpin vortex packets. When we move to the correlation calculated at
 $r/R=0.8$
along a
$r/R=0.8$
along a
 $45^{\circ }$
bisector, we begin to see the effect of broken azimuthal symmetry. The full pipe flow is axisymmetric and, as a result, the correlation calculated at a given wall distance is the same at every azimuthal position, and the symmetry plane of the correlated region must pass through the pipe centreline. For partially filled pipes, this is no longer the case. We see that along the
$45^{\circ }$
bisector, we begin to see the effect of broken azimuthal symmetry. The full pipe flow is axisymmetric and, as a result, the correlation calculated at a given wall distance is the same at every azimuthal position, and the symmetry plane of the correlated region must pass through the pipe centreline. For partially filled pipes, this is no longer the case. We see that along the
 $45^{\circ }$
bisector, the correlated regions are no longer symmetric. The positively correlated regions begin to ‘lean’ away from the free surface and the regions of negative correlation are no longer the same size. The leaning is most pronounced at
$45^{\circ }$
bisector, the correlated regions are no longer symmetric. The positively correlated regions begin to ‘lean’ away from the free surface and the regions of negative correlation are no longer the same size. The leaning is most pronounced at
 $d/D=44\,\%$
and barely noticeable at
$d/D=44\,\%$
and barely noticeable at
 $d/D=80\,\%$
. Interestingly, the asymmetry in the regions of negative correlation appear most pronounced at
$d/D=80\,\%$
. Interestingly, the asymmetry in the regions of negative correlation appear most pronounced at
 $d/D=80\,\%$
suggesting that although proximity to the free surface plays a large part in the distortions of the coherent structures relative to a full pipe flow, the mean secondary flow, present for all flow depths tested, is also important. We postulate that the mean secondary motion, which imposes a weak large-scale recirculation such that fluid near the vertical bisector moves away from the free surface towards the bottom of the pipe and fluid near the bottom of the pipe moves along the pipe wall up towards the free surface, interacts with and distorts not only the individual hairpin-vortex-like coherent motions near the wall, but may also interact with the concatenation and alignment of the hairpin vortices during the formation of hairpin vortex packets that make up the LSMs and VLSMs. This could be why the correlations, which are the averaged signature of the large-scale coherent motions (at the reference location that correlation is computed) exhibit this pronounced asymmetry. When we are at
$d/D=80\,\%$
suggesting that although proximity to the free surface plays a large part in the distortions of the coherent structures relative to a full pipe flow, the mean secondary flow, present for all flow depths tested, is also important. We postulate that the mean secondary motion, which imposes a weak large-scale recirculation such that fluid near the vertical bisector moves away from the free surface towards the bottom of the pipe and fluid near the bottom of the pipe moves along the pipe wall up towards the free surface, interacts with and distorts not only the individual hairpin-vortex-like coherent motions near the wall, but may also interact with the concatenation and alignment of the hairpin vortices during the formation of hairpin vortex packets that make up the LSMs and VLSMs. This could be why the correlations, which are the averaged signature of the large-scale coherent motions (at the reference location that correlation is computed) exhibit this pronounced asymmetry. When we are at
 $r/R=0.8$
and
$r/R=0.8$
and
 $10\,\%$
of depth from the free surface, we can see a distinct change in the correlation attributed to the difference in boundary conditions. For flow depths
$10\,\%$
of depth from the free surface, we can see a distinct change in the correlation attributed to the difference in boundary conditions. For flow depths
 $d/D=44\,\%$
and
$d/D=44\,\%$
and
 $62\,\%$
the region of negative correlation on the free-surface side disappears completely while at
$62\,\%$
the region of negative correlation on the free-surface side disappears completely while at
 $d/D=80\,\%$
there is only a very weakly anti-correlated region on the free surface side. The implication here is that the large-scale streaky structures, such as hairpin vortex packets and LSMs, that are a hallmark of wall turbulence characterised by regions of alternating streamwise-aligned low speed and high speed streaks, are not formed at the free surface (due to the lack of, or very weak, mean shear relative to the no-slip wall) and that streak-like structures observed in the free surface parallel instantaneous fields (i.e. figures 22
c,d and 23
c,d) originate from the wall. This becomes clear when we consider the correlation at
$d/D=80\,\%$
there is only a very weakly anti-correlated region on the free surface side. The implication here is that the large-scale streaky structures, such as hairpin vortex packets and LSMs, that are a hallmark of wall turbulence characterised by regions of alternating streamwise-aligned low speed and high speed streaks, are not formed at the free surface (due to the lack of, or very weak, mean shear relative to the no-slip wall) and that streak-like structures observed in the free surface parallel instantaneous fields (i.e. figures 22
c,d and 23
c,d) originate from the wall. This becomes clear when we consider the correlation at
 $10\,\%$
flow depth along the vertical bisector. At this point in the flow, we approach zero mean shear, (referring to the mean streamwise velocity profiles in figure 14), and there only exists a positively correlated region. The absence of negatively correlated regions implies that the pattern of alternating low and high speed streaks does not exist here.
$10\,\%$
flow depth along the vertical bisector. At this point in the flow, we approach zero mean shear, (referring to the mean streamwise velocity profiles in figure 14), and there only exists a positively correlated region. The absence of negatively correlated regions implies that the pattern of alternating low and high speed streaks does not exist here.
Contours of
 $R_{uu}$
centred at constant radius
$R_{uu}$
centred at constant radius
 $r/R=0.8$
moving clockwise from bottom of pipe until
$r/R=0.8$
moving clockwise from bottom of pipe until
 $10\,\%$
depth from free surface. Solid black line:
$10\,\%$
depth from free surface. Solid black line:
 $R_{uu}=0.1$
and dotted black line
$R_{uu}=0.1$
and dotted black line
 $R_{uu}=-0.1$
. Nominal flow depth
$R_{uu}=-0.1$
. Nominal flow depth
 $d/D=44\,\%$
.
$d/D=44\,\%$
.
Contours of
 $R_{uu}$
centred at constant radius
$R_{uu}$
centred at constant radius
 $r/R=0.8$
moving clockwise from bottom of pipe until
$r/R=0.8$
moving clockwise from bottom of pipe until
 $10\,\%$
depth from free surface. Solid black line:
$10\,\%$
depth from free surface. Solid black line:
 $R_{uu}=0.1$
and dotted black line
$R_{uu}=0.1$
and dotted black line
 $R_{uu}=-0.1$
. Nominal flow depth
$R_{uu}=-0.1$
. Nominal flow depth
 $d/D=62\,\%$
.
$d/D=62\,\%$
.
Contours of
 $R_{uu}$
centred at constant radius
$R_{uu}$
centred at constant radius
 $r/R=0.8$
moving clockwise from bottom of pipe until
$r/R=0.8$
moving clockwise from bottom of pipe until
 $10\,\%$
depth from free surface. Solid black line:
$10\,\%$
depth from free surface. Solid black line:
 $R_{uu}=0.1$
and dotted black line
$R_{uu}=0.1$
and dotted black line
 $R_{uu}=-0.1$
. Nominal flow depth
$R_{uu}=-0.1$
. Nominal flow depth
 $d/D=80\,\%$
.
$d/D=80\,\%$
.

Contours of
 $R_{uu}$
for flow depths (blue):
$R_{uu}$
for flow depths (blue):
 $d/D=44\,\%$
; (red):
$d/D=44\,\%$
; (red):
 $d/D=62\,\%$
and (black):
$d/D=62\,\%$
and (black):
 $d/D=80\,\%$
. Full pipe
$d/D=80\,\%$
. Full pipe
 $R_{uu}$
plotted in green for reference. (a–c): correlation calculated along vertical bisector for wall distances
$R_{uu}$
plotted in green for reference. (a–c): correlation calculated along vertical bisector for wall distances
 $r/R=0.8$
,
$r/R=0.8$
,
 $0.6$
and
$0.6$
and
 $0.4$
, respectively. (d–f), correlations calculated along
$0.4$
, respectively. (d–f), correlations calculated along
 $45^{\circ }$
bisector for wall distances
$45^{\circ }$
bisector for wall distances
 $r/R=0.8$
,
$r/R=0.8$
,
 $0.6$
and
$0.6$
and
 $0.4$
, respectively.
$0.4$
, respectively.
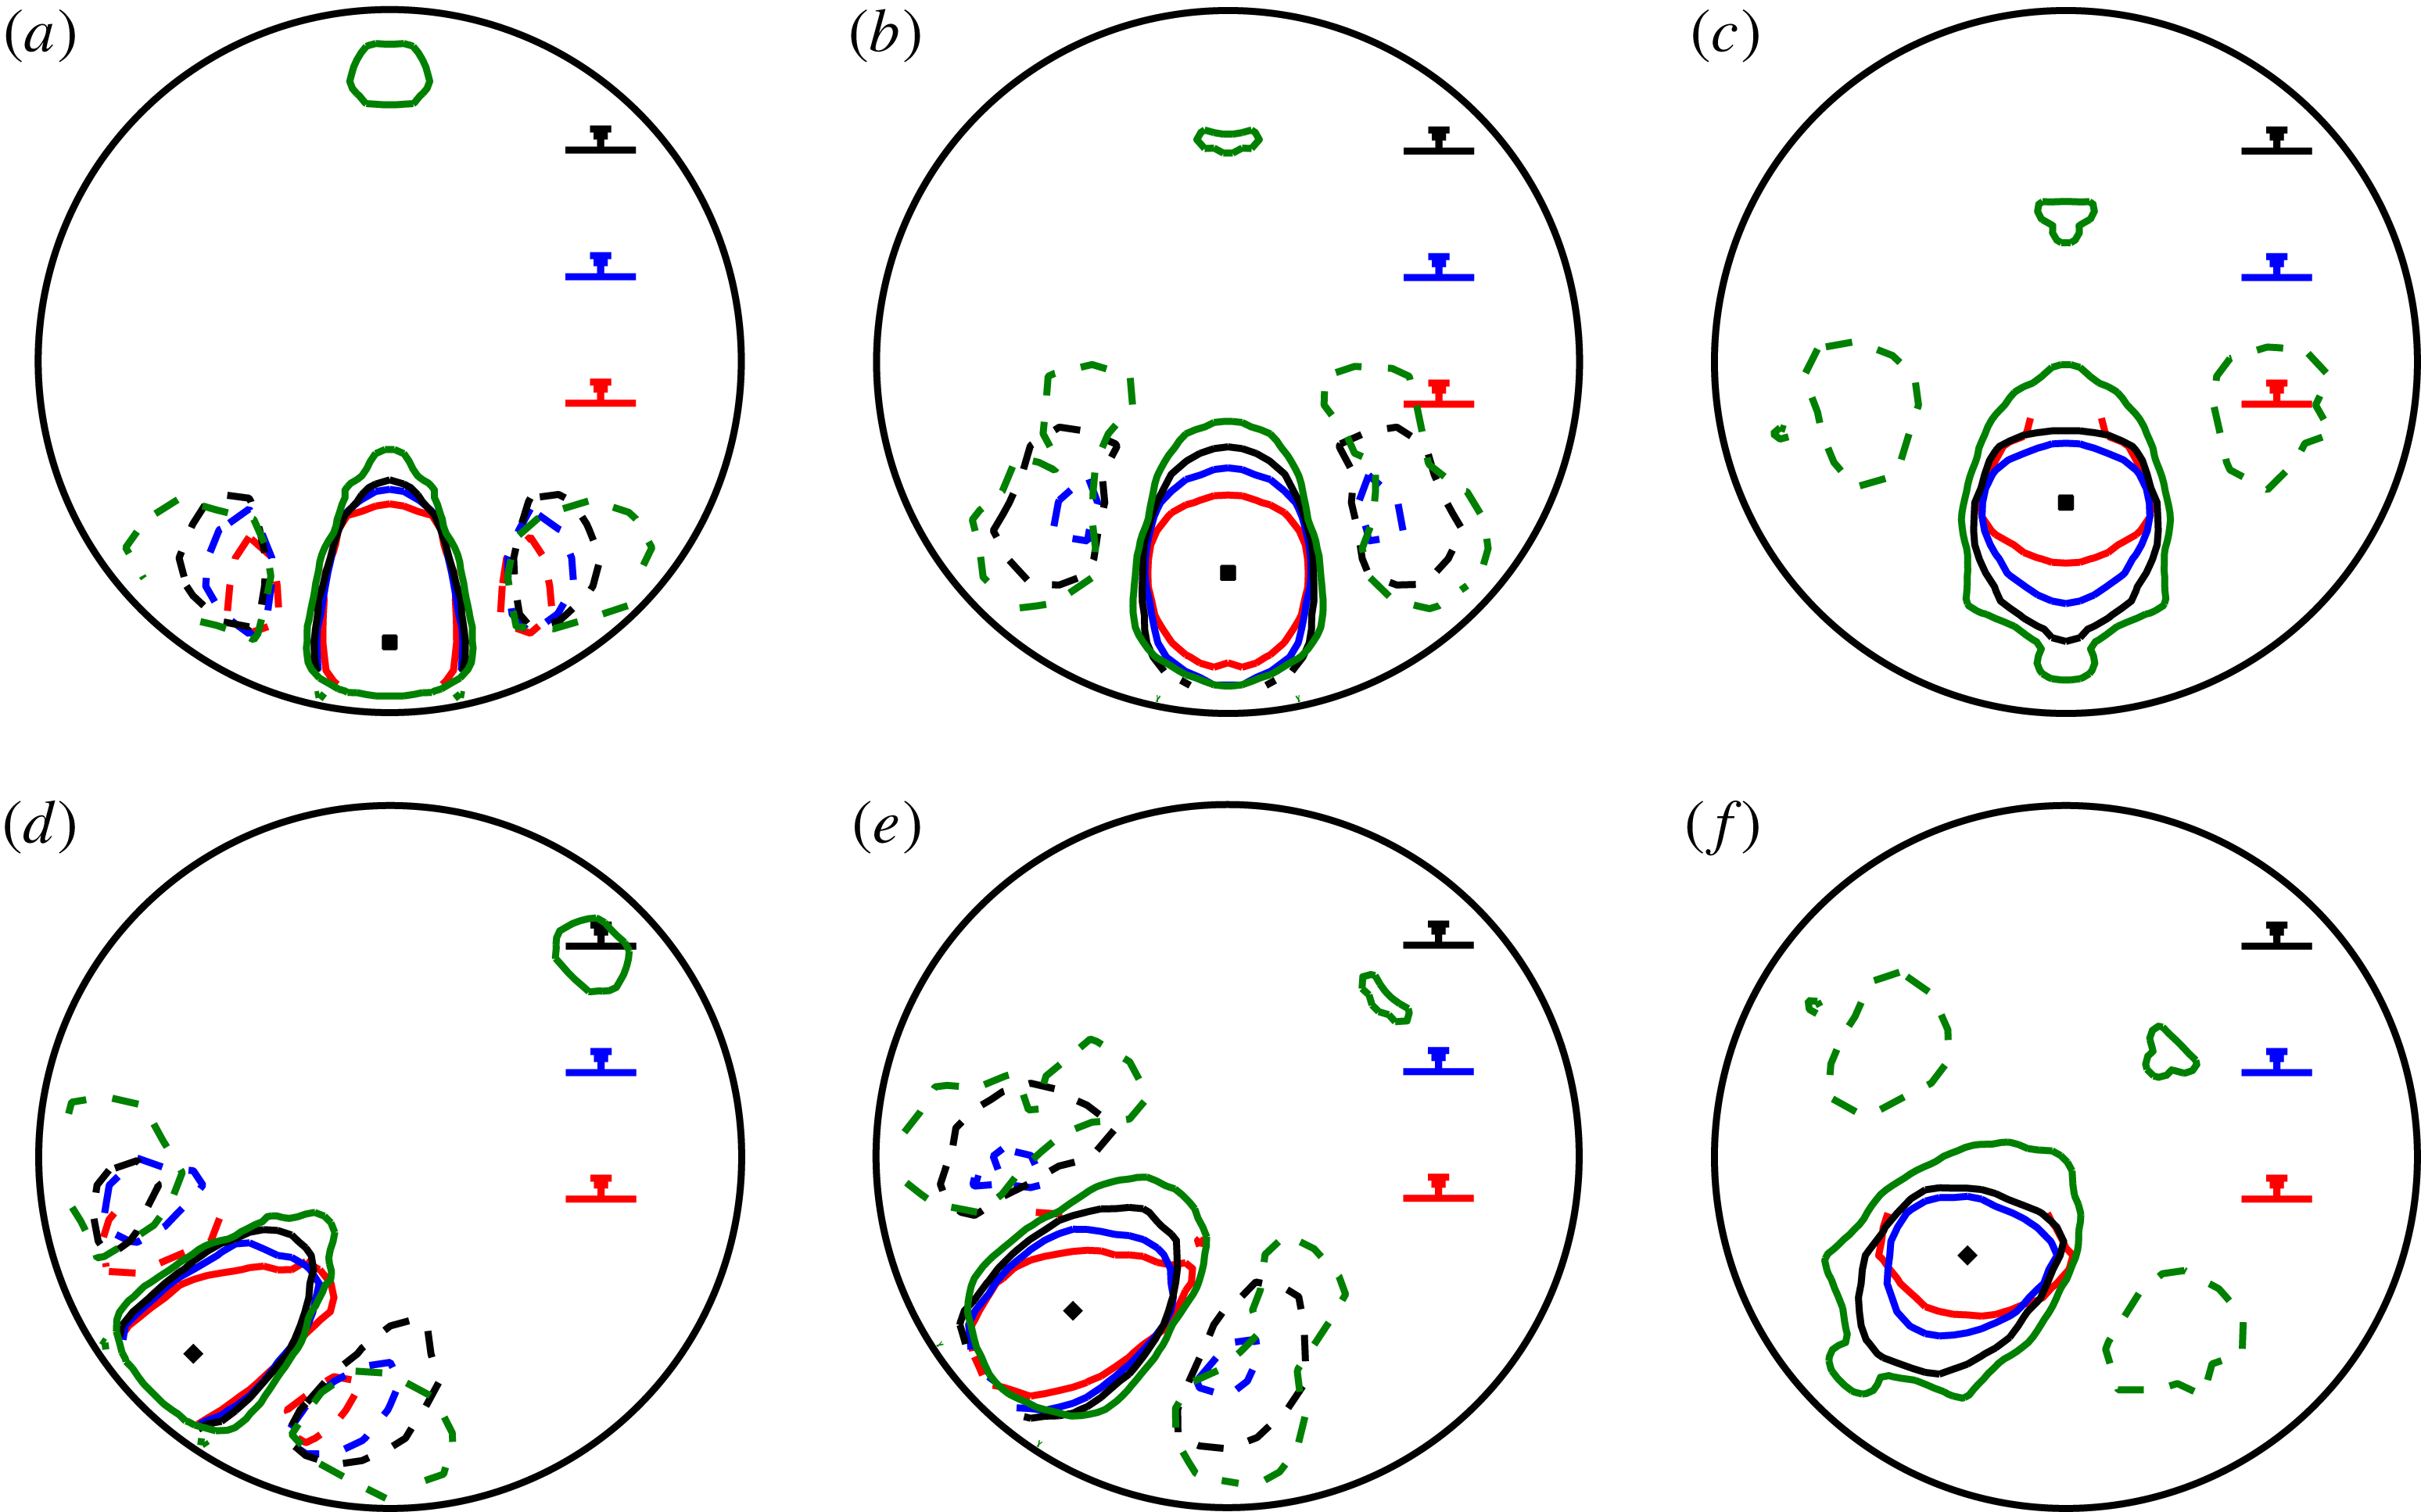
Figure 28 shows the two-dimensional two-point streamwise velocity correlations computed at wall distances of
 $r/R=0.8$
,
$r/R=0.8$
,
 $0.6$
and
$0.6$
and
 $0.4$
along the vertical bisector and a
$0.4$
along the vertical bisector and a
 $45^{\circ }$
bisector. Here solid lines represent
$45^{\circ }$
bisector. Here solid lines represent
 $R_{uu}=0.1$
and dashed lines
$R_{uu}=0.1$
and dashed lines
 $R_{uu}=-0.1$
. Green represents the full pipe flow; black
$R_{uu}=-0.1$
. Green represents the full pipe flow; black
 $d/D=80\,\%$
; blue
$d/D=80\,\%$
; blue
 $d/D=62\,\%$
and red
$d/D=62\,\%$
and red
 $d/D=44\,\%$
. It is immediately clear that the size of the correlated regions (from which we infer the average structure size) decreases with flow depth at each position. In figure 28(a,b) we see that at
$d/D=44\,\%$
. It is immediately clear that the size of the correlated regions (from which we infer the average structure size) decreases with flow depth at each position. In figure 28(a,b) we see that at
 $r/R=0.8$
and
$r/R=0.8$
and
 $0.6$
along the vertical bisector the positively correlated regions are compressed in the radial direction and remain around the same size in the azimuthal direction. Regions of negative correlation are compressed both radially and azimuthally; with no negative correlation observed in figure 28(b) for
$0.6$
along the vertical bisector the positively correlated regions are compressed in the radial direction and remain around the same size in the azimuthal direction. Regions of negative correlation are compressed both radially and azimuthally; with no negative correlation observed in figure 28(b) for
 $d/D=44\,\%$
. At
$d/D=44\,\%$
. At
 $r/R=0.4$
along the vertical bisector (figure 28
c) only the full pipe flow exhibits regions of negative correlation and even the region of positive correlation for
$r/R=0.4$
along the vertical bisector (figure 28
c) only the full pipe flow exhibits regions of negative correlation and even the region of positive correlation for
 $d/D=44\,\%$
‘splats’ onto the free surface. In figures 28(d)–28(f) the correlation is calculated at the same wall distances but along a
$d/D=44\,\%$
‘splats’ onto the free surface. In figures 28(d)–28(f) the correlation is calculated at the same wall distances but along a
 $45^{\circ }$
bisector. As already noted, we have broken azimuthal symmetry and the correlated regions lean away from the free surface at all flow depths except for the full pipe. In terms of size, a similar picture to that along the vertical bisector emerges; the positively correlated regions are compressed radially, but remain largely the same size azimuthally and regions of negative correlation are compressed in both the radial and azimuthal directions. For
$45^{\circ }$
bisector. As already noted, we have broken azimuthal symmetry and the correlated regions lean away from the free surface at all flow depths except for the full pipe. In terms of size, a similar picture to that along the vertical bisector emerges; the positively correlated regions are compressed radially, but remain largely the same size azimuthally and regions of negative correlation are compressed in both the radial and azimuthal directions. For
 $d/D=44\,\%$
, the region of negative correlation disappears by
$d/D=44\,\%$
, the region of negative correlation disappears by
 $r/R=0.6$
, and by
$r/R=0.6$
, and by
 $r/R=0.4$
, the remaining region of positive correlation is ‘splatted’ onto the free surface in much the same way as correlations computed along the vertical bisector. As the LSM and VLSM motions are known to carry a large proportion of the Reynolds shear stress and turbulent kinetic energy, the modification in the size and shape of the coherent motions shown here (especially along the
$r/R=0.4$
, the remaining region of positive correlation is ‘splatted’ onto the free surface in much the same way as correlations computed along the vertical bisector. As the LSM and VLSM motions are known to carry a large proportion of the Reynolds shear stress and turbulent kinetic energy, the modification in the size and shape of the coherent motions shown here (especially along the
 $45^{\circ }$
bisector) coincides with the preferential arrangement of the streamwise normal stress and TKE discussed in § 7.2.
$45^{\circ }$
bisector) coincides with the preferential arrangement of the streamwise normal stress and TKE discussed in § 7.2.
In closing this section, we turn our attention very briefly to the three-dimensional (3-D) correlations calculated from the high speed S-PIV data collected at
 $d/D=44\,\%$
;
$d/D=44\,\%$
;
 $62\,\%$
;
$62\,\%$
;
 $80\,\%$
and
$80\,\%$
and
 $100\,\%$
. Without the advantage of azimuthal symmetry (for the partially filled pipe) we require a very large amount of independent measurements to obtain converged 3-D correlations, so whilst we are confident that the general shapes are correct, the data do not appear to be fully statistically resolved. Furthermore, whilst Taylor’s hypothesis has been shown to be a valid estimate for projecting temporal information into the spatial domain, the choice of the ‘correct’ convection velocity is ambiguous (we have selected the bulk velocity for convenience). The choice of convection velocity is further complicated by the fact that the spatial distribution of the mean streamwise velocity in partially filled pipes is distorted relative to a full pipe flow and therefore the ratio of bulk velocity to local mean velocity is no longer only a function of the wall distance. We, therefore, limit ourselves only to a qualitative comparison of the change in structure lengths across flow depths, where we have used Taylor’s hypothesis to infer spatial information from the planar S-PIV measurements. A detailed statistical analysis of the LSM and VLSM in the vein of, for example, Dennis & Nickels (Reference Dennis and Nickels2011b
) and Lee et al. (Reference Lee, Ahn and Sung2015) is beyond the scope of this paper, but is the subject of future work.
$100\,\%$
. Without the advantage of azimuthal symmetry (for the partially filled pipe) we require a very large amount of independent measurements to obtain converged 3-D correlations, so whilst we are confident that the general shapes are correct, the data do not appear to be fully statistically resolved. Furthermore, whilst Taylor’s hypothesis has been shown to be a valid estimate for projecting temporal information into the spatial domain, the choice of the ‘correct’ convection velocity is ambiguous (we have selected the bulk velocity for convenience). The choice of convection velocity is further complicated by the fact that the spatial distribution of the mean streamwise velocity in partially filled pipes is distorted relative to a full pipe flow and therefore the ratio of bulk velocity to local mean velocity is no longer only a function of the wall distance. We, therefore, limit ourselves only to a qualitative comparison of the change in structure lengths across flow depths, where we have used Taylor’s hypothesis to infer spatial information from the planar S-PIV measurements. A detailed statistical analysis of the LSM and VLSM in the vein of, for example, Dennis & Nickels (Reference Dennis and Nickels2011b
) and Lee et al. (Reference Lee, Ahn and Sung2015) is beyond the scope of this paper, but is the subject of future work.
Figure 29 shows isosurfaces of
 $R_{uu}=0.15$
in red and
$R_{uu}=0.15$
in red and
 $R_{uu}=-0.1$
in blue, respectively, where the correlation is calculated at
$R_{uu}=-0.1$
in blue, respectively, where the correlation is calculated at
 $r/R=0.8$
along the vertical bisector for flow depths of
$r/R=0.8$
along the vertical bisector for flow depths of
 $d/D=100\,\%$
;
$d/D=100\,\%$
;
 $80\,\%$
;
$80\,\%$
;
 $62\,\%$
and
$62\,\%$
and
 $44\,\%$
from top to bottom. Visualisation using isosurface representation is slightly subjective as one must select an appropriate threshold level. We have chosen to display isosurfaces of
$44\,\%$
from top to bottom. Visualisation using isosurface representation is slightly subjective as one must select an appropriate threshold level. We have chosen to display isosurfaces of
 $R_{uu}=0.15$
and
$R_{uu}=0.15$
and
 $R_{uu}=-0.1$
for clarity; for example if were to halve the threshold level, disconnected regions of correlation appear away from the main regions suggesting the data are not statistically well resolved enough at very low threshold levels. However, since we have nominally the same amount of data for each flow depth, and our choice of threshold level remains constant, the threshold level itself does not significantly impact the conclusions to be drawn in this section. As we have already shown with the 2-D correlations there is a decrease in the radial and azimuthal size of the correlated regions with decreasing flow depth. In figure 29, we can now see that along the pipe vertical bisector there is an essentially monotonic decrease in the length of the correlated regions with decreasing flow depth as well. However, the change in length for the region of positive correlation is minimal between
$R_{uu}=-0.1$
for clarity; for example if were to halve the threshold level, disconnected regions of correlation appear away from the main regions suggesting the data are not statistically well resolved enough at very low threshold levels. However, since we have nominally the same amount of data for each flow depth, and our choice of threshold level remains constant, the threshold level itself does not significantly impact the conclusions to be drawn in this section. As we have already shown with the 2-D correlations there is a decrease in the radial and azimuthal size of the correlated regions with decreasing flow depth. In figure 29, we can now see that along the pipe vertical bisector there is an essentially monotonic decrease in the length of the correlated regions with decreasing flow depth as well. However, the change in length for the region of positive correlation is minimal between
 $d/D=62\,\%$
and
$d/D=62\,\%$
and
 $d/D=44\,\%$
, although the regions of negative correlation are clearly reducing in size with decreasing flow depth. This plot reveals much the same trends as the 2-D correlations: that the coherent structures near the wall along the vertical bisector in partially filled pipe flows are compressed when compared to the axisymmetric full pipe flow and that at this location the structures become increasingly small with decreasing flow depth. The likely cause is that along the vertical bisector of the partially filled pipe, there is a mean downward velocity owing to the secondary flow which is interacting with the coherent motions near the bottom of the pipe and suppressing their growth.
$d/D=44\,\%$
, although the regions of negative correlation are clearly reducing in size with decreasing flow depth. This plot reveals much the same trends as the 2-D correlations: that the coherent structures near the wall along the vertical bisector in partially filled pipe flows are compressed when compared to the axisymmetric full pipe flow and that at this location the structures become increasingly small with decreasing flow depth. The likely cause is that along the vertical bisector of the partially filled pipe, there is a mean downward velocity owing to the secondary flow which is interacting with the coherent motions near the bottom of the pipe and suppressing their growth.
Correlation of streamwise velocity fluctuations
 $R_{uu}$
at the pipe vertical bisector and height of
$R_{uu}$
at the pipe vertical bisector and height of
 $r/R=0.8$
. Top to bottom: flow depths
$r/R=0.8$
. Top to bottom: flow depths
 $d/D=100\,\%$
;
$d/D=100\,\%$
;
 $80\,\%$
;
$80\,\%$
;
 $62\,\%$
and
$62\,\%$
and
 $44\,\%$
. Red isosurface:
$44\,\%$
. Red isosurface:
 $R_{uu}=0.15$
and blue isosurface
$R_{uu}=0.15$
and blue isosurface
 $R_{uu}=-0.1$
.
$R_{uu}=-0.1$
.
Correlation of streamwise velocity fluctuations
 $R_{uu}$
at a
$R_{uu}$
at a
 $45^{\circ }$
bisector and height of
$45^{\circ }$
bisector and height of
 $r/R=0.8$
. Top to bottom: flow depths
$r/R=0.8$
. Top to bottom: flow depths
 $d/D=80\,\%$
;
$d/D=80\,\%$
;
 $62\,\%$
and
$62\,\%$
and
 $44\,\%$
. Red isosurface:
$44\,\%$
. Red isosurface:
 $R_{uu}=0.15$
and blue isosurface
$R_{uu}=0.15$
and blue isosurface
 $R_{uu}=-0.1$
.
$R_{uu}=-0.1$
.
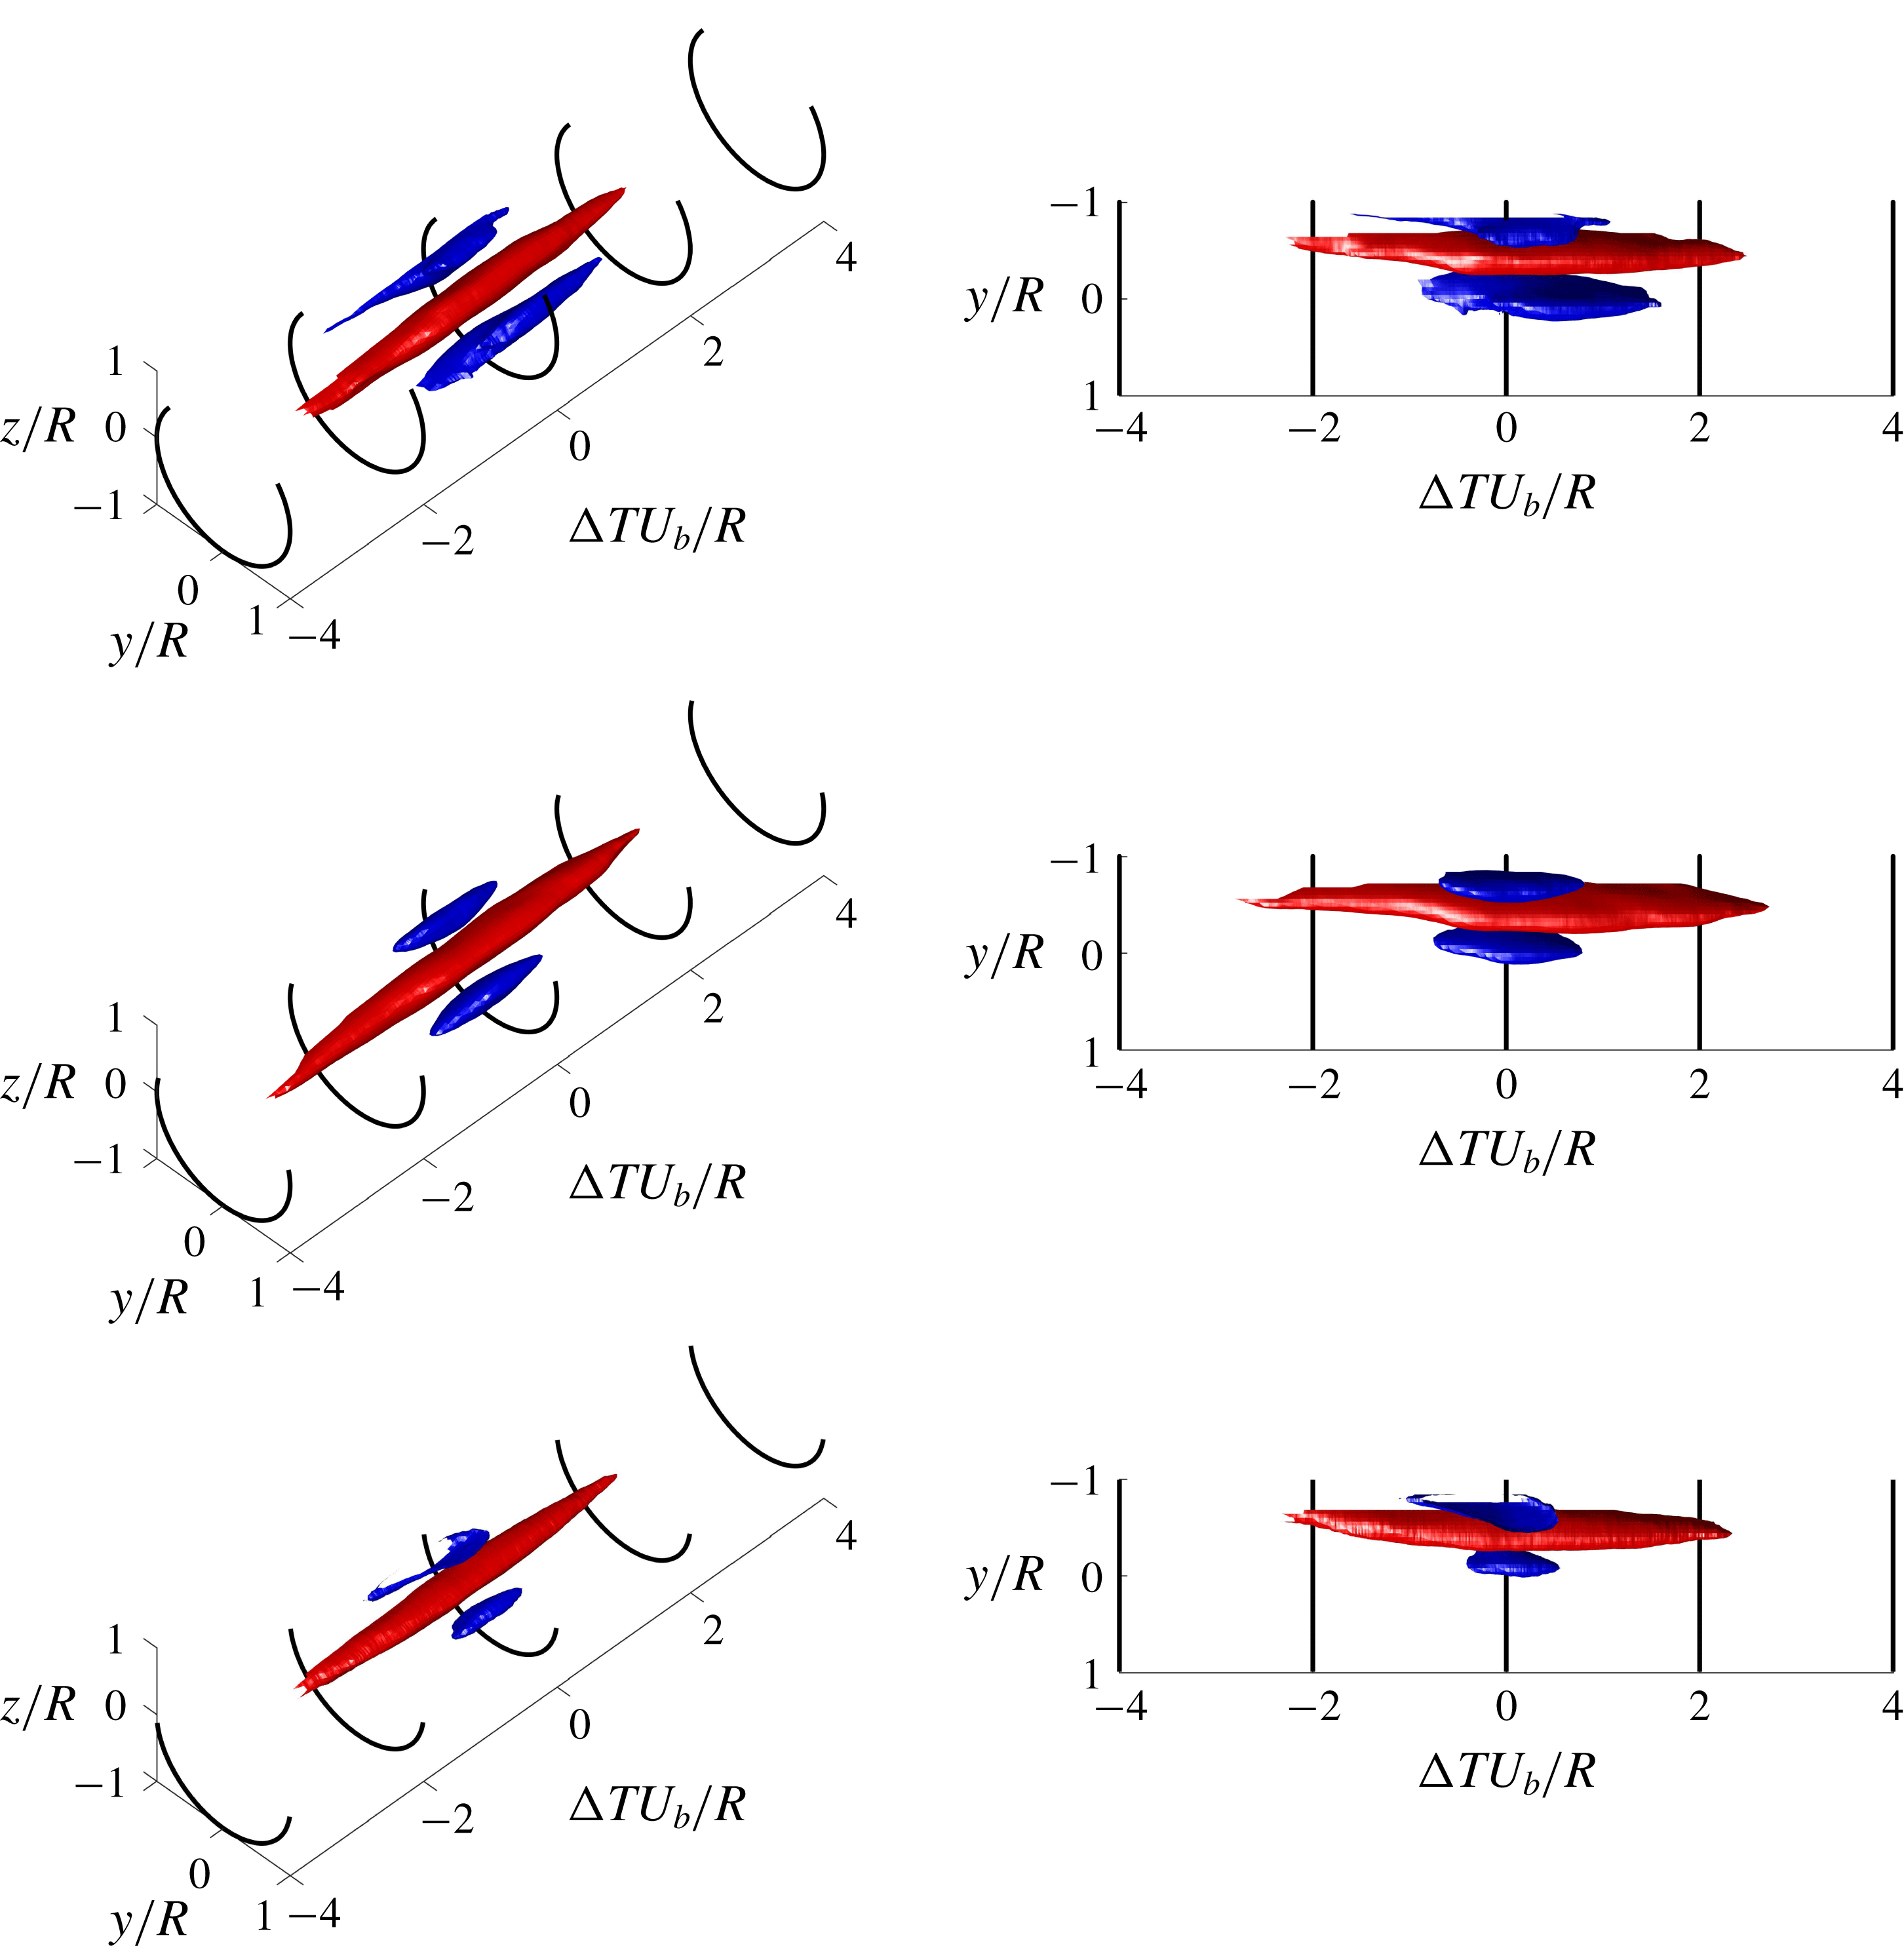
When we move around the periphery of the pipe wall to a
 $45^{\circ }$
bisector, a different trend emerges. We plot isosurfaces of
$45^{\circ }$
bisector, a different trend emerges. We plot isosurfaces of
 $R_{uu}$
calculated at
$R_{uu}$
calculated at
 $r/R=0.8$
at a
$r/R=0.8$
at a
 $45^{\circ }$
bisector in figure 30. As in figure 29,
$45^{\circ }$
bisector in figure 30. As in figure 29,
 $R_{uu}=0.15$
is shown in red and
$R_{uu}=0.15$
is shown in red and
 $R_{uu}=-0.1$
in blue. Here, the length of the correlations does not appear to reduce monotonically with depth. Furthermore, the correlated regions at
$R_{uu}=-0.1$
in blue. Here, the length of the correlations does not appear to reduce monotonically with depth. Furthermore, the correlated regions at
 $d/D=62\,\%$
and
$d/D=62\,\%$
and
 $d/D=44\,\%$
appear flatter and more distorted than those at
$d/D=44\,\%$
appear flatter and more distorted than those at
 $d/D=80\,\%$
, and there is a clear asymmetry between the regions of negative correlation consistent with the 2-D correlations. One thing to bear in mind is that we are much closer to the free surface for a flow depth
$d/D=80\,\%$
, and there is a clear asymmetry between the regions of negative correlation consistent with the 2-D correlations. One thing to bear in mind is that we are much closer to the free surface for a flow depth
 $d/D=44\,\%$
than
$d/D=44\,\%$
than
 $d/D=80\,\%$
and this is even more true when considering the flow along a
$d/D=80\,\%$
and this is even more true when considering the flow along a
 $45^{\circ }$
bisector. Also, at this point in the flow, the mean secondary motion is no longer downwards, but more rather upwards following the curvature of the pipe wall. This results in a distortion of the shape of the correlated regions as already shown in two dimensions, but also the alignment is altered, for example, in figure 30 at a flow depth of
$45^{\circ }$
bisector. Also, at this point in the flow, the mean secondary motion is no longer downwards, but more rather upwards following the curvature of the pipe wall. This results in a distortion of the shape of the correlated regions as already shown in two dimensions, but also the alignment is altered, for example, in figure 30 at a flow depth of
 $d/D=80\,\%$
the region of negative correlation nearer to the free surface lags behind the region of negative correlation closer to the vertical bisector. The reason for this misalignment is not clear at this time; and we have not observed a particularly strong meandering motion in the instantaneous fields (figure 20
b), however, as we already mention when discussing the 2-D correlations in figures 25–27, this lead/lag in the anti-correlated regions may be indicative of the mean secondary motion influencing the formation of hairpin packets which are the building blocks of the LSMs and VLSMs. One thing that is clear at this stage is that the correlation lengths are longer along the
$d/D=80\,\%$
the region of negative correlation nearer to the free surface lags behind the region of negative correlation closer to the vertical bisector. The reason for this misalignment is not clear at this time; and we have not observed a particularly strong meandering motion in the instantaneous fields (figure 20
b), however, as we already mention when discussing the 2-D correlations in figures 25–27, this lead/lag in the anti-correlated regions may be indicative of the mean secondary motion influencing the formation of hairpin packets which are the building blocks of the LSMs and VLSMs. One thing that is clear at this stage is that the correlation lengths are longer along the
 $45^{\circ }$
bisector than along the vertical bisector. These 3-D correlations suggest that the general structure of the coherent motions is similar to full pipe flow with regions of positive correlation flanked by regions of negative correlation, but that the size and the shapes of the correlated regions (from which we infer coherent structures) varies along the periphery. This implies that on average the coherent motions in partially filled pipe flow are modified and distorted throughout the entire flow field and this effect is not only confined to near the free surface. That the distortion and attenuation of coherent motions in partially filled pipes depends on flow depth and azimuthal location (which may be thought of as a local flow depth) indicates that the LSMs and VLSMs no longer scale simply on pipe radius
$45^{\circ }$
bisector than along the vertical bisector. These 3-D correlations suggest that the general structure of the coherent motions is similar to full pipe flow with regions of positive correlation flanked by regions of negative correlation, but that the size and the shapes of the correlated regions (from which we infer coherent structures) varies along the periphery. This implies that on average the coherent motions in partially filled pipe flow are modified and distorted throughout the entire flow field and this effect is not only confined to near the free surface. That the distortion and attenuation of coherent motions in partially filled pipes depends on flow depth and azimuthal location (which may be thought of as a local flow depth) indicates that the LSMs and VLSMs no longer scale simply on pipe radius
 $R$
as in the canonical pipe flow.
$R$
as in the canonical pipe flow.
10 Conclusions
Stereoscopic particle imaging velocimetry was used to measure the velocity distribution in the radial–azimuthal plane in both laminar and turbulent partially filled pipe flow. The measured laminar flow velocity distribution was in very good agreement with a recently published theoretical solution (Guo & Meroney Reference Guo and Meroney2013) and the maximum streamwise velocity in the laminar flow region remained at or close to the free surface for flow depths up to
 $d/D\approx 85\,\%$
in good agreement with the prediction from theory. Turbulent flow velocity measurements were conducted at a nominally constant Reynolds number of
$d/D\approx 85\,\%$
in good agreement with the prediction from theory. Turbulent flow velocity measurements were conducted at a nominally constant Reynolds number of
 $Re_{H}\approx 30\,000$
for five flow depths between
$Re_{H}\approx 30\,000$
for five flow depths between
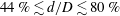 $44\,\%\lesssim d/D\lesssim 80\,\%$
with the bulk Froude number less than unity in all cases so we have a sub-critical fully turbulent flow. The mean streamwise velocity distribution was heavily distorted relative to laminar partially filled pipe flow with the maximum streamwise velocity appearing below the free surface for all depths tested. A distortion of the mean streamwise velocity distribution is often associated with the presence of a mean secondary flow which we confirm by examination of the in-plane velocity components. Unlike mean secondary flows reported in open channels and square ducts, the mean secondary flow pattern that we were able to resolve in this study manifested as only a single pair of rolls reflected about the pipe vertical bisector, each of which filling the half-width of the pipe. Furthermore, the secondary flow cells which had essentially the same strength, remained at a constant distance from the free surface with decreasing flow depth. The spatial distributions of streamwise Reynolds normal stress and TKE revealed a preferential arrangement in contrast to the axisymmetric full pipe flow. Snapshots obtained from high speed PIV revealed the instantaneous signatures of large-scale coherent motions (LSMs and VLSMs) that are found to be ubiquitous in wall-bounded turbulent flows; and free surface parallel snapshots revealed the presence of upwellings, downdrafts and whirlpools, the hallmarks of free surface turbulence in the absence of a strong imposed mean shear. Two point correlations of streamwise velocity fluctuations suggest that the LSM and VLSM type motions are present in partially filled pipe flow, but are distorted by proximity to the free surface and the presence of the mean secondary flow. For example, in the bottom of the partially filled pipe, the general pattern of the correlation with a positive region flanked by negative regions is the same as a full pipe flow, however, the correlations become compressed and distorted as we move around the periphery. When we approach the free surface, for example, in the corner where the free surface and no-slip wall meet, the pattern of the correlation changes; the region of positive correlation remains, but a region of negative correlation only forms on the side of the no-slip wall. This implies that the streaky structures in wall turbulence cannot form at the free surface due to the absence of mean shear and that the coherent motions observed at the free surface (i.e. the upwellings, downdrafts and whirlpools) must all originate from the wall, a result consistent with open channel flows. These results also demonstrate that the LSMs and VLSMs no longer scale simply with the pipe radius
$44\,\%\lesssim d/D\lesssim 80\,\%$
with the bulk Froude number less than unity in all cases so we have a sub-critical fully turbulent flow. The mean streamwise velocity distribution was heavily distorted relative to laminar partially filled pipe flow with the maximum streamwise velocity appearing below the free surface for all depths tested. A distortion of the mean streamwise velocity distribution is often associated with the presence of a mean secondary flow which we confirm by examination of the in-plane velocity components. Unlike mean secondary flows reported in open channels and square ducts, the mean secondary flow pattern that we were able to resolve in this study manifested as only a single pair of rolls reflected about the pipe vertical bisector, each of which filling the half-width of the pipe. Furthermore, the secondary flow cells which had essentially the same strength, remained at a constant distance from the free surface with decreasing flow depth. The spatial distributions of streamwise Reynolds normal stress and TKE revealed a preferential arrangement in contrast to the axisymmetric full pipe flow. Snapshots obtained from high speed PIV revealed the instantaneous signatures of large-scale coherent motions (LSMs and VLSMs) that are found to be ubiquitous in wall-bounded turbulent flows; and free surface parallel snapshots revealed the presence of upwellings, downdrafts and whirlpools, the hallmarks of free surface turbulence in the absence of a strong imposed mean shear. Two point correlations of streamwise velocity fluctuations suggest that the LSM and VLSM type motions are present in partially filled pipe flow, but are distorted by proximity to the free surface and the presence of the mean secondary flow. For example, in the bottom of the partially filled pipe, the general pattern of the correlation with a positive region flanked by negative regions is the same as a full pipe flow, however, the correlations become compressed and distorted as we move around the periphery. When we approach the free surface, for example, in the corner where the free surface and no-slip wall meet, the pattern of the correlation changes; the region of positive correlation remains, but a region of negative correlation only forms on the side of the no-slip wall. This implies that the streaky structures in wall turbulence cannot form at the free surface due to the absence of mean shear and that the coherent motions observed at the free surface (i.e. the upwellings, downdrafts and whirlpools) must all originate from the wall, a result consistent with open channel flows. These results also demonstrate that the LSMs and VLSMs no longer scale simply with the pipe radius
 $R$
which is the natural outer length scale for canonical pipe flow.
$R$
which is the natural outer length scale for canonical pipe flow.
Acknowledgements
The authors would like to acknowledge the support of the National Nuclear Laboratory. R.J.P. would like to thank the EPSRC for the award of a Fellowship under grant number EP/M025187/1. H.L.F.C. would like to thank the EPSRC for the award of a Vacation Bursary.


 Open access