Infant and young child feeding practices are relevant modifiable exposures with short- and long-term effects on health and development( Reference Smithers, Golley and Brazionis 1 ). Inadequate feeding practices are a major barrier to the promotion of sustainable economic development and poverty reduction. Efforts to accelerate economic development will not succeed if there is not enough investment in social conditions to ensure adequate feeding( 2 ). Programmes and actions aimed at improving complementary feeding are responsible for preventing 5 % of infant mortality caused by diarrhoea, pneumonia, measles and malaria( Reference Jones, Steketee and Black 3 ) each year.
The WHO recommends the use of multiple indicators to assess breast-feeding, specific food groups and meal frequency according to age range( 4 ). A detailed interpretation of these multiple indicators, during the first 5 years of life, continues to be a key issue for understanding infant feeding as an integrated and sequential phenomenon, which has strong social determination and is critical for the development of dietary patterns (DP) at early ages( Reference Golley, Smithers and Mittinty 5 ). Although these indicators are important for understanding feeding practices, another relevant challenge is to describe the complete set of food consumption, including breast-feeding and other simultaneously or subsequently consumed foods.
The need to deal with multiple feeding indicators makes the process more complex and requires broad data sets to allow detailed analysis using specific age ranges. One approach to assessing infant and child feeding practices is multivariate analysis as it enables the reduction of a large set of food variables to fewer and more robust DP( Reference Smithers, Golley and Brazionis 1 ). This multivariate analysis has been used to identify the DP of infants and young children, together with their stability or change over age ranges and their association with socio-economic factors( Reference Gatica, Barros and Madruga 6 – Reference Kristiansen, Lande and Sexton 12 ). Traditionally, in studies of infant and young children’s feeding practices, DP are generated separately according to age ranges recommended by WHO( 4 , Reference Golley, Smithers and Mittinty 5 ). A recent study showed that the DP ‘longer breastfeeding, later main meal food introduction, and use of homemade foods’, identified in 2-year-old children, predicted weaker association with the DP ‘processed and fast foods’ and stronger association with the DP ‘guidelines’ in these same children when aged 3 and 5 years. The ‘guidelines’ pattern comprised foods recommended by WHO( Reference Lioret, Betoko and Forhan 8 ). Breast-feeding practices showed positive association with the DP ‘healthy, meat and vegetable’ for Australian children( Reference Grieger, Scott and Cobiac 7 ).
The majority of Brazilian studies on feeding practices in childhood were based on regional samples, with different age ranges, in which the main outcome was food group consumption and its association with socio-economic, maternal and child characteristics( Reference Bortolini, Gubert and Santos 13 – Reference Saldiva, Venancio and Gouveia 18 ). National feeding practices in childhood studies have been reported as separate food groups only, using data from the latest Brazilian Demographic and Health Survey (BDHS; 2006)( Reference Bortolini, Gubert and Santos 13 , Reference Bortolini, Vitolo and Gubert 19 , Reference Bortolini, Vitolo and Gubert 20 ). Assessment of DP trends throughout growth and time should be carried out in all countries to describe the past and present situation, to explore the associated factors, and to support and evaluate public health policies.
The objectives of our study were twofold: (i) to describe DP in the period from 1996 to 2006 and in the first 5 years of life; and (ii) to explore individual and contextual characteristics associated with each DP.
Participants and methods
Data source
The databases selected for the present study were two BDHS for the periods 1996–1997 and 2006–2007. These surveys are integrated into Phase III and Phase V of Monitoring and Evaluation to Assess and Use Results Demographic and Health Survey (Measure DHS) (http://www.dhsprogram.com/). DHS cover the population of women of reproductive age and children under 5 years of age. All samples are nationally representative.
Sampling and study population
The BDHS are complex probabilistic samples, stratified (by geographic region), and constructed in two stages in which the primary sampling units are clusters and the secondary sampling units are households. Eligible children in our study were those alive on the interview date and who lived with the mother or respondent. After applying these criteria, 4680 (97·1 % of total children in 1996–1997) and 4817 children (95·3 % of total children in 2006–2007) were included in the final sample.
Dietary data
The BDHS questionnaires asked mothers about children’s consumption, in the previous 24 h (0=no and 1=yes), of the following foods: breast milk, water, sugary water, teas, other liquid, fruit juices, milk, formulas, yoghurt, tubers, vegetables, leaves, fruits, eggs, chicken, fish and red meat, enriched papilla and papilla with industrially added starch (papilla is prepared with mashed foods and is offered for infants aged 6–12 months, especially those who do not yet have teeth). We collapsed water, sugary water and other liquids into a single variable, ‘liquids’. The original BDHS questionnaires had two particularities: (i) ‘other liquids’ accounted for water-based liquids or country-specific liquids with water and an explanation as to the kind of liquids included was provided; and (ii) eggs, chicken and fish consumption were combined in a single group in the original questionnaire.
This food list was similar in both survey years. In the present study, missing values or ‘do not know’ answers for any food variables were replaced by 0, meaning that the child had not consumed the specific food in the previous 24 h( 4 ). The percentages of replaced values were 3 % in 1996–1997 and 1·5 % in 2006–2007.
To describe breast-feeding frequency, we used the variable ‘number of times the child received breast milk in the last 24 h’. We categorized this variable into tertiles to maximize the exposure and representativeness of breast milk in the analysis. We attributed 0 to all children who did not receive breast milk.
Sociodemographic, maternal and child characteristics
The variables selected from BDHS questionnaires comprised: household area, geographic region, maternal working, wealth index as a proxy for income (unavailable from DHS), maternal age at child’s birth, birth interval (for children born in the last 5 years), marital status and maternal education. Maternal education refers to the highest completed level. Wealth index was calculated using all available household assets and education of family head for each survey year. These household assets were included in the principal component analysis (PCA); the first component was selected and was expressed in scores( Reference Filmer and Pritchett 21 ).
Information about the child included: sex, age, disease outcomes in the previous 15 d (such as cough, fever and diarrhoea) and number of children under 5 years in the household. The three diseases were collapsed into a binary variable to indicate absence or presence of at least one disease.
Dietary patterns
DP were estimated using PCA. The number of patterns (components) retained was defined using eigenvalues higher than 1·0 and eigenvectors (loadings) higher than 0·2. We adopted lower values for these parameters to enlarge our understanding of the composition of the patterns, mainly because the number of different foods in our sample was small (fifteen foods). Although lower eigenvectors were less representative of DP, they contribute to understanding the complexity of dietary intake and to representing all aspects of this behavior. To understand the transition of DP from 1996 to 2006 and over age ranges, we combined both data sets before running the PCA. We considered this approach to be the best solution to evaluate DP transition between age ranges and survey years. After DP extraction, we applied an orthogonal rotation (Varimax) to improve interpretability. We used the Kaiser–Meyer–Olkin statistic to analyse the compliance of variables with the PCA. For each pattern identified, standardized scores were generated for each child. We presumed that the value of the score represented the closeness of the child to the DP and thus for each child we assigned the pattern with the highest probability of adherence (Fig. 1). We did not label the DP since labelling is subjective and does not add new information to the pattern.
The analytical scheme of dietary patterns (DP). *1=the most prevalent DP for each child; 0=other least prevalent DP. †Age ranges: 0–5, 6–11, 12–23 and 24–59 months (PCA, principal component analysis)

Statistical analyses
Sociodemographic, maternal and child characteristics were described as relative frequency with 95 % CI. We used a χ 2 test to compare survey years and DP frequencies were described by survey years and by age ranges within each survey year. The complex sample design was incorporated in this descriptive analysis. The prevalence of each DP between survey years and among age ranges was compared by testing the equality of proportions.
The BDHS samples were stratified by geographic region and we incorporated this hierarchical structure in the statistical analyses. The hierarchical structure of data implies that characteristics shared among individuals in the same group (intragroup) are more similar than among individuals of different groups (intergroup). If this structure is not considered, the independence principle of variables of one-level analysis is violated and the real effect of predictors on outcome is altered( Reference Leckie 22 ). Therefore, we applied a two-level random-slope logistic regression model. We performed one model for each DP (outcome variables).
At the individual level we included sociodemographic, maternal and child characteristics. At the contextual level, we included geographic region and survey year. We allocated the survey year in both levels of multilevel analysis. At the individual level, this variable represented the effect of year transition on DP and our assumption was that this effect was the same in all geographic regions. The year could also represent some behaviours that were not included in the analysis because they had not been included in the DHS questionnaire. At the contextual level, this temporal variable represented the percentage of variance between geographic regions that was explained by difference between survey years (the effect of time in each geographic region).
We were able to estimate DP change from 1996 to 2006 by introducing the survey year variable into the multilevel model; the year 1996 was considered as the reference or base category for all variables. Therefore, coefficients in models from all variables (sociodemographic, maternal and child health) express changes in that variable in 1996 and can be multiplied by survey year coefficient to estimate the change from 1996 to 2006.
At the individual level, we estimated OR values and their respective 95 % CI of individual characteristics on outcomes. At the contextual level, we estimated the variance of the outcome. The variance-partitioned coefficient at contextual level was estimated and represents the variance percentage in the multilevel model attributed to contextual level. In the logistic regression model, the residuals were distributed in a logistic distribution with a mean of 0 and constant variance of 3·29( Reference Merlo, Chaix and Ohlsson 23 ).
In our final analysis, we estimated the distribution of residuals of DP between survey year and geographic regions to visualize which geographic regions had more variance of DP. We illustrated these residuals in caterpillar plots (online supplementary material). At the contextual level we estimated the components of variance of mean effects from individual characteristics according to geographic region. The multilevel analysis was performed without considering the complex survey design.
All analyses were performed using the statistical software package Stata version 13.0 SE. The study was approved by the Ethical Research Committee of the Public Health School, University of São Paulo (protocol number 2336).
Results
The food consumption of Brazilian children in the first 5 years of life was summarized in four DP for both survey years. DP1 comprised mainly solid foods with more diversity of food groups. DP2 comprised solid and liquid foods and was characterized as a mixed DP regarding texture. DP3 was characterized as comprising semi-solid foods and DP4 as liquid foods (Table 1). Some foods had loadings greater than 0·2 for more than one DP (cross-loading), but the loadings were always higher in one of the DP and assumed a different level of importance in each. Additionally, the loading sign (positive or negative) expresses different meaning in each DP. Positive loading represents a positive correlation of that specific food with the DP and the value of loading is higher as the presence of such food is more frequent. Negative loading in the DP can be interpreted as a food less frequently consumed or not consumed with other the foods that comprise the DP.
Description of dietary patterns (DP) in children under 5 years of age in Brazil. Brazilian Demographic and Health Surveys, 1996–1997 and 2006–2007

* Only eigenvectors ≥|0·2| are displayed.
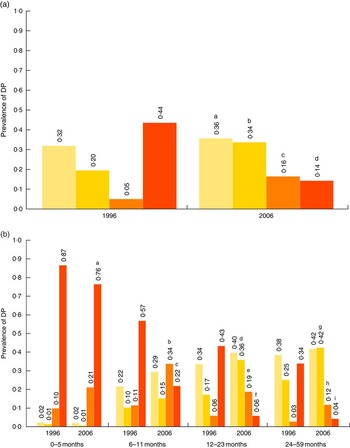
The prevalence of DP1, DP2 and DP3 increased from 1996 to 2006, whereas that of DP4 decreased in this period. The size of the increase was lower for DP1 than for DP2 and DP3 between 1996 and 2006 (Fig. 2(a)). Figure 2(b) shows two temporal results: the prevalence of the DP throughout the child’s growth (age range) and according to survey year (time). The prevalence of DP1 was similar (P>0·05) between 1996 and 2006 for all age ranges and increased with growth (0–59 months). The prevalence of DP2 was higher in 2006 than in 1996 after 24 months and increased with growth. The prevalence of DP3 increased significantly in 2006 after 6 months, increased from 0 to 11 months and decreased thereafter. The prevalence of DP4 decreased significantly from 1996 to 2006 in all age ranges.
Prevalence of four dietary patterns (DP) in children under 5 years of age (![]() , DP1;
, DP1; ![]() , DP2;
, DP2; ![]() , DP3;
, DP3; ![]() , DP4) according to survey year (a) and survey year and age range (b); Brazilian Demographic and Health Surveys, 1996–1997 and 2006–2007. (a) Comparison between 1996 and 2006: a
P=0·0327, b
P=0·0000, c
P=0·0000, d
P=0·0000. (b) Comparison between 1996 and 2006 within each age range: a
P=0·0002, b
P=0·0019, c
P=0·0000, d
P=0·0000, e
P=0·0199, f
P=0·0000, g
P=0·0000, h
P=0·0179, i
P=0·0000
, DP4) according to survey year (a) and survey year and age range (b); Brazilian Demographic and Health Surveys, 1996–1997 and 2006–2007. (a) Comparison between 1996 and 2006: a
P=0·0327, b
P=0·0000, c
P=0·0000, d
P=0·0000. (b) Comparison between 1996 and 2006 within each age range: a
P=0·0002, b
P=0·0019, c
P=0·0000, d
P=0·0000, e
P=0·0199, f
P=0·0000, g
P=0·0000, h
P=0·0179, i
P=0·0000
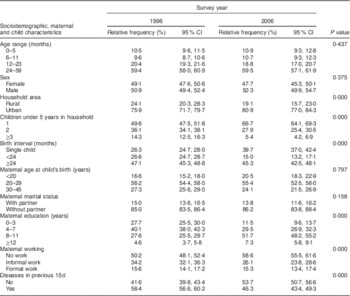
The description of sociodemographic, maternal and child health characteristics contributed to explaining the context in which DP were investigated (Table 2). The number of children in each age range was similar in both survey years. These age ranges represented specific characteristics regarding breast-feeding and food consumption (Table 2). The homogeneity of age range distribution in both surveys allowed us to interpret some observed changes as real changes in DP between 1996 and 2006. At the 10-year interval, the proportion of children living in urban areas had increased by 6·2 %, the number of households with only one child under 5 years had increased by 25·6 % and the birth interval of less than 24 months had decreased to 15·0 %. The profile of maternal education changed significantly, especially in the category of 8–11 years of schooling which increased by 46·6 % between surveys. The percentage of mothers who did not work increased by 14·3 %, while informal work decreased and formal work remained stable. The presence of at least one of the three diseases (cough, fever and diarrhoea) decreased by 20·7 % during the 10-year period.
Relative frequency and 95 % CI of sociodemographic, maternal and child characteristics of children under 5 years of age in Brazil. Brazilian Demographic and Health Surveys, 1996–1997 and 2006–2007
The effects of individual- and contextual-level characteristics are described in Table 3. DP1, DP2 and DP3 increased in 2006 and DP4 decreased. DP1 and DP2 increased within the age range and DP3 and DP4 decreased. DP1 was negatively associated with more children under 5 years in the household and positively associated with maternal age, schooling and wealth. DP2 was negatively associated with maternal age and wealth and was more frequent in rural areas. DP4 was negatively associated with wealth, maternal age and rural area.
Effects of sociodemographic, maternal and child characteristics in multilevel model over the four more prevalent dietary patterns (DP) of children under 5 years of age in Brazil. Brazilian Demographic Health Surveys, 1996–1997 and 2006–2007
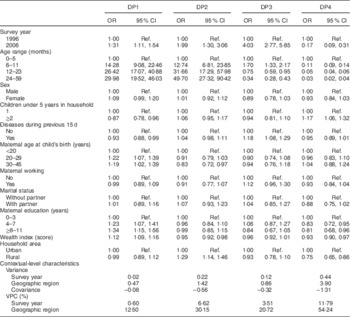
Ref., reference category; VPC, variance-partitioned coefficient.
We observed some clustering in DP of Brazilian children, mainly for DP2 and DP4. DP1 was homogeneously distributed within each geographic region in both survey years. For DP2, 6·6 % of total variance of the model was attributable to change of survey year and 30·2 % to geographic region. For DP4, 11·8 % of total variance of the model was attributable to change of survey year and 54·2 % to geographic region (Table 3). The negative sign of the covariance matrix at contextual level (Table 3) means that there is a lower gradient of survey year in the prevalence of DP in geographic regions where the prevalence of DP is high. The caterpillar plots illustrate where the variance of prevalence of DP was higher or lower than the mean of all geographic regions (see online supplementary material, Supplemental Fig. 1). Overall, two blocks of regions had similar conditions: North–Northeast and South–Midwest. We provide a summary of the main sociodemographic, health services coverage and breast-feeding indicators by survey year and geographic region in the supplementary material (Supplemental Tables 1 and 2).
Discussion
The present study identified four DP in the first years of life in Brazil. DP1 can be considered the most complete and closest to WHO recommendations, mainly for children over 8 months. One negative aspect was the weak loading of breast milk in this pattern (not shown in Table 1). This DP was more prevalent for children over 24 months in both years (1996, 2006) and the composition was similar to the ‘healthy pattern’ described previously( Reference Grieger, Scott and Cobiac 7 ). DP2 can be considered a transition pattern because it comprised semi-solid and solid foods and was more prevalent after 12 months, especially in 2006. DP1 and DP2 were the most prevalent DP after 12 months in 2006. We considered a positive change to have occurred since 1996 because these patterns comprised more diverse and solid foods that are recommended for this age range. DP3 can be considered a transition DP from under to over 6 months because it comprised liquid and semi-solid foods. DP4 was the most prevalent DP for children under 6 months, showing a low level of breast milk consumption in this age range for both years. In 1996, this pattern was clearly evident in children in all age ranges. The negative aspect in DP trends was the increase in DP2 for children under 6 months. However, if children are not exclusively breast-fed, we recommend that the kind of foods that comprise DP2 be offered. Regarding temporal trends of DP, we suggest that DP3 – more frequent in 2006 – replaced DP4 – which was more frequent in 1996. We highlight this as a positive change because DP3 comprises solid foods that are considered closer to the international recommendations for this age range. DP4 comprises mainly milk and formulas.
The pattern of DP1 was explained mainly by individual characteristics and showed low variability between survey years. This DP has probably been followed by a particular type of family for generations, independently of time. Prevalence was clustered for DP2, DP3 and DP4 and the variance of DP4 in the North and Northeast was higher than the South and Midwest. These regions showed the highest prevalence for early initiation of breast-feeding for both survey years (see online supplementary material, Supplemental Table 1) and showed the lowest prevalence for health-service coverage and the lowest means for socio-economic indicators. The Baby-Friendly Hospital Initiative was first implemented in the North and Northeast because of the higher mortality rates, which could explain the breast-feeding status( Reference Venancio, Saldiva and Escuder 24 ). Another relevant aspect was the increase in antenatal care visits (more than seven) in the North and Northeast between 1996 and 2006. In this period, the implementation of Family Health Program teams was expanded. These teams offer basic health-care services, mainly for poor families, and have contributed to a decrease in inequality among geographic regions( Reference Victora, Aquino and do Carmo Leal 25 ). In our study, it was not possible to include other characteristics or indicators to explain the differences among geographic regions in the analysis. However, in the supplementary material (Supplemental Tables 1 and 2) we show a characterization of the social indicators and health-service coverage in each geographic region. This information is important for understanding the disparities in public health services and breast-feeding practices between Brazilian geographic regions. Our results indicate the relevance of including social indicators to represent the contextual situation and indicating regional characteristics to explain the differences found.
The main individual characteristics associated positively or negatively with DP were: age (children), maternal education, wealth index, prevalence of diseases in the previous 15 d and maternal age. The OR values were very high for age range in DP1 and DP2. One possible explanation was the very low prevalence of both DP in the base category (children under 6 months). The presence of only one child under 5 years in the household was a protector for DP1. It is likely that women with a higher wealth index and education level will only have one such child in the household. DP4 showed an opposite behaviour regarding the number of children in the household. Its prevalence was higher for more than one child under 5 years in the household and lower wealth index scores.
To describe DP trends across age range, we used PCA including all children and then attributed the most prevalent DP for specific age ranges. This is the first time, to our knowledge, that food intake from both BDHS (1996, 2006) has been analysed together. It was possible to describe and to assess the DP behaviour in the whole age spectrum (0 to 5 years) and their trends over a decade (the gap between the two BDHS). These results allowed us to describe the main characteristics of dietary intake in this time period. The use of DP as a binary variable instead of as continuous scores, as traditionally applied, allowed us to define the most prevalent DP by age range, by survey year and by associated characteristics. These data highlight the diversity of individual and contextual characteristics that are associated with DP. The socio-economic indicators improved during the 10-year period, but we still observed differences among geographic regions.
Traditionally, dietary trend analysis across age ranges is carried out in prospective studies including birth cohorts, using different PCA models for each specific age. However, we chose to use only one PCA model to represent the DP for a specific age and to capture the dietary changes due to growth( Reference Northstone and Emmett 26 ).
In the prospective studies( Reference Gatica, Barros and Madruga 6 , Reference Smithers, Brazionis and Golley 10 , Reference Bell, Golley and Daniels 11 , Reference Northstone and Emmett 26 , Reference Wen, Kong and Eiden 27 ), DP trends were characterized in two, three and four different ages across childhood. The main results were: (i) for children under 12 months, breast milk showed a positive or negative loading with DP, the number of foods correlated with this pattern was lower, featured dietary monotony and the DP was positively associated with maternal education and wealth index; (ii) the number and type of DP identified in each specific age were the same, except in the study developed in Pelotas, Brazil( Reference Gatica, Barros and Madruga 6 ). In this study of older children (48 v. 12 and 24 months) a further DP was identified (6 v. 5 DP); and (iii) the DP labelled ‘healthy’ or ‘guidelines’ were positively associated with breast milk, maternal education and highest quintile of wealth. The number of DP identified varied between three and five, independently of the food list in the FFQ and 24 h recall. One possible explanation for the similar number of DP could be the reduced variety of food included in the childhood diet. Additionally, all these studies applied the same criteria for DP extraction such as scree plot and loadings higher than 0·3 or lower than −0·3.
The main difference between our study and previous research relates to the DP composition for children under 6 months. In most of the studies, the DP specifically for children under 6 months comprised breast milk (positive loading). Two possible hypotheses for the absence of breast milk (positive loading) in all DP are the lower prevalence of breast-feeding in 1996 and the lower percentage of children under 6 months in our sample (10 %). The prevalence of breast-feeding among children under 6 months and from 6 to 12 months increased from 1996 to 2006 (data not shown), as did exclusive breast-feeding in children under 6 months. However, since we decided to join two data sets to analyse the transition between them, we lost the effect of the increase in breast-feeding prevalence between these periods.
In our present study, we used an eigenvector (loading) cut-off equal to 0·2, which is considered lower than those adopted in other studies. This was to amplify the data exploration because our database comprised only fifteen foods. In addition, although lower eigenvectors were less representative of DP, they help to clarify the complexity of dietary intake and all aspects of this behaviour. We observed cross-loading among dietary patterns, but the loadings were always higher in one of the dietary patterns and assumed different importance in each dietary pattern. Additionally, the loading sign (positive or negative) expresses different meaning in dietary patterns.
We highlight three main limitations to our study. The first is related to data restriction in the questionnaires. In 2006 the following foods were added to the questionnaire: rice, beans, bread, fried foods, sugary foods, soda, cookies and snacks. It was not possible to include these foods because it was essential we used the same food list as in 1996 to compare the transition of DP in both years. It was also not possible to estimate if these fatty and sugary foods (processed foods) had been introduced in DP since 1996. Other relevant variables that could be associated with DP, such as maternal BMI, birth size, tobacco use, pacifier and feeding bottle use, were not available in either survey questionnaire. The second limitation is related to DP and was a consequence of the first limitation. The database was restricted in the number of foods it included and the DP could be closer to those of 1996. The third is the absence of an available public data set about the promotion, support and protection of breast-feeding programmes developed in Brazil since 1981 to use in the multilevel analysis( Reference Rollins, Bhandari and Hajeebhoy 28 ). Although there has been an important evolution in breast-feeding duration and prevalence, there are no indicators to quantify the effects of each of the programmes on infant and young child feeding.
Another important consideration is the percentage of children within each age range. The samples from the DHS are designed to achieve a balanced proportion of children across a 6-month range from 0 to 59 months of life. To explore the differences caused by the effect of different size of age range in our study, we have stratified results by age range and the variable ‘age’ was used in the description of dietary patterns and as an independent variable in multilevel models.
The analysis of DP distribution according to sociodemographic characteristics and temporal trends is relevant to direct intervention actions and to evaluate the externality of implemented public health policies. Our results indicate the requirement for broad, solid and effective public policies on feeding practices for Brazilian infants and the importance of monitoring and evaluating the impact of actions.
Acknowledgements
Financial support: This research received no specific grant from any funding agency in the public, commercial or not-for-profit sectors. Conflict of interest: None. Authorship: A.E.M.R. configured the data sets, conceived and designed the study, carried out the statistical analysis, wrote and reviewed the final version of the manuscript; W.L.C. conceived and designed the study, carried out statistical analysis, and reviewed the final version of the manuscript. Ethics of human subject participation: This study was approved by the Ethical Research Committee of the Public Health School, University of São Paulo (protocol number 2336).
Supplementary Material
To view supplementary material for this article, please visit https://doi.org/10.1017/S1368980017001938