


I. Introduction
Consider a prospective wine buyer staring down the wine aisle of a supermarket, faced with a seemingly endless variety of options. What information can they use to pick a wine that they will enjoy when tasting is not an option?
Numerous factors go into making a good wine, from the terroir in which it was produced to the vinification methods employed by the winemaker. Producers in certain wine regions, such as Bordeaux, go to great lengths to ensure a recognized standard of quality. Even then, weather conditions cause severe yearly fluctuations to the health and quality of the grapes that were used to make the wine and that are, therefore, important determinants of wine quality. Keeping track and integrating all this information is a daunting task for the casual wine consumer.
Traditionally, the opinions of influential wine critics such as Robert Parker and Jancis Robinson (JR) have provided a key source of information for prospective wine buyers. But relying on these reviews is not always easy, as the few well-known critics tend to be selective about the wines they taste. Further, many critics have monetized their reviews by running subscription-only websites. Thanks to the advent of the Internet, prospective wine buyers can now tap into a new source of social information to help them navigate this inference problem: crowdsourced ratings from large communities of wine consumers on platforms such as Vivino and Cellartracker.
Our goal in this paper is to assess the validity of crowdsourced ratings in the domain of wine. To this end, we first examine the correlations between the averaged crowdsourced ratings of amateur Vivino users and the ratings of several professional critics. Second, we evaluate how these ratings reflect weather fluctuations over recent years.
In matters of taste, the quality of a judge’s opinion is often proxied by its similarity to that of other judges (e.g., Ashton, Reference Ashton2012). However, relatively little is known about how crowdsourced ratings compare with the ratings of professional wine critics. We construct and analyze a novel and rich dataset consisting of Vivino ratings for a portfolio of red wines from Bordeaux. We then match our dataset with the ratings of eight professional critics and perform correlation analysis, treating Vivino as an independent critic.
Recognizing the limitations of using consensus as the only metric for the quality of information, we complement our analysis by assessing whether crowdsourced ratings mirror a set of objective markers of wine quality. Namely, we investigate the relation between Vivino ratings and the weather conditions that were present during the year that grapes were grown and harvested (i.e., the wine’s “vintage”). We do this by collecting climatic information from a local weather station and exploring whether the Vivino ratings are responsive to variation in weather conditions known to affect wine production.
Our correlation analysis suggests substantial consensus between averaged Vivino ratings and professional critics’ judgments. Moreover, regressing averaged ratings on local weather conditions shows that both amateur and professional ratings respond to the impact of meteorological conditions in similar ways and in line with findings from viticulture research. We conclude by identifying two promising research directions and take first steps toward addressing them.
First, we find that despite the considerable agreement between crowdsourced and professional ratings, there are also systematic discrepancies. Our exploratory analysis suggests that these are partly due to differences in scope: Amateurs’ ratings emphasize the immediate pleasure of drinking a wine, whereas professional critics focus more on the potential of a wine once it has matured.
Second, we demonstrate that crowdsourced ratings can yield important insights regarding the impact of climate change on wine quality and consumption. Our analysis shows that prolonged high temperatures have a detrimental effect on the subjective quality ratings of both amateurs and professionals. This result suggests that the hitherto positive relationship in the northern hemisphere between higher temperatures and wine quality may already have been disrupted.
Overall, our analysis suggests that crowdsourced ratings are a valid source of information, yielding useful insights for consumers and producers alike.
II. Background and motivation
A. Crowdsourced ratings
Wine is a prime example of an “experience good”—its quality is learned only after consumption (Nelson, Reference Nelson1970). In principle, consumers can use various observable cues about wines—including price, label design, and awards won in international competitions—to overcome this deficit and infer quality (Drichoutis et al., Reference Drichoutis, Klonaris and Papoutsi2017). However, these heuristic strategies are not always reliable. For example, in a meta-analytic study, Oczkowski and Doucouliagos (Reference Oczkowski and Doucouliagos2015) found only a modest correlation between prices and subjective reports of quality (the weighted average of all estimates was 0.30), casting doubt on the dictum that “you get what you pay for”—at least for wine. Moreover, Hodgson (Reference Hodgson2008) examined judge reliability at a major U.S. wine competition and found that only about 10% of judges were able to consistently replicate their score within a single medal group. Thus, medals and prizes seem unreliable as a source of information.
In recent years, the Internet has offered prospective buyers a new source of social information that can be leveraged to inform their choice: crowdsourced online ratings (e.g., Chevalier and Mayzlin, Reference Chevalier and Mayzlin2006). Relying on the opinion of a large, relatively inexperienced crowd has shown promising results in domains such as economic forecasting (Jame et al., Reference Jame, Johnston, Markov and Wolfe2016), funding of entrepreneurial endeavors (Mollick, Reference Mollick2014), and medical diagnostics (Kurvers et al., Reference Kurvers, Nuzzolese, Russo, Barabucci, Herzog and Trianni2023), to name just a few. To a large extent, the success of crowdsourcing can be attributed to the “wisdom of the crowds.” According to this principle, the judgment errors of different individuals tend to cancel each other out when their judgments are aggregated, resulting in an average error that tends to be smaller than that of a randomly chosen individual (see Surowiecki, Reference Surowiecki2005, for a popular book summarizing the benefits of this principle; Analytis et al., Reference Analytis, Barkoczi and Herzog2018; Müller-Trede et al., Reference Müller-Trede, Choshen-Hillel, Barneron and Yaniv2018, for applications in matters of taste).
In the world of wine, freely available crowdsourcing apps such as Vivino, CellarTracker, and Wine-Searcher have extended the task of wine evaluation to a large and heterogeneous network of amateur wine enthusiasts, potentially creating the conditions for crowd wisdom to be accrued. However, the quality of information in aggregated ratings can be corroded by social influence (e.g., Le Mens et al., Reference Le Mens, Kov´acs, Avrahami and Kareev2018; Muchnik et al., Reference Muchnik, Aral and Taylor2013) or strategic manipulation (Luca and Zervas, Reference Luca and Zervas2016). Assessing the quality and properties of crowdsourced online ratings remains an open scientific question in numerous consumer domains, including wine.
In this study, we create a novel and rich dataset consisting of individual wine reviews from Vivino and analyze how they relate to those ratings from professional critics as well as how they respond to a set of weather variables. Founded in 2010, Vivino is—according to its webpage—the world’s most downloaded wine app, featuring millions of reviews of wines from around the world. We focus on a portfolio of red wines from Bordeaux and track their Vivino ratings over time. Each wine is observed over 13 vintages, from the 2004 to the 2016 vintage. Critics’ scores are obtained from en primeur events, at which critics and merchants are invited to taste wines from the barrel when they are just 6–8 months old.
B. Consensus and expertise
Ideally, the validity of judgments would be assessed on the basis of a set of objective criteria. In matters of subjective taste, however, such objectivity is hard to come by and researchers usually rely on alternative benchmarks. Consensus—typically measured by the degree to which judgments from experts correlate with each other—is arguably the most common such benchmark (Cicchetti, Reference Cicchetti2004, Ashton, Reference Ashton2012, Reference Ashton2013).Footnote 1
Even though consensus between experts has received considerable attention by the literature, relatively little is known regarding the consensus between judgments from expert critics and crowdsourced amateur ones. To our knowledge, there are three previous studies that focus on this relation. Oczkowski and Pawsey (Reference Oczkowski and Pawsey2019) and Bazen et al. (Reference Bazen, Cardebat and Dubois2023) compared the impact of crowdsourced versus professional ratings on wine prices, while Gokcekus et al. (Reference Gokcekus, Hewstone, Cakal, Ashenfelter, Gergaud, Storchmann and Ziemba2015) focused on their relative influence on consumers. All three investigations seem to converge toward the conclusion that crowdsourced data are becoming increasingly influential. In this study, we make a more direct comparison between crowdsourced and professional ratings and shed light on the agreement between the two. Our dataset includes a sizeable overlap of wines reviewed by both Vivino amateurs and professional critics, making it particularly suitable for this type of analysis.
Despite its usefulness and ease of application, using consensus as the sole arbiter for evaluating the validity of a judgment has limitations. For example, in certain occasions the majority opinion has been shown to be systematically wrong (Galesic et al., Reference Galesic, Barkoczi and Katsikopoulos2018; Prelec et al., Reference Prelec, Seung and McCoy2017). It has also been argued that disagreement can be a catalyst for enhancing knowledge. In the domain of peer-reviewed publications, for instance, editors sometimes select reviewers for their complementary perspectives (Weiss and Shanteau, Reference Weiss, Shanteau, Smith, Shanteau and Johnson2004). In that respect, there is often a trade-off between validity (as proxied by consensus) and diversity of information (see also Broomell and Budescu, Reference Broomell and Budescu2009).
Therefore, we complement our analysis with an alternative strategy for evaluating the validity of these crowdsourced judgments, taking advantage of a latent relationship between the quality of a wine and the weather conditions during the year of the harvest (i.e., the wine’s “vintage”). Although the role of subjectivity in matters of taste cannot be overemphasized, some of the physical processes determining the quality of grapes can be objectively observed and measured. We thus assess the extent to which averaged Vivino ratings are sensitive to aspects of weather variability known to affect grape quality (i.e., temperature and rainfall at different points in the season). We further compare their responsiveness with that of professional critics.
The idea that judgments about quality contain both objective and subjective components is not new. Cicchetti (Reference Cicchetti1991) drew attention to this duality in assessing the reliability of peer reviews, pointing out that the attributes for evaluating manuscripts “can be derived from either objective judgments (e.g., experimental design) or subjective ones (e.g., importance).” In the domain of wine, the notion that subjective ratings are partly governed by objective markers is summarized by Cardebat et al. (Reference Cardebat, Figuet and Paroissien2014), who assumed that, besides subjective tastes, wine judgments have an objective component that is driven by the fundamentals of wine production, such as the quality of the soil, the producers’ skills, and—crucially to our analysis—weather conditions.
C. Weather and wine quality
Whether a wine’s quality can be assessed on the sole basis of objectively observable parameters such as the weather conditions has been a key question in the literature for the past 40 years. Ashenfelter’s seminal work in the 1980s and 1990s provided a highly successful econometric model for assessing the quality of Bordeaux vintages and predicting their prices in auctions based on the wine’s age and the weather conditions during the growing season (see Ashenfelter, Reference Ashenfelter2008b, for an updated version). Often referred to as the “Bordeaux equation,” this model regresses a vintage-level price index (obtained from auctions of a specific wine portfolio) onto a set of weather variables and the wine’s age. The model has proven surprisingly effective at assessing the quality of Bordeaux vintages and predicting the prices of mature wines (Storchmann, Reference Storchmann2012).
Inspired by Ashenfelter’s Bordeaux equation, we evaluate the responsiveness of averaged Vivino ratings to the same weather variables, namely, average temperatures and total rainfall during the preseason and the growing season, as measured by the local weather station at Merignac.
The wine region of Bordeaux is located in southwestern France, between 44.5° and 45.5°N. In such northerly latitudes, warmer growing seasons are expected to lead to higher fruit quality, which translates into better quality wine. Field evidence has thus far indeed confirmed that higher temperatures are beneficial for wine quality—often proxied by wine prices or winery revenue—in the relatively cooler climes of the northern hemisphere (Ashenfelter and Storchmann, Reference Ashenfelter and Storchmann2010b; Jones et al., Reference Jones, White, Cooper and Storchmann2005). Even though global warming is likely to eventually harm the quality of grapes, there is no evidence for the detriments of excessive heat in wine regions of the northern hemisphere, with (Ashenfelter and Storchmann, Reference Ashenfelter and Storchmann2010a) making a call for additional research on that issue.
With respect to precipitation, there is a consensus that rain during the last stage of the growing season, most notably in August, is detrimental for the health of grapes. Humidity during this sensitive period for berries can raise mildew pressure, which can cause rot from the inside out on thin-skinned tight clustered varietals (Matthews et al., Reference Matthews, Anderson and Schult1987; Poni et al., Reference Poni, Lakso, Turner and Melious1993). There is less consensus regarding the effect of rain during the preseason (October–March), with some studies reporting on a positive effect (Ashenfelter, Reference Ashenfelter2008b), while others find it to be not significant or even negative (Ashenfelter and Storchmann, Reference Ashenfelter and Storchmann2010b).
III. Methods and results
For the amateur ratings, we collect our data from Vivino’s public data for a portfolio of red wines from Bordeaux. As our focus was to examine the relationship between amateur and professional tastes, we compiled this portfolio based on the wines that feature in “Bordoverview” (https://www.bordoverview.com/)—a website reporting on the ratings from various professional critics provided at en primeur events for all Grand Crus and several “second wines” of Bordeaux. We restrict the dataset to those wines-labels for which we can find ratings for every year between 2004 and 2016.Footnote 2 Our initial dataset consists of all Vivino ratings for these wines that were available at the time of our data collection (July 2020). This amounts to 79,648 ratings for a total of 780 wines: 60 Chateaux observed over 13 consecutive years.Footnote 3
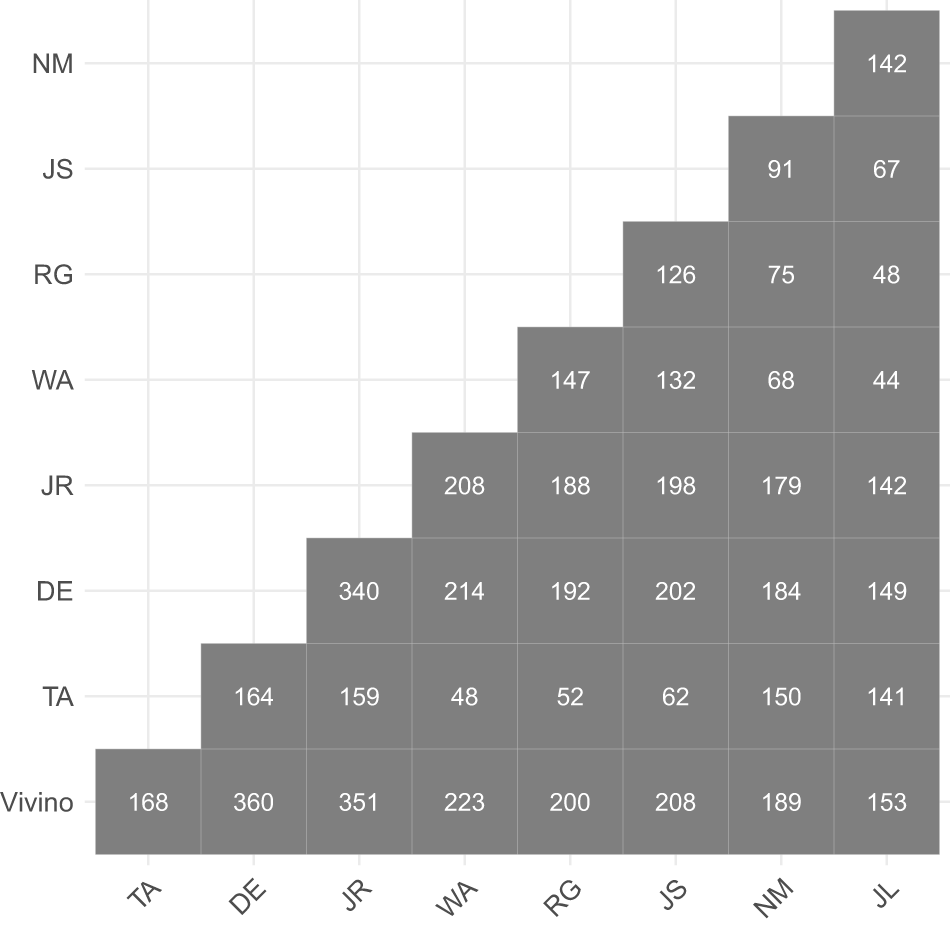
Next, we match this dataset with the ratings from professional critics that were available in Bordoverview. Specifically, we focus on the ratings provided by the following six individual critics: James Suckling, Jancis Robinson, Jeff Leve, Neal Martin, Rene Gabriel, Tim Atkin, as well as Decanter and the Wine Advocate, two outlets summarizing the ratings of small groups of individual critics. We keep only wines that were reviewed by at least three of the aforementioned professional critics. The resulting matched dataset consists of 39,035 ratings for 371 wines from 41 chateaux. Older and younger vintages are equally represented through this matching process. Specifically, the number of observations per vintage from 2004 to 2016 is: [20, 23, 31, 26, 26, 30, 34, 34, 35, 29, 16, 32, 35], respectively. The maximum overlap is between Vivino and Decanter (360 matches); the median overlap between Vivino and a critic is 200 wine ratings. Figure A1, in the Appendix, provides a summary of the number of wines per critic that we were able to match to a Vivino average.
A. Consensus analysis
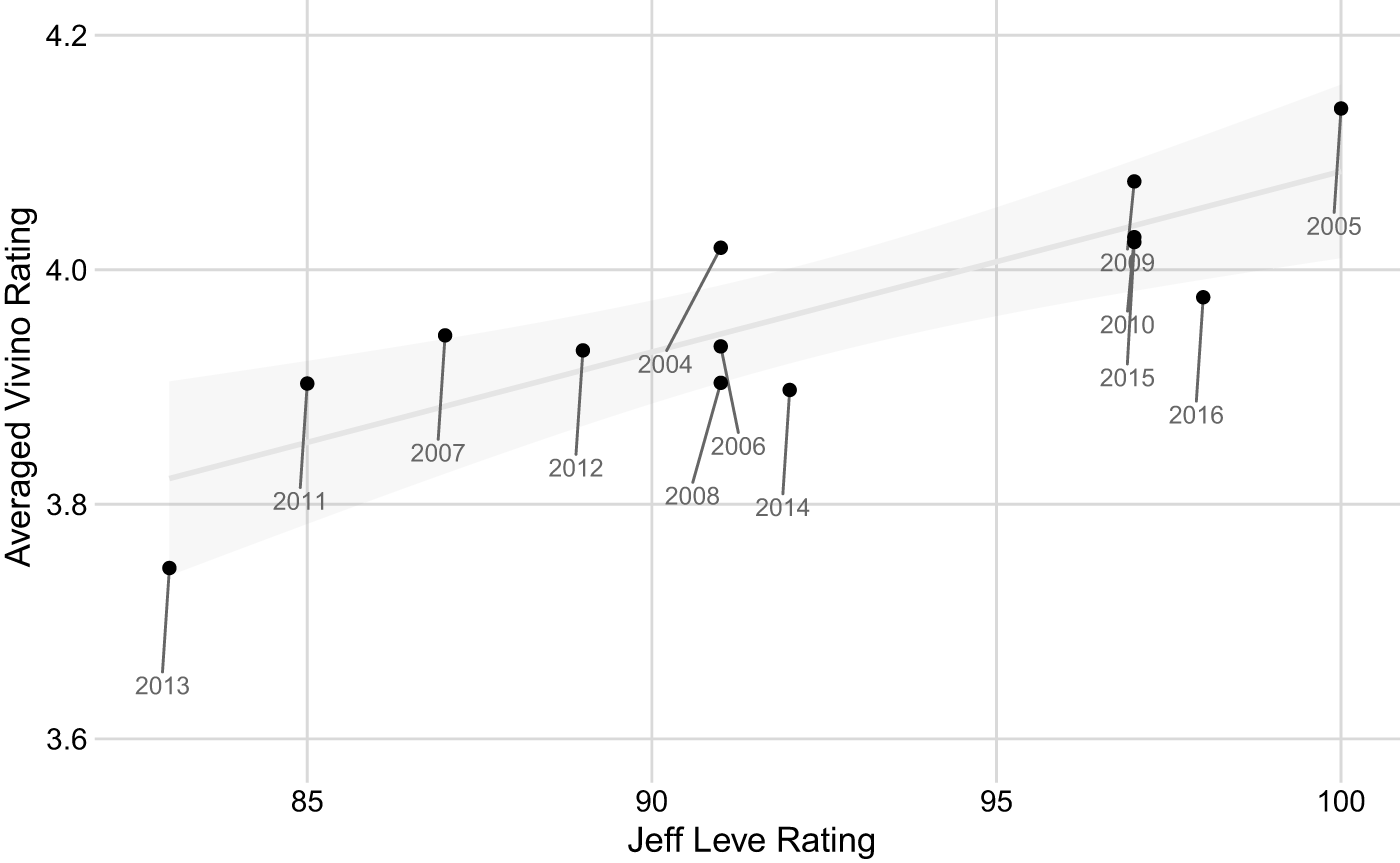
We begin with a macroscopic view of the consensus between Vivino amateurs and those of Jeff Leve, an established professional critic specializing in the Bordeaux wine region. Figure 1 compares Vivino ratings—averaged at the vintage level—with Jeff Leve’s ratings. We collected Jeff Leve’s vintage-level ratings from his websiteFootnote 4. His vintage assessments are not based on the averages of individual wines; instead, they represent his general assessment of the wine quality for a specific year.
Vintage-level correlation between Vivino and Jeff Leve ratings.

We found substantial resemblance between the two. For example, both sources agreed that the 2013 vintage was the worst in recent years and that the 2005 vintage was the best. Both of these claims are widely shared within the wine community. For instance, St´ephane Derenoncourt, a French vigneron working as a consultant for numerous estates in Bordeaux, described producing the 2013 vintage as a “war against nature.” In contrast, the 2005 vintage has been described by some wine journalists as “majestic” (Asimov, Reference Asimov2021).
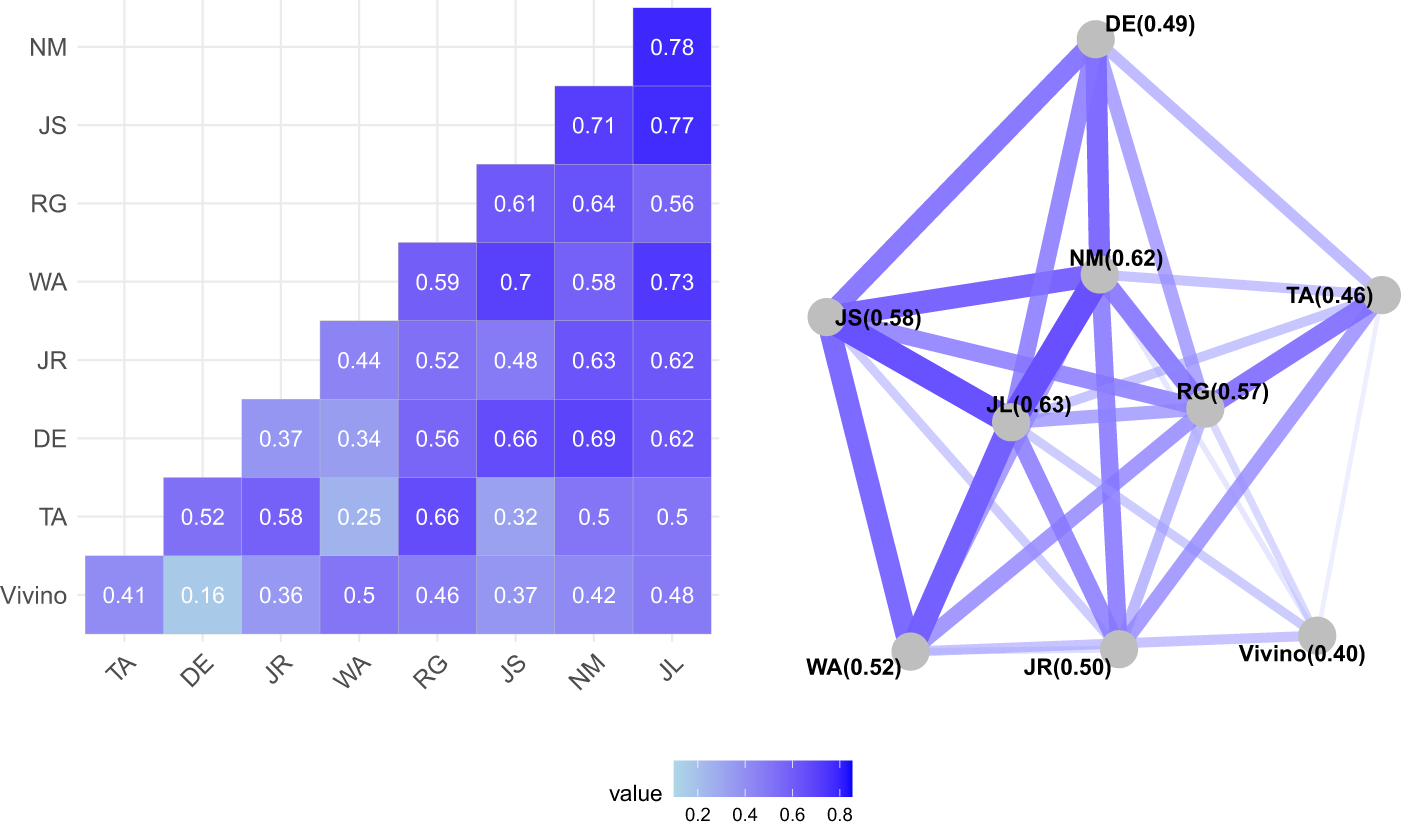
Next, we focus on the relationship between the tastes of Vivino amateurs and professional critics at the level of individual wines. Here, we treat averaged Vivino ratings as an independent critic.Footnote 5 Figure 2 reports the two-way Pearson’s correlations (r) across pairs of critics (left) as well as the average correlation ( $\overline r $) calculated by taking the arithmetic mean (right).
Correlations between wine raters.

Two things are apparent from Figure 2. First, Vivino average ratings correlated substantially with the ratings of most professional critics, with a total correlation average of 0.40. Some critics, such as the Wine Advocate (r = 0.50) and Jeff Leve (r = 0.48), seem to be more in tune with the wine-loving crowd reviewing at Vivino than others, such as Decanter (r = 0.16), Jancis Robinson (r=0.36), or James Suckling (r = 0.37).
Second, professional critics’ ratings still correlate more strongly with each other than with Vivino. Jeff Leve exhibits the overall highest average correlation ( $\overline r $ = 0.63), followed by Neal Martin ( $\overline r $ = 0.62), while Tim Atkin and Decamter have the lowest ( $\overline r $ = 0.46 and 0.49, respectively).
We return to these points in Section IV A, where we take a closer look at these systematic differences between amateurs’ and professionals’ ratings.
B. Responsiveness to weather conditions
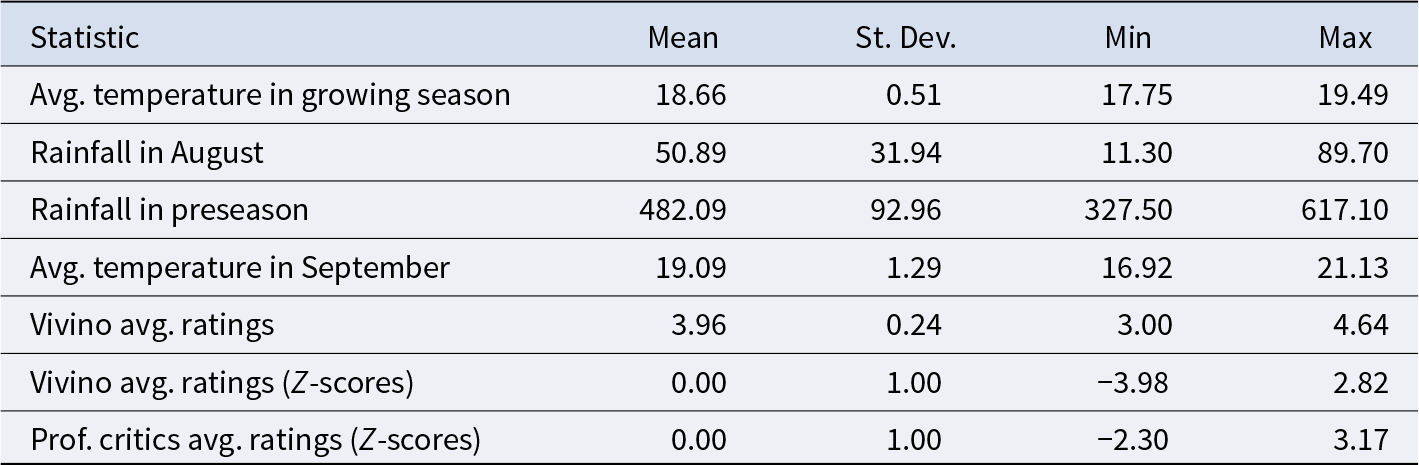
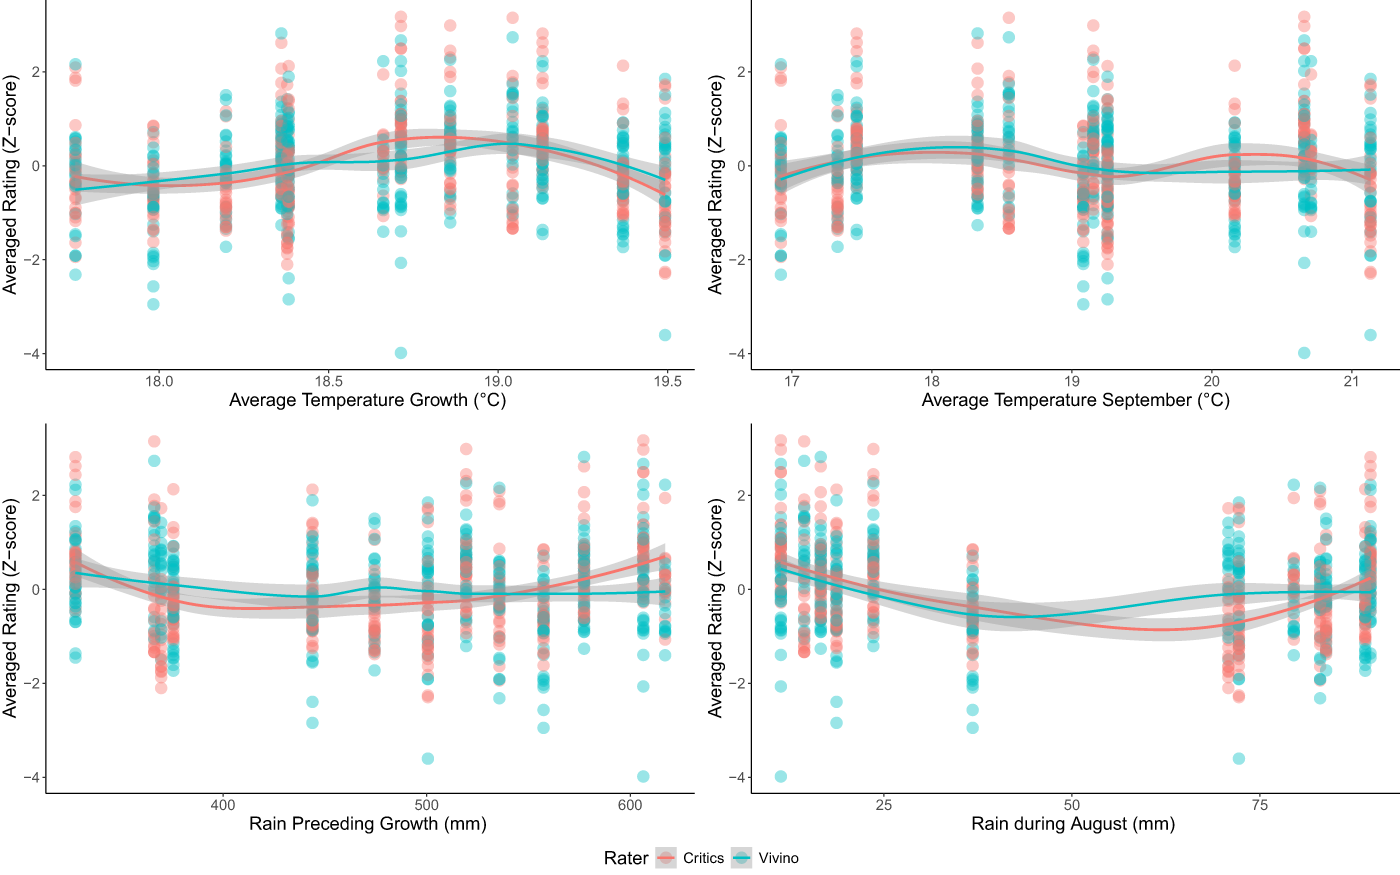
Here, we examine how averaged ratings from Vivino amateurs and professional critics reflect the weather conditions during a certain vintage. Inspired by Ashenfelter’s “Bordeaux equation” (Ashenfelter, Reference Ashenfelter2008b), we study the responsiveness of these ratings on average temperature over the growing season (April–August), the average temperature in September, total rainfall in the preseason (October–March), and total rainfall in August. We also include a time trend, an index variable tracking the vintages in our dataset (from 2004 to 2016), to see if there is a linear tendency of average ratings to grow or diminish over the years. Table A1 in the Appendix provides key summary statistics on the variables used in our ordinary least squares regression analysis, while Figure A2 plots the distribution of ratings (for Vivino and professional critics) against each weather variable.
For our regression analysis, we treat our dataset as panel data, where each chateau (cross-sectional dimension) is observed over subsequent vintages (temporal dimension). The dependent variable of the Vivino model is constructed by averaging at the level of the wine (i.e., a chateau in a given vintage) and then transforming these averages into Z-scores by subtracting the mean and dividing by the standard deviation. For the professional critics model, the process is the same but we add an additional step. Namely, we start by calculating Z-scores for each critic’s ratings before averaging those Z-scores over the dataset. The reason for this additional step is that each critic uses their own rating system and it would be impossible to aggregate otherwise.
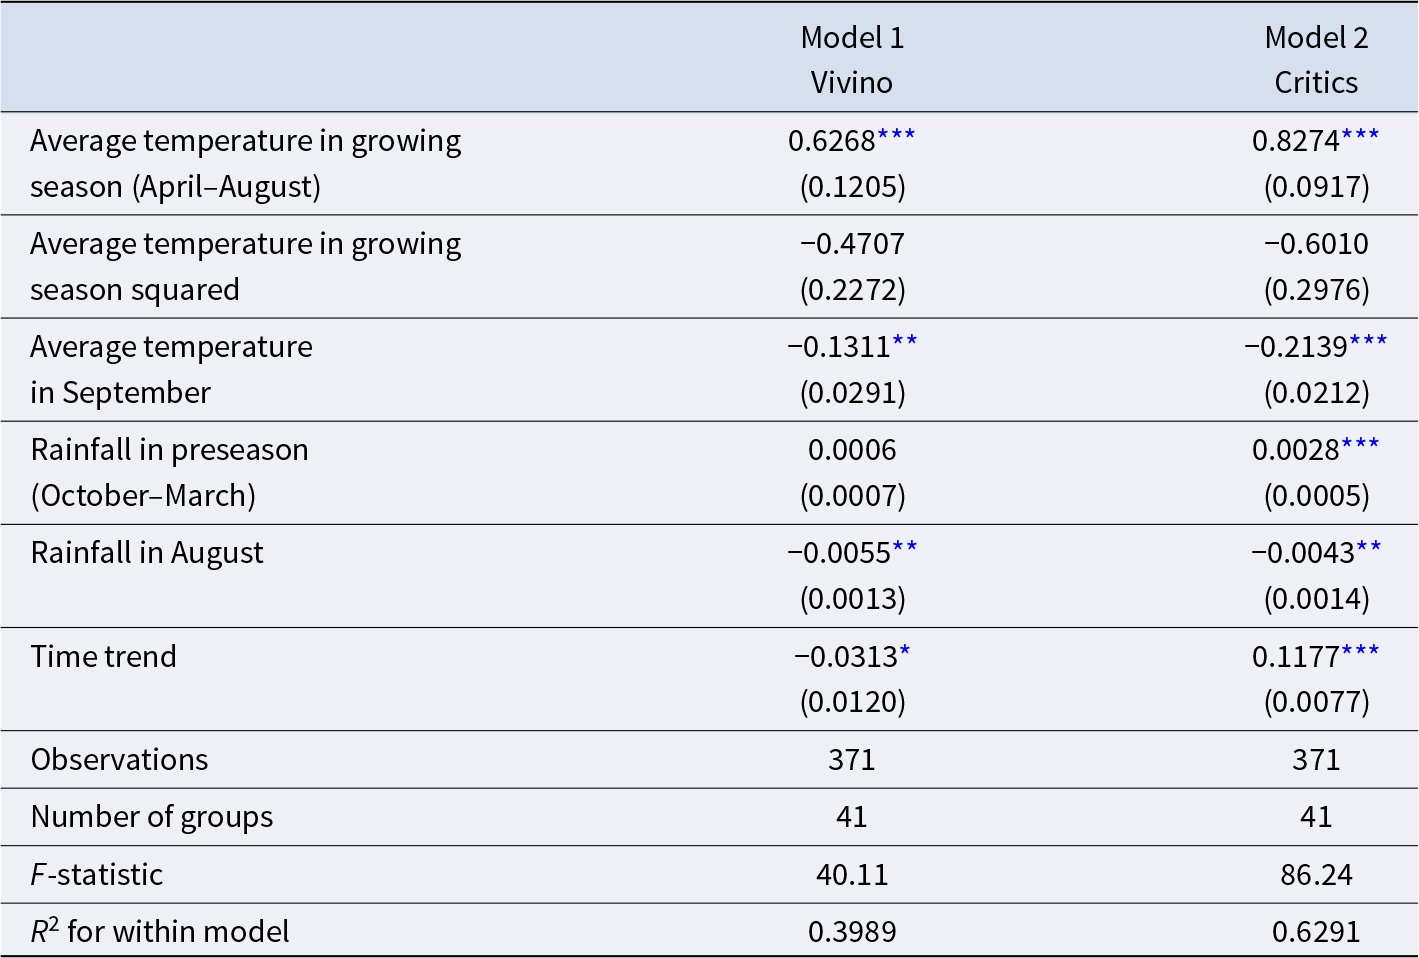
We implement a weighted least square multiple regression approachto examine how weather conditions affect perceived quality. Weights are proportional to the number of individual ratings from which each averaged rating was derived. The median number of ratings per averaged rating is 73 (IQR = 35, 136) for amateurs and 5 (IQR = 5, 6) for professionals. To account for the fact that the baseline quality of the wine can be different from one chateau to another, we use separate fixed effects for each chateau. However, as argued by Ashenfelter and Storchmann (Reference Ashenfelter and Storchmann2010b), we believe that—given the similarity of the wines planted in this region—the weather conditions can be expected to have similar effects across the wineries. We used Driscoll–Kray standard errors, which are robust to both cross-sectional (cross-chateaux) and temporal (cross-vintages) dependence. The results of our regression analysis are displayed in Table 1.Footnote 6
Determinants of wine ratings: Regressing ratings onto weather variables

Notes: The averaged, standard-normalized rating of a wine (Z-score) is regressed onto climate variables which have been centered to their mean. Model 1: Ratings from Vivino amateurs. Model 2: Ratings from professional critics. The regression models include fixed effects at the level of the chateau and weights proportional to the number of ratings included in the calculation of each average. Each wine in our data set is uniquely identified by a chateau and a vintage. Average temperatures are measured in °C. Rainfall is measured in mm of water accumulated over the entire period. Driscoll–Kray (vintage- and chateau-clustered) standard errors are in parentheses.
*** p < 0.001, **p < 0.01, *p < 0.05.
The signs of the coefficients of the weather variables tell a consistent story across both models. Higher average temperatures during the growing season have a beneficial impact on the subjective rating of wine quality for both amateurs and professionals.Footnote 7 However, the significant negative coefficient of the average temperature in September suggests that the effect can be detrimental when high temperatures extend deep into the growing season. We return to this point in Section IV B.
Amateurs and professionals also agreed on the impact of rain. Averaged ratings reacted positively to rain preceding growth but negatively to rain in August, when the grapes mature.
Although amateurs and experts are overall very much in agreement, there are two noticeable differences that warrant attention. First, the intensity of the responsiveness to weather conditions captured by the size of the coefficients differs, with experts’ ratings being more responsive. This might be in part due to differences in the variability of tastes within the two populations. The amateur crowd consists of thousands of raters, some of whom might have antithetical tastes, whereas experts’ tastes are more likely to be aligned. This asymmetric variation would also explain the discrepancy between the fit of these two models as captured by the R 2 statistic (R 2-within = 0.411 for Vivino amateurs; R 2-within = 0.6109 for professional critics). Second, the sign of the time trend suggests that amateurs and professionals have—on average—different attitudes toward younger vintages. Amateur tasters tend to rate more favorably older vintages, whereas the opposite is the case for professional critics. This point is further discussed in Section IV A, where we explore the underpinnings of this apparent difference in tastes between the two groups.
IV. Exploratory analysis and discussion
A. Differences between Vivino amateurs and professional critics
Our consensus analysis in Section III A revealed that Vivino ratings correlated substantially with those of professional critics. Besides the vintage-level agreement with Jeff Leve, the average correlation with professional critics was well within the range of those reported between critics in other studies (Ashton, Reference Ashton2012; Stuen et al., Reference Stuen, Miller and Stone2015) and even comparable with the consensus among experts in other domains, such as in clinical psychology (Ashton, Reference Ashton2012). However, it was lower than the average correlation among critics in our dataset as well as in other studies using en primeur data (Masset et al., Reference Masset, Weisskopf and Cossutta2015). What can account for the systematic discrepancy between amateurs and professionals?
To address this question, we followed a “lead” from the analysis in Section III B—which revealed antithetical views between amateurs and professionals with respect to attitudes toward younger vintages. One possible interpretation of this asymmetry is that the two crowds differ in the scope of their evaluation, with amateurs focusing on the immediate pleasure of consuming the product, but critics judging how wines will develop over time.
Many wines have aging potential, reflecting ongoing chemical processes that persist well after fermentation ends (Goode, Reference Goode2005), and would thus have improved had the consumer not stopped the maturation process by opening the bottle. This aging potential is particularly pronounced for red wines from Bordeaux, which are typically rich in tannins and may taste astringent and unpleasant if drunk at a young age.
This hypothesis can explain the negative time trend observed for amateurs (but not professionals) in the analysis in Table 1. More recent vintages have had less time to mature (as we only collected Vivino ratings up to 2016) and are therefore, keeping everything else constant, judged more harshly if assessed primarily based on their immediate quality.
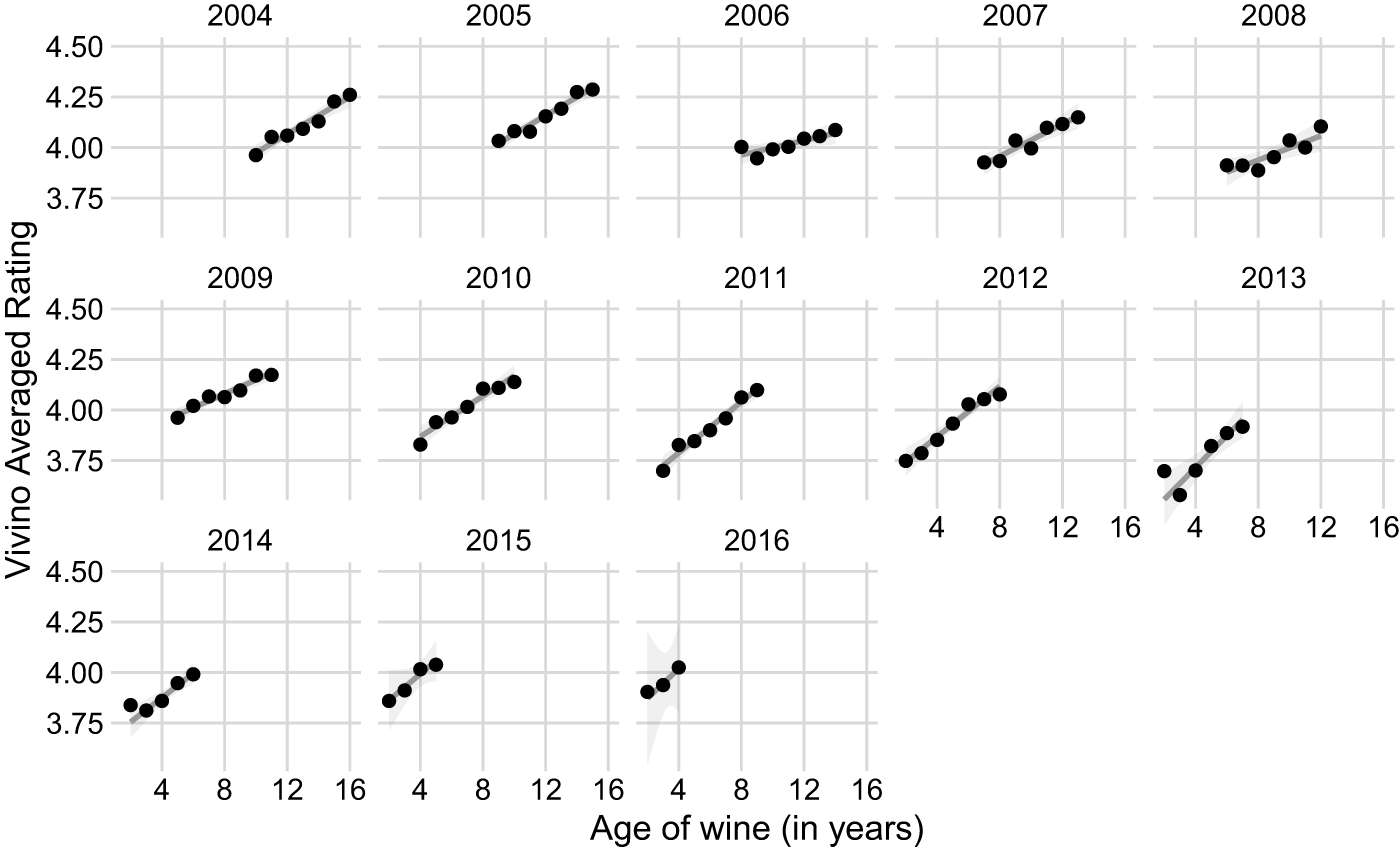
Figure 3 makes this last point clearer. It plots averaged Vivino ratings against the age of the vintage at the time it was consumed. The variable “Age” is calculated as the difference in years between the harvesting of the grapes and the posting of the review (M = 7.26, Med = 7, Q1 = 5, Q3 = 9). All 13 panels—each tracking this effect for a different vintage—show clear evidence for an upward slope, suggesting that reviews posted later in the wine’s maturation cycle tend to be more generous.
Vivino ratings by age of the vintage at the time consumed.

Table A2, in the Appendix, further illustrates this point. There, we repeat a version of the analysis reported in Table 1, but add the variable “Average Age” to the set of regressors. Verifying the visual impression of Figure 3, we find the age-coefficient to be significantly positive, suggesting that Vivino ratings are not fully accounting for the wine’s potential. In line with this interpretation is also the fact that the coefficient of the time trend is no longer negative after controlling for the age of the wine when the bottle was opened. This implies that Vivino users do not find the quality of younger vintages inferior, they just did not fully account for their potential when rating them prematurely.
Our dataset does not allow us to test the same effect for experts—we only have access to en primeur reviews given before the wines are bottled. However, we can refer to the Global Wine Score team (The Global Wine Score, 2017), which has conducted a similar analysis for experts, using re-notations that capture critics’ adjustments to their en primeur assessment in subsequent years. If critics did not account for the wine’s improvement with age, we would expect to see, on average, systematic positive adjustments. Instead, the report finds that the net adjustments, averaged across all wines and across all critics for each subsequent year, are either zero or slightly negative (though not statistically significantly so). This implies that critics on average account for a wine’s maturation potential in their en primeur assessments.
In the past, differences in the subjective evaluation of experience goods between amateurs and expert critics have been typically attributed to differences in taste (Holbrook, Reference Holbrook1999). In line with that perspective, some contributions have emphasized the role of different levels of experience in taste divergence (see Goldstein et al., Reference Goldstein, Almenberg, Dreber, Emerson, Herschkowitsch and Katz2008 for wine; McAuley and Leskovec, Reference McAuley, Leskovec, Schwabe, Almeida and Glaser2013 for beer). Our analysis suggests a new mechanism that can also account for part of this discrepancy—at least for red wine—namely, that the two crowds seem to differ in the scope of their evaluation.
Future research aiming to disentangle the underpinnings of this difference in tastes can yield important insights for the understanding of preferences, with pertinent applications to recommender systems. This research would need to control for additional factors, such as the different levels of experience of amateur raters in crowdsourcing platforms or the role of social influence—which may differ between amateurs and professional raters.
B. The impact of global warming on subjective ratings
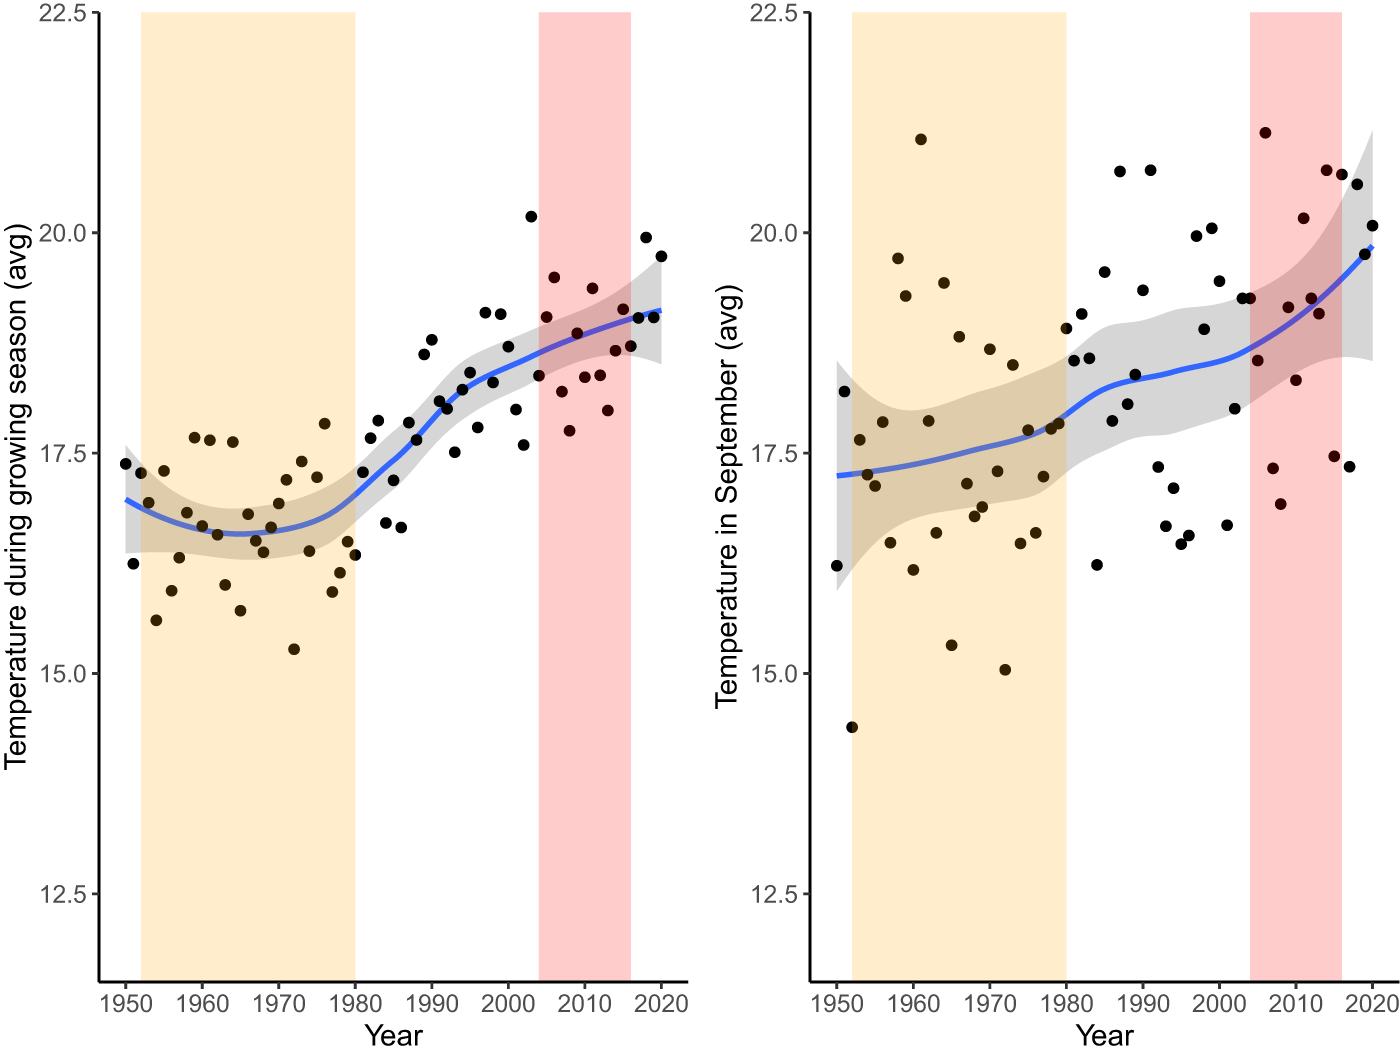
Our finding that higher temperatures in September are associated with lower ratings among both amateurs and professionals runs counter to previous findings for the northern hemisphere of a positive relationship between heat and wine quality (Jones and Davis, Reference Jones and Davis2000; Ashenfelter, Reference Ashenfelter2008b; Ashenfelter and Storchmann, Reference Ashenfelter and Storchmann2010b). However, most of the previous analyses have focused on time frames spanning several decades. For example, Ashenfelter’s analyses of the Bordeaux equation cover the period between 1952 and 1980. Average temperatures have been steadily rising worldwide over the past decades, and Bordeaux is no exception. Figure 4 tracks the evolution of average temperatures in Bordeaux/Merignac over the past 70 years. The average temperature has increased by 1.6°C since Ashenfelter’s seminal analysis: from 12.5°C (between 1952 and 1980) to 14.1°C (between 2004 and 2016).Footnote 8
Evolution of average temperatures in Bordeaux.

Excessively high temperatures can be detrimental to the quality of grapes as they have been found to inhibit certain biochemical pathways or physiological processes essential for the production of quality grapes (Deloire et al., Reference Deloire, Carbonneau, Wang and Ojeda2004). In extreme cases, such high temperatures can cause premature veraison, high grape mortality through abscission, enzyme inactivation, and partial or total failure of flavor ripening (Mullins et al., Reference Mullins, Bouquet and Williams1992). From this perspective, the negative coefficients for temperature in September can be interpreted as early evidence for the effects of increased temperatures due to global warming on wine quality. Although our analysis is restricted by the lifespan of the Vivino platform (since 2010), the longer such crowdsourcing platforms are in operation, the more light can be shed on the relation between weather, climate change, and wine appreciation.
V. Conclusion
Inferring the quality of a wine before tasting it has always challenged buyers. Freely available wine apps like Vivino democratize the production and consumption of information in the wine world, by making ratings from millions of wine-loving amateurs instantly accessible to consumers. But, how valid are these crowdsourced ratings and what can we learn from their insights?
We addressed these questions by creating and analyzing a rich new dataset of online Vivino reviews for a portfolio of red wines from Bordeaux. We assessed the validity of crowdsourced ratings based on two criteria: their consensus with the ratings of professional wine critics and their responsiveness to weather conditions known to affect wine quality. To this end, we matched our dataset with the reviews of professional critics and appended to it meteorological information collected from a nearby weather station.
We showed that Vivino ratings are overall consistent with those from professional critics. Not only is there broad agreement in vintage-level assessments but, crucially, the ratings also correlate substantially at the level of individual wines. Moreover, the amateurs’ response to weather variability is in line with that of professional wine critics. Nevertheless, the average correlation between Vivino and critics’ ratings is slightly lower than the correlations among critics themselves. Our exploratory analysis suggested that this discrepancy can be explained at least partly by differences in scope: While amateurs focus on immediate pleasure, professionals consider the wine’s potential once it has matured. An implication of this finding for a prospective wine consumer confronted with contradictory reviews from critics and amateurs is as follows: If their intention is to find a good bargain they can invest in for the future, then the critics’ rating might be a better guide than crowdsourced ratings. If, on the other hand, they are invited to a dinner party that night, then the average online rating of an app like Vivino might be more likely to help them make an impression.
Regressing averaged Vivino ratings onto yearly weather conditions provided additional evidence for the validity of these crowdsourced ratings. Averaged ratings from both sources were responsive to weather conditions known to affect wine production. Our analysis also suggests that global warming may already be having a discernible negative effect on wine quality, with ratings from professionals and amateurs alike being negatively associated with higher temperatures late in the growing season. While it has been predicted that the positive relationship between higher temperatures and wine quality in the northern hemisphere is eventually bound to “backfire” due to climate change, this is—to the best of our knowledge—the first empirical evidence for this turn of the tide. Should this trend persist, wine producers will need to adapt their practices and, for example, delay pruning dates or choose later-ripening varieties (Bordeaux Wine Council, 2019). Such adaptations to the wine-making bio-economy would help to avoid more radical changes in the geography of wine production. Based on our analysis, they are also necessary to maintain the quality of the wines produced, as reflected in consumer and expert ratings.
Overall, our analysis suggests that crowdsourced wine ratings are both valid and useful. If we are on the precipice of a paradigm shift whereby decentralized, crowdsourced reviews complement or even replace those of seasoned critics, then our analysis suggests that the future is in good hands.
Acknowledgements
Orestis Kopsacheilis acknowledges the American Association of Wine Economists for their scholarship as well as Dan Burdea for useful comments. We thank Susannah Goss for editing the manuscript.
Funding statement
Pantelis P. Analytis was supported by a Sapere Aude research leader grant by the Independent Research Fund Denmark. Ophelia Deroy was supported by the NOMIS foundation (Diversity in Social Environments project) and a Co-Sense grant from the Volkswagen Foundation. Bahador Bahrami and Karthykeya Kaushik were supported by the European Research Council (ERC) under the European Union’s Horizon 2020 research and innovation program (rid-o project, grant 819040).
A. Appendix
A.1 Overlap of reviews from Vivino and professional critics in matched dataset
Number of matched wine reviews for Vivino and critics.

A.2 Summary statistics
Summary statistics of variables used in ordinary least squares regression analysis

Note: Average temperatures are measured in °C. Rainfall is measured in mm of water accumulated over the entire period. Vivino ratings are calculated by averaging at the level of the wine (i.e., the label of a chateau in a given vintage) and then transforming these averages into Z-scores by subtracting the mean and dividing by the standard deviation. We provide information about both levels here: before and after normal standardization. For the professional critics ratings, the process is the same but we add an additional step. Namely, we start by calculating Z-scores for each critic’s ratings before averaging those Z-scores over the dataset. The reason for this additional step is that each critic uses their own rating system and it would be impossible to aggregate otherwise. Therefore, we only provide summary statistics for their Z-transformation here. The portfolio of wines for which these Z-scores are calculated is common for Vivino amateurs and professional critics and consists of 341 observations. The vintages we observe range from 2004 to 2016. The weather conditions we track follow the same 13-year period. The time trend we include in Table 1 is an index variable tracking these years.
Averaged Vivino and professional critics’ ratings (Z-scores) as a function of weather conditions.

A.3 Alternative consideration of the “Bordeaux equation”
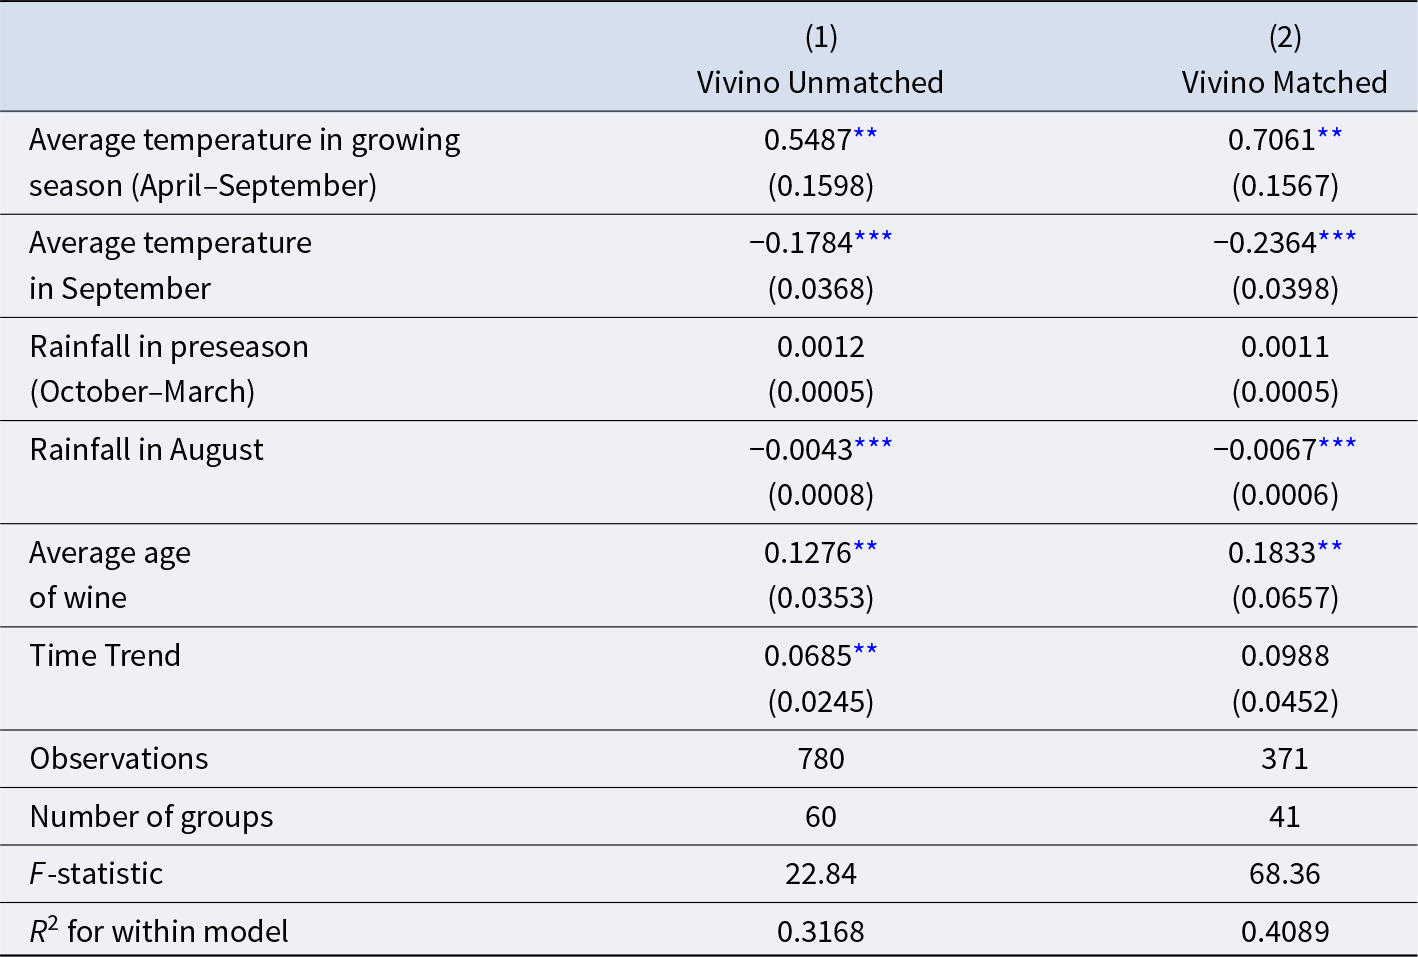
Table A2 reports on a regression analysis similar to that in Table 1, but specifically focusing on Vivino ratings only. Since matching Vivino ratings with those from professional critics is not necessary for this analysis, we can compare the coefficients of the unmatched dataset with those of the matched dataset. In the former dataset we observe all wine labels from our portfolio of red wines from Bordeaux across all years within our observation window (2004–2016). This results in a balanced panel data for model (1). In the latter dataset, there are gaps for some wine labels in certain years where we were unable to find at least three professional critics’ reviews. Reassuringly, the coefficients of both models are in high agreement, indicating that the matched dataset we used in our main analysis is unlikely to be significantly affected by selection effects.
Determinants of wine ratings: Regressing Vivino ratings onto weather variables and average age

Notes: The averaged, standard-normalized rating (Z-score) of a wine reviewed in Vivino is regressed onto climate variables (centered to their mean), the wine’s averaged age at the time of consumption and a time-trend. (1): Ratings from Vivino amateurs over entire portfolio of Bordeaux wines (balanced panel). (2): Ratings from Vivino amateurs over matched-with-experts portfolio of Bordeaux wines (unbalanced panel). The regression models include fixed effects at the level of the chateau and weights proportional to the number of ratings included in the calculation of each average. Weather variables have been centered to their mean. Each wine in our data set is uniquely identified by a chateau and a vintage. Average temperatures are measured in °C. Rainfall is measured in mm of water accumulated over the entire period.
Driscoll–Kray (vintage- and chateau-clustered) standard errors are in parentheses.
*** p < 0.001, **p < 0.01, *p < 0.05.
Moreover, the regression model in Table A2 includes a variation of the set of independent variables compared to Table 1. The most notable difference is the addition of the variable “Average Age of wine” which is absent in Table 1 due to its inability to be calculated for professional critics’ ratings (critics give their ratings en primeur, when the wine has not yet been bottled and, therefore, has not aged). Age is computed as the difference between the review year and the wine’s vintage. It is then averaged across all reviews for a given wine (mean = 7.08, St.Dev = 2.83, min = 2.00, max = 13.94).
Additionally, unlike the model in Table 1, here we incorporate September in the calculation of the average temperature during the growing season and exclude the quadratic term for the average temperature in growing season. These adjustments are motivated by aligning more closely with the original formulation of the Bordeaux equation (Ashenfelter, Reference Ashenfelter2008b). Despite these modifications, we observe strong agreement between the coefficients reported here and those in Table 1, indicating robustness in our conclusions regarding the factors influencing Vivino ratings across different variants of the Bordeaux equation.

 Open access

