


1. Introduction
Developing oral fluency represents a major goal for many second language (L2) learners. To help them realise this, it is vital to develop effective L2 diagnostic tools, teaching methods and materials, and assessments. This is more likely to be achieved through a clearer understanding of the neurocognitive processes that underlie L2 oral fluency and their relationship with the speech produced by learners. Nevertheless, little is known about the neural mechanisms underlying fluent speech production. Although there have been significant advances in understanding the psycholinguistic characteristics associated with fluent speech and the associated cognitive processes, existing studies have predominantly employed behavioural instruments such as speech analysis (e.g., De Jong & Wempe, Reference De Jong and Wempe2009), verbal protocols (e.g., Kormos, Reference Kormos2000), tests of L2 knowledge and skills (e.g., De Jong et al., Reference De Jong, Steinel, Florijn, Schoonen and Hulstijn2013; Khang, Reference Khang2020; Suzuki & Kormos, Reference Suzuki and Kormos2023) and cognitive assessments (e.g., Ahmadian, Reference Ahmadian2012; Wright, Reference Wright2013) to infer the processes underlying various aspects of fluency. However, to achieve a full understanding of L2 fluency behaviours, it is essential to complement cognitive-behavioural data with neural evidence, as similar observable behaviours do not necessarily implicate the same brain mechanisms (Richards et al., Reference Richards, Berninger, Yagle, Abbott and Peterson2017).
This study is among the first to employ neuroimaging together with speech analysis to explore fluency behaviours in spontaneous L2 speech. Our investigation focused on silent pausing (pausing henceforth), a key determinant of how fluent (Suzuki et al., Reference Suzuki, Kormos and Uchihara2021) and communicatively adequate (Ekiert et al., Reference Ekiert, Révész, Torgersen and Moss2022; Révész et al., Reference Révész, Ekiert and Torgersen2016) L2 speech is perceived by listeners. According to previous research, the frequency and location of pausing, whether speakers pause more within or between clauses, are a particularly strong predictor of perceived fluency (Suzuki et al., Reference Suzuki, Kormos and Uchihara2021) and L2 proficiency (Duran-Karaoz & Tavakoli, Reference Duran-Karaoz and Tavakoli2020; Huensch, Reference Huensch2023; Tavakoli et al., Reference Tavakoli, Nakatsuhara and Hunter2017, Reference Tavakoli, Nakatsuhara and Hunter2020) as well as a factor that reliably distinguishes first language (L1) from L2 speech (de Jong, Reference De Jong2016; Duran-Karaoz & Tavakoli, Reference Duran-Karaoz and Tavakoli2020; Felker et al., Reference Felker, Klockmann and De Jong2019; Foster & Tavakoli, Reference Foster and Tavakoli2009; Huensch, Reference Huensch2023; Khang, Reference Khang2014; Riazantseva, Reference Riazantseva2001; Skehan & Foster, Reference Skehan, Foster, Van Daele, Housen, Kuiken, Pierrard and Vedder2007; Skehan et al., Reference Skehan, Foster and Shum2016; Tavakoli, Reference Tavakoli2011; see, however, Suzuki & Kormos, Reference Suzuki and Kormos2025a). To account for these observations, it has been proposed that mid-clause and end-clause pausing reflect disruption at two different stages of speech production, formulation (i.e., linguistic encoding processes) and conceptualisation (i.e., content planning), respectively (de Jong, Reference De Jong2016; Field, Reference Field and Taylor2011; Skehan et al., Reference Skehan, Foster and Shum2016; Suzuki & Kormos, Reference Suzuki and Kormos2023; Tavakoli et al., Reference Tavakoli, Nakatsuhara and Hunter2017, Reference Tavakoli, Nakatsuhara and Hunter2020). To date, however, no direct evidence is available to confirm these associations. In this study, we aimed to help fill this gap by exploring the neural correlates of mid-clause and end-clause pausing in both L1 and L2 speech, through the use of behavioural speech analysis to identify pauses and neuroimaging to uncover brain activity associated with pausing.
2. Background
2.1. Models of speech production
To conceptualise our study, we drew on Levelt’s (Reference Levelt, Brown and Hagoort1999) psycholinguistic model of first language speech production, validated by neurocognitive research (Indefrey & Levelt, Reference Indefrey and Levelt2004) and extended to bilingual speech production by Kormos (Reference Kormos2006). These models distinguish three stages: conceptualisation, formulation, and articulation, with ongoing monitoring. Conceptualisation involves creating a preverbal plan through macro- and micro-planning. Macro-planning involves determining the content and order of the message, while micro-planning specifies its perspective, focus, argument structure, semantic relations, and mood. While macro-planning is language-independent, micro-planning draws on language-specific features (e.g., tense). Formulation begins with lexical encoding (matching concepts to lemmas), followed by morphosyntactic encoding (constructing surface structures), and phonological encoding (developing an articulatory plan or internal speech). Finally, articulation executes this plan as overt speech. Macro-planning imposes similar demands on both L1 and L2 speakers. However, L2 speakers typically face greater challenges in micro-planning and formulation due to less advanced L2 knowledge and less automatised processing skills (Suzuki & Kormos, Reference Suzuki and Kormos2023).
2.2. Disfluency in speech production
When speakers encounter difficulty during speech production, they exhibit certain features of disfluency. To capture these, Segalowitz (Reference Segalowitz2010) proposed a three-way distinction: utterance fluency refers to the observable temporal characteristics of speech; cognitive fluency denotes the psycholinguistic processes that underlie speech fluency or lack of it, and perceived fluency describes listeners’ perceptions of one’s fluency. To date, L2 researchers have dedicated the most attention to utterance fluency, focusing on its subcomponents: speed fluency, repair fluency, and breakdown fluency (Skehan, Reference Skehan2003; Tavakoli & Skehan, Reference Tavakoli, Skehan and Ellis2005). Speed fluency refers to the rate of speech delivery; repair fluency features help speakers resolve processing issues (e.g., false starts, self-corrections); and breakdown fluency entails pausing behaviours, both silent and filled pausing (e.g., “hm”). Speed and breakdown fluency appear especially influential in determining perceived fluency. A meta-analysis by Suzuki et al. (Reference Suzuki, Kormos and Uchihara2021) found that speech rate and pause frequency had the strongest associations with how speech is perceived. Likewise, studies on functional adequacy (i.e., the extent to which the communicative goals of a task are achieved) found these same features to be the strongest predictors of functional adequacy (Ekiert et al., Reference Ekiert, Révész, Torgersen and Moss2022; Koizumi & In’nami, Reference Koizumi and In’nami2024; Révész et al., Reference Révész, Ekiert and Torgersen2016).
2.3. The role of pause location in breakdown fluency
Zooming in on breakdown fluency, several lines of research highlight the importance of pause location. For example, pause location has emerged as a key mediator of the links between utterance and perceived fluency. Suzuki et al.’s (Reference Suzuki, Kormos and Uchihara2021) meta-analysis found that while perceived fluency had a strong link to mid-clause pauses, it showed only a medium-sized association with end-clause pauses, reflecting the results of individual studies (Khang, Reference Khang2018; Saito et al., Reference Saito, Ilkan, Magne, Tran and Suzuki2018; Suzuki et al., Reference Suzuki, Kormos and Uchihara2021; Suzuki & Kormos, Reference Suzuki and Kormos2020; Takizawa & Suzuki, Reference Takizawa and Suzuki2025). In contrast, end-clause rather than mid-clause pausing emerged as a predictor of functional adequacy in Ekiert et al.’s (Reference Ekiert, Révész, Torgersen and Moss2022) study.
Pause location has also been found to be a major factor in research exploring the relationship between cognitive and utterance fluency. Kahng (Reference Khang2020), the first study to investigate this link, operationalised cognitive fluency as L2 vocabulary size; L2 grammar knowledge; and speed of lexical retrieval, syntactic encoding, and articulation. Among the utterance fluency measures, the study included both L1 and L2 mid-clause and end-clause pause frequency. For pause location, two main findings emerged. First, L2 syntactic encoding speed predicted mid-clause pause ratio, with higher processing speed being associated with fewer within-clause pauses. Second, this link was L2-specific, as L1 mid-clause pause ratio did not predict L2 mid-clause pause frequency. A larger-scale study by Suzuki and Kormos (Reference Suzuki and Kormos2023) yielded parallel results. Cognitive fluency was captured in terms of vocabulary size and lexical retrieval speed, syntactic encoding accuracy and efficiency, grammatical monitoring ability, and articulation speed. The researchers found that mid-clause pause frequency best represented the construct of L2 breakdown fluency. Considering their findings, both Khang (Reference Khang2020) and Suzuki and Kormos (Reference Suzuki and Kormos2023) concluded that mid-clause pausing likely reflects L2-specific disruptions in speech production.
The L2-specific nature of mid-clause pausing is further supported by research comparing pausing across L1 and L2 speakers and among L2 speakers with different levels of proficiency. This research strand was inspired by L1 studies (Goldman-Eisler, Reference Goldman-Eisler1972; Pawley & Syder, Reference Pawley, Syder and Riggenbach2000), which observed more frequent pausing between than within clauses in L1 speech. Interestingly, L2 speakers appear to pause more frequently within clauses than L1 speakers (de Jong, Reference De Jong2016; Duran-Karaoz & Tavakoli, Reference Duran-Karaoz and Tavakoli2020; Felker et al., Reference Felker, Klockmann and De Jong2019; Foster & Tavakoli, Reference Foster and Tavakoli2009; Huensch, Reference Huensch2023; Khang, Reference Khang2014; Riazantseva, Reference Riazantseva2001; Skehan & Foster, Reference Skehan, Foster, Van Daele, Housen, Kuiken, Pierrard and Vedder2007; Skehan et al., Reference Skehan, Foster and Shum2016; Tavakoli, Reference Tavakoli2011; see, however, Peltonen, Reference Peltonen2018), and lower-proficiency L2 speakers seem more likely to pause mid-clause than their more proficient counterparts (Duran-Karaoz & Tavakoli, Reference Duran-Karaoz and Tavakoli2020; Huensch, Reference Huensch2023; Peltonen, Reference Peltonen2018; Tavakoli et al., Reference Tavakoli, Nakatsuhara and Hunter2017, Reference Tavakoli, Nakatsuhara and Hunter2020). Notably, neither L1-L2 status (de Jong, Reference De Jong2016; Duran-Karaoz & Tavakoli, Reference Duran-Karaoz and Tavakoli2020; Felker et al., Reference Felker, Klockmann and De Jong2019; Foster & Tavakoli, Reference Foster and Tavakoli2009; Khang, Reference Khang2014; Riazantseva, Reference Riazantseva2001; Skehan et al., Reference Skehan, Foster and Shum2016; Skehan & Foster, Reference Skehan, Foster, Van Daele, Housen, Kuiken, Pierrard and Vedder2007; Tavakoli, Reference Tavakoli2011) nor L2 proficiency (Duran-Karaoz & Tavakoli, Reference Duran-Karaoz and Tavakoli2020; Tavakoli et al., Reference Tavakoli, Nakatsuhara and Hunter2017, Reference Tavakoli, Nakatsuhara and Hunter2020) had a strong influence on end-clause pause frequency in previous studies (see, however, Suzuki & Kormos, Reference Suzuki and Kormos2025a, Reference Suzuki and Kormos2025b), suggesting that L1 and L2 speakers’ production processes are similar when pausing at end-clause boundaries (De Jong, Reference De Jong2016; Foster & Tavakoli, Reference Foster and Tavakoli2009; Khang, Reference Khang2014).
Notably, however, extant research on tasks did reveal variation in end-clause pausing depending on task manipulations. Wang (Reference Wang and Skehan2014) and Lambert et al. (Reference Lambert, Kormos and Minn2017) examined the effects of task repetition on pause length and frequency, respectively. Wang (Reference Wang and Skehan2014) asked participants to repeat an oral task twice, whereas Lambert et al. (Reference Lambert, Kormos and Minn2017) invited learners to repeat a task six times. In both studies, end-clause pausing declined from the initial performance to the second. Lambert et al. (Reference Lambert, Kormos and Minn2017) also found that mid-clause pausing decreased from the first to the third performance. Recently, Huensch (Reference Huensch2023) also identified a task-type effect when comparing mid-clause pausing across interviews and narratives.
To explain these observations, researchers (de Jong, Reference De Jong2016; Field, Reference Field and Taylor2011; Skehan et al., Reference Skehan, Foster and Shum2016; Suzuki & Kormos, Reference Suzuki and Kormos2023; Tavakoli et al., Reference Tavakoli, Nakatsuhara and Hunter2017, Reference Tavakoli, Nakatsuhara and Hunter2020) have proposed that pausing within and between clauses might reflect difficulty at different speech production stages, with mid-clause pausing probably signalling disruption in formulation processes. Indeed, this would explain the increased mid-clause frequency observed in L2 speech, as L2 formulation processes are not fully automatised, especially at lower proficiency. This account is also aligned with the results of Khang (Reference Khang2020) and Suzuki and Kormos (Reference Suzuki and Kormos2023), revealing that measures of L2 knowledge more strongly predicted mid-clause than end-clause pause frequency.
By contrast, scholars assume that end-clause pauses relate to the conceptualisation stage of speech production, in particular, macro-planning (Skehan et al., Reference Skehan, Foster and Shum2016). This assumption is coherent with the overall finding of previous studies that end-clause pausing does not tend to vary according to L1/L2 status or L2 proficiency, but may be subject to task-related variation. For example, in Wang’s (Reference Wang and Skehan2014) and Lambert et al.’s (Reference Lambert, Kormos and Minn2017) research, task repetition might have eased pressure on conceptualisation, leading to the lower incidence of end-clause pauses.
While these presumed links between pausing behaviours and speech production processes seem logical, little direct evidence is available for the speech production processes underlying pausing behaviours, and none has investigated associated neural processes. Therefore, we aimed to explore the neural correlates of mid-clause and end-clause pausing, triangulating behavioural speech analysis with functional magnetic resonance imaging (fMRI), a neuroimaging tool.
3. Neural processes underlying spontaneous speech production
Despite increasing interest in spontaneous speech production, the neural processes underlying silent pausing in L2 speech remain unexplored. While a few studies have used fMRI to examine brain activity during naturalistic or spontaneous speech, most have focused on L1 speakers. Morales et al. (Reference Morales, Patel, Tamm, Pickering and Hoffman2022), for example, reported that less coherent discourse elicited stronger activation in theory-of-mind (ToM) regions such as the medial prefrontal cortex (mPFC), precuneus, anterior temporal cortex, and lateral parietal cortex during spontaneous L1 speech. One small-scale L1 study by Kircher et al. (Reference Kircher, Brammer, Levelt, Bartels and McGuire2004) has specifically investigated the neural correlates of pausing in L1 spontaneous speech production. Pauses―particularly those occurring within clauses―elicited increased activation in the left superior temporal sulcus at the temporoparietal junction (TPJ), a region encompassing parts of the angular gyrus (AG) and adjacent posterior superior temporal areas. This posterior parietal–temporal region is widely implicated in lexical-semantic retrieval, semantic integration, and other conceptual processes. In contrast, continuous speech recruited classic language-production regions, including bilateral inferior frontal gyri (BA 44/45). Although the study was limited by its very small sample (n = 6) and by examining only relatively long pauses (550–3000 ms), Kircher et al.’s findings, nonetheless, provide important neural evidence that within-clause pauses index lexical–conceptual planning processes supported by TPJ/AG regions.
Research on L2 spontaneous speech production remains limited, yet available evidence suggests a functional distinction between linguistic formulation and message-level conceptualisation. With respect to linguistic formulation, numerous neuroimaging studies have shown that producing speech in an L2 places greater demands on encoding processes than producing speech in an L1, consistently yielding increased activation in the left inferior frontal gyrus (IFG) and other peri-Sylvian regions involved in lexical, syntactic, and phonological processing (Golestani et al., Reference Golestani, Xavier Alario, Meriaux, Bihan, Dehaene and Pallier2006; Restle et al., Reference Restle, Murakami and Ziemann2012; Shimada et al., Reference Shimada, Hirotani, Yokokawa, Yoshida, Makita, Yamazaki-Murase, Tanabe and Sadato2015). In contrast, studies examining conceptualisation―particularly those contrasting communicative and non-communicative speech—suggest that message-level planning engages a broadly similar ToM-related network across languages. Following Sassa et al.’s (Reference Sassa, Sugiura, Jeong, Horie, Sato and Kawashima2007) communicative-production paradigm, Jeong et al. (Reference Jeong, Sugiura, Suzuki, Sassa, Hashizume and Kawashima2016) found that both L1 and L2 speech elicited increased activation in regions including the mPFC, precuneus, posterior superior temporal sulcus, and the AG during communicative intent. Although L2 speakers additionally activated areas such as the left posterior supramarginal gyrus, interpreted as supporting speech-act planning, the core conceptualisation network appeared largely shared across L1 and L2.
Taken together, these findings point to a division of labour across the speech production system. Linguistic formulation, particularly in an L2, is supported by effortful neural processing in the left IFG and related frontal regions, whereas conceptual planning and mentalising processes are subserved by ToM-related areas such as the mPFC, precuneus, and AG, which appear to operate in broadly comparable ways across L1 and L2. Importantly, unlike the well-established L2 disadvantage in linguistic formulation, existing neuroimaging studies do not provide a clear or consistent direction of L1–L2 differences in posterior conceptual networks. These posterior parietal regions (including AG, TPJ, and posterior STS) form an overlapping network supporting both semantic integration and social-cognitive message planning (Binder et al., Reference Binder, Desai, Graves and Conant2009; Seghier, Reference Seghier2013), making it theoretically inappropriate to predict stronger conceptualisation-related activation in either language.
4. The present study
Building on the neurocognitive distinctions associated with conceptual planning and linguistic encoding, along with previous findings regarding the role of pause location, it would appear that mid- and end-clause silent pauses engage different neural networks: specifically, mid-clause pauses elicit greater activation in language-related regions such as the IFG, whereas end-clause pauses are more strongly associated with conceptualisation-related areas like the mPFC and AG. This neural differentiation aligns with the conceptualisation and formulation stages of Levelt’s psycholinguistic model of speech production. The aim of this study was to test this prediction for L1 and L2 speech by combining behavioural speech analysis with fMRI, interpreted through the theoretical framework of psycholinguistic models of speech production. We first performed whole-brain analyses to identify relevant activation patterns and subsequently conducted region-of-interest (ROI) analyses in language-related areas based on prior neurocognitive models of speech production.
Our research was conducted in a Japanese university setting, involving L2 English speakers with Japanese as their L1 and proficiency levels in the intermediate to upper-intermediate range. We formed the following research question and hypotheses:
Research question:
-
• To what extent does the location of silent pauses (mid- vs. end-clause) relate to neural processes during L1 Japanese and L2 English speech production?
Hypotheses:
-
• In line with Levelt’s (Reference Levelt, Brown and Hagoort1999) model of speech production, mid-clause pauses are reflective of formulation processes and thus will be linked to heightened activation in language-related brain regions (specifically, the left IFG), with stronger effects expected for L2 English compared to L1 Japanese speech production.
-
• End-clause pauses will be linked to heightened activation in conceptualisation-related regions, including the AG and the precuneus, regardless of language (L1 Japanese and L2 English).
5. Methodology
5.1. Design
We recruited 26 Japanese L1 users of L2 English as participants. All of them completed eight oral production tasks while in an fMRI scanner. Each participant carried out half of the tasks in L1 Japanese and the other half in L2 English. The tasks also differed in terms of task complexity, the focus of a different study (Révész et al., Reference Révész, Jeong, Suzuki, Cui, Matsuura, Saito and Sugiura2024). We counterbalanced language and task complexity across the participants. The final dataset for this study comprises L1 and L2 performances by 20 participants (altogether 160 task performances). We had to exclude six participants, either because the recordings of their speech were of poor quality or because they engaged in too much head movement during scanning. According to G*Power (Faul et al., Reference Faul, Erdfelder, Buchner and Lang2009), this sample size allows for detecting medium-sized effects 90% of the time, given the number of observations (eight tasks) and the within-subject design. Before participants carried out the experimental tasks, they completed a background questionnaire and took the listening component of the Oxford Placement Test (Allan, Reference Allan2004).
5.2. Participants
The participants were all enrolled in undergraduate programmes at a Japanese university. Their mean age was 20.30 (SD = 1.49); there were 10 female and 10 male participants. English was the first foreign language for all participants. Most previous English language instruction that participants had received was formal and school-based, but three participants had also spent four weeks studying abroad after they turned 18. According to the listening part of the Oxford Placement Test, participants’ English language proficiency fell into the CEFR B1–B2 bands (M = 80.55, SD = 6.35). Participants additionally reported their recent TOEIC (n = 3) or TOEFL (n = 17) proficiency scores, confirming their placement in the B1-B2 CEFR proficiency range.
5.3. Instruments and procedures
5.3.1. Tasks
All eight tasks were monologic, decision-making tasks. Half of the tasks involved participants choosing four critical items to take from a set of eight in an emergency situation (e.g., needing to get to an emergency shelter in response to a flood alert). In the rest of the tasks, participants were asked to select five individuals from a list of eight during an emergency (e.g., which people to rescue first from a fire). For each situation, participants were instructed to explain why they chose or did not choose each item or individual (see the Supporting Information online for each task prompt). Our rationale for selecting these task types was grounded in the importance of emergency communication skills in the Japanese context. Given that our participants routinely engage in emergency preparedness training in their first language, this scenario represented a real-life communicative task for them. Two applied linguists, L1 Japanese speakers of L2 English with experience of teaching English in Japan, helped us make the task prompts and the selection of items/individuals culturally suitable for the participating students. The tasks were also trialled with participants who had similar demographic characteristics to those of our actual participants.
5.3.2. Data collection
The study involved one individual session. The session started with obtaining informed consent, then we invited participants to complete a paper-and-pencil background questionnaire (10 minutes) and the listening part of the Oxford Placement Test (15 minutes max). Participants carried out the rest of experiment within the fMRI scanner. First, we introduced participants to the task instructions and procedures. In this practice phase, we asked them to read the task instructions, listen to a sample practice task performance, perform the practice task, and complete the task perception questionnaire. We also explained to participants how to decrease head movements while undergoing fMRI scanning. The practice trial in the MRI machine also helped participants gain practice in controlling their head movements while speaking. To restrict participants’ head motion further, we secured their heads with a combination of a restraint belt and foam pad. We encouraged participants to ask any questions they might have had about the procedures.
Next, participants proceeded to complete the fMRI experiment in two sessions, one for each language (English and Japanese). The order of language sessions was counterbalanced across participants. In each session, participants completed four task trials. Each trial consisted of a 1-minute task instruction period, a 2-minute speech production period, and a 10-second response period for a brief task perception questionnaire (not discussed here). A 15-second resting period was inserted between trials. Each session lasted a total of 834 seconds in the fMRI scanner. We used an MRI-compatible noise-cancelling microphone (Optoacoustics Ltd., Moshav Mazor, Israel) to record participants’ speech.
Functional images were acquired with a 3 T Philips Achieva dStream scanner. We employed a gradient-echo planer image (EPI) sequences with the following parameters: echo time (TE) = 30 ms, flip angle = 80°, slice thickness = 3 mm, field of view (FOV) = 192 mm and matrix size = 64 × 64. Thirty-two axial slices covering the whole brain were obtained every 2 seconds (TR = 2000 ms). After discarding the first three dummy scans to account for T1 saturation effect, a total of 417 EPI volumes were collected per participant for each session, corresponding to four task trials. High-resolution T1-weighted anatomical images were also acquired for each participant to support anatomical localisation. Preprocessing was conducted using Statistical Parametric Mapping software (SPM12; Wellcome Centre for Human Neuroimaging, London, UK) implemented in MATLAB (MathWorks, Natick, MA, USA). Preprocessing steps included slice timing correction, realignment for head motion, co-registration of the functional and anatomical images, spatial normalisation to the Montreal Neurological Institute (MNI) template, and spatial smoothing with an 8 mm full-width at half-maximum Gaussian kernel.
5.4. Data analyses
5.4.1. Behavioural analyses
All 160 oral performances, 80 L1 Japanese and 80 L2 English speech samples, were first transcribed then coded for pause type by the third author. The number of filled pauses was very small in the dataset; thus, we only included silent pauses in our further analyses. Silent pauses were identified manually, as the fMRI audio data were not of sufficient quality for reliable automatic pause detection. We adopted a pause threshold of 250 ms (Goldman-Eisler, Reference Goldman-Eisler1968). We used TextGrid files from the Praat software (Boersma & Weenink, Reference Boersma and Weenink2024) to annotate the data for clause boundaries and to code for location of pauses (mid-clause vs. end-clause). We adopted Foster et al.’s (Reference Foster, Tonkyn and Wigglesworth2000) definition of clause to identify clause boundaries. To establish reliability, the data from three participants (12.5% of the dataset), randomly selected, were also coded by a second researcher. We reached high intercoder agreement for all coding categories in both L1 Japanese (pause identification: 96.6%, clause boundary: 87.2%, and pause location: 96.5%) and L2 English (pause identification: 100%, clause boundary: 99.5%, and pause location: 99.6%). After the coding of the data had been completed, we computed a mid-clause and end-clause pause ratio separately for each task. This involved dividing the number of mid-clause and end-clause pauses by the total number of clauses produced by the participants during a task. We included the resulting mid-clause and end-clause pause ratios in our pause frequency analyses.
Turning to the statistical analyses, we constructed a series of linear mixed-effects models using the function lmer in the R statistical environment. To examine the potential effect of language on participants’ length of speech, we built a model using word count as the outcome variable, language (L1/L2) as a fixed-effect variable, and task prompt and participants as random-effect factors. Next, we constructed a series of models to investigate the effects of language on pausing behaviours. In our initial two models, the fixed effects were language, pause location, and their interaction; the random effects included participant and task prompt; and the dependent variable was the frequency or length of silent pauses. When the analyses yielded a significant interaction, we conducted pairwise mixed-effects comparisons, applying Bonferroni corrections. Effect sizes were calculated using the r.squared GLMM function in the MuMIn package, with marginal and conditional R2 values (R2m, R2c) used to estimate the variance explained by fixed and random effects, respectively. The alpha level was set at .05. Model assumptions (linearity, normality and homoscedasticity of residuals, and appropriate random-effects structure) were checked.
5.4.2. fMRI analyses
All fMRI analyses were conducted using SPM12 (Wellcome Trust Centre for Neuroimaging), following a conventional two-level approach comprising first-level (within-participant) and second-level (between-participant) analyses. This framework allowed us to examine both individual activation patterns and group-level effects, enabling a comprehensive assessment of how language and pause location influence neural activity during spontaneous speech production.
At the first level, we employed voxel-wise multiple regression to model the hemodynamic responses for each participant. The design matrix included four task regressors reflecting a 2 × 2 factorial design: language (L1 Japanese vs. L2 English) and pause location (mid-clause vs. end-clause). Specifically, the regressors corresponded to Japanese mid-clause (JM), Japanese end-clause (JE), English mid-clause (EM), and English end-clause (EE) pauses. Because the analyses followed an event-related design, each condition was modelled with a separate regressor reflecting the timing and duration of individual pauses. In this approach, differences in event counts affect only the precision, not the magnitude, of parameter estimates (Friston et al., Reference Friston, Fletcher, Josephs, Holmes, Rugg and Turner1998; Henson, Reference Henson, Frackowiak, Friston, Frith, Dolan, Price, Zeki, Ashburner and Penny2004), ensuring that the results reflect pause-location-specific neural processes rather than overall pause frequency. Onset times and durations for each regressor were derived from silent pauses identified through behavioural speech analysis. Six motion parameters (three translations and three rotations) were included as nuisance regressors. Speech periods were not explicitly modelled and were treated as part of the implicit baseline. This approach allowed us to isolate neural activation associated specifically with silent pauses, relative to the rest of the speech production phase. For each participant, contrast images were generated for each condition, allowing within-language comparisons between mid- and end-clause pauses.
At the second level, we conducted a flexible factorial repeated-measures ANOVA using a random-effects model to examine the main effects of language (L1 vs. L2), pause location (mid-clause vs. end-clause), and their interaction. Statistical significance was assessed using a voxel-wise threshold of p < .001 (uncorrected) and a cluster-level threshold of p < .05 (FWE-corrected). All coordinates are reported in MNI space.
In addition to whole-brain analyses, we conducted ROI analyses targeting core language-related areas to increase sensitivity to theoretically motivated effects. Specifically, we examined two subdivisions of the left IFG―the anterior IFG (BA45) and the posterior IFG (BA44)―as well as the left AG, all of which have been implicated in sentence-level speech production (Giglio et al., Reference Giglio, Ostarek, Sharoh and Hagoort2024; Heim et al., Reference Heim, Eickhoff and Amunts2008; Seghier, Reference Seghier2013; Wolna et al., Reference Wolna, Szewczyk, Diaz, Domagalik, Szwed and Wodniecka2024).
-
a) Anterior IFG ([–46, 30, 12]): This ROI corresponds to BA45 and has been associated with semantic and syntactic unification processes during sentence-level processing. The coordinate was derived from Friederici (Reference Friederici2011) and falls within a region consistently activated in sentence production paradigms (e.g., Matchin & Hickok, Reference Matchin and Hickok2019; Shimada et al., Reference Shimada, Hirotani, Yokokawa, Yoshida, Makita, Yamazaki-Murase, Tanabe and Sadato2015). A spherical ROI with a 6-mm radius was centred on this coordinate using the MarsBaR toolbox in SPM.
-
b) Posterior IFG ([–46, 6, 18]): This region approximates BA44 and was selected based on Restle et al. (Reference Restle, Murakami and Ziemann2012), who reported this coordinate in a foreign sentence production task. It has also been associated with phonological encoding and verbal fluency during sentence production (Costafreda et al., Reference Costafreda, Fu, Lee, Everitt, Brammer and David2006; Heim et al., Reference Heim, Eickhoff and Amunts2008; Jeong et al., Reference Jeong, Hashizume, Sugiura, Sassa, Yokoyama, Shiozaki and Kawashima2011), supporting its broader role in the articulatory–syntactic interface (Golestani et al., Reference Golestani, Xavier Alario, Meriaux, Bihan, Dehaene and Pallier2006). A 6-mm-radius spherical ROI was created at this coordinate using the MarsBaR toolbox.
-
c) Left AG: The AG has been linked to higher-level conceptual and integrative processes in language, particularly during discourse-level planning and the initiation of sentence production (Binder et al., Reference Binder, Desai, Graves and Conant2009; Seghier, Reference Seghier2013). This ROI was defined using the Automated Anatomical Labelling (AAL) atlas via the WFU PickAtlas toolbox, encompassing the full anatomical extent of the region.
For each ROI, condition-wise beta values were extracted using MarsBaR. A 2 (Language: L1 Japanese, L2 English) × 2 (Pause Position: Mid, End) repeated-measures ANOVA was conducted for each ROI. These ROI analyses were designed to complement the whole-brain results by increasing sensitivity to hypothesised localised effects and to further examine the neural correlates of pause location during spontaneous speech production in L1 and L2.
6. Results
6.1. Preliminary analyses
6.1.1. Speech length across L1 and L2 performances
The unpruned word count for participants’ speech performances was similar in L1 Japanese (N = 80, M = 135.29, SD = 33.52) and L2 English (N = 80, M = 137.15, SD = 34.36). The mixed effects model for word count found no significant difference between when participants spoke in L1 Japanese and when they spoke in L2 English, fixed effects: Est = 1.10, SE = 2.25, t = -0.49, p = .63; random effects: participant (intercept) SD = 26.20, task (intercept) SD = 8.26.
6.2. Pause frequency and length across L1 and L2 performances
Table 1 and Figure 1 present the descriptive statistics for pause frequency (number of silent pauses/clause) and length for silent pauses by location, that is, whether the pauses occurred within or between clauses. The table and figure also show patterns of pausing depending on whether participants used L1 Japanese and L2 English during task performance. As shown in Table 2, the mixed-effects model, which was constructed to examine the effects of language, pause location, and their interaction on pause frequency, revealed a significant effect for both main factors and their interaction. As illustrated in Figure 1, the significant interaction captures that, while participants paused slightly more in end-clause than mid-clause positions in L1 Japanese, they paused considerably more often in the middle of clauses than at the end of clauses when speaking in L2 English. As demonstrated in Table 3, follow-up pairwise mixed effects models further revealed that the differences in mid- and end-clause pause frequency were also significant when the L1 and L2 data were considered separately. The significant main effect for language indicates that, overall, participants paused with significantly greater frequency in L2 English than in L1 Japanese. Table 3 shows that, according to the results of pairwise fixed-effects models, this difference applied to both mid- and end-clause pauses, although the effect size was considerably larger for pauses within clauses.
Silent pause frequency and length by language and pause location

a Number of task performances.
Pause frequency and length by language (L1 Japanese vs. L2 English) and pause location (mid-clause vs. end-clause).

Results for models examining the effects of language, pause location, and their interaction on pausing behaviours

Note: Reference levels: Language = English, Location = end-clause.
Results for pairwise comparisons examining the effects of language and pause location on pause frequency

For pause length, the mixed effects model only yielded a significant main effect for pause location (see Table 2). Participants were found to pause longer in end-clause than mid-clause positions regardless of whether they spoke in L1 Japanese or L2 English (see Table 2 and Figure 1).
6.3. Effects of L1 versus L2 on neural processes during pausing
First, we present the results for the fMRI whole-brain analyses; we found significant main effects for language and pause location but not for their interaction.
Turning to the main effect for language first, we found that, in L2 English as to compared to L1 Japanese, pauses (regardless of location) elicited greater activation in brain regions associated with phonological processing and planning to speak. Specifically, this increased activation was evident in two areas, the left precentral and postcentral gyri (see Table 4 and Figure 2). Conversely, pauses produced during L1 Japanese speech were associated with greater activation in the mPFC and right insula relative to pauses in L2 English (see Table 4 and Figure 3).
Brain areas showing greater activation associated with pauses during L2 English than L1 Japanese and vice versa

Notes. For each area, the coordinates (x, y, z) of the activation peak in MNI space, peak t-value and size of the activated cluster in number (k) of voxels (2 × 2 × 2 mm3) are shown for all subjects (n = 20). The threshold was set at p < .05 FWE-correction with the cluster-level.
Greater activation in the precentral and postcentral gyri for pauses in L2 English compared to L1 Japanese (L2 English > L1 Japanese), identified via whole-brain analysis. The activation profiles show the mean percent signal change for each condition: EM = English mid-clause, EE = English end-clause, JM = Japanese mid-clause, JE = Japanese end-clause. Error bars represent the standard error of the mean (SEM).

Greater activation in the mPFC and right insula during pauses in L1 Japanese compared to L2 English (L1 Japanese > L2 English), as revealed by whole-brain analysis. The activation profiles show the mean percent signal change for each condition: EM = English mid-clause, EE = English end-clause, JM = Japanese mid-clause, JE = Japanese end-clause. Error bars represent the standard error of the mean (SEM).

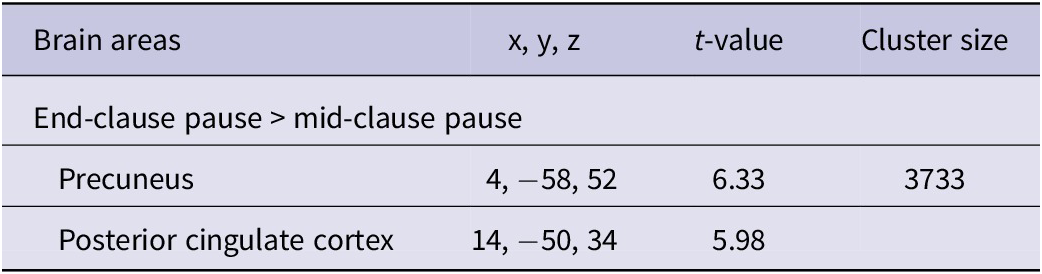
Regarding the main effect for pause location, as shown in Table 5 and illustrated in Figure 4, pauses at end-clause locations showed increased activation in the precuneus, extending into the posterior cingulate cortex, irrespective of the language used. In contrast, mid-clause pauses, when compared to end-clauses, did not elicit significantly greater activation at the whole-brain level. Because no significant interaction was found in the whole-brain analysis, subsequent ROI analyses were conducted to examine this interaction in predefined language-related regions with greater statistical sensitivity.
Brain areas exhibiting differential activation between pauses at end- and mid-clause pause locations

Notes. For each area, the coordinates (x, y, z) of the activation peak in MNI space, peak t-value and size of the activated cluster in number (k) of voxels (2 × 2 × 2 mm3) are shown for all subjects (n = 20). The threshold was set at p < .05 FWE-correction with the cluster-level.
Greater activation in the precuneus during pauses at end-clause positions compared to mid-clause positions (End-clause > Mid-clause), as revealed by whole-brain analysis. The activation profiles represent the mean percent signal change for each condition: EM = English mid-clause, EE = English end-clause, JM = Japanese mid-clause, JE = Japanese end-clause. Error bars indicate the standard error of the mean (SEM).

6.4. ROI analyses
Unlike the whole-brain analysis, the ROI-based analyses, focusing on the left IFG and AG, revealed significant interactions between language and pause position. That is, we identified region-specific effects, revealing distinct neural mechanisms for mid- and end-clause pausing in L1 versus L2 speech (see Figure 5).
Regions-of-interest (ROIs) and percent signal change across conditions. Significant interactions are visualised for the posterior IFG (pIFG) and the angular gyrus (AG). Left: ROI locations overlaid on a representative sagittal anatomical image. Two spherical ROIs (radius = 6 mm) were defined in the left hemisphere: the anterior IFG (aIFG, blue) and posterior IFG (pIFG, green). The angular gyrus (AG, red) was defined anatomically using the AAL mask. Right: Mean percent signal change in each ROI across pause conditions: EM = English mid-clause, EE = English end-clause, JM = Japanese mid-clause, and JE = Japanese end-clause (L2 English = orange; L1 Japanese = blue). Error bars indicate standard error of the mean (SEM). Asterisks denote statistically significant effects from the ROI analyses (p < .01, Language × Pause interaction: pIFG, F(1,19) = 12.51, η 2 = .397; AG, F(1,19) = 4.62, η 2 = .196).

As expected, we observed a significant interaction in the left posterior IFG (BA44), between language and pause position, F(1, 19) = 12.51, p = .0022, η 2 = .397. Post hoc comparisons showed that in L2 English, mid-clause pauses elicited significantly greater activation than end-clause pauses, F(1, 19) = 9.95, p = .0052, η 2 = .344. No significant effect was found in L1 Japanese, F(1, 19) = 2.07, p = .166. Taken together, these results indicate that the posterior IFG is more engaged during within-clause (mid-clause) pausing during L2 speech.
Although the interaction between language and pause position did not reach statistical significance for left anterior IFG (BA45), F(1, 19) = 3.40, p = .081, η 2 = .152, there was a trend towards greater activation for mid-clause compared to end-clause pauses in L2 English, consistent with the posterior IFG results (p = .059).
We also observed a significant language-by-pause position interaction in the left angular gyrus (AG), F(1, 19) = 4.62, p = .045, η 2 = .196. In L2 English, end-clause pauses evoked significantly greater activation than mid-clause pauses, F(1, 19) = 16.09, p = .0007, η 2 = .459. This effect was not significant in L1 Japanese, F(1, 19) = 3.19, p = .090.
Taken together, these ROI results indicate that the left posterior IFG is selectively recruited for processing mid-clause pauses, while the left AG is more engaged during end-clause pauses―both specifically in L2 English. No comparable effects were observed in L1 Japanese.
7. Discussion
The aim of this study was to identify the neural correlates of mid-clause and end-clause pausing in L1 and L2 speech. We proposed two hypotheses. First, we predicted that mid-clause pauses will correspond to heightened activation in language-related brain regions, with stronger effects observed in L2 speech production. Second, we hypothesised that end-clause pauses will be associated with increased activity in conceptualisation-related brain areas, with minimal variation across L1 and L2 speech. These hypotheses were inspired by prior behavioural research suggesting that mid-clause pauses reflect disruption in linguistic encoding processes, whereas end-clause pauses signal a focus on conceptualisation or the speaker planning their message. These conclusions, in turn, were derived from previous L1 research, which demonstrated that mid-clause pauses occur less frequently than end-clause pauses in L1 speech (e.g., Goldman-Eisler, Reference Goldman-Eisler1972; Pawley & Syder, Reference Pawley, Syder and Riggenbach2000). Additionally, the hypotheses were motivated by research comparing L1 and L2 speech, which found that mid-clause pauses are more common in L2 than L1 oral production, while end-clause pausing varies little across L1 and L2 speech (de Jong, Reference De Jong2016; Duran-Karaoz & Tavakoli, Reference Duran-Karaoz and Tavakoli2020; Felker et al., Reference Felker, Klockmann and De Jong2019; Foster & Tavakoli, Reference Foster and Tavakoli2009; Khang, Reference Khang2014; Riazantseva, Reference Riazantseva2001; Skehan et al., Reference Skehan, Foster and Shum2016; Skehan & Foster, Reference Skehan, Foster, Van Daele, Housen, Kuiken, Pierrard and Vedder2007; Tavakoli, Reference Tavakoli2011).
Since our hypotheses were deduced from these behavioural findings, we began by conducting a set of preliminary analyses to determine whether our dataset reflected the overall patterns identified in previous research. In line with prior research, we found that participants paused more frequently between than within clauses during L1 speech, but they paused considerably more often in mid-clause than in end-clause positions in L2 English. Additionally, we confirmed that mid-clause pauses occurred significantly more often in L2 than L1 speech production, whereas end-clause frequency was less influenced by whether participants spoke their first or second language. While pause location also had a minor effect on pause frequency in L1 Japanese (R2m = 0.15), this effect was markedly smaller than that observed for pause frequency in L2 English (R2m = 0.58). Based on these results and assuming alignment between our behavioural and neural measures, we anticipated that the neuroimaging findings would confirm our predictions.
Indeed, consistent with our first hypothesis, we found that mid-clause pauses were associated with enhanced activation in language-related brain areas, with more pronounced effects observed during L2 speech production. Specifically, increased brain activity was detected in the left posterior IFG (BA44) at mid-clause pause positions in L2. This region has been implicated in phonological encoding and verbal fluency (Costafreda et al., Reference Costafreda, Fu, Lee, Everitt, Brammer and David2006; Heim et al., Reference Heim, Eickhoff and Amunts2008; Restle et al., Reference Restle, Murakami and Ziemann2012), and also plays a broader role in the articulatory–syntactic interface during sentence production (Golestani et al., Reference Golestani, Xavier Alario, Meriaux, Bihan, Dehaene and Pallier2006). It is therefore unsurprising that greater neural engagement would be observed in these regions when participants spoke in their second language, given that linguistic encoding processes are typically less automatised for L2 speakers. These findings align with recent L2 sentence production studies, which have reported specific involvement of the left IFG in L2 as compared to L1 speech production (Wolna et al., Reference Wolna, Szewczyk, Diaz, Domagalik, Szwed and Wodniecka2024).
Our results yielded partial support for the second hypothesis we posed. As predicted, we observed increased activity in the precuneus at end-clause positions in both L1 and L2 speech production. This activation pattern directly supports our theoretical prediction and aligns with the well-documented involvement of the precuneus in conceptual planning and mentalising processes that support message-level formulation during speech production (Ferstl et al., Reference Ferstl, Neumann, Bogler and von Cramon2008; Sassa et al., Reference Sassa, Sugiura, Jeong, Horie, Sato and Kawashima2007; Smallwood et al., Reference Smallwood, Gorgolewski, Golchert, Ruby, Engen, Baird, Vinski, Schooler and Margulies2013). Consistent with this interpretation, a language effect was not anticipated, as macro-planning one’s message (Skehan et al., Reference Skehan, Foster and Shum2016)―a key process in the conceptualisation stage of speech production―does not rely on language-specific information, thus imposing comparable demands on both L1 and L2 speakers. This pattern also parallels the results of Jeong et al. (Reference Jeong, Sugiura, Suzuki, Sassa, Hashizume and Kawashima2016), which revealed heightened activation in the ToM network, including the precuneus, during communicative speech production in both L1 and L2.
It was contrary to our expectation, however, that we did detect also a difference in brain activation across participants’ L1 and L2 speech at end-clause positions. In L2 English, participants exhibited considerably higher brain activity in the left AG at end-clause than mid-clause locations, a trend less pronounced in L1 Japanese. The left AG is a brain area associated with concept retrieval and conceptual integration (Binder et al., Reference Binder, Desai, Graves and Conant2009). For example, Binder et al. (Reference Binder, Desai, Graves and Conant2009) identified the left AG as one of the most consistently activated regions across a wide range of semantic tasks, including word and sentence comprehension, reflecting its role as a cross-modal semantic convergence zone. Similarly, Seghier (Reference Seghier2013) has demonstrated that AG activation correlates with retrieval of concrete concepts and semantic associations. This robust evidence supports our interpretation that end-clause pauses in L2, which elicited stronger AG activation, likely reflect increased demands on concept retrieval during spontaneous speech. Therefore, a possible explanation for this pattern could be that participants, besides macro-planning, engaged in micro-planning during pauses between clauses with more conscious effort in L2 than in L1. Micro-planning, among other things, involves retrieving concepts to specify the preverbal plan that has been created during macro-planning. The conceptual features to deploy during micro-planning may be language dependent (e.g., perspective, tense; Kormos, Reference Kormos2006). Thus, in our study, retrieving language-specific conceptual information could have put extra pressure on participants when engaged in L2 task performance. To examine whether individual differences in English proficiency might have influenced this pattern, we computed correlations between participants’ Oxford Placement Test (listening) scores and mean activation in the left AG. No significant correlation was found, suggesting that proficiency did not influence the observed neural effects (r = –.20, p = .40). As the Oxford Placement Test mainly reflects receptive ability, future research should consider productive measures of L2 proficiency―such as lexical diversity or message-level complexity in spontaneous speech―that may be more closely related to neural activation.
In addition, it is worth highlighting that during both mid-clause and end-clause pauses, participants showed greater activation in the left precentral and postcentral gyri in L2 English compared to L1 Japanese. This finding is not surprising, as these regions are known to support phonological encoding and speech motor planning (Bohland et al., Reference Bohland, Bullock and Guenther2010; Long et al., Reference Long, Katlowitz, Svirsky, Clary, Byun, Majaj, Oya, Howard and Greenlee2016), processes that are likely to impose greater demands when speaking one’s L2 rather than L1.
Notably, we also observed greater activation in the mPFC and right insula during L1 Japanese speech compared to L2 English. Both regions have been implicated in a broad range of socio-affective and interoceptive functions, supporting self-referential and emotional awareness during communication (Amodio & Frith, Reference Amodio and Frith2006; Craig, Reference Craig2009). Given the nature of the task, which required participants to reflect on their actions during a hypothetical natural disaster, this heightened activation in L1 may reflect deeper affective or self-referential engagement when speaking in one’s native language. The mPFC is particularly associated with self-referential and social perspective-taking processes, which may have been more strongly engaged in L1 speech. The insula is involved in both emotional awareness and speech–motor regulation (Ackermann & Riecker, Reference Ackermann and Riecker2004; Craig, Reference Craig2009), suggesting stronger integration of affective and articulatory processes during spontaneous speech in L1. This interpretation aligns with previous behavioural and neurocognitive accounts showing reduced emotional resonance and social-perspective taking in L2 compared to L1 (e.g., Dewaele, Reference Dewaele2010; Harris et al., Reference Harris, Berko Gleason, Aycicegi-Dinn and Pavlenko2006; Kazanas et al., Reference Kazanas, McLean, Altarriba, Schwieter and Paradis2019). At the same time, language-specific phonological, prosodic, or sociocultural factors may also contribute to this L1–L2 difference, although such explanations remain speculative. Because the present study did not include behavioural measures directly indexing these processes, including emotional valence, the precise source of the L1-related increase remains uncertain. Future work should therefore examine these possibilities more directly by incorporating measures of emotional, phonological, or sociocultural engagement during L1 and L2 speech production.
Finally, it is important to emphasise that integrating behavioural and neural data enabled us to reach more robust and detailed conclusions about speech production processes than either dataset would have allowed for on its own. While the behavioural and neural findings were largely convergent and thereby helped identify the neural correlates of speech production processes, the neural data also generated information that the behavioural measures alone were not sensitive enough to capture. If we had relied solely on an analysis of pausing patterns, we might have overlooked language-specific differences in concept retrieval at end-clause pause positions. Overall, our findings highlight the importance of combining neural and behavioural data to achieve a fuller understanding of the neurocognitive mechanisms underlying L1 and L2 speech production.
8. Limitations and future directions
Before drawing our conclusions, it is important to consider the limitations of this research and potential directions for future research. First, while fMRI data offer valuable information about speech production processes, the ecological validity of our findings is limited. Clearly, engaging in oral tasks in an fMRI machine differs substantially from speaking in real-life contexts. Second, we have gathered no information about participants’ conscious thought processes; triangulating neuroimaging data with verbal protocols (e.g., stimulated recall) could help gain a more fine-grained picture of the processes involved in L1 and L2 speech production. A further weakness of the study is its relatively small sample size. Given the repeated-measures design and within-subject independent variables, we were able to identify medium effect sizes 90% of the time according to G-Power, but a sample size of 20 was not large enough to identify small effects. Therefore, future replications involving a larger participant pool are warranted to confirm the findings obtained here. Another worthwhile research direction would be to adopt a more detailed approach to coding pause locations (e.g., incorporating parts of speech information) and investigate the corresponding cognitive and neural processes in L1 versus L2 speech production. Finally, as the participants in this study were all Japanese users of L2 English completing a single task type, future studies are needed to examine whether the patterns observed here would generalise to speakers of different first and second languages and to other types of tasks.
9. Conclusion
This study is among the first to investigate the neural correlates of pausing in L1 and L2 spontaneous speech production and to model pause positions, specifically mid-clause and end-clause, within a neurocognitive framework. Using a combination of behavioural speech analysis and fMRI scanning, we found that mid-clause pauses were linked to increased activation in language-related brain regions, with stronger effects observed for L2 speech production. We also observed heightened brain activity in conceptualisation-related brain areas at end-clause positions in both first and second language speech. Notably, in L2 English, participants displayed considerably greater activation in a brain region associated with concept retrieval between clauses than within clauses, a trend that was less pronounced in L1 Japanese.
Importantly, this study provides objective neural evidence for the theorised links between pausing behaviours and the stages of online speech production, offering empirical support for cognitive models that distinguish between linguistic encoding and message-level planning processes. The neuroimaging data yielded insights beyond what was captured through speech analysis alone. Therefore, beyond identifying the neural correlates of mid-clause and end-clause pausing, our findings underscore the value of integrating neural and behavioural data to gain a more comprehensive understanding of the neurocognitive processes underlying L1 and L2 speech production.
Supplementary material
The supplementary material for this article can be found at http://doi.org/10.1017/S1366728926101011.
Data availability statement
The elicitation materials used in this study are available at https://www.iris-database.org/details/gsCp3-6k9Ej. The data and analysis scripts that support the findings of this study are available from the corresponding authors upon request.
Acknowledgements
This research was supported by the UCL-Tohoku University Strategic Partner Funds; the Designated National University Core Research Cluster of Disaster Science, Tohoku University, Japan; JSPS KAKENHI Grant Number 23K21946; and the ESRC-AHRC UK-Japan SSH Connections Grants (ES/S013024/1).
Competing interests
The authors declare none.


 Open access