





1. Introduction
The standard signature for sawtooth oscillations in a toroidal confinement device is a gradual temperature increase in the core followed by a fast crash. First reported in the ST tokamak (von Goeler, Stodiek & Sauthoff Reference von Goeler, Stodiek and Sauthoff1974), they have also been observed in stellarators (Carreras et al. Reference Carreras, Lynch, Zushi, Ichiguchi and Wakatani1998; Takagi et al. Reference Takagi, Toi, Takechi, Murakami, Tanaka, Nishimura, Isobe, Matsuoka, Minami and Okamura2004; Varela, Watanabe & Ohdachi Reference Varela, Watanabe and Ohdachi2012). During the crash, there is heat redistribution and temperature flattening in the core. On tokamaks, sawteeth both degrade confinement (through enhanced transport) and seed neoclassical tearing modes (Sauter et al. Reference Sauter, La Haye, Chang, Gates, Kamada, Zohm, Bondeson, Boucher, Callen and Chu1997; La Haye Reference La Haye2006). On the stellarator side, W7-X has observed sawtooth and sawtooth-like crashes in discharges with a strong electron cyclotron current drive (ECCD) (Zanini et al. Reference Zanini, Laqua, Thomsen, Stange, Brandt, Braune, Brunner, Fuchert, Hirsch and Knauer2020; Aleynikova et al. Reference Aleynikova, Hudson, Helander, Kumar, Geiger, Hirsch, Loizu, Nührenberg, Rahbarnia and Qu2021). ECCD is used in W7-X as one strategy to balance the bootstrap current and obtain a low-shear configuration with a set of magnetic islands at the plasma edge that function as a divertor. ECCD application may locally modify the rotational transform (the ratio of poloidal over toroidal turns along a magnetic field line) profile and render the plasma susceptible to magnetohydrodynamic (MHD) instabilities. ECCD-induced sawtooth crashes affect the strike lines’ position on divertor plates, and their understanding is vital to avoid component damage.
The Kadomtsev (Reference Kadomtsev1975) model is a standard description of sawteeth in tokamaks. In Kadomtsev's theory, a tokamak with an on-axis safety factor ($q_0$ ) below unity leads to an $n = m = 1$
 internal kink mode, whose evolution causes the flattening of the central temperature and current density until $q_0 >1$
 . After that, a temperature-dependent Spitzer resistivity ensures that current accumulates in the core until the on-axis safety factor drops below unity again, and the process repeats.
The Compact Toroidal Hybrid (CTH) experiment (Hartwell et al. Reference Hartwell, Knowlton, Hanson, Ennis and Maurer2017) is a current-carrying five-field-period ($N_{f p} = 5$ ) stellarator in which a variable external rotational transform enables the study of the effect of 3D magnetic fields on MHD stability. In CTH, the rotational transform (${\raise.3pt-\kern-5pt\iota}$
 ) is due to the magnetic field generated both by plasma current and external coil current. The plasma current is driven inductively, its rotational transform contribution is denoted by ${\raise.3pt-\kern-5pt\iota} _{\text {plasma}}$
 . The vacuum or external transform, ${\raise.3pt-\kern-5pt\iota} _{\text {ext}}$
 , can be independently controlled by currents in the helical and toroidal field coils. At the plasma edge, the value of the external transform can be set to be in the $0.02 < {\raise.3pt-\kern-5pt\iota} _{\text {ext}} < 0.3$
 range. CTH power supplies are inadequate to operate as a tokamak, i.e. with ${\raise.3pt-\kern-5pt\iota} _{\text {ext}} = 0$
 . Numerically, it is possible to consider hypothetical configurations with $0 \leq {\raise.3pt-\kern-5pt\iota} _{\text {ext}} \leq 0.02$
 . The rotational transform is given by the sum ${\raise.3pt-\kern-5pt\iota} = {\raise.3pt-\kern-5pt\iota} _{\text {plasma}} + {\raise.3pt-\kern-5pt\iota} _{\text {ext}}$
 , and the safety factor is the inverse of the rotational transform ($q=1/{\raise.3pt-\kern-5pt\iota}$
 ).
).
Experimental (Herfindal et al. Reference Herfindal, Maurer, Hartwell, Ennis, Hanson, Knowlton, Ma, Pandya, Roberds and Traverso2019) and computational (Roberds et al. Reference Roberds, Guazzotto, Hanson, Herfindal, Howell, Maurer and Sovinec2016) studies have evaluated the effect of external rotational transform on the sawtooth instability in CTH's stellarator scenarios (i.e. scenarios with non-zero ${\raise.3pt-\kern-5pt\iota} _{\text {ext}}$ ). Experiments show a reduction in the sawtooth amplitude and an increase in the sawtooth period as ${\raise.3pt-\kern-5pt\iota} _{\text {ext}}$
 is increased (Herfindal et al. Reference Herfindal, Maurer, Hartwell, Ennis, Hanson, Knowlton, Ma, Pandya, Roberds and Traverso2019). The latter observation is computationally reproduced in Roberds et al. (Reference Roberds, Guazzotto, Hanson, Herfindal, Howell, Maurer and Sovinec2016). This work revisits 3D nonlinear NIMROD simulations of sawtooth oscillations in CTH (Roberds et al. Reference Roberds, Guazzotto, Hanson, Herfindal, Howell, Maurer and Sovinec2016). We analyse these simulations with tools based on the dynamics of fixed points and the energy transfer between toroidal Fourier modes. We conclude that the fixed-point dynamics during sawtooth oscillations in tokamak and stellarator scenarios are similar. However, the stellarator fields modulate the energy transfer between Fourier modes in the stellarator configuration.
A new search algorithm that locates fixed points and calculates their associated Greene's residues in NIMROD improves the description of sawtooth cycles in CTH. Fixed points result from the intersection of a closed magnetic field line with a Poincaré cross-section. An important quantity characterising a fixed point is the Greene's residue (Greene Reference Greene1968, Reference Greene1979). The Greene's residue of a thin magnetic island monotonically increases with its width; the residue has been employed as a proxy for the degree of stochasticity of stellarator vacuum magnetic fields (Hanson & Cary Reference Hanson and Cary1984; Cary & Hanson Reference Cary and Hanson1986). In this work, the determination of fixed points, Greene's residues and local values for the rotational transform result in a description of sawtooth oscillations in CTH consistent with Kadomtsev's model. The present analysis may be considered a generalisation of the fixed-point tokamak sawtooth picture of Smiet, Kramer & Hudson (Reference Smiet, Kramer and Hudson2019) to the stellarator case.
This article addresses the observed increased sawtooth frequency with 3D shaping (Herfindal et al. Reference Herfindal, Maurer, Hartwell, Ennis, Hanson, Knowlton, Ma, Pandya, Roberds and Traverso2019). A power-transfer analysis is utilised to investigate how energy is deposited into the sawtooth instability and redistributed within the instability. This analysis determines that stellarator fields have a two-fold effect on the sawtooth instability growth. On the one hand, stellarator fields damp that sawtooth instability linear growth, implying a stabilising effect. On the other hand, stellarator fields catalyse energy transfer from large-to-small scales. It is hypothesised that this transfer of energy to small scales effectively enhances the reconnection rate, which would increase the growth rate and the sawtooth frequency.
The power-transfer diagnostic was introduced by Ho & Craddock (Reference Ho and Craddock1991) during the exploration of the conversion of poloidal magnetic field into toroidal magnetic field (the dynamo effect) in a reversed-field pinch (RFP). It is a diagnostic tool that focuses on the dynamics of specific Fourier modes. Their framework expresses the time rate of change of the Fourier mode energy as a superposition of quasilinear, nonlinear and dissipative power-transfer terms. This analysis allowed them to ‘piece together a picture of the flow of power through Fourier space’ and has become a standard diagnostic tool (Sovinec Reference Sovinec1995; Choi et al. Reference Choi, Craig, Ebrahimi and Prager2006; Reynolds, Sovinec & Prager Reference Reynolds, Sovinec and Prager2008; Futch et al. Reference Futch, Craig, Hesse and Jacobson2018; Howell et al. Reference Howell, King, Kruger, Callen, La Haye and Wilcox2022). This article adapts the power-transfer analysis to a 3D equilibrium. Here, it is recognised that the nonlinear Lorentz power transfer obeys a specific energy conservation relation, allowing unequivocal characterisation of energy transfer between toroidal Fourier modes, including those that characterise a sawtooth oscillation in a 3D equilibrium.
The rest of the paper is organised as follows. Section 2 summarises previous work on sawtooth oscillations in CTH. Section 3 introduces the power-transfer analysis tool in the context of a 3D equilibrium, and shows that the Lorentz power-transfer coefficient is unambiguously interpretable as transfer of energy between two toroidal Fourier modes. Section 4 discusses the dynamics of fixed points during sawtooth oscillations. Section 5 considers the energy transfer between Fourier modes. A final discussion is provided in § 6.
2. Sawtooth oscillations in CTH
This work reconsiders CTH sawtooth NIMROD simulations with increasing levels of 3D shaping (Roberds et al. Reference Roberds, Guazzotto, Hanson, Herfindal, Howell, Maurer and Sovinec2016). Our focus is on comparing a tokamak plasma with a stellarator configuration using new analysis tools. This section summarises experimental (Herfindal et al. Reference Herfindal, Maurer, Hartwell, Ennis, Hanson, Knowlton, Ma, Pandya, Roberds and Traverso2019) and computational (Roberds et al. Reference Roberds, Guazzotto, Hanson, Herfindal, Howell, Maurer and Sovinec2016) work that evaluates the effect of 3D shaping on sawtooth simulations in CTH.
The CTH vacuum vessel is circularly shaped with a minor radius $a = 0.3\,{\rm m}$ and a major radius $R_o = 0.75\,{\rm m}$
 . The degree of 3D shaping is quantified by the amount of external rotational transform relative to the total transform, $h_{3D} = {\raise.3pt-\kern-5pt\iota} _{\text {ext}}/({\raise.3pt-\kern-5pt\iota} _{\text {plasma}} + {\raise.3pt-\kern-5pt\iota} _{\text {ext}} )$
 evaluated at the plasma edge. The value $h_{3D}=0$
 corresponds to a tokamak, in which the rotational transform is generated entirely by ohmically driven currents, whereas $h_{3D}=1$
 represents a current-free stellarator. Herfindal et al. (Reference Herfindal, Maurer, Hartwell, Ennis, Hanson, Knowlton, Ma, Pandya, Roberds and Traverso2019) have performed a systematic study of the effects of 3D shaping on CTH sawtooth oscillations by varying the fractional rotational transform in the $h_{3D}=0.04-0.42$
 range. The configurations have tokamak-like profiles for the safety factor, with an on-axis safety factor around unity that monotonically increases to an edge value between 1.6 and 5. The line-averaged electron density varies in the $n_e = 0.6-3.5\times 10^{19}\,{\rm m}^{-3}$
 range and the peak plasma current in the range from 15 to 60 kA. In CTH, a typical value for the on-axis magnetic field is 0.5 T and for the electron temperature is 200 eV.
Experiments report that the sawtooth oscillation frequency increases with the degree of 3D shaping. As measured from soft X-ray (SXR) emission of the plasma core, a sawtooth signal consists of a slow rise (the ramp-up phase) and a subsequent fast drop (the crash phase). However, there is no correlation between the crash time and the fractional rotational transform, and the increased sawtooth frequency can be attributed to a faster ramp-up.
Roberds et al. (Reference Roberds, Guazzotto, Hanson, Herfindal, Howell, Maurer and Sovinec2016) simulate sawtooth oscillations in CTH current-carrying stellarator using NIMROD (Sovinec et al. Reference Sovinec, Glasser, Gianakon, Barnes, Nebel, Kruger, Plimpton, Tarditi and Chu2004). The plasma model consists of an MHD system of equations with Spitzer resistivity and anisotropic thermal conduction. Simulations are initialised with equilibria from the Variational Moments Equilibrium Code (VMEC) and are run by applying toroidal loop voltage at the plasma surface, which drives plasma currents typical in CTH. The role of 3D shaping is investigated by considering a set of four configurations with increasing values for the external rotational transform, ${\raise.3pt-\kern-5pt\iota} _{\text {ext}}=0.0, 0.0134, 0.0333$ and $0.0970$
 . For these scenarios, approximate values for $h_{3D}$
 computed right after the first sawtooth crash are $h_{3D}\sim 0.0, 0.03, 0.07 \text{ and } 0.16$
 .
.
The sawtooth frequency increase with 3D shaping has been retrieved from simulations of CTH. It is shown that the $n=1$ energy grows faster for configurations with higher ${\raise.3pt-\kern-5pt\iota} _{\text {ext}}$
 , suggesting that equilibrium modifications lead to a faster linear growth rate. For all ${\raise.3pt-\kern-5pt\iota} _{\text {ext}}$
 cases, the linear growth rate is demonstrated to be proportional to $S^{-2/3}$
 , where $S$
 in the Lundquist number, which is in agreement with the linear growth rate of the resistive internal kink mode (Coppi et al. Reference Coppi, Galvao, Pellat, Rosenbluth and Rutherford1976; Ara et al. Reference Ara, Basu, Coppi, Laval, Rosenbluth and Waddell1978).
3. Power-transfer analysis and the Lorentz power-transfer triad coefficients
This paper focuses on understanding the effect of 3D magnetic fields on the sawtooth instability. In a CTH's hybrid configuration, the stellarator fields modulate the energy transfer that drives the sawtooth instability. This section includes a recap of Ho & Craddock (Reference Ho and Craddock1991) energy-transfer analysis tailored towards a generalisation for 3D geometry. The generalisation introduces the Lorentz power-transfer triad coefficients, which capture nonlinear interactions among Fourier modes, including those associated with stellarator fields.
The generalisation of the power-transfer analysis to a 3D equilibrium requires a consistent usage of the concepts of linear eigenmode and toroidal Fourier mode. A linear eigenmode is an eigenmode of the linearised extended MHD system of equations. Given $(R, Z, \varphi )$ cylindrical coordinates, for a scalar field $g(R,Z,\varphi,t)$
 , the toroidal Fourier mode $g_n(R,Z,t) {\rm e}^{{\rm i}n \varphi }$
 originates from the standard decomposition

The index $n$ is the toroidal mode number. For a 3D vector field

a toroidal Fourier mode, $\boldsymbol {g}_n(R,Z,\varphi,t) {\rm e}^{{\rm i}n \varphi }$ , results from the decomposition of each scalar component, so that

For an axisymmetric equilibrium, a linear eigenmode is associated with a single toroidal mode number $n$ ; the internal $n=1$
 kink mode corresponding to a sawtooth instability in a tokamak is an example. In contrast, if the equilibrium possesses 3D features, a linear eigenmode has as projection onto multiple Fourier modes. In summary, $n$
 is a good quantum number when the equilibrium is axisymmetric (Spong Reference Spong2015).
Toroidal Fourier modes are linearly coupled for a 3D equilibrium state, but they are not linearly coupled for an axisymmetric state (nonlinear effects couple Fourier modes in both cases). For a genuinely 3D equilibrium state with no symmetries whatsoever, linear coupling of the Fourier modes extends over the entire toroidal mode spectrum: $n = -\infty,\ldots,0,\ldots,+\infty$ . When the equilibrium possesses field-periodicity (as in CTH and other stellarators), the spectrum reduces to specific bands, known as mode families. A 3D equilibrium with a field period of $N_{\text {fp}}$
 can be expressed as a superposition of Fourier modes restricted to the toroidal mode numbers $k N_{\text {fp}}$
 for $k$
 an integer ($k \in \mathbb {Z}$
 ). Likewise, the Fourier decomposition of a linear eigenmode for which $\boldsymbol {g}_n \neq 0$
 (for some $n$
 ) requires the superposition of all toroidal Fourier modes $\boldsymbol {g}_{n'}$
 that satisfy the constraint $n'=n + k N_{\text {fp}}$
 for $k \in \mathbb {Z}$
 . CTH is a five-field period device ($N_{\text {fp}}=5$
 ) and its banded structure consists of three families: a symmetry-preserving family, $n = k N_{\text {fp}}$
 , and two symmetry-breaking ones, $n=k N_{\text {fp}}\pm 1, k N_{\text {fp}}\pm 2$
 . The internal kink linear eigenmode responsible for the sawtooth activity in CTH includes the complete $k N_{\text {fp}}\pm 1$
 family (Roberds et al. Reference Roberds, Guazzotto, Hanson, Herfindal, Howell, Maurer and Sovinec2016), and not just the $n=1$
 toroidal Fourier mode, as in a tokamak. Henceforth, the $n=k N_{\text {fp}}\pm 1$
 family is referred to as the $\pm 1$
 fields, whereas the $n=k N_{\text {fp}}\pm 2$
 family is referred to as the ${\pm }2$
 fields. In addition, when referring to the $n=\pm 5, \pm 10, \pm 15,\ldots$
 Fourier modes, excluding $n=0$
 , the terms higher-order symmetry-preserving fields or stellarator fields are used.
In this work, the power-transfer analysis is based upon assigning an energy content to each toroidal Fourier mode and quantifying the energy exchange between these modes. The standard definition of the total energy of a plasma involves an integral over internal, magnetic and kinetic energy density contributions:

Here, $V$ is the confinement volume, ${\rm d}A$
 is a poloidal cross-sectional differential of area and $\gamma$
 is the adiabatic constant (taken as $\gamma =5/3$
 in this work). To sort the total energy into contributions assigned to each toroidal mode, the starting point is to Fourier expand the pressure, magnetic, velocity and mass density fields in (3.4). During the evolution of the sawtooth simulations analysed in this work, non-axisymmetric Fourier mass density components ($\rho _k,\ \text {for}\ k\neq 0$
 ) are smaller than its axisymmetric part ($\rho _0)$
 . To leading order in the mass density, the plasma energy may be Fourier expanded as

where superscript ${*}$ indicates a complex conjugate. The internal, magnetic and kinetic energy densities are linear, quadratic and cubic in the fields ($p$
 , $\rho$
 , $\boldsymbol {B}$
 and $\boldsymbol {V}$
 ), respectively. Accordingly, the Fourier mode decomposition of their constitutive fields leads to a single, a double and a triple sum, in that order. In (3.5), the triple sum originating from the kinetic energy density is a higher-order term, included in $O(\rho _k/\rho _0)$
 . During the toroidal integration of (3.5), only the $n=0$
 pressure component and the $q = n$
 magnetic and kinetic terms survive. Toroidal integration yields the desired energy splitting:

Here, the (leading-order) plasma energy associated with the $n$ th Fourier mode is defined as an integral over the poloidal cross-section ($A$
 ):
):

The Kronecker delta $\delta _{0,n}$ ensures that the internal energy contributes only when $n=0$
 . Note that the index $n$
 in $E_n$
 indicates that the integrand in (3.7) contains only the toroidal Fourier mode $n$
 of the fields $p$
 , $\boldsymbol {B}$
 and $\boldsymbol {V}$
 .
.
A positive power transfer represents the addition of energy into a Fourier mode, which corresponds to mode growth, whereas a negative power transfer supports mode damping. For this reason, power transfers are used to track the Fourier mode energy time evolution. The power transfers that modify the internal, magnetic and kinetic Fourier mode energies are obtained from the time evolution equations. In this work, different energy types are lumped together into the Fourier mode energy ($E_n$ in (3.7)); accordingly, the power transfers that determine the rate of change of the internal, magnetic and kinetic Fourier mode energies are combined into a single equation for the time evolution of $E_n$
 .
.
The Fourier mode energy time evolution is controlled by a competition between power-transfer contributions, each with concrete physical meaning. The governing equation for the time rate of $E_n$ , and definite expressions for the power transfers, are given in appendix A. The Lorentz power ($P_{L_{n}}$
 ) captures the nonlinear interaction among Fourier modes and, in particular, the current drive for instabilities. The resistive dissipation power ($P_{\eta _{n}}$
 ) represents the dissipation due to a Spitzer resistivity that is fully dependent on position through the electron temperature. The Poynting flux ($P_{{\rm PF}_{n}}$
 ) is a conservative term that tracks energy flux across the plasma boundary; it captures the effect of the imposed loop voltage that drives CTH's ohmic currents. The viscous dissipation ($P_{\varPi _{n}}$
 ) represents the power associated with the viscous stress tensor; it is negligible in this work. Additional power transfers are the pressure gradient ($P_{{\boldsymbol {\nabla } p}_{n}}$
 ) and the centre-of-mass advection ($P_{A_{n}}$
 ).
).
The Lorentz power drives the sawtooth oscillation linear growth and it is the central quantity in our analysis. Its analytic expression,

indicates that it is due to the $\boldsymbol {J} \times \boldsymbol {B}$ Lorentz force and the $\boldsymbol {V} \times \boldsymbol {B}$
 induced electric field. In (3.8), ${\rm c.c.}$
 indicates the complex conjugate of the previous terms. For conciseness, $P_{L_{n}}$
 is referred to as the Lorentz power. The Lorentz force drives the kinetic energy growth, whereas the induced electric field controls the evolution of the magnetic energy. Here $P_{L_{n}}$
 lumps together the Lorentz force and the induced electric field in the same way as $E_n$
 combines different energy types.
The terms $(\boldsymbol {J} \times \boldsymbol {B})_n$ and $(\boldsymbol {V} \times \boldsymbol {B})_n$
 in (3.8) can be expanded as the sum

with $\boldsymbol {A}=\boldsymbol {J}$ or $\boldsymbol {A}=\boldsymbol {V}$
 . We define

so that

Note that the middle index in $f_{a,b,c}$ is the index of the magnetic field. The triad (or three-wave-coupling) coefficient $f_{n,(n-n'),n'}$
 tracks the energy flowing into $E_n$
 due to fields with toroidal Fourier numbers $n'$
 and $n-n'$
 . Without further information, however, one does not know what portion of this energy flow comes from mode $n'$
 and what portion from mode $n-n'$
 . A direct calculation shows that $f_{n,(n-n'),n'}=-f_{n',(n'-n),n}$
 implying that we can unambiguously interpret $f_{n,(n-n'),n'}$
 as an energy flow from mode $n'$
 to mode $n$
 : the energy gained by mode $n$
 ($f_{n,(n-n'),n'}$
 ) is lost by mode $n'$
 ($-f_{n',(n'-n),n}$
 ). The magnetic field $\boldsymbol {B}_{n-n'}$
 is unchanged by the interaction, and acts as a catalyst for the energy transfer between modes $n'$
 and $n$
 .
.
4. Magnetic field topology during sawtooth oscillations
This section expands the analysis of Roberds et al. (Reference Roberds, Guazzotto, Hanson, Herfindal, Howell, Maurer and Sovinec2016) by accurately tracking order-1 fixed points during sawtooth cycles. The analysis starts with an in-depth description of the first sawtooth cycle for the tokamak case (${\raise.3pt-\kern-5pt\iota} _{\text {ext}} = 0$ ), followed by a comparison of the tokamak versus the stellarator configurations. It is concluded that 3D shaping does not significantly modify the fixed-point picture of a sawtooth instability in a current-carrying stellarator.
4.1. First sawtooth cycle: a prolonged initial instability growth and first crash
Determining fixed points and associated quantities enables the study of topological changes in the magnetic field during sawtooth cycles. Early during the sawtooth cycle's ramp-up phase, the magnetic axis bifurcates into three fixed points, two $o$ -points and an $x$
 -point. One $o$
 -point and the $x$
 -point correspond to the $o$
 -point and $x$
 -point of a newly formed magnetic island. The second $o$
 -point is the original magnetic axis. This bifurcation happens as the on-axis safety factor drops below unity and a $q=1$
 surface emerges. In Kadomtsev's theory, a growing $m=n=1$
 resistive internal kink causes the $q=1$
 surface to shrink and to expel energy to outer regions. The crash phase ends with the coalescence of the central $o$
 -point with the $x$
 -point, leaving the $m=n=1$
 island centre as the new magnetic axis and $q>1$
 everywhere. A temperature-dependent Spitzer resistivity leads to a subsequent current peaking in the core until $q_0<1$
 again, restarting the cycle. This section analyses topological changes in the magnetic field by accurately tracking the position, safety factor and Greene's residue of all relevant fixed points during sawtooth oscillations of the tokamak simulation.
An accurate description of the topological changes during a sawtooth cycle requires an accurate determination of order-1 fixed points and their safety factors. This can be accomplished with a fixed-point finder algorithm such as that described by Hanson & Cary (Reference Hanson and Cary1984). The algorithm tracks magnetic field lines via the return map, which follows the magnetic flow from one Poincaré surface back to the same surface. A fixed point of order $n$ is defined as an invariant point of the map that results from applying the return map $n$
 times. These points can be determined to high accuracy using a Newton's method. The linearisation of the return map results in the tangent map, and the behaviour of the tangent map in the neighbourhood of a fixed point is described by either its eigenvalue or, equivalently, by its Greene's residue (Greene Reference Greene1968, Reference Greene1979). A Greene's residue ($R_g$
 ) characterisation of the tangent map is physically advantageous. For example, the island width of a thin island is proportional to $\sqrt {R_g}$
 , where $R_g$
 is the Greene's residue of the island centre. More importantly, the Greene's residue of a fixed point and the safety factor at that location are related by $\cos (2{\rm \pi} /q) = 1-2R_g$
 . In summary: during a sawtooth cycle order-1 fixed points are accurately determined using Newton's method and that is followed by the evaluation of their Greene's residues and safety factors.
Figure 1 shows the initial growth and two more sawtooth oscillations for the tokamak (${\raise.3pt-\kern-5pt\iota} _{\text {ext}} = 0$ ) simulation. This figure depicts a prolonged ($\sim$
 3 ms) first cycle from 4.5 ms up to approximately 7.5 ms, followed by two shorter ($\sim$
 0.5 ms) oscillations. Figure 1(a) shows the electron temperature measured at the initial location of the magnetic axis. Figure 1(b) illustrates the volume-integrated energy content of successively higher toroidal Fourier modes, as given by (3.7). Here $n=0$
 corresponds to the axisymmetric fields, whereas $n=1$
 is the growing internal kink responsible for the temperature crash. Figure 1(c) shows the safety factor of order-1 $o$
 -points. Figure 1(d) shows the major radius of fixed points at the $\varphi =0$
 plane. In this plane, the $Z$
 coordinates of the order-1 fixed points are very close to zero. Figure 1(e) gives the Greene's residue of these fixed points. The ramp-up phase of the first sawtooth cycle is bounded by the first and second vertical dashed lines; the first crash phase is bounded by the second and third vertical dashed lines. The determination of fixed points and related quantities allows to accurately specify the instants when $q_0$
 crosses 1.
Sawtooth oscillations for a tokamak (${\raise.3pt-\kern-5pt\iota} _{\text {ext}} = 0$ ). The simulation consists of a prolonged first cycle from 4.5 ms to approximately 7.5 ms, followed by a sequence of more frequent cycles. The panels correspond to (a) the electron temperature ($T_e$
 ) at the location of equilibrium magnetic axis for $\varphi =0$
 , (b) the volume integrated magnetic plus kinetic Fourier mode energies, (c) the safety factor, (d) the fixed-point $R$
 coordinate and (e) the Greene's residue. Panels (c–e) follow order-1 fixed points on the $\varphi =0$
 plane. Their $Z$
 coordinate is vanishingly small and is not shown. Red and green solid traces identify $o$
 -points, whereas dashed blue traces recognise $x$
 -points. Blue traces do not appear in panel (c), as the safety factor is undefined for $x$
 -points. The ramp-up phase of the first sawtooth cycle is bounded by the first and second vertical dashed lines; the crash phase is bounded by the second and third vertical dashed lines.

Initially (4.5 ms), the configuration possesses a set of good nested magnetic surfaces and a safety factor at the magnetic axis that is greater than unity ($q_0 = 1.01$ in figure 1c). As the simulation progresses, the magnetic axis safety factor (green line in figure 1c) decreases due to a peaking of the current profile in the less-resistive hotter core plasma. The Greene's residue (green line figure 1e) associated with the magnetic axis also decreases. This trend continues until 4.7 ms, when $q$
 drops below one, the residue drops to zero and a fixed-point bifurcation occurs (first dashed vertical line in figure 1). For a given $o$
 -point, its Greene's residue ($R_g$
 ) and safety factor are related by $\cos (2{\rm \pi} /q)=1-2R_g$
 ; $R_g = 0$
 is consistent with $q=1$
 . The emergence of a $q=1$
 surface is signaled by the bifurcation event that produces an $o$
 –$x$
–$x$ fixed-point pair. For $\varphi =0$
 , figure 1(d) shows that the $o$
 -point ($x$
 -point) originates in the outboard (inboard) side of the poloidal cross-section.
The ramp-up phase begins at 4.7 ms and lasts until approximately 7.5 ms. The first indication of the resistive internal kink is the appearance of the $o$ –$x$
–$x$ pair in the Greene's residue plot at 4.7 ms. In contrast, the $n=1$
 mode energy plot does not register the instability onset, and the mode growth is masked under numerical noise. The $n=1$
 growth in the energy is first seen at 5.7 ms. The residues for the $o$
 –$x$
–$x$ fixed-point pair remain at a numerical noise level of approximately $10^{-9}$
 until 6.5 ms. During the ramp-up, the $o$
 –$x$
–$x$ fixed-point pair separate, indicating an expansion of the $q = 1$
 surface.
The sawtooth crash begins just before 7.5 ms. First, we see that the electron temperature peaks at 7.43 ms (second vertical dashed line in figure 1). Then the $n=1$ energy reaches a maximum at 7.55 ms. Shortly thereafter there is a bifurcation where the $o$
 –$x$
–$x$ fixed points coalesce at 7.58 ms (third vertical dashed line in figure 1). The coalescence is illustrated in figure 1(d) by the mutual destruction of a solid green trace with a dashed blue trace. After the coalescence, the centre of the growing island has become the new magnetic axis (red trace of figure 1d), and it is located roughly in the same position as the original magnetic axis. The fast electron temperature decrease and the subsequent reconnection process are known as the sawtooth crash. After the crash, the safety factor at the new magnetic axis is greater than unity (red trace in figure 1c). From then on, there is a sequence of sawtooth oscillations, and figure 1 displays two of them, from 7.6 to 8.6 ms.
4.2. Tokamak and stellarator simulations: analogous fixed-point picture
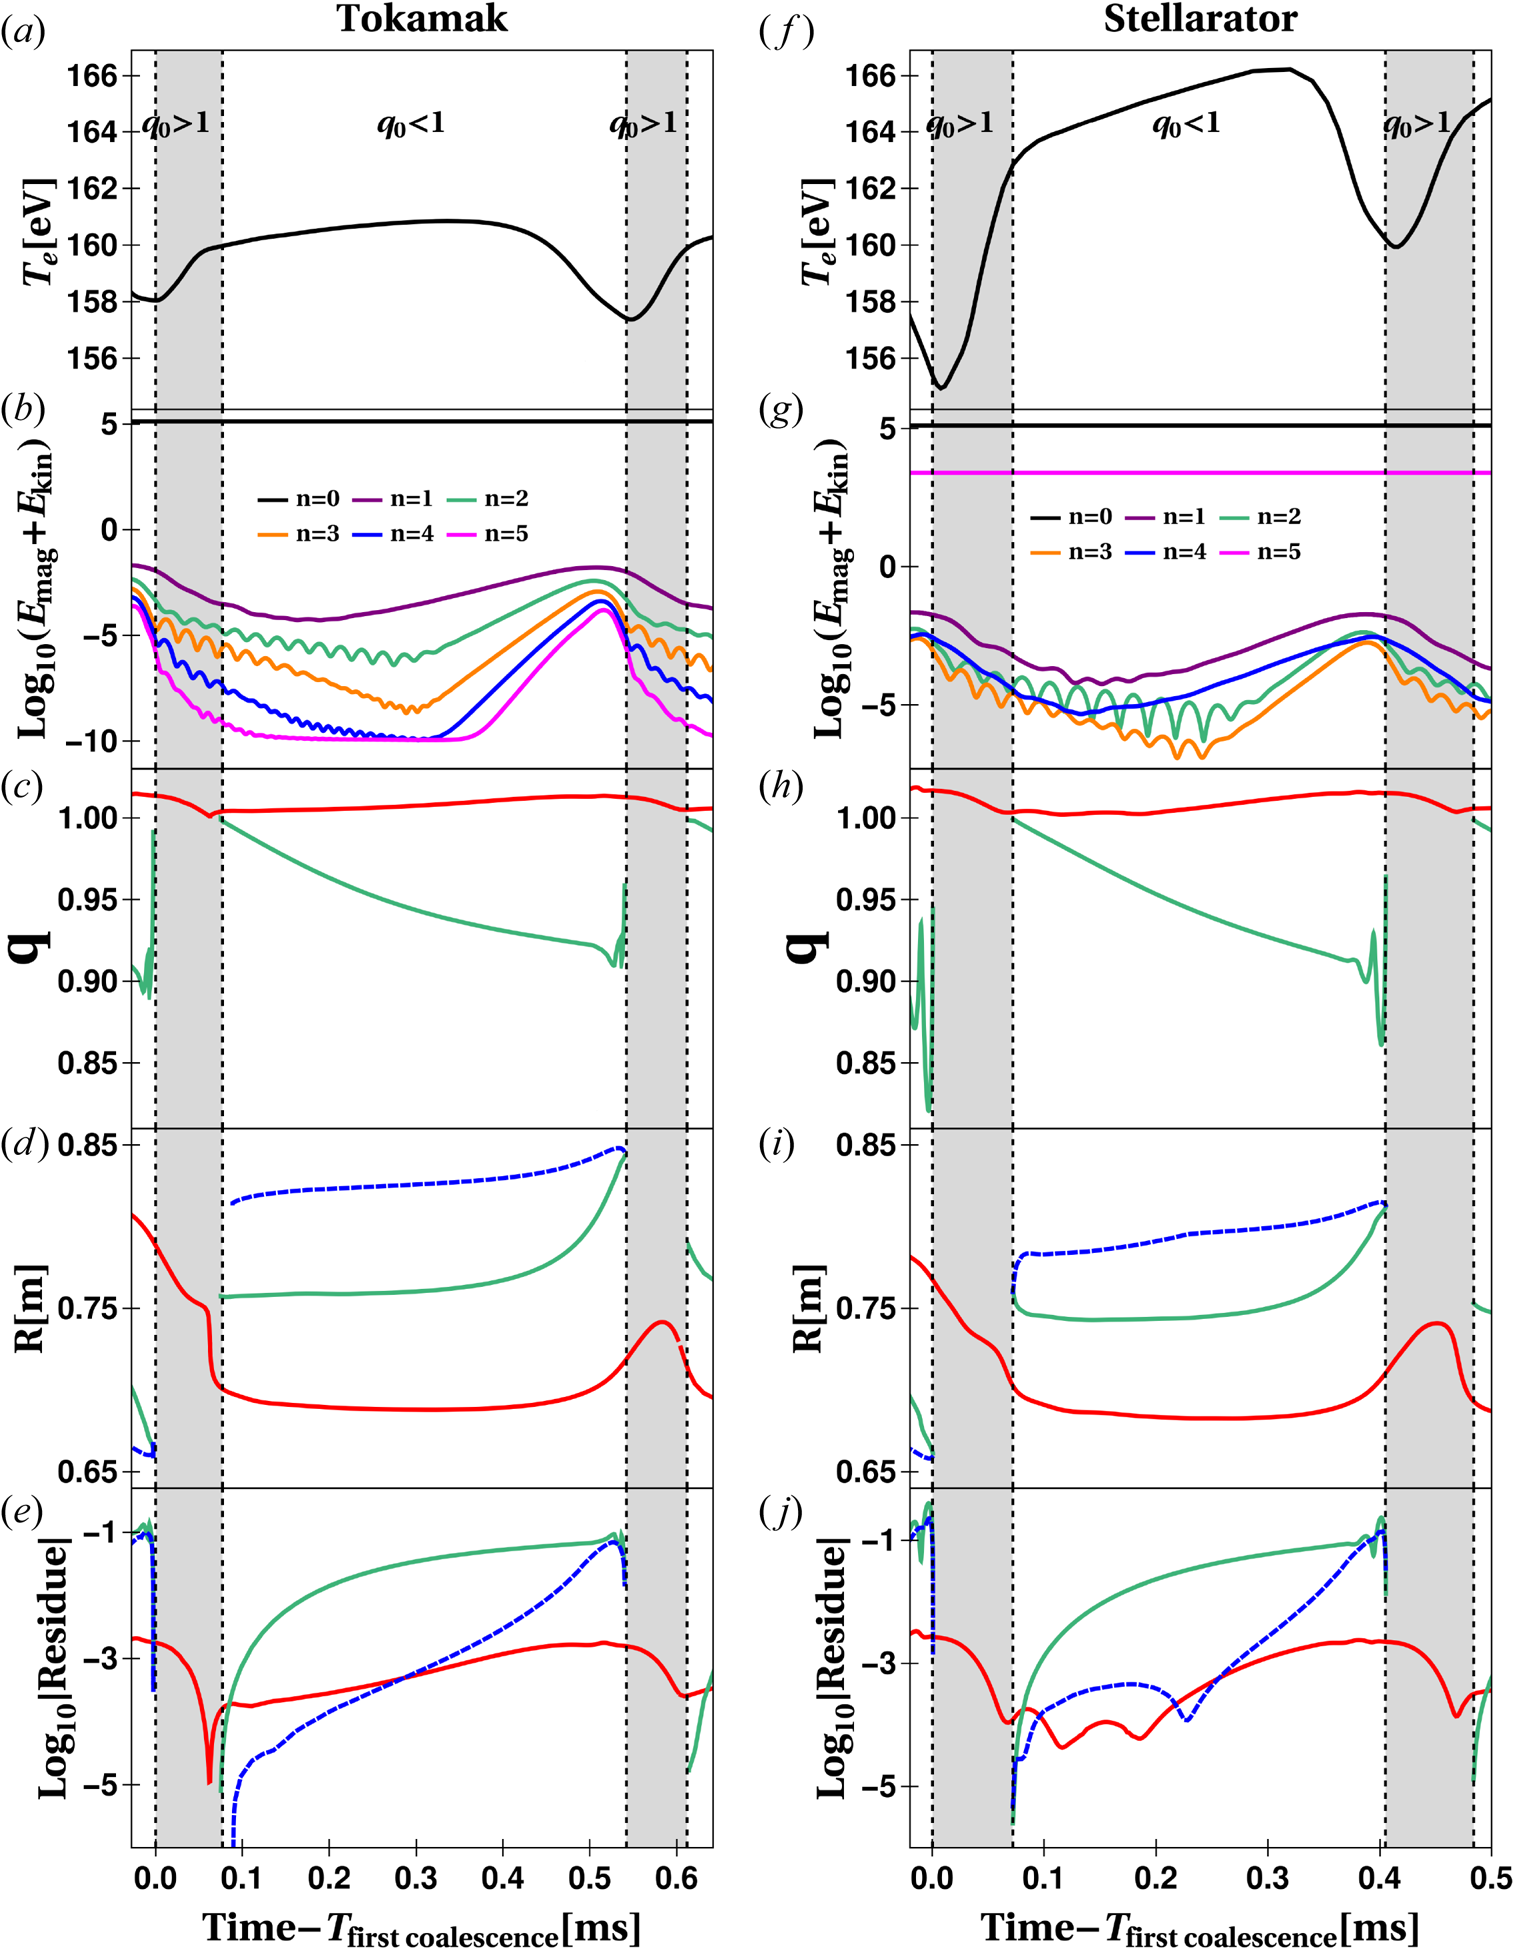
For the current-carrying stellarator simulations considered here, the 3D shaping has a small effect in the fixed-point picture of a sawtooth instability. Figure 2 compares sawtooth cycles for a stellarator configuration (${\raise.3pt-\kern-5pt\iota} _{\text {ext}}=0.0333$ ) with the tokamak scenario (${\raise.3pt-\kern-5pt\iota} _{\text {ext}}=0$
 ). The time window is centred around the second sawtooth cycle for both cases, and the time coordinate is shifted by the instant when the first coalescence occurs ($t_{\text {saw}} = \text {Time}-T_{\text {first coalescence}}$
 ). For example, $T_{\text {first coalescence}} = 7.58\,{\rm ms}$
 for the tokamak simulation (shortly after the third dashed vertical line in figure 1). In figure 2, four vertical dashed lines bound regions where $q_0>1$
 and $q_0<1$
 . The discussion is complemented with Poincaré plots through the sawtooth cycle in figure 3.
Sawtooth oscillations for a tokamak (${\raise.3pt-\kern-5pt\iota} _{\text {ext}} = 0$ ) and a stellarator (${\raise.3pt-\kern-5pt\iota} _{\text {ext}} = 0.0333$
 ). To facilitate the comparison, we have shifted the time by the instant when the first $o$
 –$x$
–$x$ coalescence occurs (right after the initial sawtooth cycle). (a,f) Electron temperature; (b,g) magnetic plus kinetic Fourier mode energies; (c,h) the safety factor at the fixed-point location; (d,i) fixed-point $R$
 coordinate on the $\varphi =0$
 plane; (e,j) the absolute value of the Greene's residue. In panels (d,e,i,j), the dashed blue curves correspond to $x$
 -points whereas the solid curves correspond to $o$
 -points. The vertical dashed lines limit the regions where the on-axis safety factor is greater or smaller than unity.
Poincaré surface of sections during sawtooth oscillations for (a–d) a tokamak (${{\raise.3pt-\kern-5pt\iota} _{\text {ext}} = 0}$ ) and (e–h) a stellarator (${\raise.3pt-\kern-5pt\iota} _{\text {ext}} = 0.0333$
 ) at the $\varphi =0$
 plane. (a,e) On-axis $q$
 is larger than one. (b,f) On-axis $q$
 has dropped below unity. The $q=1$
 surface emergence is recognised by the newly created central $o$
 -point (green dot) and $x$
 -point (blue $x$
 ). (c,g) As the internal kink mode grows, the magnetic axis is pushed towards the $x$
 -point. (d,h) The reconnection process has been completed, and the centre of the growing island has become the new magnetic axis.

The tokamak and the stellarator quantities given in figure 2 at $t_{\text {saw}}=0$ (first vertical dashed line) are similar. Both configurations have a monotonically decreasing on-axis safety factor of approximately $q_0\sim 1.02$
 (red traces in figure 2c,h). Around this time, there is a local minimum in the electron temperature (figure 2a,f), maximum energy stored in non-axisymmetric fields (figure 2b,g), and vanishing residues for the magnetic axis and the reconnection point of the previous sawtooth cycle (green and blue traces in figure 2e,j). Tokamak and stellarator Poincaré plots at 0.03 ms and 0.01 ms are given in figures 3(a) and 3(e), respectively. The tokamak case shows circular nested flux surfaces. The stellarator case shows elongated nested surfaces with symmetry-preserving 6/5 and 8/5 island chains.
The $q = 1$ surfaces emerge at $t_{\text {saw}}\sim 0.07\,{\rm ms}$
 in tokamak and stellarator simulations. This is indicated by the bifurcation event that produces an $o$
 –$x$
–$x$ fixed-point pair at the second vertical dashed line in both the $R$
 coordinate plot (blue and green traces in figure 2d,i) and the residues plot (blue and green traces in figure 2e,j). The red traces of figure 2(d,i) at $t_{\text {saw}}\sim 0.07\,{\rm ms}$
 show that the original magnetic axis is displaced towards the inboard side due to the formation of a $q = 1$
 surface in the core. Furthermore, the original magnetic axis's safety factor retains a value greater than unity through this event (red traces in figure 2c,h). The tokamak and stellarator Poincaré plots in figures 3(b) ($t_{\text {saw}} = 0.39\,{\rm ms}$
 ) and 3(f) ($t_{\text {saw}} = 0.35\,{\rm ms}$
 ) confirm that the bifurcation process has effectively transformed the original magnetic axis into a magnetic island centre (red dot). In these plots, the newly created central $o$
 -point is marked by a green dot and the $x$
 -point by a blue $x$
 . The bifurcation dynamics in the first 10 $\mu$
 s after $q$
 crosses unity is more complicated than the simplified picture presented here. This is examined in more detail in appendix B, but has minimal effect on the longer time scale sawtooth dynamics.
Sawtooth crashes for the tokamak and stellarator cases occur at $t_{\text {saw}}\sim 0.54\,{\rm ms}$ and $t_{\text {saw}}\sim 0.41\,{\rm ms}$
 , respectively. Poincaré plots before ($t_{\text {saw}}= 0.49\,{\rm ms}$
 ) and after ($t_{\text {saw}}= 0.55\,{\rm ms}$
 ) the tokamak sawtooth crash are given, respectively, in figures 3(c) and 3(d). Similarly, figure 3(g,h) show Poincaré plots before ($t_{\text {saw}}= 0.39\,{\rm ms}$
 ) and after ($t_{\text {saw}}= 0.43\,{\rm ms}$
 ) the crash for the stellarator case. The temperature crash (figure 2a,f) is due to the displacement of the hot core towards the reconnection point during the coalescence event. As the magnetic island grows, it pushes the recently created $o$
 -point towards the $x$
 -point, which drives the reconnection process. This process is portrayed in figure 2(d,i) as green and blue traces merging around the third vertical dashed line.
The fixed-point picture during sawtooth cycles is mostly unchanged by the application of a stronger external rotational transform. This analysis has also been performed for the ${\raise.3pt-\kern-5pt\iota} _{\text {ext}} = 0.0133$ and 0.0970 cases considered by Roberds et al. (Reference Roberds, Guazzotto, Hanson, Herfindal, Howell, Maurer and Sovinec2016) and the fixed-point picture is consistent throughout. The decrease of the sawtooth period for increased levels of 3D shaping has been experimentally observed (Herfindal et al. Reference Herfindal, Maurer, Hartwell, Ennis, Hanson, Knowlton, Ma, Pandya, Roberds and Traverso2019) and computationally verified (Roberds et al. Reference Roberds, Guazzotto, Hanson, Herfindal, Howell, Maurer and Sovinec2016). Despite some well-understood particularities during the $q=1$
 surface emergence (appendix B), the tokamak and stellarator simulations are described by Kadomtsev's model.
5. Power transfer in a 3D geometry
Although 3D shaping does not affect the sawtooth fixed-point picture, there are differences between the tokamak and stellarator simulations in how the sawtooth instability is driven. Section 2 highlights that the sawtooth frequency increases with 3D shaping; it also points out that part of this variation is explained in terms of an increased growth rate during the linear phase. This section focuses on the power transfer that drives the sawtooth instability in the linear phase for the tokamak and the stellarator cases. The nonlinear saturation and crash phases are discussed briefly. We find that the stellarator fields have two competing effects on the linear kink instability. First, the stellarator fields remove energy from the kink, which is stabilising. Second, the stellarator fields catalyse energy transfer from large-to-small scales. We conjecture that this transfer of energy to small scales effectively enhances the reconnection rate, which would increase the linear growth rate.
The internal kink linear eigenmode in a stellarator configuration consists of coupled toroidal Fourier modes. In a tokamak, the equilibrium is characterised by $n = 0$ ; in contrast, the stellarator equilibrium encompasses the symmetry-preserving family ($n = 0, \pm 5, \pm 10,\ldots$
 ). For the tokamak, the internal kink linear eigenmode is identified with $n = 1$
 . In the stellarator, $n=1$
 toroidally couples with all the $k N_{\text {fp}} \pm 1$
 fields. Figure 2 shows the evolution of Fourier mode energies for the tokamak (figure 2b) and stellarator (figure 2g) simulations. The linear growth phase for the tokamak case occurs from $\sim$
 0.2 to $\sim$
 0.4 ms; the linear growth phase for the stellarator case occurs from $\sim$
 0.2 to $\sim$
 0.35 ms. For the tokamak in the linear growth phase, the $n=1-4$
 mode energies are at successively lower values, with successively higher growth rates. In contrast, for the stellarator case, the $n = 1$
 and $4$
 modes grow at the same rate, and the $n=2$
 and $3$
 mode energies are at a lower energy and grow at a higher rate than the $n= 1$
 and $4$
 modes. In the stellarator case, the internal kink linear eigenmode has a finite projection onto the ${\pm }1$
 fields, and vanishing projection onto the remaining Fourier modes.
Figure 4 shows the energy evolution of the extended Fourier spectrum for the stellarator simulation. Figures 4(a)–4(c) show the energy of symmetry-preserving fields, ${\pm }1$ fields and ${\pm }2$
 fields, respectively. The energy in each symmetry-preserving field ($n = k N_{\text {fp}}$
 ) is constant in time, with energy decreasing with higher $n$
 . These energies are predominately magnetic field energy and are approximately seven orders of magnitude larger than the symmetry-breaking modes with similar $n$
 values. The ${\pm }1$
 modes show a characteristic linear growth phase, the log energy increasing linearly in time at the same rate, and the total energy decreasing with increasing $n$
 . The ${\pm }2$
 modes are at smaller amplitude than nearby ${\pm }1$
 modes. Toward the end of the linear growth phase, the ${\pm }2$
 mode energies all show exponential growth, with a faster growth rate than the ${\pm }1$
 modes. This is consistent with the fact that the ${\pm }2$
 modes are driven nonlinearly by ${\pm }1$
 mode interaction. During the linear growth phase, the energy evolution is dominated by the linear eigenmode growth. Thus, we use the ${\pm }1$
 modes as a proxy for the linearly growing eigenmode. We note that the higher $n$
 modes growth rate begins to increase towards the end of this phase, which indicates that the linear approximation, or the assumption that the ${\pm }1$
 Fourier modes are a good proxy for the eigenmode, is beginning to break down.
Magnetic plus kinetic Fourier mode energies for the stellarator (${\raise.3pt-\kern-5pt\iota} _{\text {ext}} = 0.0333$ ) simulation: (a) symmetry-preserving modes; (b) ${\pm }1$
 Fourier modes; (c) ${\pm }2$
 Fourier modes. Note that panel (a) has a different energy scale than panels (b,c). The energy content of a given $+n$
 field is equal to that of the energy content of $-n$
 , so only half on them are shown.

The Lorentz power drives the growth during the linear phase, as can be seen in figure 5. This figure shows the power transfers for the tokamak $n=1$ (figure 5a), stellarator $n = 1$
 (figure 5b) and stellarator $n=4$
 (figure 5c). In all three cases, the total power transfer and the Lorentz power transfer are nearly identical during the linear growth phase, and the other power transfers (pressure gradient, resistive dissipation and advective) are negligibly small. The other power transfers become important once the $x$
 and $o$
 points coalesce (at the third vertical dashed line).
Power-transfer contributions during the first sawtooth oscillation: (a) tokamak ${n=1}$ ; (b) stellarator $n=1$
 ; (c) stellarator $n=4$
 . The power scale is linear within the grey area and logarithmic elsewhere1. The vertical dashed lines limit the regions where the on-axis safety factor is greater or smaller than unity. The first and third vertical lines correspond to fixed-point coalescences during sawtooth crashes, the second and fourth vertical lines correspond to bifurcations of the magnetic axis as the on-axis safety factor drops below unity.

To further understand the Lorentz power during sawtooth cycles, it is convenient to consider energy-transfer rates between specific Fourier modes. As explained in § 3, $f_{n,(n-n'),n'}$ is the Lorentz energy transfer rate from $E_{n'}$
 to $E_n$
 catalysed by $\boldsymbol {B}_{n-n'}$
 . The $f_{n,(n-n'),n'}$
 coefficients for the tokamak and stellarator cases are plotted in figures 6(a)–6(c) and 6(d)–6(f), respectively. Figures 6(a) and 6(d) correspond to times right after the crash, but before $q_0$
 drops below unity again, figures 6(b) and 6(e) are for times during the linear phase, and figure 6(c) and 6(f) are near saturation, shortly before the next crash. As the coefficients cover multiple orders of magnitude, figure 6 uses a logarithmic scale. For a given $n$
 , the Lorentz power $P_{L_n}$
 is obtained by summing over all matrix elements in the $n$
 th column.
Lorentz power-transfer triad coefficients during the sawtooth cycle for the (a–c) tokamak (${\raise.3pt-\kern-5pt\iota} _{\text {ext}}=0$ ) and (d–f) stellarator (${\raise.3pt-\kern-5pt\iota} _{\text {ext}}=0.0333$
 ). Panels (a,d) correspond to times after the crash, but before $q_0$
 drops below unity again, (b,e) are for times during the linear phase, (c,f) correspond to times near the saturation, shortly before the next crash. Note the different colour scales and axis range for each configuration. The power scale is linear in the $-$
 10 to 10 W range and logarithmic elsewhere.

Several properties of the Lorentz power-transfer coefficients are reflected in the structure of the plots in figure 6. (i) The conservation of energy antisymmetry ($f_{n,(n-n'),n'} = - f_{n',(n'-n),n}$ ) implies that the Lorentz power-transfer coefficients are the same, save for a sign change, upon reflection across the $n = n'$
 line. (ii) The $n=n'$
 diagonal is zero, because there is no energy transfer of a Fourier mode to itself. (iii) Fourier modes of real fields obey a complex conjugate symmetry (e.g. $\boldsymbol {B}_{n}=\boldsymbol {B}_{-n}^*$
 ). This property implies that the plots are invariant under inversions through the origin: $f_{n,(n-n'),n'} = f_{-n,(n'-n),-n'}$
 . The physical implication is that the Lorentz power transfer from $E_{n'}$
 to $E_{n}$
 is equal to that from $E_{-n'}$
 to $E_{-n}$
 . (iv) The conservation of energy antisymmetry and the complex conjugate symmetry, in turn, imply that the coefficients change sign when reflected across the $n = - n'$
 line, i.e. $f_{n,(n-n'),n'} = - f_{-n',(n-n'),-n}$
 . The interpretation is that the power transfer from $E_{n'}$
 to $E_{n}$
 is the negative of that from $E_{-n}$
 to $E_{-n'}$
 . (v) From the preceding condition, it follows that the coefficients along the $n = - n'$
 line vanish ($f_{-n,(-2n),n} =0$
 ). This is expected: the Lorentz power coefficients modify the magnetic and kinetic Fourier mode energies, and these quantities are proportional to $|\boldsymbol {B}_{n}|^2 = \boldsymbol {B}_{n} \boldsymbol {\cdot } \boldsymbol {B}_{-n}$
 and $|\boldsymbol {V}_{n}|^2 = \boldsymbol {V}_{n} \boldsymbol {\cdot } \boldsymbol {V}_{-n}$
 , respectively, i.e. the energies are constructed from Fourier modes with indices $n$
 and $-n$
 . (vi) It is seen that figure 6 can be recovered through reflections and transpositions from, say, the upper wedge ($n' > |n|$
 ). The remaining matrix entries are redundant.Footnote 1
CTH's five-fold toroidal periodicity imposes a structure in the power-transfer matrix for the stellarator simulation. For this simulation, the symmetry-preserving Fourier modes $\boldsymbol {B}_{5k}$ are the largest of the magnetic field Fourier modes. Their catalytic effect is quantified by the $f_{n,(5k),n-5k}$
 coefficients, located along the $n' = n + 5k$
 lines in figures 6(d)–6(f). Along these lines, the $f_{5n,5(n-n'),5n'}$
 entries are local extrema. These coefficients correspond to power transfers catalysed by symmetry-preserving fields exclusively. An example of an interaction of this class is the $f_{5,(5),0}$
 coefficient, corresponding to power transfer from $n'=0$
 to $n=5$
 . This coefficient is the global maximum of figure 6(d), early during the cycle, and of figure 6(f), right before the crash. The following discussion explores ways in which the $\boldsymbol {B}_{5k}$
 symmetry-preserving Fourier modes modulate the sawtooth growth.
In the tokamak case, the $n = 1$ resistive internal kink grows by taking energy from $n'=0$
 . The $f_{1,(1),0}$
 entry in figures 6(a)–6(c) captures this interaction. These figures show that $f_{1,(1),0}$
 increases during the cycle. In a tokamak, the coefficients that drive the linear growth peak around the origin ($n = n' = 0$
 ).
).
In the stellarator case, we use the ${\pm }1$ Fourier modes as a proxy for the linearly growing kink eigenmode. Energy flow into and within the eigenmode is given by

We separate the $n'$ indices into four disjoint groups: (i) $n'=j N_{\text {fp}}$
 , energy transfer into the eigenmode from symmetry-preserving fields; (ii) $n'=j N_{\text {fp}}\pm 2$
 , energy transfer into the eigenmode from $\pm 2$
 fields; (iii) $n'=j N_{\text {fp}}\pm 1$
 and $n-n'=l N_{\text {fp}}$
 , energy rearrangement within the eigenmode catalysed by symmetry-preserving fields; (iv) $n'=j N_{\text {fp}}\pm 1$
 and $n-n'=l N_{\text {fp}}\pm 2$
 , energy rearrangement within the eigenmode catalysed by $\pm 2$
 fields. Here, $j$
 and $l$
 are integers. Groups (i) and (ii) quantify energy transfer into the eigenmode from Fourier modes not belonging to the eigenmode itself. Groups (iii) and (iv) quantify energy rearrangement within the eigenmode.
Figure 7 shows the Lorentz power transfer into (but not within) the kink eigenmode from the whole Fourier spectrum. That is, the $n'$ values included in the sum are those described in groups (i) and (ii). In addition to plotting the total flow in, the figure also shows the individual contributions from the axisymmetric fields ($n' = 0$
 ), the stellarator fields ($n' = k N_{\text {fp}}$
 ), and the $\pm 2$
 fields ($n' = k N_{\text {fp}} \pm 2$
 ). During the linear growth phase, the power from the whole Fourier spectrum is approximately equal to the transfer from the axisymmetric fields. The transfer from the $\pm 2$
 fields is negligible, and the transfer from the stellarator fields is small and negative. The stellarator fields remove energy from the eigenmode. Thus, they are not a source of free energy that drives growth.
Stellarator simulation (${\raise.3pt-\kern-5pt\iota} _{\text {ext}}=0.0333$ ). Lorentz power transfer into the kink eigenmode from the whole Fourier spectrum, the $n=0$
 field, the stellarator fields ($n=\pm 5,\pm 10,\pm 15,\ldots$
 ) and the $\pm 2$
 fields ($n = \pm 2, \pm 3, \pm 7,\ldots$
 ). The power scale is linear within the grey area and logarithmic elsewhere.

The Lorentz power transfer within the kink eigenmode can be expressed in sums of the form of (5.1), with $n'$ in the groups (iii) (energy rearrangement catalysed by symmetry-preserving fields) or (iv) (energy catalysed by $\pm 2$
 fields). However, the complete sum in (5.1) with all $n'$
 in group (iii) or all $n'$
 in group (iv) gives zero. Every contribution describing flow from $n'$
 to $n$
 is cancelled by the energy flow from $n$
 to $n'$
 . To clarify what is happening with the energy flow within the eigenmode, we add a condition to the sum: that $|n| > |n'|$
 . With this condition, the sum only includes the power flow from small $|n'|$
 to large $|n|$
 (large scale to small scale):

Note that the sign of $P_{\text {up}}$ and $f$
 can both be positive or negative. If positive, the energy is flowing from large-to-small scales. If negative the energy is flowing from small-to-large scales.
Figure 8 shows the large-to-small scales energy rearrangement within the eigenmode catalysed by the stellarator fields ($n-n'=\pm 5,\pm 10,\pm 15,\ldots$ ), $\pm 2$
 fields ($n-n' = \pm 2, \pm 3, \pm 7,\ldots$
 ) and by the field pairs $\boldsymbol {B}_{\pm 5}$
 , $\boldsymbol {B}_{\pm 10}$
 and $\boldsymbol {B}_{\pm 15}$
 . This figure shows that the large-to-small scales energy rearrangement within the eigenmode catalysed by the stellarator fields is positive during the linear phase while there is a negligible catalytic effect of the $\pm$
 2 fields. The implication is that the higher-order Fourier modes of the kink eigenmode grow at the expense of energy catalysed by the stellarator fields from large-to-small scales.
Stellarator simulation (${\raise.3pt-\kern-5pt\iota} _{\text {ext}}=0.0333$ ). Large-to-small scales energy rearrangement within the eigenmode catalysed by the stellarator fields ($n=\pm 5,\pm 10,\pm 15,\ldots$
 ), $\pm 2$
 fields ($n = \pm 2, \pm 3, \pm 7,\ldots$
 ), $\boldsymbol {B}_{\pm 5}$
 , $\boldsymbol {B}_{\pm 10}$
 and $\boldsymbol {B}_{\pm 15}$
 . The power scale is linear within the grey area and logarithmic elsewhere.

Figure 8 also shows that the large-to-small scales energy rearrangement within the eigenmode catalysed by the stellarator fields is mainly due to the catalytic effect of $\boldsymbol {B}_{\pm 5}$ and $\boldsymbol {B}_{\pm 10}$
 . The forward cascade catalysed by $\boldsymbol {B}_{- 5}$
 and $\boldsymbol {B}_{5}$
 are equal and figure 8 shows their sum. The same observation applies for the $\boldsymbol {B}_{\pm 10}$
 and $\boldsymbol {B}_{\pm 15}$
 pairs. The $\boldsymbol {B}_{\pm 5}$
 and $\boldsymbol {B}_{\pm 10}$
 fields have a comparable catalytic role during the linear phase that rearranges, within the eigenmode, energy from large scales to small scales. Unexpectedly, the catalytic effect of $\boldsymbol {B}_{\pm 5}$
 is of the same order of magnitude as that of $\boldsymbol {B}_{\pm 10}$
 . The catalytic effect of $\boldsymbol {B}_{\pm 15}$
 is orders of magnitude smaller than that of $\boldsymbol {B}_{\pm 5}$
 and $\boldsymbol {B}_{\pm 10}$
 . The smallness is expected from the ordering of the symmetry-preserving fields.
Figure 8 highlights that stellarators fields rearrange energy within the kink eigenmode through a forward cascade. The forward cascade transfers energy from large scales to small scales, and magnetic reconnection is stronger at smaller length scales. It is hypothesised that this energy catalysis results in an increased reconnection rate. This hypothesis is consistent with the observed increase in the resistive kink growth rate with increasing stellarator fields reported in Roberds et al. (Reference Roberds, Guazzotto, Hanson, Herfindal, Howell, Maurer and Sovinec2016), and it is consistent with experimental trends (Herfindal et al. Reference Herfindal, Maurer, Hartwell, Ennis, Hanson, Knowlton, Ma, Pandya, Roberds and Traverso2019).
6. Discussion and conclusions
This paper revisits sawtooth NIMROD simulations of CTH operating as a tokamak and as a current-carrying stellarator. The analysis employs a new fixed-point finder for NIMROD post-processing and adapts the power-transfer analysis of Ho & Craddock (Reference Ho and Craddock1991) to explore a 3D equilibrium.
This work determines that the fixed-point picture during sawtooth oscillations in CTH's tokamak and stellarator scenarios are similar. The fixed-point analysis allows for a detailed description of the sawtooth cycle. (i) During the initial sawtooth oscillation for the tokamak case, the first indication of the kink eigenmode onset is the bifurcation of the magnetic axis into an $n=m=1$ magnetic island centre and reconnection point (as shown in the Greene's residue plot) rather than the growth of the sawtooth energy content (which is masked under numerical noise). (ii) The accurate determination of fixed points, safety factors and residues resulted in the identification of two fixed-point mechanisms during the emergence of the internal kink, as shown in (appendix B).
The Lorentz power transfer is the internal kink eigenmode driver for the tokamak and the stellarator cases. Surprisingly, stellarator fields damp the sawtooth instability's linear growth. The primary role of stellarator fields is to catalyse energy transfer from large-to-small scales within the eigenmode. The aforementioned forward cascade may be related to the increased linear growth with 3D shaping, as reported by Herfindal et al. (Reference Herfindal, Maurer, Hartwell, Ennis, Hanson, Knowlton, Ma, Pandya, Roberds and Traverso2019) and Roberds et al. (Reference Roberds, Guazzotto, Hanson, Herfindal, Howell, Maurer and Sovinec2016). This is a topic of future work.
An important consequence of the generalisation of Ho & Craddock (Reference Ho and Craddock1991) analysis to a 3D equilibrium is the introduction of the Lorentz power-transfer triad coefficients $f_{n,(n-n'),n'}$ . The coefficient can be interpreted as an energy flow from mode $n'$
 to mode $n$
 catalysed by the magnetic field $\boldsymbol {B}_{n-n'}$
 . The collection of coefficients for CTH's stellarator scenarios has an underlying structure imposed by the $N_{\text {fp}} = 5$
 field-periodicity. These coefficients may prove fruitful for analysing sawtooth or other MHD activity in generic stellarators. The power-transfer analysis makes no $\beta$
 assumptions and may be employed for configuration with arbitrary cross-sectional geometry. The Lorentz power-transfer triad coefficients can be used to quantify symmetry-breaking effects in tokamaks, such as those produced by 3D fields for edge localized mode (ELM) suppression.
Acknowledgements
O.E.L. would like to acknowledge the assistance of J.R. King and S.E. Kruger.
Editor Per Helander thanks the referees for their advice in evaluating this article.
Funding
This work was supported by US Department of Energy Grant Nos. DE-FG02-03ER54692, DE-SC0018313 and DE-FG-02-00ER54610. This research used resources of the National Energy Research Scientific Computing Center (NERSC), a US Department of Energy Office of Science User Facility located at Lawrence Berkeley National Laboratory, operated under Contract No. DE-AC02-05CH11231. This manuscript has been authored in part by UT-Battelle, LLC, under contract DE-AC05-00OR22725 with the US Department of Energy (DOE). The US government retains and the publisher, by accepting the work for publication, acknowledges that the US government retains a non-exclusive, paid-up, irrevocable, world-wide license to publish or reproduce the submitted manuscript version of this work, or allow others to do so, for US government purposes. DOE will provide public access to these results of federally sponsored research in accordance with the DOE Public Access Plan (http://energy.gov/downloads/doe-public-access-plan).
Declaration of interests
The authors report no conflict of interest.
Appendix A. Explicit expressions for the power transfers
The Ho & Craddock (Reference Ho and Craddock1991) power-transfer analysis has been summarised in § 3. This appendix complements that discussion by providing an equation for the time evolution of the Fourier mode energy (A1) and expressions for the power transfers (A2)–(A7).
A positive power transfer supports mode growth, whereas a negative power transfer corresponds to mode damping. The competition of power transfers determines the Fourier mode energy ($E_n$ in (3.7)) time evolution. This work focuses on the Fourier energy of non-axisymmetric modes ($n\neq 0$
 ), and the equation for their time evolution is obtained by adding the (spectrally decomposed) induction and momentum equations projected into the velocity and magnetic fields, respectively. The resulting equation is

The power-transfer terms on the right-hand side are defined as follows:


In these equations, superscript $*$ denotes the complex conjugate, ${\rm c.c.}$
 indicates the complex conjugate of the previous terms and ${\rm d}A$
 is a poloidal cross-sectional differential of area. The physical interpretation of these terms has already been discussed in § 3, but some comments are in order.
Here $P_{A_{n}}$ is the power transfer associated with the centre of mass advection. Its definition entails the axisymmetric mass density only. During sawtooth cycles analysed here, the non-axisymmetric Fourier mass density components ($\rho _k, \ \text {for } k\neq 0$
 ) are smaller than its axisymmetric part ($\rho _0)$
 . Equation (A3) is accurate up to $O(\rho _k/\rho _0)$
 , but this is the same approximation employed in the definition of the leading-order Fourier mode energy, $E_n$
 , in (3.7).
We use $P_{\eta _{n}}$ to denote the power dissipation due to electrical resistivity. This work includes a Spitzer resistivity in which the electron temperature is fully dependent on position and (A5) takes this into account. The resistive dissipation integrand $(\eta \boldsymbol {J})_n \boldsymbol {\cdot } \boldsymbol {J}_n^*$
 , differs from $\eta \boldsymbol {J}_n \boldsymbol {\cdot } \boldsymbol {J}_n^* = \eta |\boldsymbol {J}_n|^2$
 , which is valid for a situation with constant resistivity through the confinement region. Although $\eta |\boldsymbol {J}_n|^2$
 is negative definite, $(\eta \boldsymbol {J})_n \boldsymbol {\cdot } \boldsymbol {J}_n^*$
 is not. Although individual $P_{\eta _{n}}$
 contributions may be positive, the sum of $P_{\eta _{n}}$
 contributions over the complete Fourier spectrum is negative, indicating an overall mode damping effect, as expected from a dissipative power transfer.
The term $P_{{\text {PF}}_{n}}$ is a conservative term that allows energy flux across the plasma boundary. In this work, it captures the imposed toroidal loop voltage that is responsible for driving ohmic currents that are typically in CTH. Here, only the $n=kN_{\text {fp}}$
 fluxes of energy through the plasma boundary are significant. In (A6), $\partial A$
 is the boundary of the poloidal cross-section ($A$
 ) and $\boldsymbol {dn}$
 is a vector normal to it.
Appendix B. Posterior sawtooth cycles: an example of a complex fixed-point mechanism during bifurcations
This appendix describes the unexpectedly complicated fixed-point changes that occur early in the second tokamak sawtooth cycle, between the times of figure 3(a) (0.030 ms) and figure 3(b) (0.39 ms).
Figure 9 shows four Poincaré plots, focused on the central plasma region ($0.65\,{\rm m}< R < 0.85\,{\rm m}$ ) at times between those of figures 3(a) and 3(b). Figures 3(a) and 9(a) (0.060 ms) both show a single $o$
 -point, near the midplane. By the time of figure 9(b) (0.067 ms) an $o$
 –$x$
–$x$ pair has been generated, both located near the midplane. The order in major radius is $o$
 –$x$
–$x$ –$o$
–$o$ . Just $6\,\mathrm {\mu }{\rm s}$
 later, in figure 9(c) (0.073 ms) two more $o$
 –$x$
–$x$ pairs have been generated, one pair above and one pair below the midplane. By the time of figure 9(d) (0.092 ms) the two off-midplane $o$
 -points have merged with the on-midplane $x$
 -point to form an on-midplane $o$
 -point, at approximately $R = 0.071\,{\rm m}$
 . In addition, the two off-midplane $x$
 -points have merged with the outer on-midplane $o$
 -point to form an on-midplane $x$
 -point, at approximately $R = 0.082\,{\rm m}$
 . The configuration of figure 9(d) shows three near-midplane fixed points with major radius order $o$
 –$o$
–$o$ –$x$
–$x$ , the same as in figure 3(b).
Poincaré plots for the tokamak simulation during the $q=1$ surface emergence of the second sawtooth cycle.

It is important to note that all of the $o$ -points in figure 9 have limiting $q$
 values very close to 1. Thus, only a very small change in the magnetic field is required to cause the fixed-point topology changes that are shown in figure 9.


 Open access

