


Introduction
Meta-analysis, at its essence, quantitatively aggregates and averages research findings drawn from primary studies that address identical or very similar conceptual hypotheses or research questions. It is a valuable approach to summarizing literature that accumulates on a given topic over time. As evidence on a topic expands, researchers gradually become more curious about how much of a relationship exists between variables across the population of studies rather than simply at the individual study level (Cooper, Reference Cooper2017).
Given its cumulative nature, meta-analysis plays a significant role in theory testing (Schmidt, Reference Schmidt2008; Yang, Reference Yang2002). In addition to synthesizing effect sizes, advanced meta-analytic techniques enable researchers to conduct additional testing options on more intricate relationships among variables. Common approaches include meta-analytic structural equation modeling, meta-regression, and multivariate and multilevel methods (Aguinis et al., Reference Aguinis, Dalton, Bosco, Pierce and Dalton2011; Steel et al., Reference Steel, Beugelsdijk and Aguinis2021). Theory can also be examined through moderator analyses within the meta-analytic process, whereby researchers test specific variables that may influence the relationship under investigation.
Meta-analysis not only advances scientific knowledge but also has a profound role in informing policymaking. In most scientific areas, research findings often fail to reach consensus due to differences in researchers’ perspectives, variations in research design, sampling error, and other sources of random variation. As a result, it is often difficult for policymakers to make informed decisions based on a diverse and sometimes conflicting body of research. Hunt (Reference Hunt1997, p. 5) noted, “when the legislators or policymakers seek, through hearings and staff research, to study a pressing issue, they can rarely make sense of the hodge-podge of findings offered them.” In this context, meta-analyses come in handy as neat and tidy reports for policymakers to consult when making decisions.
In applied linguistics, the first meta-analysis can be traced back to Ross (Reference Ross1998) on criterion-related validity of self-assessment. Two years later, Norris and Ortega published their highly influential meta-analysis on the effectiveness of second language instruction (Norris & Ortega, Reference Norris and Ortega2000). In the years since the publication of these two seminal meta-analyses, interest in applying this technique has gained momentum in L2 research. To date, more than 300 meta-analyses have been published and cover topics across different domains in the field (Ghanbar et al., Reference Ghanbar, Dehghan-Chaleshtori and Farsani2025).
The following efforts further demonstrate the burgeoning interest in meta-analysis among SLA researchers: the edited volume on research synthesis on language learning and teaching by Norris and Ortega (Reference Norris, Ortega, Norris and Ortega2006); the colloquium on meta-analysis at the American Association for Applied Linguistics in 2013; the special issue on meta-analysis in the journal Applied Linguistics in 2015; numerous methodological papers on meta-analysis in L2 research (e.g., In’nami & Koizumi, Reference In’Nami and Koizumi2010; Norouzian & Bui, Reference Norouzian and Bui2024; Oswald & Plonsky, Reference Oswald and Plonsky2010; Plonsky & Brown, Reference Plonsky and Brown2015). Most recently, an entire journal devoted to research synthesis in the field has been launched: Research Synthesis in Applied Linguistics. After more than two decades of accumulation, meta-analysis is now firmly entrenched in the field’s methodological repertoire.
Considering the potentially far-reaching impacts of meta-analytic work on both scientific knowledge and policymaking, it is therefore essential to ensure meta-analytic results are sound and that potential threats to validity are minimized or accounted for. Similar to any other primary study, conducting a meta-analysis entails numerous choices and decision points (see Oswald & Plonsky, Reference Oswald and Plonsky2010, for details on the choices of conducting meta-analyses), including which target domain to focus on, which database to search, whether to include grey literature, how to evaluate the study quality of sampled studies, which statistical model to use, how to handle dependent effect sizes, and others. Every single step carries weight to varying degrees and collectively shapes the quality of a meta-analysis as well as its outcomes. Therefore, for the results of meta-analyses to be valid and trustworthy, they must adhere to rigorous methodological standards and the utmost transparency with respect to decisions made along the way.
In recognition of the significance of valid, unbiased, and transparent meta-analytic practices (Ahn et al., Reference Ahn, Ames and Myers2012), numerous guidelines on the methodological and/or reporting practices of meta-analyses have been developed. For example, the American Psychological Association (APA) developed standards for reporting meta-analyses called Meta-Analysis Reporting Standards (MARS) (Appelbaum et al., Reference Appelbaum, Cooper, Kline, Mayo-Wilson, Nezu and Rao2018). Another well-known guideline is Preferred Reporting Items for Systematic Reviews and Meta-Analyses (PRISMA) (Page et al., Reference Page, McKenzie, Bossuyt, Boutron, Hoffmann, Mulrow, Shamseer, Tetzlaff, Akl and Brennan2021), initially developed in the medical field, and now has been widely applied in other fields.
Researchers have also made efforts to survey both methodological and reporting practices of meta-analyses across disciplines, including two fields closely related to SLA: education (e.g., Ahn et al., Reference Ahn, Ames and Myers2012; Tan & Gao, Reference Tan and Gao2025) and psychology (e.g., Dieckmann et al., Reference Dieckmann, Malle and Bodner2009; Hohn et al., Reference Hohn, Slaney and Tafreshi2020; Leclercq et al., Reference Leclercq, Beaudart, Ajamieh, Tirelli and Bruyère2020). Collectively, this body of work revealed that methodological and reporting practices in many published meta-analyses remain insufficient. Comparable concerns have also been raised in SLA (e.g., Anani Sarab & Amini Farsani, Reference Anani Sarab and Amini Farsani2024; Chalmers et al., Reference Chalmers, Brown and Koryakina2024; Vuogan & Li, Reference Vuogan and Li2024). Nevertheless, those discussions have typically been based on relatively narrow samples or methodological considerations. Building on this line of prior work, the present study aims to offer a more comprehensive examination of the quality of L2 meta-analyses.
Literature review
Validity issues in meta-analyses
The inferences made in integrative research reviews are as central to the validity of behavioral science knowledge as those made in primary research. Therefore, research reviewers must pay the same attention to rigorous methodology that is required of primary researchers. (Cooper, Reference Cooper1982, p. 291)
Like all forms of empirical inquiry, meta-analysis is subject to validity considerations. When meta-analysis was first introduced, it was not consistently conducted with caution against potential biases until different sets of prescriptions for conducting research synthesis and meta-analysis were developed (Valentine et al., Reference Valentine, Cooper, Patall, Tyson and Robinson2010). One of the earliest such frameworks was proposed by Cooper (Reference Cooper1982). Cooper conceptualized the integrative research review as a process that, in many ways, parallels primary studies, which contain five major stages: (a) problem formulation, (b) data collection, (c) evaluation of data points, (d) data analysis and interpretation, and (e) presentation of results. Cooper further argued that “methodological choices at each review stage engender threats to the validity of the review’s conclusions” (p. 292) and outlined potential validity threats associated with each stage of the synthetic process. The conceptualization of validity threats in research synthesis has since been elaborated by Cooper and other meta-analytic methodologists over subsequent decades (see Matt & Cook, Reference Matt, Cook, Cooper, Hedges and Valentine2019, for a recent overview).
Beyond the validity framework Cooper proposed, Sharpe (Reference Sharpe1997) identified three major validity threats inherent to meta-analyses: (1) the apples and oranges problem, (2) the file drawer problem, and (3) the garbage in, garbage out problem. When incommensurable studies are combined into a single meta-analysis, the apples and oranges problem may take place. In practice, meta-analyses typically include studies that are sufficiently similar in conceptual or theoretical terms within a given domain. Accordingly, meta-analysts are expected to establish explicit inclusion and exclusion criteria to delineate the scope of the topic under investigation (Norris & Ortega, Reference Norris, Ortega, Norris and Ortega2006). At the same time, it has been argued that combining heterogeneous studies may be appropriate when the goal is to meta-analyze higher-order characteristics across studies (Oswald & Plonsky, Reference Oswald and Plonsky2010; Rosenthal & DiMatteo, Reference Rosenthal and DiMatteo2001).
The file drawer problem, closely related to publication bias, refers to the exclusion of unpublished literature (e.g., conference presentations and unpublished manuscripts) from meta-analyses. This phenomenon reflects publication practices that tend to favor studies with statistically significant results over those with non-significant results. Indeed, the file drawer problem is fundamental to the validity of meta-analytic findings as it might result in inflated omnibus effect sizes (Gage et al., Reference Gage, Cook and Reichow2017). Common approaches to addressing this issue include conducting comprehensive literature searches to identify unpublished studies and assessing potential publication bias using formal methods (e.g., funnel plots).
The last validity issue Sharpe proposed (i.e., the garbage in, garbage out issue) is concerned with the inclusion of low-quality primary studies. In principle, studies included in systematic reviews or meta-analyses are expected to meet certain standards of methodological quality; however, primary studies often vary substantially in this regard. Two broad approaches have been proposed to address this issue: the all-inclusive approach and the quality-first approach.
Under the all-inclusive approach, methodological quality is treated as an a posteriori consideration (Norris & Ortega, Reference Norris, Ortega, Norris and Ortega2006). In other words, study quality can be examined empirically (Oswald & Plonsky, Reference Oswald and Plonsky2010). For example, meta-analysts can code quality factors (e.g., reporting reliability value or not) as moderators and then examine their influence using moderator or sensitivity analyses. In contrast, the quality-first approach considers methodological quality as an a priori question. This approach was proposed by Robert Slavin, an American educational researcher, and coined as the “best evidence synthesis.” The best evidence synthesis practice involves specifying quality-related inclusion criteria in advance, such that only studies meeting the pre-specified criteria are retained for synthesis (Slavin, Reference Slavin1986).
These three concerns are commonly identified as central issues in meta-analyses (Sharpe, Reference Sharpe1997). However, additional validity concerns also merit attention. As noted previously, meta-analyses entail numerous methodological decisions. Each decision carries weight to a different extent and will impact the validity of findings if not made in alignment with the established methodological standards.
Evidence of methodological and/or reporting quality of meta-analyses in neighboring disciplines
In education and psychology, research on the quality and/or reporting practices of meta-analyses has been fruitful (see Table 1 below).
Summary of previous studies on methodological and/or reporting quality in education and psychology

Table 1. Long description
From the top row, column headers are Study, Discipline, Sample, Focus, and Instrument. The first row lists Ahn et al. 2012, Education, 56 meta-analyses from 2000 to 2010 in eight educational journals, focus on methodological practices, instrument is author-developed with resources like MARS. The second row is Aytug et al. 2012, Industrial and Organizational Psychology and Organizational Behavior, 198 meta-analyses from 1995 to 2008 in 11 journals, focus on methodological and reporting practices, instrument is author-developed with MARS and MOOSE. The third row is Schalken and Rietbergen 2017, Industrial and Organizational Psychology, 120 meta-analyses from 2009 to 2016 in top 10 journals, focus on reporting practices, instrument is author-developed with MARS. The fourth row is Hohn et al. 2020, Psychology, 384 meta-analyses from 2009 to 2014 indexed in PsycINFO, focus on methodological and reporting practices, instrument is QUASR-R. The fifth row is Polanin et al. 2020, Psychology, 150 meta-analyses from 1999 to 2017 in Psychological Bulletin, focus on reporting and reproducibility practices, instrument is author-developed with PRISMA. The sixth row is Park et al. 2024, Education, 29 meta-analyses of mathematics interventions from 2000 to 2022, focus on methodological practices, instrument is author-developed focusing on moderator analysis, small sample correction, effect sizes dependency, and publication bias assessment. The seventh row is Tan and Gao 2025, Education, 41 meta-analyses on parental involvement and student outcomes, focus on methodological practices, instrument is author-developed with MARS and Ahn et al. 2012. Table footnote defines MARS as Meta-Analysis Reporting Standards, PRISMA as Preferred Reporting Items for Systematic Reviews and Meta-Analyses, MOOSE as Meta-analyses of Observational Studies in Epidemiology, and QUASR-R as Quality Assessment for Systematic Reviews—Revised.
Note: The full names of the instruments mentioned in the table: MARS: Meta-Analysis Reporting Standards (Appelbaum et al., Reference Appelbaum, Cooper, Kline, Mayo-Wilson, Nezu and Rao2018); PRISMA: Preferred Reporting Items for Systematic Reviews and Meta-Analyses (Page et al., Reference Page, McKenzie, Bossuyt, Boutron, Hoffmann, Mulrow, Shamseer, Tetzlaff, Akl and Brennan2021); MOOSE: Meta-analyses of Observational Studies in Epidemiology (Stroup et al., Reference Stroup, Berlin, Morton, Olkin, Williamson, Rennie, Moher, Becker, Sipe and Thacker2000); QUASR-R: Quality Assessment for Systematic Reviews—Revised (Slaney et al., Reference Slaney, Tafreshi and Malange2017)
Overall, the selected syntheses reviewed above offer insights relevant to L2 meta-analyses. Their findings overlap in two aspects: (1) limited transparency in reporting key methodological decisions (e.g., not reporting methods used for weighting effect sizes), and (2) deviations from commonly recommended methodological practices (e.g., not including unpublished studies).
Taken together, meta-analyses in the related fields of psychology and education do not yet reflect full convergence on a shared set of methodological and reporting standards, despite their longer history of meta-analytic development compared to SLA. Similar patterns may therefore be observed in L2 research. Accordingly, a systematic examination of current reporting and methodological practices in L2 meta-analyses is warranted to inform empirically grounded recommendations for future secondary research.
Methodological quality and/or reporting practices of L2 meta-analyses
To date, several initiatives have sought to examine the quality of L2 meta-analyses (see Table 2 below).
Summary of previous studies on methodological and/or reporting practices in SLA

Table 2. Long description
The table has four columns: Study, Sample, Focus, and Instrument. From top to bottom, the studies are: In’nami and Koizumi (2010) with 15 meta-analyses on search techniques, instrument not applicable; Plonsky and Brown (2015) with 81 meta-analyses on search techniques, instrument not applicable; Plonsky and Ziegler (2016) with 10 C A L L meta-analyses on methodological and reporting practices, using a 17-item instrument revised from Plonsky (2012); Liou and Lin (2017) with 13 C A L L meta-analyses on reporting practices, using a 17-item instrument adopted from Aytug et al. (2012); Lin et al. (2018) with 15 C A L L meta-analyses from 2003 to 2015 on reporting practices, using a 45-item instrument revised from M A R S and Aytug et al. (2012); Boers et al. (2021) with three published meta-analyses on data re-analysis, instrument not applicable; Vuogan and Li (2024) with 120 meta-analyses in S S C I-indexed journals before February 2022 on methodological practices, instrument not specified; Chalmers et al. (2024) with 304 systematic reviews in language education as of 2020 on reporting practices, using the P R I S M A 2009 checklist; Anani Sarab and Amini Farsani (2024) with 90 meta-analyses from 1998 to 2021 in 30 applied linguistic journals on methodological and reporting practices, instrument not specified. The table note defines P R I S M A 2009 as Preferred Reporting Items for Systematic reviews and Meta-analyses 2009.
a PRISMA 2009 = Preferred Reporting Items for Systematic Reviews and Meta-Analyses 2009 (Moher et al., Reference Moher, Liberati, Tetzlaff and Altman2009).
Summary of quality scores across steps

Table 3. Long description
From top to bottom, the table lists: Step 1 Formulating the problem k equals 3, mean 4.8, standard deviation 1.2, minimum 2, maximum 6, maximum possible 6, percent 80. Step 2 Locating and screening the literature k equals 5, mean 5.6, standard deviation 1.9, minimum 0, maximum 10, maximum possible 10, percent 56. Step 3 Gathering information from studies k equals 6, mean 5.1, standard deviation 2.8, minimum 0, maximum 11, maximum possible 12, percent 43. Step 4 Analyzing and integrating the outcomes k equals 11, mean 7.6, standard deviation 4.1, minimum 0, maximum 21, maximum possible 22, percent 35. Step 5 Presenting the results k equals 4, mean 4.1, standard deviation 1.8, minimum 0, maximum 8, maximum possible 8, percent 51. Step 6 Interpreting the evidence k equals 7, mean 5.3, standard deviation 2.2, minimum 0, maximum 11, maximum possible 14, percent 38. Transparency practices k equals 3, mean 3.0, standard deviation 1.7, minimum 0, maximum 6, maximum possible 6, percent 50. The final row shows the total K equals 39, mean 35.4, standard deviation 10.4, minimum 3, maximum 55, maximum possible 78, percent 45. Percent is defined as mean score divided by maximum possible score.
Note: % = mean score/maximum possible score.
Motivation for the present study
As reviewed above, three large-scale second-order syntheses on the quality of meta-analyses or research syntheses in SLA have been conducted (i.e., Anani Sarab & Amini Farsani, Reference Anani Sarab and Amini Farsani2024; Chalmers et al., Reference Chalmers, Brown and Koryakina2024; Vuogan & Li, Reference Vuogan and Li2024). There is no doubt that these three studies have provided valuable insights into the current state of the quality of L2 meta-analyses. However, they are not necessarily comprehensive or systematic in terms of scope and instrument.
To be more specific, Vuogan and Li (Reference Vuogan and Li2024) only sampled L2 meta-analyses (k = 120) in SSCI-indexed journals with an impact factor, whereas Anani Sarab and Amini Farsani (Reference Anani Sarab and Amini Farsani2024) examined meta-analyses (k = 90) from 30 representative applied linguistic journals. Therefore, it is reasonable to speculate that the samples of Vuogan and Li (Reference Vuogan and Li2024) and Anani Sarab and Amini Farsani (Reference Anani Sarab and Amini Farsani2024) may not be sufficiently representative of the entire population of L2 meta-analyses. Due to their sampling strategy (i.e., only sampled meta-analyses in relatively reputable journals), it is likely that their findings overestimated methodological and transparency quality. Chalmers et al. (Reference Chalmers, Brown and Koryakina2024) instead examined both meta-analyses and systematic reviews in language education. Although the sample in Chalmers et al. (Reference Chalmers, Brown and Koryakina2024) had a broader coverage, its main focus was on reporting practices.
Concerning their instruments, Vuogan and Li (Reference Vuogan and Li2024) did not specify the instrument they adopted, whereas Anani Sarab and Amini Farsani (Reference Anani Sarab and Amini Farsani2024) developed a coding sheet including the following themes: (a) study identification, (b) data retrieval and extraction, (c) data analysis, and (d) data interpretation. The instruments employed by both studies only included major decision points of carrying out a meta-analytic study, thereby leaving out many other critical procedures. In comparison, Chalmers et al. (Reference Chalmers, Brown and Koryakina2024) used an instrument adapted from the PRISMA checklist. PRISMA was originally proposed for systematic reviews in the medical and healthcare fields. Since it was not specifically designed for L2 research, it may not be an ideal instrument for assessing the quality of L2 meta-analyses.
The practices discussed above undoubtedly deepen our understanding of current L2 meta-analytic practices. However, given that meta-analysis has gained prominence in L2 research, there is a pressing need to comprehensively understand the methodological and reporting practices of meta-analytic work. This study, therefore, seeks to make a timely contribution to the field: by (a) painting a comprehensive picture of the current state of reporting and methodological practices of published meta-analyses and uncovering both strengths and weaknesses of current meta-analytic practices, and (b) providing empirically grounded recommendations for future meta-analysts. It also addresses the limitations identified in previous reviews by (a) sampling the population of L2 meta-analyses published as of 2023 and (b) relying on a more comprehensive instrument developed in consultation with other well-established instruments.
As part of the first goal, this study also probes into the changes in the quality of L2 meta-analyses over the years (1998–2023). In the past two decades, the application of meta-analytic methods has undergone exponential growth. Methodological guidance papers on how to conduct L2 meta-analyses have also emerged since the appearance of the first L2 meta-analysis. One of the earliest examples of guidance as such can be traced to Norris and Ortega’s (Reference Norris, Ortega, Norris and Ortega2006) edited volume. In this volume, Norris and Ortega provided an opening chapter by laying out choices in carrying out meta-analyses as well as the synthetic ethic. A few years later, Plonsky and his colleagues also published several guidance papers (e.g., Plonsky & Oswald, Reference Plonsky, Oswald, Marsden, Mackey and Plonsky2015; Oswald & Plonsky, Reference Oswald and Plonsky2010). Additionally, doctoral seminars on research syntheses and meta-analyses have been offered at several applied linguistic programs in the US since 2003 (e.g., Northern Arizona University, University of Hawai’i, Georgetown University, and University of Maryland, College Park). These methodological guidance articles, along with the formal training through seminars on meta-analyses and other formats of resources, empower both experienced and novice L2 meta-analysts to better navigate the meta-analytic process over the years. For this reason, meta-analyses published more recently are expected to have higher quality.
With these two major goals, this study aims to investigate the following two research questions:
-
(1) To what extent have recommended methodological and transparency practices been followed and reported thoroughly in L2 meta-analyses?
-
(2) To what extent have methodological and reporting practices of L2 meta-analyses changed over time?
Method
Literature search
The scope of this methodological synthesis is confined to published quantitative meta-analyses in SLA. To locate all eligible studies, an initial sample was retrieved from a personal database of research synthesis and meta-analysis in applied linguistics, which has been developed and maintained by Dr. Luke Plonsky at Northern Arizona University.Footnote 1 By searching two other major channels: (a) relevant databases and (b) L2 journals, I hoped to retrieve any missing meta-analyses that might not have been included in the initial database.
Next, literature was searched through three library databases that are widely used in L2 meta-analyses (Plonsky & Oswald, Reference Plonsky, Oswald, Marsden, Mackey and Plonsky2015). The three library databases are (1) Linguistics and Language Behavior Abstracts (LLBA) (https://proquest.libguides.com/llba), (2) PsycINFO (https://www.apa.org/pubs/databases/psycinfo), and (3) Education Resources Information Center (ERIC) (https://eric.ed.gov/). Google Scholar, a non-library search engine, was subsequently searched.
The database search was conducted through the university library’s online databases using advanced searches set to the abstract of articles with the following keyword combinations: (foreign language OR second language OR L2 OR language learning OR bilingual*) AND (meta-anal* OR synthe*). Searching within abstracts ensured the precision of returning results to avoid many irrelevant articles if the search was conducted within the full text. The wildcard symbol (*) was used to search for variations of the same root word. The search was then repeated in the Google Scholar interface by using slightly revised keyword combinations because Google Scholar’s advanced search platform places AND automatically between words. Therefore, quotation marks were placed around phrases to keep them complete. The search strings applied in Google Scholar are: (“foreign language” OR “second language” OR “L2” OR “language learning” OR “bilingual*”), and (“meta-analysis” OR “synthe*”). As the Google Scholar advanced search does not offer the option to search in the abstract, the search was set to ‘anywhere in the article’ instead.
Finally, 22 journals that primarily publish L2 research were searched through their journal websites or online search platforms. The 22 journals were included in the Second Language Research Corpus collected and maintained by Luke Plonsky (Plonsky, Reference Plonskyn.d.) (see supplementary materials for a full list of the 22 journals). To locate potentially relevant studies through search platforms, advanced searches in the abstract of articles were used with the following simplified search terms: (meta-analy* OR synthe*). When a search platform is not available (e.g., the Applied Language Learning Journal), all eligible volumes or issues were manually screened. Since the first L2 meta-analysis was published by Ross (Reference Ross1998), the search was carried out from January 1, 1998, to December 31, 2023, covering a span of 26 years.
Literature screening
After locating all relevant literature, studies in the initial sample were exported to Zotero, a reference management tool. All the duplications were removed first. Then, each study was screened by its title and abstract to determine eligibility using the following three inclusion/exclusion criteria (full text was screened when needed).
First, only published quantitative meta-analyses that involved the aggregation and average of effect sizes were included. Therefore, other types of synthetic studies were excluded (e.g., scoping review, research synthesis, methodological synthesis, and qualitative meta-analysis). Next, doctoral dissertations, master’s theses, and other formats of unpublished meta-analyses were also excluded. This choice was motivated by the fact that published meta-analyses have a more considerable impact and, therefore, a broader audience. Published meta-analyses would, in my view, take priority to be scrutinized. Finally, only meta-analyses targeting the acquisition, development, processing, assessment, usage, instruction, interaction, and learner individual difference factors of L2 learners were included. Studies investigating the sample of bilingual participants who acquired languages in early childhood were therefore excluded.
The initial search yielded a total of 3,688 results. After screening and removing duplicates, only 223 meta-analyses met the inclusion and exclusion criteria. Notably, one study reported two independent meta-analyses, thereby increasing the total count to 224 meta-analytic studies, which form the basis of the sample for this study.
Instrument
To develop the instrument, I used as a starting point the 17-item checklist that Plonsky and Ziegler (Reference Plonsky and Ziegler2016) proposed to measure L2 CALL meta-analyses. To further expand the list, several credible resources were consulted. The resources included: (a) established guidelines on reporting and conducting meta-analyses (i.e., MARS (Appelbaum et al., Reference Appelbaum, Cooper, Kline, Mayo-Wilson, Nezu and Rao2018) and PRISMA (Page et al., Reference Page, McKenzie, Bossuyt, Boutron, Hoffmann, Mulrow, Shamseer, Tetzlaff, Akl and Brennan2021)), (b) instruments adopted in similar reviews (e.g., Ahn et al., Reference Ahn, Ames and Myers2012; Dieckmann et al., Reference Dieckmann, Malle and Bodner2009; Hohn et al., Reference Hohn, Slaney and Tafreshi2020), (c) a textbook on research synthesis and meta-analysis (Cooper, Reference Cooper2017), and (d) regular consultations with a leading researcher in meta-analysis and research synthesis in the field.
After extensive revision and piloting, the final version has 47 items in total and includes seven main sections (see supplementary materials).Footnote 2 The first part (items 1–8) collects publication information (e.g., publication year and publication venue) and basic study information (e.g., effect size type and the number of studies included).
The seven main sections follow the main structure of a meta-analytic report as suggested by Cooper (Reference Cooper2017): Step 1: Formulating the Problem (items 9–11), Step 2: Searching and Screening the Literature (items 12–16), Step 3: Gathering Information from Studies (items 17–22), Step 4: Analyzing and Integrating the Outcomes of Studies (items 23–33), Step 5: Presenting the Results (items 34–37), Step 6: Interpreting the Evidence (items 38–44). The following three items (items 45–47) measure transparency practices.
Most items (30 out of 39) in the main sections were measured on a three-point Likert scale with “0” indicating that the item under scrutiny was not addressed or reported, “1” representing the item was partially addressed or reported according to the recommended practices, and “2” representing the item was addressed or reported fully adhering to the recommended practices. The remaining nine items were measured on a binary scale instead, with “0” indicating that the item was not reported and “2” representing that the item was fully reported, conforming to the recommended practices.Footnote 3
The decision to adopt two different scales was made because some items are more suitable for binary coding when a partial point (i.e., 1) is not applicable. When a partial point is applicable, the three-point Likert scale was adopted to provide a more fine-grained picture of the current practices of L2 meta-analyses. Each item was accompanied by detailed coding guidance to facilitate the coding process (see supplementary practices). The guidance was developed based on several resources pertaining to the best practices for conducting meta-analyses, including Cooper (Reference Cooper2017), Oswald and Plonsky (Reference Oswald and Plonsky2010), and Pigott and Polanin (Reference Pigott and Polanin2020).
In sum, the final instrument includes 46 items in total. Among the 46 items, only 39 items corresponding to the main seven sections were scored using either a three-point Likert scale or a binary scale and calculated into the final composite scores.
Coding
An Excel spreadsheet was used for coding purposes. The individual score of the 39 items was summed up to represent the overall quality of the meta-analysis under investigation. Although two different scales were used (i.e., 0, 1, 2, and 0, 2), the maximum score one item can receive is 2, which is the same across items. Therefore, the maximum score a meta-analysis can obtain is 78 (39 × 2).
After coding all eligible studies, a qualified second coder was hired and trained to code a subset of studies (20%) to estimate and enhance (if needed) the reliability of the coding as well as the instrument’s operational definitions, guidance, and so forth. The second coder was a Ph.D. student in applied linguistics and took a seminar on research synthesis and meta-analysis. Therefore, the second coder was familiar with the stages of carrying out a meta-analytic project. The coder training procedures were adapted from Sudina (Reference Sudina2022) and McKay (Reference McKay2019), which followed Wilson (Reference Wilson, Cooper, Hedges and Valentine2009). During the coder training phase, regular meetings were set up to discuss coding difficulties and to establish a normative understanding of the definition of items and coding guidance.
After the second coder finished coding all studies in the sample, reliability was estimated to determine the extent to which coding decisions were consistent and accurate. Following Sudina (Reference Sudina2023), three interrater reliability indexes were calculated for categorical variables: (1) Percentage agreement, (2) Cohen’s kappa (κ), and (3) the S index. Cohen’s kappa, although it is a relatively conservative index, adjusts for the chance rate of agreement (Cooper, Reference Cooper2017). The S index, proposed by Norouzian (Reference Norouzian2021), is an alternative to Cohen’s kappa, which remains unaffected by the varying distribution of coding categories. All three indices used to evaluate interrater reliability of categorical variables were calculated using the meta_rate package in R (Norouzian, Reference Norouzian2021). To calculate reliability values for continuous variables (e.g., the number of total studies), the intra-class correlation was calculated using JASP, a free open-source program for statistics (JASP Team, 2023).
The results of coding reliability can be found in the supplementary materials. Based on the benchmark proposed by Norouzian (Reference Norouzian2021), the interrater agreement is considered acceptable. For the continuous variables (e.g., the number of included studies), the agreement was 0.9–0.95.
Data analysis
The unit of analysis for this study was an independent meta-analysis rather than an article. To answer the first research question, the individual score of the 39 items was summed up to represent the overall quality of the meta-analysis under examination. Composite scores at the section level were also calculated. In addition, frequencies and percentages were also calculated for categorical items. Descriptive statistics in the form of means, SDs, min value, max value, and medians were computed.
To answer the second research question, a series of exploratory analyses was performed. Taking a deductive or top-down approach (Sudina, Reference Sudina2022), the time variable was initially divided into one-year intervals. Then, the time variable was operationalized as a categorical variable. The sample was divided into two identical periods: 1998–2010 (period 1) and 2011–2023 (period 2). Descriptive statistics were also compared across different periods.
Third, the time variable was also analyzed as an interval variable. I performed a correlational analysis to explore the relationship between two focal variables: publication year and quality score. Since the publication year was not normally distributed, Spearman’s correlation was computed. Before conducting the analysis, assumptions were checked to ensure they were all met.
The full dataset used in the present study is publicly available.Footnote 4
Results
Research question 1
The first research question probed into the extent to which the methodological and transparency practices have been followed and reported in L2 meta-analyses. Overall, the mean score was 35.4 (45% of the maximum possible score). This relatively low adherence rate suggests that the overall methodological quality of the sampled L2 meta-analyses remains a concern. Below, I summarize the results for each step.
Evaluating step 1: formulating the problem
In Step 1, the primary goal is to define research problems, including the definition of variables of interest and the rationale for studying their relationships (Cooper, Reference Cooper2017). Overall, the results were encouraging, with an average score of 4.8 (maximum possible = 6; SD = 1.2). Taking a closer look at individual items, most studies received full scores on the first item, indicating that they, in general, provided solid justifications for carrying out the meta-analyses and clear statements of the research questions under investigation. Regarding the rationale for selected moderators, around 43% of the studies provided sufficient rationale for moderators, and 43% of the studies did not provide any rationale for selected moderators.
Evaluating step 2: locating and screening the literature
In Step 2, the primary goal is to conduct a comprehensive search to locate and screen both relevant published and unpublished literature. The overall quality of this step, however, varies, with scores ranging from 0 to 10 (maximum possible = 10; mean = 5.6; SD = 1.9). A small proportion of L2 meta-analyses carried out exhaustive searches to locate relevant primary studies, indicating that the authors employed more than four channels of literature searching (10%). Most studies (74%) were coded as 1 for this item, and 16% were coded as 0, given the minimum effort the researchers exerted on this step.
On average, the studies employed a total of 2.8 channels to search relevant literature (SD = 1.4; Median = 3; Min = 0; Max = 6). The most frequently searched channels or techniques included library-housed database searching (e.g., LLBA) (k = 203, 91%), non-library-housed database search (e.g., Google Scholar) (k = 123, 55%), scholarly journals (k = 114, 51%), backward searching (k = 83, 37%), forward searching (k = 36, 16%), and contact primary researchers (k = 14, 6.3%). Of the studies that searched library-housed databases, the average number of databases searched was 4.8 (SD = 2.9; Median = 4; Min = 0; Max = 27).
Concerning the inclusion of unpublished literature, only 23% reported including two or more types of unpublished literature. The average number of unpublished literature types was 1.1 (SD = 1.1; Median = 1; Min = 0; Max = 5). Of those that included unpublished literature (k = 130), unpublished doctoral dissertation (k = 111, 85%) and master thesis (k = 54, 42%) were the most frequently included ones, followed by conference proceeding (k = 30, 23%), conference presentation (k = 22, 17%), technical report (k = 13, 10%), unpublished manuscript (k = 8, 6%), and working paper (k = 7, 5%).
On the bright side, L2 meta-analyses generally met the standards of describing inclusion and exclusion criteria clearly and thoroughly. Most studies also made the search terms and the end date of their search available.
Evaluating step 3: gathering information from studies
The overall goal of Step 3 is to code relevant information from the primary studies located in Step 2 and to assess the extent to which the coding results are reliable by incorporating additional coders. The overall rating of this step was 5.1 (SD = 2.8), out of a maximum possible score of 12. Around 43% provided overall coding agreements between coders, with only 11% providing coding agreement at the individual item level. Among the studies that reported the overall interrater reliability value (k = 97), most employed Cohen’s Kappa or Fleiss’s Kappa (κ) (when more than two coders were involved) (k = 19, 20%). The rest reported percentage agreement (%) (k = 16, 16%) and Pearson correlation (k = 2, 2%). Ten studies employed multiple interrater reliability measures. However, approximately 50% (k = 48) did not specify the type of interrater reliability index. Of the studies that reported interrater reliability at the individual item level (k = 23), eight (35%) employed percentage agreement, five (22%) employed Cohen’s Kappa or Fleiss’s Kappa (κ), one (4%) reported Pearson correlation, and four (17%) reported multiple measures. The rest did not specify the type of interrater reliability measure (k = 5, 22%).
Of the studies that reported coding agreement values (including both at the instrument and the individual item level), most provided insufficient information regarding the qualification of additional coders (64%) and the approach taken to solve coding disagreements (52%). Concerning the practices related to providing definitions or possible values of coding categories, L2 meta-analyses have generally met the standards.
Evaluating step 4: analyzing and integrating the outcomes
The main task of Step 4 is to choose appropriate methods to combine and compare results across studies (Cooper, Reference Cooper2017). Overall, the ratings for this step were heterogeneous (maximum possible score = 22; mean = 7.6; SD = 4.1). Most studies did not explicitly discuss the methods employed for weighting effect sizes. In addition, the majority of the included meta-analyses did not provide information regarding how studies based on the same sample were handled (87%), nor did they report information related to the handling of dependent effect sizes (53%), the identification and handling of outliers (80%), the handling of missing data (84%), or the assessment of study quality (88%). The remaining items had higher rates of adherence to the methodological standards, including moderator analyses (85%), publication bias assessment (71%), heterogeneity assessment (70%), and model choice justification (52%).
In total, 69 studies explicitly discussed their methods of effect size weighting. Of these studies, 45% (k = 31) weighted effect size by sample size, whereas 54% (k = 37) weighted effect size by the inverse of the sampling error. One study did not weight effect sizes but provided sufficient justification for doing so.
Approximately 72% (k = 161) of the meta-analyses explicitly indicated the choice of models (i.e., fixed-, random-, mixed-effects models). Of those reported, 66% (k = 106) provided justification for the model choice. The models employed included the random-effects model (k = 129, 80%), mixed-effects model (k = 7, 4%), fixed-effects model (k = 4, 2%), and hierarchical linear modeling (HLM) (k = 2, 1%). Also, 13 (8%) studies used both random- and fixed-effects models, whereas 5 (3%) used both random- and mixed-effects models. One study employed random-, fixed-, and mixed-effects models.
Across the 49 studies that identified outliers, 20% (k = 10) used subjective methods (e.g., visual detection), 69% (k = 34) used statistical techniques (e.g., Z-score), and 6% (k = 3) used formal sensitivity analysis. The rest used multiple methods (k = 2, 4%). Out of 57 studies that dealt with outliers, most of the studies removed identified outliers (k = 36, 63%), 18% (k = 10) implemented sensitivity analysis to assess the impact of outliers, 2 (4%) studies retained outliers, and 2 meta-analyses (4%) winsorized them.
In total, 101 L2 meta-analyses reported taking actions to handle dependent effect sizes, but in various ways, including (a) averaging dependent effect sizes (k = 68, 67%), (b) choosing one representative effect size (k = 8, 8%), (c) modeling dependent effect sizes (k = 13, 13%), (d) using the robust variance estimation (RVE) method (k = 5, 5%), and (e) shifting the unit of analysis (k = 1, 1%). The remaining studies used multiple methods to handle this issue (k = 4), excluded studies with dependent effect sizes (k = 1), or did not specify the method used (k = 1).
In total, 25 studies assessed the impact of the quality of primary studies on meta-analytic results. Across these studies, most carried out moderator analysis (k = 19, 76%), while 20% (k = 5) employed a quality assessment tool to assess the impact of study quality on meta-analytic results. Notably, one study combined both approaches (i.e., a moderator analysis and a quality assessment tool) to explore this aspect more comprehensively.
Concerning the assessment of publication bias (k = 158), the average number of techniques used was 1.3 (SD = 1.1; Min = 1; Max = 6; Median = 1). These methods include examination of funnel plot (k = 112, 71%), Fail-safe N analysis (k = 61, 39%), trim-and-fill analysis (k = 48, 30%), Egger’s test (k = 33, 21%), moderator analysis by publication type (k = 28, 18%), rank of correlation (k = 9, 6%), and sensitivity analysis (k = 3, 2%).
Thirty-six (16%) studies handled missing data. Across the 36 studies, the majority (k = 31, 86%) contacted authors to request missing data. In addition, three (8%) and two (6%) studies used more advanced techniques to handle missing data, i.e., imputation and maximum likelihood estimation methods, respectively.
Evaluating step 5: presenting the results
The overall aim of this stage is to report meta-analytic results. The mean rating is 4 (SD = 1.8) out of the maximum possible score of eight. First, approximately 66% did not provide an overall description of their sample. Of those that described their sample (k = 76, 34%), most described study design features employed in primary studies (e.g., sampling method) (k = 60, 79%), followed by publication information (e.g., publication venue) (k = 54, 71%), participants characteristics (e.g., age of participants) (k = 50, 66%), research setting (e.g., language context) (k = 38, 50%), and statistical reporting (e.g., statistical method) (k = 19, 25%).
Most studies adopted visualization techniques (k = 164, 73%). However, only half of the studies used those techniques appropriately and correctly. Of those studies that used visualization tools, 47% interpreted visualization results, with only 8% providing thorough interpretation. In terms of the types of visualization techniques, most used a funnel plot (k = 39, 24%), followed by forest plot (k = 21, 13%), graph (e.g., bar graph) (k = 13, 8%), boxplot (k = 10, 6%), scatterplot (k = 3, 2%), and bubble plot (k = 1, 1%). Also, 77 (47%) studies employed more than one visualization method.
The result of one particular item in this stage was found to be encouraging—most studies presented the consideration of error around meta-analytic point estimates (e.g., confidence intervals or standard errors) (92%).
Evaluating step 6: interpreting the evidence
The primary function of this stage is to provide contextual, theoretical, or practical interpretations of meta-analytic findings. Authors are expected to interpret findings in relation to their conclusiveness and generalizability. Both substantive and methodological implications and limitations should also be presented in this step. The overall score for this step was 5.3 (SD = 2.2), or 40% of the maximum possible score (14). Concerning the seven items on evidence interpretation, most studies had high adherence rates on items such as overall interpretation of results (99%), discussion of substantive implications (85%), and discussion of limitations (60%). The rest of the items had lower adherence rates, including discussion of the generalizability of results (12%), the impact of publication bias (17%), and the impact of missing data (1%).
Across the studies that provided overall interpretation of results, most studies turned to effect size benchmarks (k = 162, 73%), contrasted the magnitude of effects with previous meta-analytic effect sizes (k = 132, 59%), and provided practice-relevant interpretations (k = 124, 56%). Ninety-three studies also interpreted their results related to L2 theory (k = 93, 42%), whereas the rest presented a practical interpretation of the significance of effects (k = 16, 7%).
Out of the 162 studies that interpreted meta-analytic results, most studies were interpreted with Cohen’s benchmark (k = 83, 51%). Fifty-four (33%) adopted the L2-specific benchmark proposed by Plonsky and Oswald (Reference Plonsky and Oswald2014). Also, twelve studies (7%) employed both Cohen’s and Plonsky and Oswald’s benchmarks. Four studies (2%) were interpreted using other benchmarks (e.g., treatment-specific benchmarks). The remaining studies did not explicitly specify the benchmark type (k = 10, 6%).
Evaluating transparency practices
Regarding transparency practices, three relevant aspects were surveyed: (1) whether the coding scheme was available, (2) whether the meta-analytic dataset was available, and (3) whether the list of included primary studies was available. The average rating for this category is 2.9 (SD = 1.7) out of a maximum possible score of 6. Looking more closely at the results, approximately 36% of the coding scheme was available either in the paper or online supplementary materials. Concerning the availability of the full dataset, around 24% of the included meta-analyses made their whole meta-analytic datasets available, and 35% presented partial datasets. In addition, around 71% included a list of included primary studies in the meta-analyses.
Research question 2
The second research question probed into the change in meta-analytic quality over 26 years (1998–2023). This research question was addressed by first calculating descriptive statistics (e.g., means and percentages) of the quality of meta-analyses published in two equal periods: 1998–2010 (k = 21) and 2011–2023 (k = 203).
Overall quality changes over time
As shown in Figure 1, the overall quality of L2 meta-analyses exhibited fluctuations across years, with a modest upward trend over the 26-year period. Figure 2 compares the mean quality score changes across each step between two time periods. Over time, an increase in the quality score across each step can be observed. Drastic improvements have taken place in Step 4: Analyzing and Integrating the Outcomes; conversely, other steps, especially Step 1 and Transparency, showed relatively modest improvement. The total quality score increased by approximately 43% from 25.5 (period 1) to 36.4 (period 2), with an average increase of 0.4 per year. The rates of increase by section are as follows: Step 1 (9%), Step 2 (36%), Step 3 (47%), Step 4 (176%), Step 5 (14%), Step 6 (32%), and Transparency (15%).
Trend of overall quality score change.
Note: The maximum possible overall score is 78.

Change in quality scores across each step.
Note: The percentage of the mean score relative to the maximum possible score is shown in parentheses.

Figure 2. Long description
From top to bottom, the y-axis lists Step 1: Formulating the problem, Step 2: Locating and screening the literature, Step 3: Gathering information, Step 4: Analyzing the literature, Step 5: Presenting the results, Step 6: Interpreting the evidence, Transparency, and Total. For each, two horizontal bars are shown: orange for 1998-2010 and teal for 2011-2023. Step 1: 4.5 (75 percent) for 1998-2010, 4.9 (82 percent) for 2011-2023. Step 2: 4.2 (42 percent), 5.7 (57 percent). Step 3: 3.6 (30 percent), 5.3 (44 percent). Step 4: 2.9 (13 percent), 8 (36 percent). Step 5: 3.6 (45 percent), 4.1 (51 percent). Step 6: 4.1 (29 percent), 5.4 (39 percent). Transparency: 2.6 (43 percent), 3 (50 percent). Total: 25.5 (33 percent) for 1998-2010, 36.4 (47 percent) for 2011-2023. In all steps, the 2011-2023 scores are higher than the 1998-2010 scores.
Correlations between quality score and publication year
To answer the second research question, I also ran a series of Spearman’s rank correlation between quality score and publication year.
There were modest positive correlations between publication year and the overall quality score (r = .27), Step 1 quality score (r = .11), Step 2 quality score (r = .27), Step 3 quality score (r = .20), and Step 6 quality score (r = .14). Publication year was found to be moderately correlated with Step 4 quality score (r = .36). Step 5 was found to have a trivial but positive relationship with publication year (r = .04). For Transparency quality score and publication year, a negative but negligible correlation was observed (r = –.01).
Discussion
The primary goal of this study was to assess the methodological and transparency practices of published L2 meta-analyses to provide empirically grounded evidence for how to improve future L2 meta-analyses that could better advance L2 theory and its practice. To achieve this goal, I surveyed all published L2 meta-analyses as of December 31, 2023. In total, 223 articles comprising 224 independent meta-analytic samples were collected. Below, I summarized the strengths and major areas for improvement identified in this synthesis.
Strengths
Justifications of the research problems
This present review found that L2 meta-analyses clearly justified the problem under investigation (90% coded as 2). This finding aligns with Plonsky and Ziegler’s (Reference Plonsky and Ziegler2016) findings on the quality of CALL meta-analyses—7 out of 10 studies received a score of 5 or 6 in this section (maximum possible score = 6). It is also in line with a previous review on the quality of educational meta-analyses by Ahn et al. (Reference Ahn, Ames and Myers2012) and Tan and Gao’s (Reference Tan and Gao2025) methodological synthesis on parental involvement and students’ learning outcomes meta-analyses. They both found that most meta-analyses adequately addressed the theoretical, historical, and contextual backgrounds and clearly stated research questions under investigation.
Despite the encouraging findings found here, there is still room for improvement. It is not surprising that researchers take different approaches to justify the research problems (e.g., theoretical, historical, and practical justifications). However, one important consideration for L2 meta-analysts is that the field of inquiry should be mature enough to be meta-analyzed. The significance of the research question alone does not guarantee that the existing evidence is sufficient to support in-depth interrogation (Alexander, Reference Alexander2020; Paul & Barari, Reference Paul and Barari2022). In the present review, an average of 34.5 studies (Min = 5, Max = 302, Median = 26) were reported in the sample. Given that the median sample size of included studies is relatively modest, it is conceivable that some domains were not mature enough when they were being meta-analyzed. Therefore, before carrying out a meta-analysis, future L2 researchers should draw on their domain-specific expertise to evaluate if the domain has reached an appropriate level of maturity for meta-analytic inquiry. Failing to do so (a) greatly limits the stability of meta-analytic outcomes and can (b) lead to the premature closure of a fruitful domain. On a related note, although it is ideal to carry out a meta-analysis in a well-established domain, meta-analyses can also serve as a useful interim assessment of a theory or practice, particularly when a large body of evidence has yet to emerge (Combs et al., Reference Combs, Ketchen, Crook and Roth2011).
Attention to heterogeneity in observed effect sizes
In meta-analysis, heterogeneity broadly refers to variability in outcomes across primary studies. It is a critical and inevitable aspect of a meta-analysis. The current review found that about 70% of meta-analyses measured heterogeneity with common statistical indices (e.g., Q statistics and I2). This finding is comparable to those reported in previous methodological reviews, including Anani Sarab and Amini Farsani (Reference Anani Sarab and Amini Farsani2024), Vuogan and Lin (Reference Vuogan and Li2024), López-Nicolás et al. (Reference López -Nicolas, López-López, Rubio-Aparicio and Sánchez-Meca2022), and Ahn et al. (Reference Ahn, Ames and Myers2012), which documented similarly high heterogeneity assessment rates (ranging from 62% to 85%).
This finding is certainly encouraging; nevertheless, several recommendations can still be offered here for future L2 meta-analysts. In particular, future meta-analyses should complement conventional statistical tests of heterogeneity with additional approaches to assess heterogeneity, as commonly used indices involve limitations associated with null hypothesis significance testing (e.g., the Q test). Such approaches may include the following: (a) data visualization, (b) subgroup analyses, and (c) meta-regression.
Visual inspection methods offer an intuitive approach for meta-analysts to visually assess the heterogeneity of effect sizes across studies. Common visualization techniques, such as forest plots and funnel plots, can enhance our understanding of variability among study outcomes. Subgroup analyses, which involve grouping studies into more homogenous groups, can further help identify factors contributing to observed heterogeneity (Choi and Kang, Reference Choi and Kang2025). Finally, meta-regression—an approach that has not been extensively applied in L2 meta-analyses—offers a powerful tool for examining how study-level characteristics (e.g., learning context, first language) account for heterogeneity in effect sizes (Morris, Reference Morris2023; Steel et al., Reference Steel, Beugelsdijk and Aguinis2021). In comparison to subgroup analyses, meta-regression takes a step further to estimate and quantify the influence of one or more characteristics, including both categorical and continuous variables, on the variation in effect sizes.
Examination of publication bias
Publication bias (often referred to as the file-drawer problem) poses a substantial threat to the validity of meta-analytic findings. It is therefore encouraging that a majority of L2 meta-analyses examined the presence of publication bias (70%). This finding is consistent with the findings from previous methodological syntheses, which reported comparable rates of publication bias assessment—68% in Anani Sarab and Amini Farsani (Reference Anani Sarab and Amini Farsani2024), 73% in Vuogan and Li (Reference Vuogan and Li2024), 73% in López-Nicolás et al. (Reference López -Nicolas, López-López, Rubio-Aparicio and Sánchez-Meca2022), and 63% in Tan and Gao (Reference Tan and Gao2025).
Among studies that assessed publication bias, most relied on a single detection method, most commonly funnel plots. It is worth mentioning that techniques commonly used for detecting publication bias are not without limitations (Thornton & Lee, Reference Thornton and Lee2000), and different methods may yield divergent conclusions. Accordingly, future L2 meta-analysts are encouraged to employ multiple detection methods, or the so-called triangulation approach, to most robustly evaluate the presence of publication bias (Hansen et al., Reference Hansen, Steinmetz and Block2022; Rudolph et al., Reference Rudolph, Chang, Rauvola and Zacher2020). For comprehensive guidance and best-practice recommendations on assessing publication bias, please refer to Kepes et al. (Reference Kepes, Wang and Cortina2023). Finally, beyond the use of formal tests of publication bias, it is also important for researchers to actively seek out those unpublished studies to minimize the impact of publication bias on meta-analytic findings.
Consideration of variation of effect sizes
When reporting meta-analytic results, consideration of errors (e.g., standard errors or confidence intervals) should be reported along with the mean effect size estimates (Appelbaum et al., Reference Appelbaum, Cooper, Kline, Mayo-Wilson, Nezu and Rao2018). In the present review, approximately 93% of studies presented some consideration of error around the point estimates of interest (e.g., CIs or SEs). Similar patterns have also been revealed in prior reviews (Plonsky & Ziegler, Reference Plonsky and Ziegler2016; Tan & Gao, Reference Tan and Gao2025). It is also important to note that the same level of detail for effect sizes should be provided for mean effect size estimates in moderator analyses.
Discussion of substantive implications for future research
As noted by Oswald and Plonsky (Reference Oswald and Plonsky2010), a meta-analysis should extend beyond a retrospective summary to offer prospective implications for future research, including both substantive and methodological implications. It is therefore encouraging to see that most L2 meta-analyses provided substantive implications for future research (85%). In contrast, fewer studies discussed methodological implications (46%). Future L2 meta-analysts should take advantage of the prospective potential of meta-analyses by identifying the methodological areas that merit further improvements in previous primary studies.
Areas for improvement
Need for a more comprehensive literature search
One of the important findings is that nearly three-fourths of L2 meta-analyses did not implement a sufficiently thorough literature search (i.e., typically only two to four channels were searched), and 15% exerted even less effort on the literature search (i.e., only one channel was searched). Among the channels used to locate relevant primary studies, library-housed databases (91%), journals (51%), and non-library-housed databases (54%) were the most frequently searched ones, whereas other channels were less used (e.g., forward and backward search). This finding is comparable to Liou and Lin’s (Reference Liou, Lin, Chapelle and Sauro2017) synthesis on CALL meta-analyses, in which around 70% used electronic databases as the primary literature search strategy.
In terms of the inclusion of unpublished literature, close to 60% of studies included unpublished literature, whereas only 23% included two or more types of unpublished literature. Vuogan and Li (Reference Vuogan and Li2024), however, found that 77% of studies in their sample included unpublished literature. Anani Sarab and Amini Farsani (Reference Anani Sarab and Amini Farsani2024) also found a slightly higher percentage (70%) than the present study. The slight difference can be attributed to the fact that the present study included a more comprehensive sample of L2 meta-analyses (k = 224) compared to Vuogan and Li (Reference Vuogan and Li2024) (k = 120) and Anani Sarab and Amini Farsani (Reference Anani Sarab and Amini Farsani2024) (k = 90), which both included meta-analyses published in reputable journals. Of the unpublished literature included in L2 meta-analyses, doctoral dissertations (50%) were the most common type. This is not particularly surprising, given that dissertations are often indexed in library databases and are, therefore, relatively easy to locate. Such a pattern was also found to be prevalent in meta-analyses in education and psychology (e.g., 79% found in Polanin et al., Reference Polanin, Tanner-Smith and Hennessy2016; 60% found in Aytug et al., Reference Aytug, Rothstein, Zhou and Kern2012; 54% found in Ferguson and Brannick, Reference Ferguson and Brannick2012).
Critically, a comprehensive search of primary literature forms the foundation of meta-analyses (Muka et al., Reference Muka, Glisic, Milic, Verhoog, Bohlius, Bramer, Chowdhury and Franco2020). Inadequate searches may lead to severely biased results. Given the practices related to literature search in L2 meta-analyses discussed above, major improvements in this domain are very much needed.
First, L2 meta-analysts should carry out more comprehensive searches through diverse search channels, as no single channel can encompass all relevant literature. This study suggested that less commonly used channels should be considered for future L2 meta-analyses. These channels included forward and backward searching, contacting primary researchers, searching conference programs, and others (see Cooper, Reference Cooper2017; Plonsky & Oswald, Reference Plonsky, Oswald, Marsden, Mackey and Plonsky2015; and Plonsky & Brown, Reference Plonsky and Brown2015, for a more comprehensive guide on literature search). It is likely that a broad search may result in duplicated articles, and it is indeed laborious and time-consuming to screen. Nevertheless, it is always better to over-search the literature rather than under-search it (Plonsky & Oswald, Reference Plonsky, Oswald, Marsden, Mackey and Plonsky2015).
Second, to conduct a thorough search, it is also important to include unpublished literature. L2 meta-analyses should not only make an effort to obtain dissertations or theses, but also sources that are indexed and more accessible to retrieve, which may not alleviate the potential for publication bias. Other non-indexed sources, such as unpublished manuscripts, conference papers, and technical reports, should also be searched to ensure a complete and representative, if not exhaustive, sample of gray literature.
Need for enhancing coding reliability
Among the 224 meta-analyses in the present sample, 60% did not report overall interrater reliability estimates of the coding process, and only 10% reported interrater reliability estimates at the individual item level. This finding is considerably lower compared to Vuogan and Li (Reference Vuogan and Li2024) and Anani Sarab and Amini Farsani (Reference Anani Sarab and Amini Farsani2024), in which 78% and 70% reported measures of inter-coder reliability, respectively. The reason for the lower reporting rate in this review can again be attributable to the difference in our study samples. In line with the findings by Vuogan and Li (Reference Vuogan and Li2024) and Anani Sarab and Amini Farsani (Reference Anani Sarab and Amini Farsani2024), I also found that the most frequently used reliability statistics were Cohen’s Kappa (κ) and percentage agreement (%).
When it comes to reporting coder qualification and training, there is also a lack of information in the present sample. Only 3% of the studies reported details on both coder qualifications (e.g., educational background) and coder training, whereas 33% reported information on either qualifications or training. The finding is consistent with Anani Sarab and Amini Farsani’s (Reference Anani Sarab and Amini Farsani2024) review, which found that 28% mentioned coder qualification, and 14% mentioned coder training. A similar concern was also raised in Schalken and Rietbergen’s (Reference Schalken and Rietbergen2017) methodological synthesis in industrial and organizational psychology—only 10% discussed the qualification of coders.
Finally, half of the L2 meta-analyses reviewed here failed to discuss how coding disagreements among coders were resolved. Among the studies that reported such information, the majority discussed very briefly (e.g., coding disagreements were discussed until a consensus was reached). A higher reporting rate of coding disagreement resolution (71%) was revealed in Anani Sarab and Amini Farsani (Reference Anani Sarab and Amini Farsani2024), however. Similarly, Schalken and Rietbergen (Reference Schalken and Rietbergen2017) also found that 67% of their studies discussed how coding disagreements were resolved. This places L2 meta-analyses at a disadvantage when compared to other similar syntheses.
Coding primary studies is undoubtedly a crucial step in conducting a meta-analysis. This process involves collecting relevant data that will form the basis for subsequent data analysis. Therefore, the reliability of the data plays a significant role in determining the validity of meta-analytic results (López-Nicolás et al., Reference López -Nicolas, López-López, Rubio-Aparicio and Sánchez-Meca2022).
One way to enhance coding reliability is to involve at least one additional coder (Plonsky & Oswald, Reference Plonsky, Oswald, Marsden, Mackey and Plonsky2015). As discussed previously, interrater coding reliability estimates were not consistently reported in most studies. For future L2 meta-analyses, it is imperative to report interrater coding reliability values at the instrument level, but also at the section and item level, especially for high-inference sections or items. This will ensure a comprehensive picture of the coding reliability.
Coders who are familiar with the meta-analytic topic should be recruited and well-trained before carrying out the coding project. I noticed that the training of coders was scarcely mentioned. However, even when the coders are qualified, training sessions are still necessary to enable them to use coding forms and conventions in a competent and replicable manner (Stock et al., Reference Stock, Benito and Lasa1996). For a detailed guide on how to train additional coders, please refer to Wilson (Reference Wilson, Cooper, Hedges and Valentine2009) and Chapter 4 in Cooper (Reference Cooper2017).
Many studies reported either Cohen’s Kappa (κ) or percentage agreement (%) to determine intercoder reliability for categorical items. Both measures have their limitations. Percentage agreement is easy to calculate, but it cannot estimate and remove chance agreement. On the other hand, Cohen’s kappa is a conservative index, and it adjusts for chance agreement rates. Norouzian (Reference Norouzian2021) proposed an alternative index, the S index, which can remain stable even when the coding categories are distributed differently. For future L2 meta-analyses, it is recommended to use this more reliable measure of intercoder reliability, as we have already begun to see (e.g., Sudina, Reference Sudina2023). Notably, the majority of L2 meta-analyses only calculated interrater reliability. Intrarater reliability should also be considered for future studies to further strengthen coding reliability.
Once the coding reliability is calculated, it is essential to address any disagreement in coding. This was briefly reported in most L2 meta-analyses. Future meta-analyses should provide more detailed information beyond a simple statement indicating that coding disagreement has been resolved through discussion. It is necessary to discuss whether coding categories are revised based on discussion or not. It is also important to report if specific categories are recoded after discussion.
Arguably, it is possible that meta-researchers have taken all these necessary steps to guarantee data reliability but failed to disclose them. However, this lack of transparency leaves readers with doubts about whether these analyses were actually conducted, and if so, to what extent the coding can be considered reliable. The lack of such information also limits the field’s ability to understand potential sources of error in meta-analytic findings.
Need for handling dependent effect sizes with more robust techniques
The present review found that less than half of L2 meta-analyses took appropriate steps to address dependent effect sizes (47%). This finding is slightly lower when compared to similar reviews in education and psychology (e.g., 70% in Tan & Gao, Reference Tan and Gao2025; 59% in Ahn et al., Reference Ahn, Ames and Myers2012; 54% in López-Nicolás et al., Reference López -Nicolas, López-López, Rubio-Aparicio and Sánchez-Meca2022). Some studies attempted to avoid dependence by shifting the unit of analysis or averaging effect sizes derived from the same sample prior to aggregation. However, such approaches are generally considered suboptimal (Norouzian & Bui, Reference Norouzian and Bui2024). Only a small proportion of studies utilized more advanced statistical techniques (e.g., the RVE method) to account for dependency. Notably, six studies did not address effect size dependency at all.
Dependent effect sizes are pervasive in meta-analytic datasets, as primary studies often report multiple estimates arising from different samples, testing points, or measures of the same construct. If not properly addressed, the validity of meta-analytic findings can be compromised. Traditional strategies that eliminate dependence by reducing multiple effect sizes to a single estimate result in a loss of information and attenuate variability across effect sizes (Plonsky et al., Reference Plonsky, Hu, Sudina, Oswald, Mackey and Gass2023; Van den Noortgate et al., Reference Van den Noortgate, López-López, Marín-Martínez and Sánchez-Meca2013). On the other hand, ignoring dependency is also not recommended because studies that produce more effect sizes may have a disproportionate influence on the overall result (Plonsky et al., Reference Plonsky, Hu, Sudina, Oswald, Mackey and Gass2023).
For future L2 meta-analyses, it is recommended to consider model-based approaches, such as multilevel meta-analysis, which allow researchers to retain and appropriately model all available data (Steel et al., Reference Steel, Beugelsdijk and Aguinis2021). In the context of L2 research, Norouzian and Bui (Reference Norouzian and Bui2024) proposed a multivariate, multilevel meta-analysis (3M) approach for handling complex L2 meta-analytic datasets, offering a promising direction for future work.
Need for identifying and handling outliers
In this review, only 22% of meta-analyses sought to detect the presence of outliers. This rate is lower than that reported in Vuogan and Li (Reference Vuogan and Li2024), which found that 36% of studies examined outliers in their sample. Before conducting the main meta-analytic analysis, it is essential to perform outlier detection. Influential outliers may substantially bias meta-analytic results, particularly when the total number of effect sizes is small (Hansen, Reference Hansen, Steinmetz and Block2022). The present findings suggest that many L2 meta-analysts may underestimate the extent to which outliers can distort meta-analytic estimates, as is the case in primary research.
Among the studies that identified outliers, most relied on statistical methods, such as z-scores or standard residuals. A small number of studies employed more subjective methods, such as visual detection of funnel plots. Subjective methods can be useful but are not, on their own, always a reliable way of detecting outliers, as they may not always produce consistent or accurate results.
Concerning the methods of handling outliers, most studies either removed outliers or conducted sensitivity analyses to assess their impact. A smaller number of studies retained or winsorized outliers; however, retaining outliers is generally not advisable without strong justification.
Several statistical methods have been proposed to identify outliers in meta-analytic datasets (e.g., Viechtbauer & Cheung, Reference Viechtbauer and Cheung2010). More recently, Norouzian and Bui (Reference Norouzian and Bui2024) introduced an innovative approach for detecting interactive outliers. This analysis can be performed in the R package developed by the authors. Future L2 meta-analyses may benefit from these methodological advances when addressing outliers.
Need for assessing the quality of primary studies
The assessment of primary study quality has not received widespread attention in L2 meta-analyses. However, this practice is more common in meta-analyses conducted in fields such as education and psychology. This difference is not surprising, as meta-analytic methods have a longer history in these disciplines than in L2 research. Indeed, the first modern meta-analysis was published in psychology in 1978.
Another possible explanation for the limited attention to primary study quality is that the concept itself may be conflated with related, but distinct, aspects of meta-analytic practice (Hohn et al., Reference Hohn, Slaney and Tafreshi2020). For instance, meta-analysts often apply strict exclusion criteria based on study design or statistical characteristics (e.g., requiring complete reporting of descriptive statistics for effect size calculation). However, these criteria capture only one facet of study quality and may not fully reflect the overall quality of the primary studies included.
One caveat of conducting meta-analyses is that the inclusion of low-quality studies may threaten the validity of the synthesis, a concern commonly referred to as the “garbage in, garbage out” problem (Sharpe, Reference Sharpe1997). For this reason, meta-analysts should evaluate the quality of primary studies and examine their potential impact on meta-analytic results. Some researchers advocate the use of best evidence syntheses, whereby studies that fail to meet predetermined quality criteria are excluded from the analysis (e.g., Slavin, Reference Slavin1986).
However, the present study advocates a more inclusive approach, in which all studies meeting the inclusion criteria are retained regardless of their quality. The rationale for this approach is that the quality of primary studies can itself be treated as an empirical, a posteriori question, for example, by conducting sensitivity analyses comparing lower- and higher-quality studies.
Need for a more comprehensive interpretation of meta-analytic results
L2 meta-analysts generally provided interpretation of results (99%), discussed substantive implications (85%), and limitations (60%). Further improvements can be made in the discussion of missing data (1%), generalizability (12%), the impact of publication bias (17%), and methodological implications (46%). The rate of discussion on the generalizability of findings is considerably lower when compared to Aytug et al. (Reference Aytug, Rothstein, Zhou and Kern2012), which found that 35% included such discussion.
As noted earlier, discussions of generalizability, publication bias, and missing data were rarely included in L2 meta-analyses. The lack of interpretation may stem from the fact that most methodological resources emphasize decisions made in the early stages of conducting a meta-analysis, rather than considerations related to interpreting findings at later stages. These considerations are, however, equally crucial to the overall meta-analytic process.
First, it is worth noting that “meta-analyses can only reflect characteristics of the sample of studies upon which they are based on” (Rudolph et al., Reference Rudolph, Chang, Rauvola and Zacher2020, p. 4). L2 meta-analysts should always discuss the generalizability of their results. This helps consumers of meta-analyses understand the contexts in which the results can be applied.
Next, the most notable caveat of publication bias is that it may lead to inflated outcomes of meta-analysis. If publication bias is present, it is important for the authors to alert readers that the results might overestimate the population effect of interest.
Finally, missing data is a prevalent issue while carrying out a meta-analytic project, and it can affect the conclusions drawn from meta-analyses. When data are systematically missing, the representativeness of meta-analytic results may be compromised (Cooper, Reference Cooper2017). Therefore, it is also imperative for meta-analysts to discuss the extent to which missing data is an issue in the dataset and the extent to which it may impact the results. (For an example on how to discuss the impact of missing data, please refer to Chapter 7 in Cooper, Reference Cooper2017.)
In this review, more than half of the studies did not discuss methodological implications for future primary research. As discussed earlier, meta-analyses can also have a prospective impact—they can help identify specific gaps (e.g., variables, settings, designs, or samples) that have not been adequately researched in the sample of primary studies (Oswald & Plonsky, Reference Oswald and Plonsky2010). In addition, they can be useful in highlighting areas where methodological advancements are necessary for future studies by synthesizing relevant methodology-related variables (e.g., reporting reliability or not). L2 meta-analyses should consider both substantive and methodological implications for primary research in the future.
Need for more transparent practices
With respect to transparency-related practices, the mean score across all studies was 3 (maximum possible score = 6), which is suboptimal. In particular, two items require significant improvement—the availability of the coding scheme and the full dataset.
In this review, only 36% of studies provided the coding scheme, while 59% made the full dataset available, and 71% provided the list of the included studies. However, compared to Dieckmann et al. (Reference Dieckmann, Malle and Bodner2009), the adherence rate is comparatively low. Dieckmann et al. (Reference Dieckmann, Malle and Bodner2009) found that 90% of the meta-analyses provided a complete list of primary studies, and 60% reported the coding scheme in full.
One of the quality indicators of meta-analysis, as well as other types of research, is whether the findings can be reproduced. Clearly, transparency is an essential prerequisite of reproducibility (see Plonsky, Reference Plonsky2024). Without full transparency, any attempts to reproduce the results will be impossible. To ensure full transparency, future L2 meta-analyses should adhere to certain guidelines, such as making the full dataset publicly available, reporting literature retrieval and data analysis methods clearly and thoroughly, making the coding scheme available, and providing accessible and readable statistical codes or scripts if applicable. (For more guidance on the reproducibility of meta-analyses, see Lakens et al., Reference Lakens, Hilgard and Staaks2016, and Polanin et al., Reference Polanin, Hennessy and Tsuji2020.) A high level of transparency might even allow for meta-analytic results to be updated in an almost-immediate fashion following the publication of additionally relevant studies.
Finally, it is important to note that high transparency does not always mean high methodological rigor. For instance, a meta-analysis may be very transparent about its search strategies, but the search process itself may not have been thorough enough. Nevertheless, without complete transparency of methodological decisions, it is impossible to determine which choices and judgment calls were made, and whether they were appropriate.
Changes in quality over time
This research question probed into the changes in the quality score of L2 meta-analyses over two periods of time: 1998–2010 (Period 1) and 2011–2023 (Period 2). The goal was to compare the overall quality score and quality scores for each step over time. Additionally, correlational analyses were run to examine the relationship between publication year and quality score.
Overall, Step 4 shows the most significant improvement over time. Two possible reasons may explain this pattern: (1) the field has provided increasing statistical training and methodological resources for meta-analyses over the years, and (2) Step 4 contains the most items in the instrument (k = 11), thereby allowing for more room for improvement.
The slower improvement observed in Step 1 may be due to its relatively high quality in the first period, leaving limited room for further improvement. Similarly, Step 5 contains only four items, which also limits its potential for further gains. As for Transparency, its slower improvement may partly be attributed to the small number of items, although the slower adoption of transparency practices in the field may also explain this pattern.
The quality scores were generally found to be positively correlated with the year of publication, though there was no correlation observed for the Transparency score (r = –.01) and Step 5 quality score (r = .04). The correlation coefficients for the other scores ranged from .11 to .36, indicating small to medium effect sizes based on the L2-specific effect size interpretation benchmark proposed by Plonsky and Oswald (Reference Plonsky and Oswald2014). The positive correlation suggests that the quality of L2 meta-analyses increased with time, i.e., the more recent the publication year, the higher the quality score. The results presented here are partially consistent with Aytug et al. (Reference Aytug, Rothstein, Zhou and Kern2012), who also found positive correlations between publication year and transparency scores (rs = .16 to .32).
Overall, it should be acknowledged that the overall quality of L2 meta-analyses has improved in the past two decades. This is not particularly surprising given the publication of field-specific methodological guidance on meta-analyses in the past decade and the broader move toward greater methodological rigor and reform (e.g., In’nami & Koizumi, Reference In’Nami and Koizumi2010; Norouzian & Bui, Reference Norouzian and Bui2024; Oswald & Plonsky, Reference Oswald and Plonsky2010; Plonsky & Brown, Reference Plonsky and Brown2015). These works significantly expanded the meta-analytic statistical repertoire of the field and provided valuable guidance for L2 meta-analyses over the years.
Limitations and future directions
It is important to recognize the limitations inherent in this second-order review. First, this review only examined published meta-analyses in L2 research and did not consider unpublished meta-analyses, such as doctoral dissertations and master’s theses. I posited that published meta-analyses have a broader impact than unpublished ones and, therefore, deserve immediate attention. However, it is important to note that by only including published L2 meta-analyses, this review was unable to conduct further sensitivity analyses to compare the quality of L2 meta-analyses between published and unpublished ones. While published studies may exhibit higher methodological quality, unpublished work may provide more detailed reporting due to fewer space constraints, potentially leading to higher quality ratings. Future systematic reviews could assess the quality of unpublished L2 meta-analyses and compare their findings with those reported here.
Second, the bin sizes for the two equal time periods were highly uneven in research question 2 (k = 21 in period 1; k = 203 in period 2). This is mainly caused by the fact that the majority of L2 meta-analyses were published in recent years, especially after 2019. Having uneven bin sizes may limit our ability to examine changes in quality over time. In the future, reviews along this line could consider addressing this issue of uneven bin size. For example, they could use the year when important methodological papers were published, which may have positively influenced the practices of L2 meta-analyses, as a cutting point to divide the sample into two groups. This could help better account for the changing practices of L2 meta-analyses.
Next, the current instrument surveys only three common transparency practices (i.e., data availability, coding scheme availability, and availability of the list of primary studies). Other emerging yet important transparency practices were not assessed because they have not been widely adopted in SLA, such as preregistration, availability of analytic scripts, and reproducible workflows. Future methodological syntheses may also consider surveying these practices, as they have started to gain attention among L2 researchers.
Finally, this study focused exclusively on quantitative meta-analyses and did not include qualitative research syntheses in L2 research. Qualitative syntheses also play a significant role in informing research and practice. Future studies could examine the quality of qualitative research syntheses in L2 research to help achieve a more comprehensive understanding of research synthesis practice in the field.
Conclusion
This study set out to explore the extent to which meta-analyses in L2 research clearly and transparently report their procedures, decisions, and judgment calls. The findings reveal substantial variability in methodological decisions and a general lack of thoroughness in reporting across different stages of the meta-analytic process. It is hoped that this review will stimulate future improvements in L2 meta-analytic practices, including more comprehensive literature searches; more rigorous and reliable coding procedures; and greater adherence to key methodological standards, such as identifying and handling outliers, assessing the quality of included primary studies, and appropriately addressing data dependency. In addition, future work should place greater emphasis on nuanced interpretations of findings, particularly with respect to generalizability and the potential impact of publication bias and missing data, as well as on improving transparency through the sharing of meta-analytic datasets and coding protocols.
It is important to acknowledge that L2 meta-analysis is still a relatively developing area. Accordingly, the lower adoption of some advanced methods likely reflects the historical and field-specific factors, rather than neglect on the part of researchers.
It is also not anticipated that every meta-analysis will achieve complete adherence to all criteria, particularly given space constraints that may limit the reporting of certain decisions. Nevertheless, L2 meta-analyses should strive to follow the best possible practices and document methodological choices as transparently as possible. In this regard, future L2 meta-analysts are encouraged to share additional information through online supplementary materials hosted by the publishers, online repositories (e.g., OSF and IRIS; Marsden et al., Reference Marsden, Mackey, Plonsky, Mackey and Marsden2016), or personal and institutional webpages.
Furthermore, this review contributes to the meta-analytic scholarship in L2 research by introducing an instrument for evaluating both methodological rigor and transparency practices in future meta-analyses in the field. This instrument may also be further refined to incorporate additional methodological considerations and emerging transparency practices as the field continues to evolve.
In conclusion, there is reason for cautious optimism that the adoption of more rigorous and transparent meta-analytic practices will continue to increase, particularly in light of the improvements already observed in the present review.
Data availability statement
The experiment in this article earned Open Data and Open Materials badges for transparent practices. The materials and data are available at: https://osf.io/k73ep/overview.


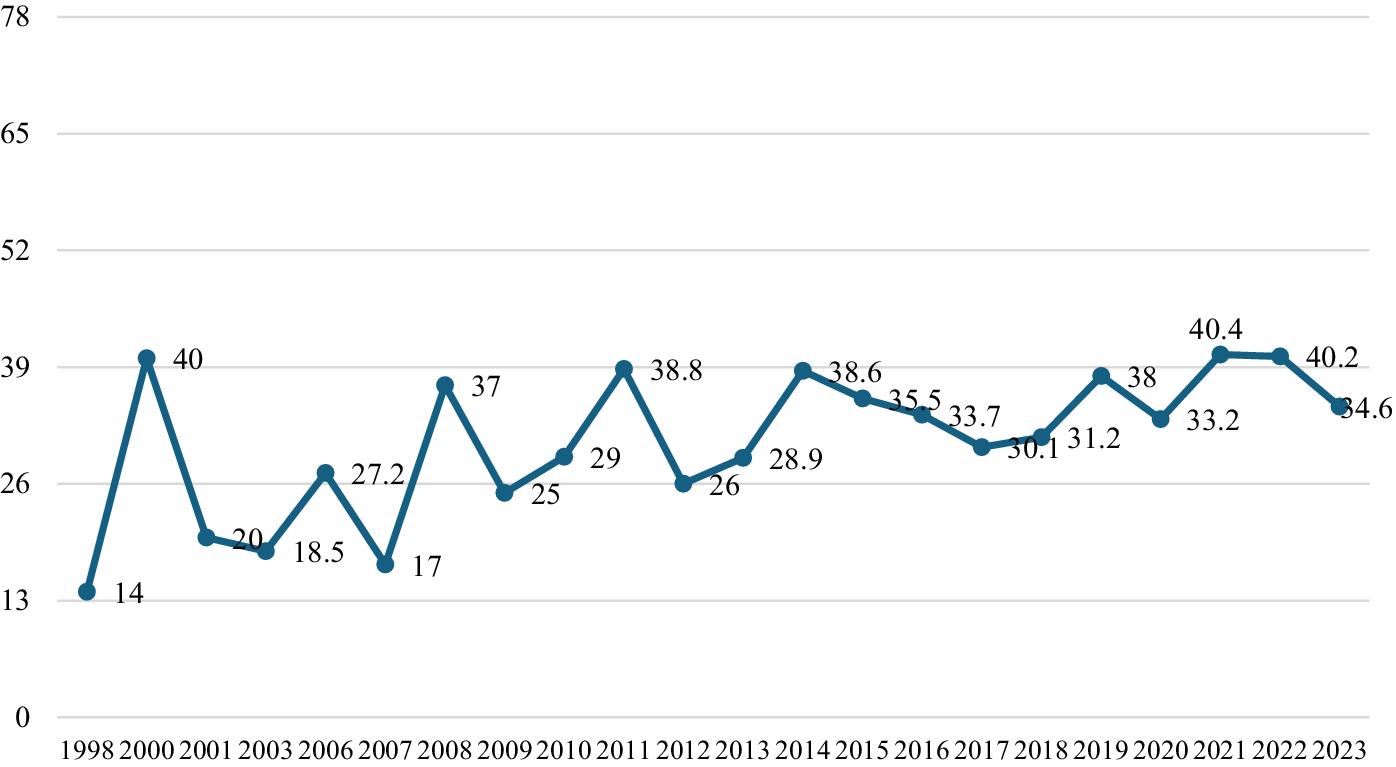
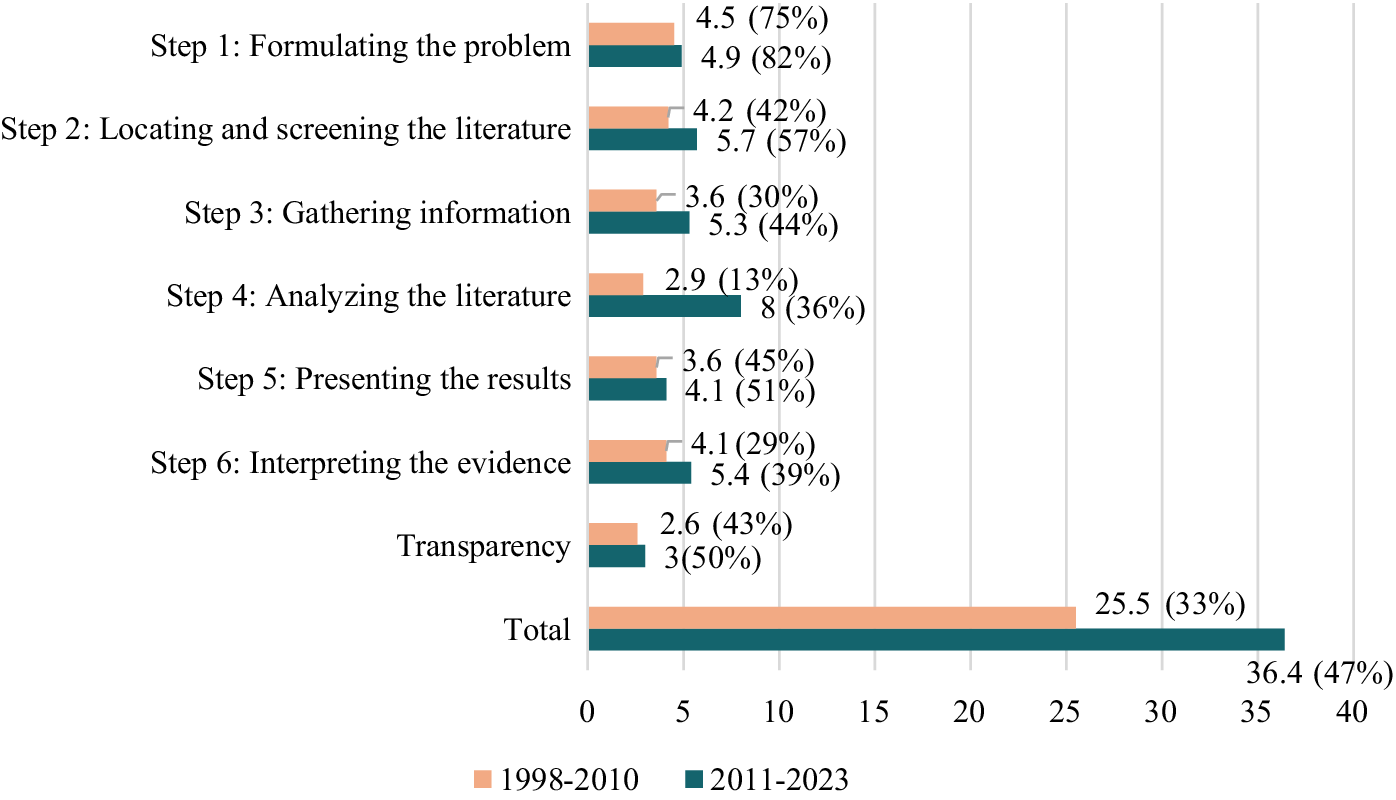

 Open access