


The transition out of upper secondary education (cumulating in the degree [Fach-]Abitur in Germany) is a normative life event in young adults’ development (e.g., Lane, Reference Lane2014). To date, there is limited longitudinal research targeting trajectories surrounding this life event. However, investigating and understanding this transition in more detail is crucial, as it represents an important period in young adulthood during which young adults often change their social networks, move out of their parents’ home for the first time, change their daily routine after many years of school, and enter new roles and environments, such as university or vocational training.
In the present work, we will examine the trajectories of affective well-being during the post-school transition. Affective well-being refers to an individual’s emotional state and comprises positive and negative emotional experiences (Diener, Reference Diener1984). We use longitudinal data collected in a large sample of high school graduates aged 16–20 years from shortly before graduating from upper secondary education until approximately one year later at up to four time points. In Germany, most students graduate between the ages of 16 and 19 (Autor:innengruppe Bildungsberichterstattung, 2024), although structural factors – such as the length of schooling and regional differences between federal states – contribute to some variability in graduation age. In the United States, for example, students also typically graduate aged 16–18, partly due to the age of required school attendance (The Institute of Education Sciences, 2017). The design we chose allows us to capture changes in well-being in the period after leaving upper secondary education, which is often accompanied by major life changes.
Overall, the present work pursues three aims: First, we aim to examine the average trajectories of affective well-being (in terms of positive and negative affect) from before to after graduating from upper secondary education. Second, we will compare the trajectories of global and daily assessments of affective well-being. Understanding changes in affective well-being as captured through both of these approaches is relevant as prior research suggests that these two types of assessments might have differential predictive value: Although daily affect might tend to predict physical responses, global affect has been linked to intentions and future-oriented decisions (e.g., Graham-Engeland et al., Reference Graham-Engeland, Sin, Smyth, Jones, Knight, Sliwinski, Almeida, Katz, Lipton and Engeland2018; Wirtz et al., Reference Wirtz, Kruger, Napa Scollon and Diener2003). Third, we will examine between-person differences in the quality of graduates’ motivation for a post-school pathway as a predictor of inter-individual differences in well-being trajectories.Footnote 1 In doing so, the present work attempts to gain a deeper and more nuanced understanding of average changes (and inter-individual differences therein) in both dimensions of affective well-being obtained via longitudinal panel methods and intensive longitudinal (daily diary) methods.
Affective well-being during the post-school transition
Typical school transitions are accompanied by changes for young adults, for example in their social environment, which may affect their behavior and well-being (e.g., Benner, Reference Benner2011; Benner et al., Reference Benner, Shen and Kloska2024; Hofer et al., Reference Hofer, Robillard, Legg and Turner2024). One of these transitions is graduating from school (i.e., the transition out of upper secondary education). However, comparatively few studies investigated the trajectories of affective well-being during this transition (e.g., Litalien et al., Reference Litalien, Lüdtke, Parker and Trautwein2013; Rogers et al., Reference Rogers, Updegraff, Iida, Dishion, Doane, Corbin, van Lenten and Ha2018; Williams et al., Reference Williams, Ciarrochi and Heaven2015). According to Diener (Reference Diener1984), higher affective well-being comprises high positive and low negative affect. This conceptualization aligns with the widely used circumplex model of affect (Watson et al., Reference Watson, Clark and Tellegen1988), according to which affect is a two-dimensional construct. These conceptualizations propose that these two dimensions are relatively independent, implying that the presence of positive affect does not necessarily imply the absence of negative affect (and vice versa). Building on these ideas, the present work targets both changes in positive and negative affect across the transition out of upper secondary education – aligning with previous work in this area (e.g., Litalien et al., Reference Litalien, Lüdtke, Parker and Trautwein2013; Rogers et al., Reference Rogers, Updegraff, Iida, Dishion, Doane, Corbin, van Lenten and Ha2018; Williams et al., Reference Williams, Ciarrochi and Heaven2015).
Litalien et al. (Reference Litalien, Lüdtke, Parker and Trautwein2013) analyzed longitudinal data on German high school students who reported their global affective well-being once during their last year of upper secondary education and then again two years after graduation. Results indicated that positive affect increased and negative affect decreased across this two-year time window. Williams et al. (Reference Williams, Ciarrochi and Heaven2015) collected longitudinal data of Australian high school graduates who indicated their positive and negative affect over the past month and found mixed results for changes in well-being from mid-year of their final year of school to about one year later: There was no change in positive affect, negative affect significantly decreased.
Rogers et al. (Reference Rogers, Updegraff, Iida, Dishion, Doane, Corbin, van Lenten and Ha2018) captured well-being on a more fine-grained temporal resolution and assessed students’ daily affective well-being every Sunday and Wednesday for 28 weeks over a 6-month period from before the start of college through the entire first semester. Results revealed a decline in positive affect, whereas negative affect remained stable. Overall, prior findings on average changes in affective well-being during the transition out of secondary education are mixed. Multiple reasons might account for this inconsistency, two of which will be targeted in the present work: heterogeneity in terms of timing and assessment and inter-individual differences in graduates’ motivation for the post-school pathway.
Assessing different temporal levels and different self-levels
First, the consideration of different time points and time periods may have led to these mixed research findings. In contrast to Rogers et al. (Reference Rogers, Updegraff, Iida, Dishion, Doane, Corbin, van Lenten and Ha2018), who examined the short-term changes across the transition event by assessing participants’ well-being from before the start of college until the end of the semester, Litalien et al. (Reference Litalien, Lüdtke, Parker and Trautwein2013) and Williams et al. (Reference Williams, Ciarrochi and Heaven2015) assessed participants’ well-being twice over a two-year (Litalien et al., Reference Litalien, Lüdtke, Parker and Trautwein2013) and one year (Williams et al., Reference Williams, Ciarrochi and Heaven2015) period, respectively. Such long inter-measurement intervals cannot capture short-term changes or potential non-linear changes across this transition. In the present work, we tackled this issue by using data from a study in which high school graduates’ well-being was assessed up to four times, spanning shortly before graduating from upper secondary education until approximately one year later. We investigated how well-being changes from shortly before graduating from upper secondary education to approximately half a year after graduating from upper secondary education at multiple waves situated around this transition and expected well-being to show an initial increase after graduation, followed by a decline in the months after entering post-school pathways.
Rogers et al. (Reference Rogers, Updegraff, Iida, Dishion, Doane, Corbin, van Lenten and Ha2018) asked participants to indicate their daily positive and negative affect, whereas Williams et al. (Reference Williams, Ciarrochi and Heaven2015) assessed experiences in the past month. Mixed results may also be explained by differences in the type of information captured by the two assessment methods. Short-term memory reports (i.e., daily diaries used by Rogers et al., Reference Rogers, Updegraff, Iida, Dishion, Doane, Corbin, van Lenten and Ha2018) tend to reflect more state-like aspects of affect, whereas longer-term memory reports (i.e., one-month recall used by Williams et al., Reference Williams, Ciarrochi and Heaven2015) tend to reflect more trait-like evaluations, with different types of selves being measured in the different reports: Short-term memory reports are more reflective of the experiencing self, whereas longer-term memory reports align more closely with the believing self (Conner & Barrett, Reference Conner and Barrett2012). The accessibility model of emotional self-report (Robinson & Clore, Reference Robinson and Clore2002) suggests that global self-reports recruit semantic memory processes and are less direct representations of actual experiences than momentary reports. In contrast, retrospective reports (such as reports collected at the end of a day) are assumed to recruit episodic memory processes and therefore better approximate (though not perfectly resemble) actual experiences. In the context of transitioning out of upper secondary education, better understanding differences between assessment types is important as global ratings (capturing the believing self) might be relevant for individuals’ explicit drop-out intentions: It is conceivable that for the decision to terminate one’s tertiary education or other life paths, believing to experience a lot of negative emotions might be more relevant than the amount of negative emotions experienced in daily life. The importance of beliefs and memories has been shown in a study by Wirtz et al. (Reference Wirtz, Kruger, Napa Scollon and Diener2003), in which retrospective reports of the quality of a vacation (but not momentary reports collected during the vacation) were associated with the intention to repeat this vacation. On the other hand, momentary ratings capturing the experiencing self might be more proximal predictors of physical symptoms (such as inflammation; see Graham-Engeland et al., Reference Graham-Engeland, Sin, Smyth, Jones, Knight, Sliwinski, Almeida, Katz, Lipton and Engeland2018) and prodromes of developing (mental) health problems (see Conner & Barrett, Reference Conner and Barrett2012).
Differences in assessment types might result in different mean levels, with more global assessments typically yielding higher mean scores than daily or momentary ratings (the “memory-experience gap,” see e.g., Miron-Shatz et al., Reference Miron-Shatz, Stone and Kahneman2009; Tadić et al., Reference Tadić, Braam, van Vliet and Veenhoven2014). Crucially, however, global and daily assessments in psychological experiences can also differ in their change dynamics: Neubauer and Schmiedek (Reference Neubauer and Schmiedek2024) reported data showing that students’ satisfaction with study content changed across the semester, but this change was more pronounced for retrospective weekly ratings compared to daily ratings. Building on these results, we investigated whether changes in the ratings of daily well-being differ from changes in the ratings of global well-being in the present work.
Motivation as a predictor of between-person differences in well-being trajectories
In the research on well-being trajectories during the post-school transition presented so far, the focus has primarily been on general, average changes in well-being. However, individuals often differ in developmental processes such as the adaptation to critical life events (e.g., Nesselroade & Baltes, Reference Nesselroade and Baltes1979). These individual differences may have been masked in the overall average trajectories observed in previous work. For example, if some individuals experienced a strong increase in their affective well-being during the post-school transition, while others experienced a strong decrease, the average might appear attenuated. A more precise understanding of these changes therefore requires a closer examination of heterogeneity and its predictors.
One of these relevant predictors might be the reasons for choosing a post-school pathway. In this regard, self-determination theory (SDT; Ryan & Deci, Reference Ryan and Deci2017) provides a suitable framework for understanding how individuals’ reasons for their actions are related to their well-being. According to SDT, individuals’ motivation can be classified on a continuum ranging from very controlled (e.g., because people important to them expect them to do so) to very autonomously motivated reasons (e.g., because they consider the chosen pathway to be fun and interesting). The theory predicts that more autonomous forms of motivation lead to higher well-being. In the context of the post-school transition, this framework might be highly relevant: Young adults typically make one of their first independent life decisions when choosing a post-school pathway. The degree to which this decision is determined by autonomous or controlled motivated reasons may be related to how well they adapt to new challenges and ultimately to their well-being. Hence, examining the links between motivation and well-being trajectories may be crucial to understanding individual differences in developmental trajectories.
Some prior empirical studies investigated the links between an individual’s motivation and affective well-being (e.g., Hope et al., Reference Hope, Holding, Verner-Filion, Sheldon and Koestner2019; Litalien et al., Reference Litalien, Lüdtke, Parker and Trautwein2013; Sosin et al., Reference Sosin, Kramer and Neubauer2024; Sosin & Neubauer, Reference Sosin and Neubauer2024). In these studies, a higher relative degree of relative autonomous motivation has been positively linked to affective well-being (e.g., Hope et al., Reference Hope, Holding, Verner-Filion, Sheldon and Koestner2019; Litalien et al., Reference Litalien, Lüdtke, Parker and Trautwein2013; Sosin et al., Reference Sosin, Kramer and Neubauer2024; Sosin & Neubauer, Reference Sosin and Neubauer2024). In higher education, for example, students who reported higher autonomous motivation for study related tasks in the past week reported higher positive and lower negative affect in that week than students with lower autonomous motivation (Sosin et al., Reference Sosin, Kramer and Neubauer2024). Passeggia et al. (Reference Passeggia, Testa, Esposito, Picione, Ragozini and Freda2023) reported cross-sectional associations between intrinsic study motivation for choosing the degree program and students’ university-related affective well-being, but more extrinsic forms of motivation were not related to university-related well-being at the end of the second semester of the participants’ first year of study. In contrast, controlled motivation has been associated more specifically to negative outcomes such as negative affect (Benita et al., Reference Benita, Arbel and Milyavskaya2023) or stress and ill-being (Holding et al., Reference Holding, Moore, Moore, Verner-Filion, Ouellet-Morin and Koestner2021). Such differential associations of autonomous motivation with well-being indicators, and controlled motivation with ill-being indicators, respectively, are often interpreted through the lens of a dual process model of need fulfillment (Vansteenkiste & Ryan, Reference Vansteenkiste and Ryan2013) which proposes two paths. The first path – the so-called “bright path of need fulfillment” – links positive, need fulfilling environments (that are also be conducive to autonomous motivation) to higher well-being. In contrast, the so-called “dark path of need fulfillment” links negative, need thwarting environments (which likely also induces more controlled forms of motivation) to higher ill-being. Building on this, we investigated whether autonomous motivation can attenuate the decrease in positive affect and controlled motivation is related to a greater increase in negative affect.
The present study
The aim of the present work was to examine changes in high school graduates’ affective well-being during the transition out of upper secondary education. Data from an ongoing measurement burst study were used, in which participants indicated their well-being in up to four measurement waves over a period of approximately one year. This design allowed us to analyze (a) average well-being trajectories during the post-school transition, (b) differences between global assessments and daily assessments of well-being, and (c) the links between well-being trajectories and the motivation for a post-school pathway.
As graduating has been associated with an increase in well-being (e.g., Bühler et al., Reference Bühler, Orth, Bleidorn, Weber, Kretzschmar, Scheling and Hopwood2024), we expected well-being to increase from shortly before graduating from upper secondary education (Wave 1) to shortly after graduating from upper secondary education (Wave 2; Hypothesis [H] 1.1) Additionally, based on Rogers et al. (Reference Rogers, Updegraff, Iida, Dishion, Doane, Corbin, van Lenten and Ha2018) and other research on changes in related well-being components (e.g., Conley et al., Reference Conley, Kirsch, Dickson and Bryant2014), we expected well-being to decrease from shortly after graduating from upper secondary education (Wave 2) to shortly after beginning a post-school pathway (Wave 3; H1.2), as well as from shortly after beginning a post-school pathway to approximately half a year after graduating from upper secondary education (Wave 4; H1.3).
Next, building on Neubauer and Schmiedek (Reference Neubauer and Schmiedek2024), we expected that changes in daily well-being ratings will differ from changes in global well-being ratings (H2).
Last, based on the theoretical predications of SDT (Ryan & Deci, Reference Ryan and Deci2017), we predicted that autonomous motivation would be associated with a smaller decrease in positive affect after graduation (i.e., between Wave 2 and 3: H3.1a; and between Wave 3 and 4: H3.2a). Similarly, we expected higher controlled motivation to be associated with a lager increase in negative affect in the same timeframe (i.e., between Wave 2 and 3: H3.1b; and between Wave 3 and 4: H3.2b).
Method
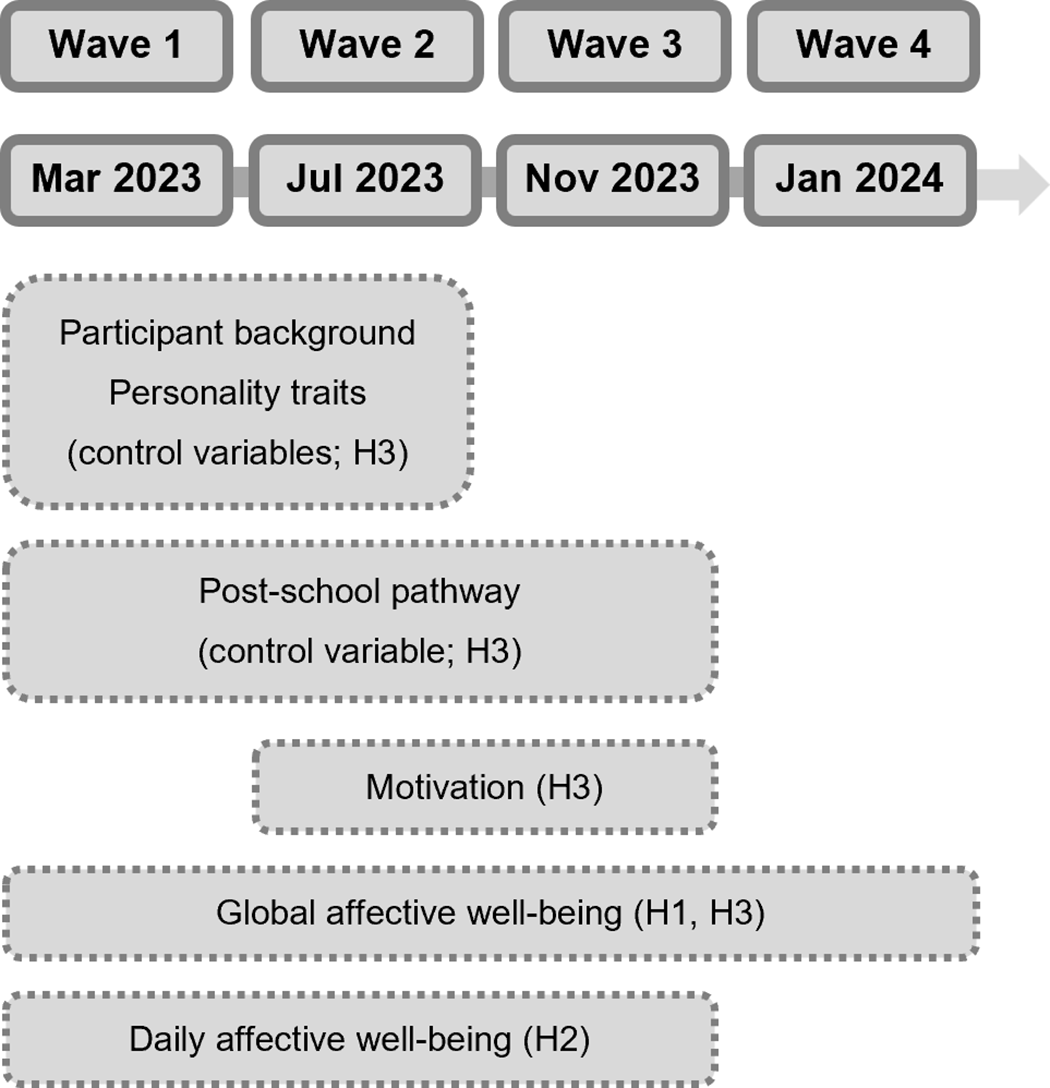
Data from an ongoing measurement burst study examining the adjustment of young adults to the transition out of upper secondary education (ExTra; https://osf.io/nep7b/) were used. Individuals who have completed this degree in 2023 participate in up to nine waves, which take place between March 2023 and May 2026. Participants complete a global questionnaire in all nine waves. In five of the nine waves (Wave 1, 2, 3, 5, and 6), they additionally take part in an experience sampling part and a follow-up questionnaire. The data collection procedure as well as a complete overview of all constructs assessed in the study can be found in the codebook in the accompanying OSF repository (https://osf.io/nep7b/). Additionally, Figure 1 provides an overview of the study parts that were used in the present work, including all relevant variables and their relation to the hypotheses.
Variables used in the present work, including relation to hypotheses.

Data of the first four waves of the study, collected from March 2023 to January 2024, were used to investigate the research questions of the present work. Specifically, data from the global questionnaires (Wave 1–4) and the daily evening questionnaires (Wave 1–3; further referred to as daily questionnaires) were relevant for the hypotheses of the present work. Only study parts and measurement instruments relevant to the present work are described in the following sections.
Transparency and openness
All anonymized data of this project are publicly available (https://osf.io/nep7b/). We provide the R script for all analyses reported in the present research as well as all relevant data sets in the accompanying OSF repository (https://osf.io/). Sample size considerations can be found in the study protocol (https://osf.io/nep7b/). The sample size was not specifically planned for all hypotheses in the present work; however, H1.1 in the study protocol (Version 2.1; June 17, 2024) corresponds to H1.2, and H1.2 to H3.2 in the present work. Statistical analyses were conducted using the open-source statistical program R (version 4.3.1; R Core Team, 2023) running RStudio (version 2023.12.1; Posit Team, 2023). All hypotheses and data analyses were pre-registered (https://osf.io/fkuyj/) and approval for the ExTra-study has been obtained from the Ethics committee at DIPF (protocol number: DIPF_EK_2022_21).
Sample
Participants were recruited in two phases: The sample of the first phase (further referred to as original sample) was recruited from July 2022 until March 2023. Participants were primarily recruited via social media (e.g., ads on Instagram), contacting German high schools, and information booths at career guidance fairs. As the intended sample size of N = 900 was not reached at the end of this recruitment phase (prior to Wave 1), additional participants (further referred to as refreshment sample) were recruited prior to Wave 2 (i.e., between March and July 2023). In this second phase, participants were recruited via ads on Instagram. Inclusion criteria were that participants (a) had an Internet-enabled smartphone with Android or iOS operating system and agreed to install the Samply Research app (Shevchenko et al., Reference Shevchenko, Kuhlmann and Reips2021) on their smartphone for the duration of the study, (b) were at least 16 years old, and (c) graduated from upper secondary education in Spring/Summer 2023.
Participants of the refreshment sample (who entered the study in Wave 2) were drawn from the same target population (students graduating in Spring/Summer 2023) as the original sample (who started in Wave 1). Comparing the key variables between the original and the refreshment sample using t tests for independent samples showed that participants in the original sample reported significantly higher global positive affect, t(214.86) = 3.16, p = .002, d = .31, and lower global negative affect, t(233.36) = –3.60, p < .001, d = −.33, compared to participants in the refreshment sample in Wave 2. However, there were no differences on any of the other key variables of this research, so the two samples were combined for the present work (N = 897). Details on means, standard deviations, and group comparisons are reported in Table S1 in the online supplemental material.
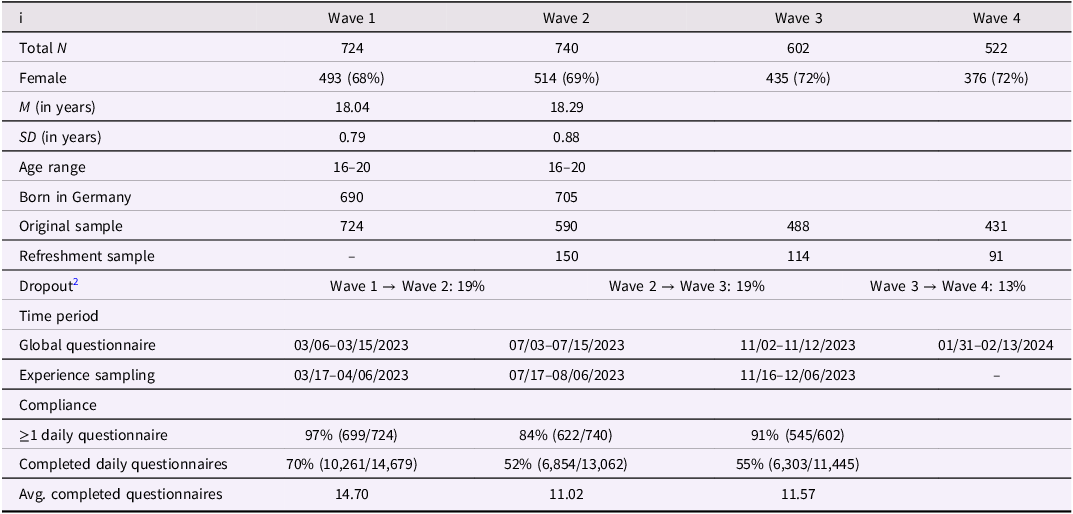
As we were specifically interested in the transition to a new chapter (i.e., the post-school pathway), and individuals typically graduate from high school at the age of 19 (Autor:innengruppe Bildungsberichterstattung, 2024), we excluded n = 5 participants who indicated that they did not graduate from high school in 2023, and n = 18 who were older than 20 years (we included an additional year for individuals who repeated a grade). Hence, our sample corresponds closely to normative educational pathways in Germany and does not broadly include individuals who are markedly ahead of or behind this typical developmental task. Thus, N = 874 participants provided data that were analyzed in the present work (see Table 1 for number of participants and measurement time points).
Detailed overview of the number of participants, exact time periods of measurement waves, and compliance rates

Table 1 Long description
The table provides a detailed overview of participant data across four waves. It includes columns for Wave 1, Wave 2, Wave 3, and Wave 4, with rows for various metrics such as Total N, Female, M (in years), SD (in years), Age range, Born in Germany, Original sample, Refreshment sample, Dropout, Time period, Compliance, ≥1 daily questionnaire, Completed daily questionnaires, and Avg. completed questionnaires. Each row lists specific values for each wave. For example, the Total N row shows 724 for Wave 1, 740 for Wave 2, 602 for Wave 3, and 522 for Wave 4. The table also includes time periods for global questionnaires and experience sampling, as well as compliance rates and the number of completed daily questionnaires.
Note. For Wave 2, M, SD, range, and ethnicity are reported for the refreshment sample. Compliance is defined as (1) the proportion and absolute number of participants who completed at least one daily questionnaire (relative to those who completed the global questionnaire), (2) the number of (at least partially) completed daily questionnaires out of the total possible, and (3) the mean number of daily questionnaires out of 21 possible questionnaires (3 weeks of 1 per day) completed per participant.
Procedure
All questionnaires were implemented in SoSci Survey (Leiner, Reference Leiner2021) and sent to the participants’ smartphones via push notifications using the Samply Research app (Shevchenko et al., Reference Shevchenko, Kuhlmann and Reips2021). By clicking on the notification, participants were directed to the online questionnaire in the browser.
Participants completed a global questionnaire in all measurement waves. In Wave 1, 2, and 3, participants additionally participated in a three-week experience sampling part following the global questionnaire. The notifications for the daily questionnaires were sent out between 8:00 pm and 8:15 pm every day for three weeks. Daily questionnaires should be completed before going to bed and were accessible up to nine hours after they were sent.
For participating in the global questionnaire, participants received a retail voucher worth 10€. In Wave 1 (one daily evening questionnaire), participants received a voucher worth 20€ for participating in the experience sampling part (plus 5€ bonus if they completed at least 85% of the daily questionnaires). In Wave 2 (four experience sampling questionnaires and one daily evening questionnaire; five questionnaires per day in total), participants received 30€ (plus 10€ bonus) for participating in the experience sampling part. Last, in Wave 3 (four experience sampling questionnaires and one daily evening questionnaire; five questionnaires per day in total), a 5€ voucher was provided if less than 30% of the experience sampling part was completed, 30€ if at least 30% was completed, and again 10€ bonus for participating in at least 85% of the experience sampling part. Participants who received the bonus also received individualized feedback on their data.
Dropout was 19% from Wave 1 to Wave 2, and again 19% from Wave 2 to Wave 3, and 13% from Wave 3 to Wave 4. At each wave, most participants (with 97% [699 out of 724] in Wave 1, 84% [622/740] in Wave 2, and 91% [545/602] in Wave 3) completed at least one daily questionnaire. Compliance rates for the daily diary part were 70% (10,261/14,679) in Wave 1, 52% (6,854/13,062) in Wave 2, and 55% (6,303/11,445) in Wave 3. On average, participants completed 14.70 daily questionnaires in Wave 1, 11.02 in Wave 2, and 11.57 in Wave 3. Details on means, standard deviations, and group comparisons between individuals who dropped out and those who did not are reported in Table S2 in the online supplemental material.
Measurement instruments
Global questionnaires
Participant Background (Control Variable). In Wave 1 (original sample) or in Wave 2 (refreshment sample), participants were asked about their father’s and mother’s highest level of education. For both, participants chose among options “no degree,” “lower secondary school,” “intermediate secondary school,” “degree comprehensive school in the former German Democratic Republic,” “advanced degree,” “certificate for entering Universities of Applied Sciences,” “advanced degree,” “general university entrance certificate,” “university degree,” “PhD,” and “other.”Footnote 3 Additionally, participants rated how they get by with the money they have available on average every month in Wave 3 on a 5-point Likert scale ranging from “very poorly” to “very well.”
Post-School Pathway (Control Variable). In Wave 1 and 2, participants were asked which post-school pathway they intended to start in the Fall 2023 (i.e., around September/October). In the following waves, they were asked whether they had taken up this post-school pathway. If this was not the case, the participants were asked about the new post-school pathway. Participants chose among options (1) studying at a university, (2) dual study program, (3) apprenticeship, (4) voluntary social year, voluntary ecological year, something similar, (5) work & travel, (6) au pair, (7) gap year, (8) something else, and (9) don’t know yet. Option 9 “don’t know yet” was a response option in Wave 1 and 2, but not in Wave 3. Detailed information on the reported post-school pathways can be found in Table S3.
Personality Traits (Control Variable). We controlled for the Big Five personality traits given their previously established associations with well-being (e.g., Steel et al., Reference Steel, Schmidt and Shultz2008) and their link to experiences during life events (e.g., Denissen et al., Reference Denissen, Luhmann, Chung and Bleidorn2019). The short version of the Big Five Inventory (BFI-K; Rammstedt & John, Reference Rammstedt and John2005) was used to assess the personality traits. The 4 (agreeableness, extraversion, conscientiousness, neuroticism) and 5 (openness) items, which were assessed in Wave 1 (original sample) or 2 (refreshment sample) were averaged into their five subscales. Internal consistencies (McDonald’s ω) were agreeableness: ω = .51, conscientiousness: ω = .67, extraversion: ω = .79, openness: ω = .70, and neuroticism: ω = .75.
Motivation. Participants were asked why they were planning (Wave 2) or pursuing (Wave 3) their previously stated post-school pathway.Footnote 4 Twelve items assessed individuals’ motivation (Ryan & Connell, Reference Ryan and Connell1989; Sheldon et al., Reference Sheldon, Osin, Gordeeva, Suchkov and Sychev2017), which were answered on a 7-point Likert scale ranging from “completely disagree” to “completely agree.” Three items each assessed intrinsic (e.g., “…I think it’s exciting.”), identified (e.g., “…it is personally important to me.”), introjected (e.g., “…I would feel bad if I didn’t do so.”), and external motivation (e.g., “…I feel like I have to.”). The items assessing intrinsic and identified motivation were aggregated into one subscale (autonomous motivation), and the items assessing introjected and external motivation were aggregated into one subscale (controlled motivation) for Wave 2 and for Wave 3, respectively (e.g., Benita et al., Reference Benita, Arbel and Milyavskaya2023; Perunovic et al., Reference Perunovic, Heller, Ross and Komar2011).
Affective Well-Being. Eight items were used to assess participants’ global affective well-being in Wave 1, 2, 3, and 4 (based on Cloos et al., Reference Cloos, Ceulemans and Kuppens2023; Russell, Reference Russell1980). Participants rated how much they felt “happy,” “cheerful,” “relaxed,” and “satisfied” (positive affect), and “anxious/afraid,” “angry,” “irritated,” and “sad” (negative affect) in general on a 7-point Likert scale ranging from “not at all” to “very much.”
Daily questionnaires
Affective Well-Being. In Wave 1, 2, and 3, daily affect was assessed using the same eight items as used for affective well-being in the global questionnaires with the instruction being adapted to participants’ feelings today. Each item was averaged for each person and measurement wave (Wave 1, 2, and 3), resulting in a total of 8 values (4 positive and 4 negative affect items) per participant and measurement wave. The four items measuring positive and the four items measuring negative affect were then averaged for each measurement wave for each person. Daily positive and negative affect were operationalized as the average of the daily affect reports provided each evening.
Data analysis
Data analyses and criteria were pre-registered (https://osf.io/fkuyj/). Latent change score models were estimated in RStudio using lavaan (Rosseel, Reference Rosseel2012) to test the hypotheses.
Measurement invariance
We tested whether the measurement instruments assessed the same constructs at each measurement wave, that is, we tested measurement invariance over time (see e.g., Widaman et al., Reference Widaman, Ferrer and Conger2010 for an overview of measurement invariance in longitudinal research). Measurement invariance was tested for global and daily affect (separately for positive and negative affect) across the waves. Increasing levels of measurement invariance were tested, that is, configural (items loaded on one common factor; no restrictions imposed), weak (factor loadings constrained to be equal across time), strong (factor loadings and intercepts constrained to be equal across time), and strict invariance (factor loadings, intercepts, and residual variances constrained to be equal across time). The models were compared using the Bayesian Information Criterion (BIC), the root mean square error of approximation (RMSEA), the standardized root mean square residual (SRMR), and the comparative fit index (CFI). The model with the stronger restrictions was accepted if at least three of the following four conditions were met (see Chen, Reference Chen2007): (1) the bayesian information criterion of the model was smaller, (2) the increase in root mean square error of approximation was not larger than .015, (3) the increase in standardized root mean square residual was not larger than .030 (weak invariance)/.015 (strong and strict invariance), and (4) the decrease in comparative fit index was not larger than .010.
Well-being trajectories during the post-school transition
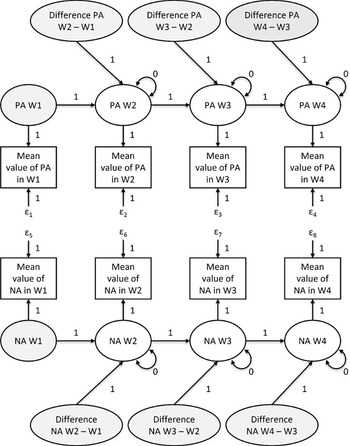
Neighboring change models (e.g., Brose et al., Reference Brose, Neubauer and Schmiedek2022; Quintus et al., Reference Quintus, Egloff and Wrzus2021) were applied to data from the global questionnaires of Wave 1–4. These models capture (piecewise) mean level changes in affective well-being from one wave to the next. Unlike growth curve models they do not assume a continuous trajectory across waves, but they are more flexible in accommodating non-linear change. The estimated models correspond to change score models sensu McArdle (Reference McArdle2009) and they can be understood as a special case of general latent change score models. Using this approach, we were able to estimate intra-individual changes between neighboring measurement waves while accounting for inter-individual differences in these changes (which we examined in H3). A graphical representation of the model that was used to test H1 can be seen in Figure 2; a more detailed description of the model can be found in the online supplemental material.
Latent change score model testing H1.
Note. W1–W4 = wave 1–4. The estimated means of the latent factors PAW1 and NAW1 and of the latent change variables (Difference PA W2–W1, W3–W2, W4–W3, and difference NA W2–W1, W3–W2, W4–W3), are not shown in the figure. Additionally, covariances of the 8 latent variables marked in gray were freely estimated but are not shown in the figure. The intercepts of the latent factors (PA W2, W3, W4; NA W2, W3, W4) and the observed variables (mean values of PA and NA in wave 1, 2, 3, and 4) were not estimated. The key variables of interest in the present work were the latent difference variables which represent mean level changes in affect from one measurement wave to the next.

H1 was evaluated based on the latent change factors of positive and negative affect for the change between Wave 1 and 2 (H1.1), Wave 2 and 3 (H1.2), and Wave 3 and 4 (H1.3). Statistical significance was determined for the six means of the latent difference score variables. One-sided tests with an α-level of .05 were applied to test H1.
Differences between global and daily assessments
Data from the global and daily questionnaires of Wave 1–3 were used. Neighboring change models were estimated for both global and daily affect. Four latent change variables were defined for the differences in global and daily positive and negative affect between Wave 1 and 2 and between Wave 2 and 3. To test H2, contrasts between the means of the latent change variables were estimated that estimated the difference between change in global affect and daily affect. Two-sided tests with an α-level of .05 were applied to test the hypothesis.
Motivation and changes in well-being
The links between the motivation for planning a post-school pathway stated in Wave 2 and changes in well-being between Wave 2 and 3, and the links between the motivation for pursuing a post-school pathway stated in Wave 3 with changes in well-being between Wave 3 and 4 were examined in two separate models.Footnote 5
Model 1: Changes in Well-Being Between Wave 2 and 3. Data from Wave 1 (control variables), 2, and 3 from the global and the daily questionnaires were used. The changes from Wave 2 to 3 in (1) global positive, (2) daily positive, (3) global negative, and (4) daily negative affect were predicted by autonomous and controlled motivation in Wave 2. Additionally, parents’ highest degree obtained, participants’ financial situation, their post-school pathway in Wave 3, and the Big Five personality traits were controlled for. The socioeconomic status of the participant’s mother and father were added as continuous control variables,Footnote 6 as were the participant’s financial situation and the Big Five personality traits. Participants’ post-school pathway was included as a categorical variable: Seven dichotomous variables were created, coded 0 and 1, with the category of attending a university used as the reference category.
Statistical significance was determined for the unstandardized coefficients of autonomous motivation on positive affect (H3.1a) and controlled motivation on negative affect (H3.1b). One-sided tests with an α-level of .01 were applied. As pre-registered chose a more conservative alpha-level for these hypotheses to account for multiple testing of the effects of potentially correlated predictors.
Model 2: Changes in Well-Being between Wave 3 and 4. Data from Wave 1 and 2 (control variables), 3, and 4 from the global questionnaires were used. The changes from Wave 3 to 4 in global positive and negative affect were predicted by autonomous and controlled motivation in Wave 3. The same variables were controlled for as in the model for changes in well-being between Wave 2 and 3. Statistical significance was determined for the unstandardized coefficient of autonomous motivation on positive affect (H3.2a) and controlled motivation on negative affect (H3.2b) again using one-sided tests with a conservative α-level of .01 to account for multiple testing.
Results
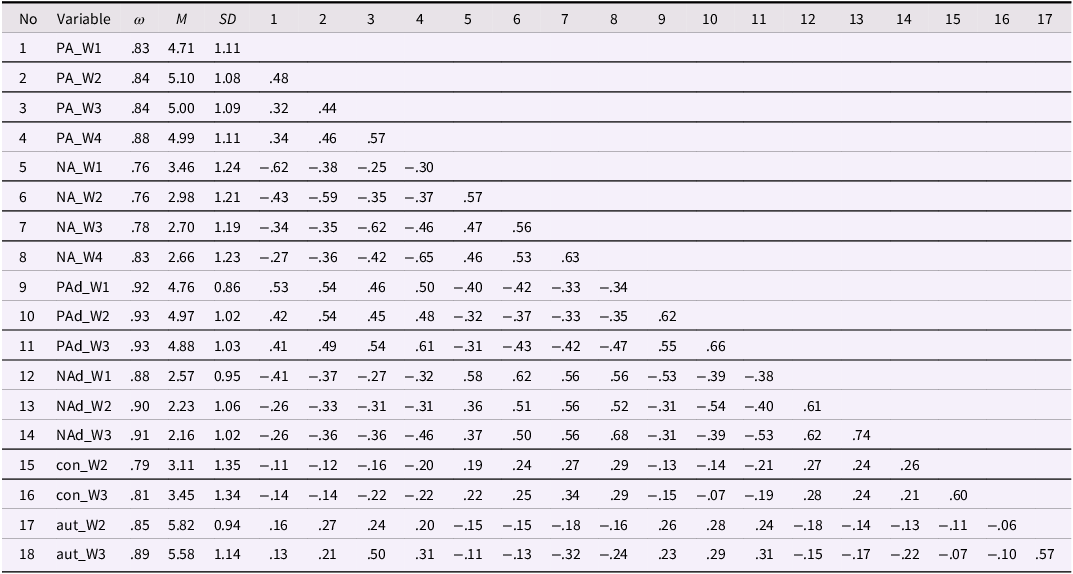
Descriptive statistics and internal consistencies for the key variables can be found in Table 2; a correlation table including all (control) variables can be found in Table S4. Between-person reliability estimates were estimated as all analyses relied on aggregated scores per wave.
Descriptive statistics, correlations, and internal consistencies for key variables

Table 2 Long description
The table presents descriptive statistics and internal consistencies for key variables across multiple waves. It consists of 18 rows and 17 columns. The columns are labeled as follows: No, Variable, ω, M, SD, and columns 1 through 14. The rows are labeled with variable names and corresponding statistics. Row 1: PA_W1, 83, 4.71, 1.11, .83, .84, .84, .88, .76, .76, .78, .83, .92, .93, .93, .88, .90, .91. Row 2: PA_W2, 84, 5.10, 1.08, .48, .32, .44, .34, -.62, -.38, -.25, -.30, -.43, -.59, -.35, .57, .53, .63. Row 3: PA_W3, 84, 5.00, 1.09, .32, .44, .34, .46, .57, .34, -.35, -.62, -.46, .47, .56, .63, .46, .53. Row 4: PA_W4, 88, 4.99, 1.11, .34, .46, .57, .34, -.62, -.38, -.25, -.30, -.43, -.59, -.35, .57, .53, .63. Row 5: NA_W1, 76, 3.46, 1.24, -.62, -.38, -.25, -.30, -.43, -.59, -.35, .57, .53, .63, .53, .46, .56, .63. Row 6: NA_W2, 76, 2.98, 1.21, -.43, -.59, -.35, .57, .53, .63, .46, .53, .63, .53, .46, .56, .63, .61. Row 7: NA_W3, 78, 2.70, 1.19, -.34, -.35, -.62, -.46, .47, .56, .63, .46, .53, .63, .53, .46, .56, .74. Row 8: NA_W4, 83, 2.66, 1.23, -.27, -.36, -.42, -.65, .46, .53, .63, .46, .53, .63, .53, .46, .56, .63. Row 9: PAd_W1, 92, 4.76, 0.86, .53, .54, .46, .50, -.40, -.42, -.33, -.34, .42, .54, .45, .48, -.32, -.37. Row 10: PAd_W2, 93, 4.97, 1.02, .42, .54, .45, .48, -.32, -.37, -.33, -.35, .62, .62, .61, .62, .62, .62. Row 11: PAd_W3, 93, 4.88, 1.03, .41, .49, .54, .61, -.31, -.43, -.42, -.47, .55, .66, .61, .62, .62, .62. Row 12: NAd_W1, 88, 2.57, 0.95, -.41, -.37, -.27, -.32, .58, .62, .56, .56, -.53, -.39, -.38, .53, .56, .61. Row 13: NAd_W2, 90, 2.23, 1.06, -.26, -.33, -.31, -.31, .36, .51, .56, .52, -.31, -.54, -.40, .61, .61, .61. Row 14: NAd_W3, 91, 2.16, 1.02, -.26, -.36, -.36, .37, .50, .56, .68, -.31, -.39, -.53, .62, .74, .62, .62. Row 15: con_W2, 79, 3.11, 1.35, -.11, -.12, -.16, .19, .24, .27, .29, -.13, -.14, -.21, .27, .24, .26, .26. Row 16: con_W3, 81, 3.45, 1.34, -.14, -.14, -.22, .22, .25, .34, .29, -.15, -.07, -.19, .28, .24, .21, .60. Row 17: aut_W2, 85, 5.82, 0.94, .16, .27, .24, -.15, -.15, -.18, .16, .26, .28, .24, -.18, -.14, -.13, -.06. Row 18: aut_W3, 89, 5.58, 1.14, .13, .21, .50, .31, -.11, -.13, -.32, -.24, .23, .29, .31, -.15, -.17, -.22.
Note. PA = Global positive affect, NA = Global negative affect, PAd = Daily positive affect, NAd = Daily negative affect, con = controlled motivation, aut = autonomous motivation, W1–W4 = Wave 1–4. ω = McDonald’s ω. Theoretically possible range = 1–7.
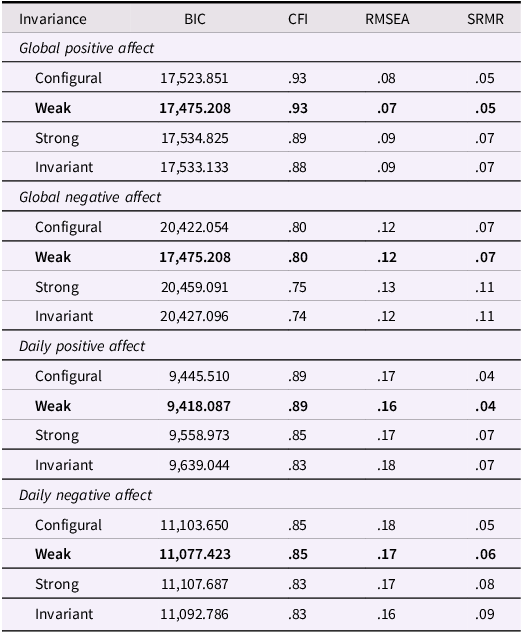
Measurement invariance for affective well-being
We found evidence for weak measurement invariance (i.e., equal factor loadings of the indicators across the waves) for global and daily positive and negative affect (see Table 3). This level of measurement invariance is also often referred to as metric invariance and suggests that the relation of items to the latent constructs do not change across time, which is the minimal necessary condition. However, item intercepts varied over time and changes in mean levels of the latent construct consequently need to be interpreted with caution, as mean differences in the underlying latent variable might not capture all mean differences in the measured items (e.g., Putnick & Bornstein, Reference Putnick and Bornstein2016).
Measurement invariance: global and daily positive and negative affect

Table 3 Long description
The table presents data on measurement invariance for global and daily positive and negative affect. It has four main sections: Global positive affect, Global negative affect, Daily positive affect, and Daily negative affect. Each section contains rows for Configural, Weak, Strong, and Invariant models. The columns are labeled Invariance, BIC, CFI, RMSEA, and SRMR. Row 1: Global positive affect, Configural, 17523.851, .93, .08, .05. Row 2: Global positive affect, Weak, 17475.208, .93, .07, .05. Row 3: Global positive affect, Strong, 17534.825, .89, .09, .07. Row 4: Global positive affect, Invariant, 17533.133, .88, .09, .07. Row 5: Global negative affect, Configural, 20422.054, .80, .12, .07. Row 6: Global negative affect, Weak, 17475.208, .80, .12, .07. Row 7: Global negative affect, Strong, 20459.091, .75, .13, .11. Row 8: Global negative affect, Invariant, 20427.096, .74, .12, .11. Row 9: Daily positive affect, Configural, 9445.510, .89, .17, .04. Row 10: Daily positive affect, Weak, 9418.087, .89, .16, .04. Row 11: Daily positive affect, Strong, 9558.973, .85, .17, .07. Row 12: Daily positive affect, Invariant, 9639.044, .83, .18, .07. Row 13: Daily negative affect, Configural, 11103.650, .85, .18, .05. Row 14: Daily negative affect, Weak, 11077.423, .85, .17, .06. Row 15: Daily negative affect, Strong, 11107.687, .83, .17, .08. Row 16: Daily negative affect, Invariant, 11092.786, .83, .16, .09.
Note. In the model for configural invariance, all items loaded on a common factor (no restrictions were imposed). In the model for weak invariance, factor loadings were equal over time. In the model for strong invariance, factor loadings and intercepts were equal over time. In the model for invariant invariance, factor loadings, intercepts, and residual variances were equal over time. Values in bold represent the chosen model according to our criteria, which were based on Chen (Reference Chen2007).
Well-being trajectories during the post-school transition
As predicted by H1.1, global positive affect significantly increased from Wave 1 to 2, b = .43, p < .001Footnote 7 , d = .39, while global negative affect significantly decreased, b = −.51, p < .001, d = −.45. Moreover, as predicted by H1.2, global positive affect significantly decreased from Wave 2 to 3, b = −.11, p = .008, d = −.10. Contrary to our predictions, global negative affect significantly decreased between Wave 2 and 3, b = −.27, p < .001, d = −.24. Additionally, in contrast to H1.3, there were no significant changes in global positive affect, b = −.02, p = .341, d = −.02, or global negative affect, b = −.04, p = .176, d = −.04, between Wave 3 and 4. Hence, high school graduates’ global affective well-being significantly increased from shortly before (Wave 1) to shortly after graduating from upper secondary education (Wave 2) with moderate to large effect sizes. There were mixed findings, however, regarding the trajectories of global affective well-being from shortly after graduating from upper secondary education to shortly after beginning a post-school pathway (Wave 3), as global positive affect significantly decreased (as expected), but global negative affect also significantly decreased (contrary to our hypothesis), with smaller effect sizes for both. Last, there were no significant changes in high school graduates’ global affect from shortly after beginning a post-school pathway until another two months later, which contradicts our expectations. Trajectories of global positive and global negative affect from Wave 1 to 4 can be seen in Figure 3.
Trajectories of global positive and negative affect.
Note. N = 862. Gray lines depict trajectories for each individual, black lines depict the mean value across participants. The gray shaded area on the x-axis indicates the period in which the participants graduated (the exact graduation date varied across individuals due to differences in graduation dates between federal states in Germany).

Differences between global and daily assessments
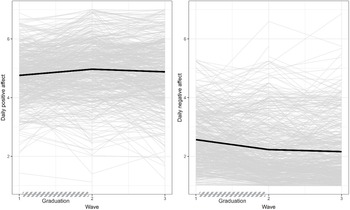
Daily positive affect significantly increased from Wave 1 to 2, b = .24, p < .001, d = .28, and significantly decreased from Wave 2 to 3, b = −.12, p = .001, d = −.15. Additionally, daily negative affect significantly decreased from Wave 1 to 2, b = −.32, p < .001, d = −.37, but there were no significant changes in daily negative affect from Wave 2 to 3, b = −.04, p = .116, d = −.05. Graphical representations of the time trends of daily positive and negative affect can be seen in Figure 4. Additionally, Table S5 and S6 depict mean values, standard deviations, and correlations for all change variables.
Trajectories of daily positive and negative affect.
Note. N = 861. The gray lines depict the trajectories for each individual, the black line depicts the mean value for all participants. The gray shaded area on the x-axis indicates the period in which the participants graduated (the exact graduation date varied across individuals due to differences in graduation dates between federal states in Germany).

Figure 4 Long description
Two line graphs depict the trajectories of daily positive and negative affect during the transition out of upper secondary education. Panel A: The left graph shows daily positive affect on the vertical axis and wave on the horizontal axis. The gray lines represent individual trajectories, while the black line shows the mean value for all participants. The gray shaded area on the x-axis indicates the period in which participants graduated. The data shows a slight increase in daily positive affect over time. Panel B: The right graph shows daily negative affect on the vertical axis and wave on the horizontal axis. Similar to the left graph, the gray lines represent individual trajectories, and the black line shows the mean value for all participants. The gray shaded area on the x-axis indicates the period in which participants graduated. The data shows a slight decrease in daily negative affect over time.
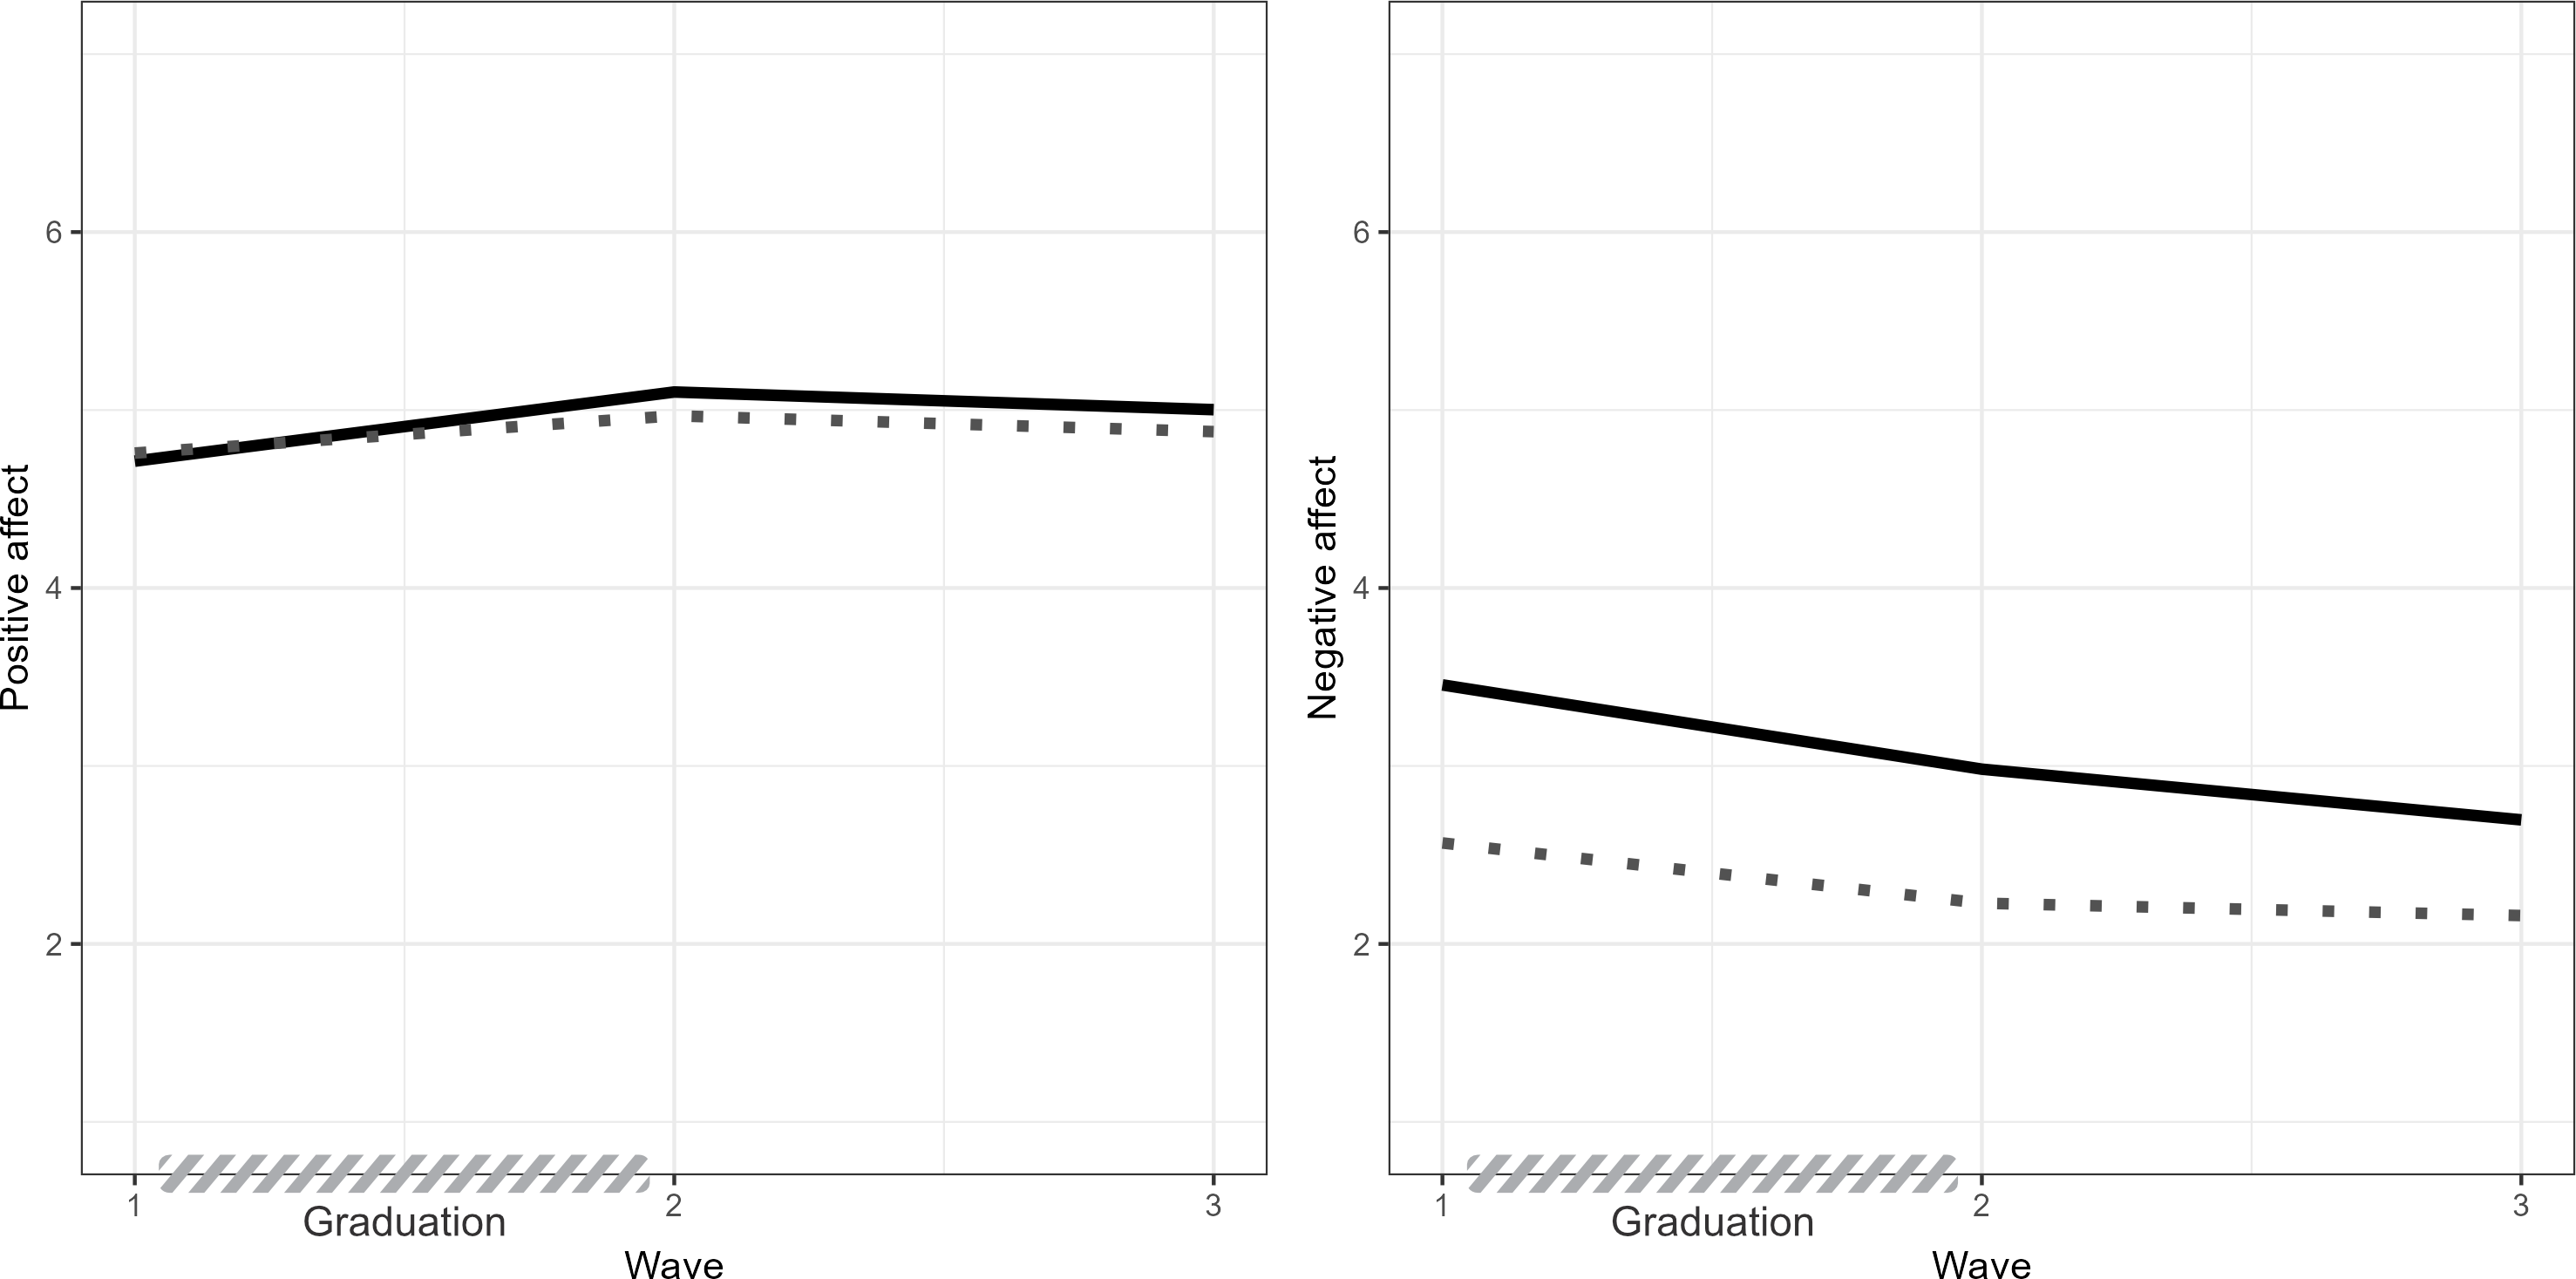
As targeted by our second hypothesis, well-being trajectories significantly differed between global and daily affect: Changes in global positive and daily positive affect significantly differed between Wave 1 and 2, b = −.20, p < .001 (two-sided). Additionally, changes in global negative and daily negative affect significantly differed between Wave 1 and 2, b = .17, p = .001 (two-sided), and between Wave 2 and 3, b = .21, p < .001 (two-sided). No significant difference was found between changes in global positive and daily positive affect between Wave 2 and 3, b = .01, p = .908 (two-sided).
These results highlight that individuals’ ratings of affective well-being differed depending on whether they were assessed on the daily (“How did you feel today?”) or the global level (“How do you feel in general?”). More specifically, there was a stronger increase in global positive affect from Wave 1 to 2 than in daily positive affect and decreases in negative affect from Wave 1 to 2 and from Wave 2 to 3 were stronger in the global than in the daily questionnaires (see Figure 5).
Differences between global and daily positive and negative affect.
Note. N = 862. The dotted line depicts daily affect, the solid line depicts global affect. The gray shaded area on the x-axis indicates the period in which the participants graduated (the exact graduation date varied across individuals due to differences in graduation dates between federal states in Germany).

Motivation and changes in well-being
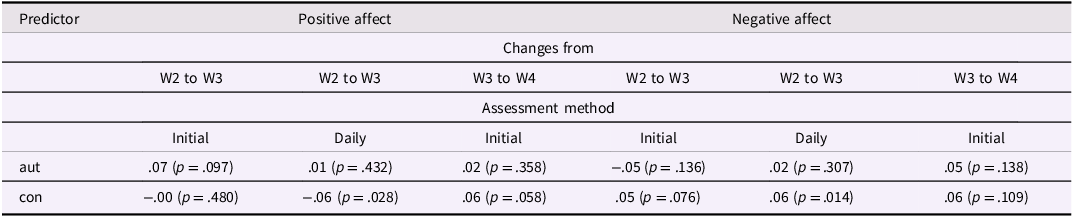
Contrary to our third hypothesis, we found no significant links between autonomous motivation for a post-school pathway and changes in global or daily positive affect, | b | < .08, p > .097 for all. Moreover, we found no significant links between controlled motivation and changes in global or daily negative affect, | b | < .08, p > .014 for all. Results are reported in Table 4, full model results can be found in Table S7 in the online supplemental material.
Effects of autonomous and controlled motivation on positive and negative affect

Table 4 Long description
The table presents data on the effects of autonomous and controlled motivation on positive and negative affect. It has four rows and three columns. The columns are labeled as Positive affect, Changes from, and Negative affect. The rows are labeled as W2 to W3, W3 to W4, and W2 to W3 under the Positive affect and Negative affect columns, and as Initial, Daily, and Initial under the Changes from column. The table includes predictors labeled as aut and con, with corresponding values and p-values for each assessment method and time period. For example, under Positive affect, Changes from W2 to W3, Initial assessment method, aut has a value of .07 with a p-value of .097, and con has a value of -.00 with a p-value of .480.
Note. One-sided p-values for unstandardized effects. W1–W4 = Wave 1–4, aut = autonomous motivation, con = controlled motivation. The table depicts only the regression coefficients for autonomous and controlled motivation; see Table S7 in the online supplemental material for full model results.
Sensitivity analyses
Some of the previous work in the context of transitions out of upper secondary education examined well-being trajectories across longer time spans such as one year (e.g., Williams et al., Reference Williams, Ciarrochi and Heaven2015). To allow for a more direct comparison of our results to this previous work, we conducted sensitivity analyses for H1 in which we examined the trajectories of global affective well-being across about one year (from Wave 1 to Wave 4). We found a significant increase in global positive, b = .27, p < .001, d = .22, and a significant decrease in global negative affect, b = −.78, p < .001, d = −.61, when only using data from these two time points spaced one year apart (see online supplemental material).
Additionally, some prior work used a measure of relative autonomous motivation (combining the two scales autonomous and controlled motivation into one score; e.g., Hope et al., Reference Hope, Holding, Verner-Filion, Sheldon and Koestner2019; Litalien et al., Reference Litalien, Lüdtke, Parker and Trautwein2013; Sosin et al., Reference Sosin, Kramer and Neubauer2024; Sosin & Neubauer, Reference Sosin and Neubauer2024). To examine whether combining these two scales altered our results, we conducted sensitivity analyses for H3 using an index representing the degree of relative autonomous motivation (see online supplement for details). We found no significant links between relative autonomous motivation and global and daily well-being trajectories.
Finally, controlling for sample membership (original vs. refreshment sample) did not alter the conclusions drawn, and removing the Big Five personality traits left the main conclusions drawn in this work unchanged (see online supplemental material).
Discussion
The goal of the present work was to examine high school graduates’ affective well-being trajectories during the transition out of upper secondary education. We extended existing empirical research by assessing both global and daily well-being from shortly before graduating from upper secondary education over a period of approximately one year using a measurement burst design. In doing so, we examined the links between the motivation for planning/pursuing a post-school pathway according to SDT and inter-individual differences in well-being trajectories.
Well-being trajectories during the post-school transition
Consistent with the idea that graduating is associated with an increase in well-being (see e.g., Bühler et al., Reference Bühler, Orth, Bleidorn, Weber, Kretzschmar, Scheling and Hopwood2024), our results indicated that global and daily affective well-being increased from shortly before to shortly after graduating from upper secondary education. Specifically, positive affect increased while negative affect decreased, suggesting an initial increase in well-being following the stressful phase of graduation, both in terms of general (“How do you feel in general?”) and aggregated daily well-being (“How do you feel today?”). However, subsequent trajectories of affective well-being showed inconsistent patterns: Both positive and negative affect on average decreased from shortly after graduating from upper secondary education to shortly after beginning a post-school pathway.
Notably, after the initial transition phase (i.e., from shortly after graduating until shortly after beginning a post-school pathway), we found no further significant average changes in positive and negative affect in the following months. During this period, reports of positive and negative affect remained relatively stable, suggesting that once an individual had settled into their new routines or roles (e.g., further education, apprenticeship), their affective well-being tends to stabilize without further major changes in either direction. This finding is to some extent inconsistent with the results by Rogers et al. (Reference Rogers, Updegraff, Iida, Dishion, Doane, Corbin, van Lenten and Ha2018), who found a significant decrease in college students’ positive affect from before the start of college across the first semester of college. However, Rogers et al. (Reference Rogers, Updegraff, Iida, Dishion, Doane, Corbin, van Lenten and Ha2018) assessed participants’ well-being twice weekly for 28 weeks. Although we did not find any changes in global affective well-being from shortly after beginning a post-school pathway until several months later, it is still feasible that daily affect may have changed during this period. Affective well-being on a daily level might be more susceptible to the influences of changes in the environment than global affect, which incorporates more stable components of one’s self-concept (Robinson & Clore, Reference Robinson and Clore2002). We hasten to add, however, that both the results of the present work (in which changes in daily affect were weaker compared to changes in global affect) and prior work targeting changes in study satisfaction in university students (e.g., Neubauer & Schmiedek, Reference Neubauer and Schmiedek2024) suggest that changes in daily ratings often tend to be smaller than corresponding changes in more global ratings.
Using multiple time points and assessment methods to understand the complex dynamics of well-being trajectories
The findings of the present work indicate complex and (in particular for positive affect) non-linear changes in affective well-being during the transition out of upper secondary school. Our sensitivity analysis, in which we used data of only two measurement waves (shortly before graduating from upper secondary education and approximately one year later), revealed an increase in positive affect and a decrease in negative affect during this time window. These results are partially consistent with the findings of Williams et al. (Reference Williams, Ciarrochi and Heaven2015). Additionally, these findings are in line with those of Litalien et al. (Reference Litalien, Lüdtke, Parker and Trautwein2013), who found similar trends in German high school students from the last year of upper secondary education until two years after graduation. These results, however, once again emphasize the importance of examining the effects of this transition using assessments at multiple time points. Relying on only two time points may potentially miss important non-linear changes in well-being and fail to capture critical changes, such as the significant decrease in positive affect from shortly after graduation to shortly after beginning a post-school pathway. To better understand these non-linear trajectories, more fine-grained longitudinal designs that assess the transition event might be useful. Such designs might involve more frequent assessments (e.g., weekly surveys) beginning shortly before graduation and continuing at least through the first six months of the post-school pathway.
Additionally, results of the present work showed that well-being trajectories significantly differed depending on whether global or daily well-being reports are assessed. These results are in line with prior empirical research in related domains (e.g., Neubauer & Schmiedek, Reference Neubauer and Schmiedek2024). Notably, for negative emotions in particular, participants’ assessments in the present study seemed to be more extreme when they gave a retrospective, general assessment of their negative affect than when they reflected on their day-to-day experiences (see Figure 5; right panel). This is in line with previous work demonstrating this so-called “memory-experience gap,” which might that negative experiences are overvalued in retrospective recalls (Miron-Shatz et al., Reference Miron-Shatz, Stone and Kahneman2009). Overall, these findings emphasize the need to consider the possibility that global and (aggregated) daily ratings differ – possibly due to different memory systems that individuals involve when they report retrospective reports or short-term retrospective reports (Robinson & Clore, Reference Robinson and Clore2002) and/or due to capturing different selves (Conner & Barrett, Reference Conner and Barrett2012).
Motivation as a predictor of between-person differences in well-being trajectories
According to SDT, higher autonomous and lower controlled motivation are positively linked to well-being. However, we found no significant links between autonomous or controlled motivation and trajectories of positive or negative affect. These results are inconsistent with the predictions of SDT and contradict previous literature on SDT (e.g., Hope et al., Reference Hope, Holding, Verner-Filion, Sheldon and Koestner2019; Litalien et al., Reference Litalien, Lüdtke, Parker and Trautwein2013; Perunovic et al., Reference Perunovic, Heller, Ross and Komar2011; Sosin et al., Reference Sosin, Kramer and Neubauer2024; Sosin & Neubauer, Reference Sosin and Neubauer2024). Yet, some important differences between these studies and the present work should be noted. For example, the participants in the present study stated why they were planning or pursuing a post-school pathway. In previous empirical research, motivation usually referred to a specific goal or a more time-discrete activity. When assessing motivation for specific activities (e.g., “Why do you want to exercise more?”), autonomous motivation seems to be linked to well-being in both the short- and the long-term (e.g., Hope et al., Reference Hope, Holding, Verner-Filion, Sheldon and Koestner2019; Litalien et al., Reference Litalien, Lüdtke, Parker and Trautwein2013; Perunovic et al., Reference Perunovic, Heller, Ross and Komar2011; Sosin et al., Reference Sosin, Kramer and Neubauer2024; Sosin & Neubauer, Reference Sosin and Neubauer2024). However, this link does not seem to be stable in the long-term for broader and more generalized activities (e.g., “Why are you choosing/pursuing your post-school pathway?”). Possibly, the difference in the “degree of globality” may account for the discrepancies between the results of the present and prior empirical work.
Furthermore, the links between an individual’s motivation and their well-being might differ at different time levels (e.g., Driver, Reference Driver2024; Voelkle et al., Reference Voelkle, Gische, Driver and Lindenberger2018). For instance, Litalien et al. (Reference Litalien, Lüdtke, Parker and Trautwein2013) investigated the long-term effects of motivation over a two-year period. In contrast, Hope et al. (Reference Hope, Holding, Verner-Filion, Sheldon and Koestner2019) investigated whether the motivation at the beginning of an academic year was related to need satisfaction two months later, which was in turn related to well-being three months later. Perunovic et al. (Reference Perunovic, Heller, Ross and Komar2011), Sosin and Neubauer (Reference Sosin and Neubauer2024), and Sosin et al. (Reference Sosin, Kramer and Neubauer2024) mainly focused on short-term time periods or contemporaneous links. Differences between the results of the present work and prior empirical research indicate that the time lag may conceivably play a significant role. SDT does not specify the time frame in which the link between motivation and well-being is expected to occur. However, based on the results of the present work, it seems conceivable that this link is initially short-lived and diminishes over time, as other everyday experiences overlay the effects on individual’s affective states. Consequently, the reasons for choosing a post-school pathway may no longer be related to individuals’ well-being months later, and other everyday experiences may have replaced their impact. Future research may examine more closely the time frame in which motivation affects well-being and how short-term and long-term dynamics may interact.
Limitations
Some limitations of the present work should be considered. First, we found evidence for weak, but not strong measurement invariance for global and daily affective well-being. Our results therefore suggest that mean level changes in the underlying items of positive and negative affect, respectively, are not fully captured by the underlying latent constructs. This implies that changes in mean levels of the individual items might differ from the changes in the scales. While the instruments were consistent across waves, shifts in how items relate to the underlying constructs over time may account for the lack of invariance. In the present work, we focused on the scales of positive and negative affect, respectively, to stay consistent with prior empirical research in this area (e.g., Litalien et al., Reference Litalien, Lüdtke, Parker and Trautwein2013; Rogers et al., Reference Rogers, Updegraff, Iida, Dishion, Doane, Corbin, van Lenten and Ha2018; Williams et al., Reference Williams, Ciarrochi and Heaven2015). Although the level of measurement invariance needed to draw meaningful conclusions about mean level change is debated (e.g., Robitzsch & Lüdtke, Reference Robitzsch and Lüdtke2023) and the “criteria should be used with caution, because testing measurement invariance is a very complex issue” (p. 502; Chen, Reference Chen2007), the results of the present work suggest that changes in mean levels of daily and global positive and negative affect should be interpreted carefully. Future research should consider targeting changes not only in the scale means of positive and negative affect, but to also examine potential changes in individual emotions or the interplay of emotions across this transition.
Second, we used data from the ExTra-study, in which German-speaking high school graduates were eligible to participate. The experiences of young adults during the post-school transition in Germany may share similarities with those in other Western countries, for example regarding changes in social networks, housing, and finances when leaving school and starting an apprenticeship. However, cultural differences – such as variations in educational systems and labor market conditions – may impact the trajectories of positive and negative affect. This may limit the generalizability of the results of the present work to other cultural or educational contexts.
Third, whereas drop-out rates between the assessment waves were comparable or even lower than in previous longitudinal studies targeting this transition (e.g., Litalien et al., Reference Litalien, Lüdtke, Parker and Trautwein2013; Srivastava et al., Reference Srivastava, Tamir, McGonigal, John and Gross2009), the compliance rates in the daily diary part were lower than often seen in the literature (Wrzus & Neubauer, Reference Wrzus and Neubauer2023). Although current research provides limited evidence for strong effects of situational characteristics on missingness in similar designs (Reiter & Schoedel, Reference Reiter and Schoedel2024), future work replicating this work should focus on further optimizing compliance rates.
Conclusion
The transition out of upper secondary education was associated with significant changes in high school graduates’ affective well-being. Both general (“How do you feel in general?”) and daily well-being (“How do you feel today?”) changed across this transition. Although the trend of change was broadly similar, there were differences in the size of changes between these two assessment types. Relevant to developmental theory, these findings highlight the multidirectional nature of developmental change: Negative and positive affect followed different trajectories, and rather than showing uniform patterns, well-being development after the transition was characterized by heterogeneous trends. Our study suggests the importance of examining well-being trajectories across (1) multiple time points and (2) different time levels to better understand complex dynamics. Although we did not find any links between the motivation for post-school pathways and well-being trajectories during this period, further research is needed to investigate the long-term associations and further trajectories in well-being. Moreover, these results suggest that other predictors may offer more informative insights into the mechanisms driving short- and long-term changes in well-being. Future research could therefore consider a broader range of factors, captured not only via global assessments but also in everyday life, to better understand and support the development of well-being in transitional periods. Such findings may have practical implications for employers, universities, and other stakeholders working with young adults in this transition phase, as they offer insights into optimizing adjustment processes to enhance well-being and ultimately potentially contribute to reducing dropout rates.
Supplementary material
The supplementary material for this article can be found at https://dx.doi.org/10.1017/S0954579426101254.
Data availability statements
R script for all analyses reported in the present research as well as all relevant data sets are provided in the accompanying OSF repository (https://osf.io/fkuyj/).
Funding statement
This research was funded by the German Research Foundation (DFG; Deutsche Forschungsgemeinschaft; Grant NE 2,480/1-1).
Competing interests
None.
Pre-registration statement
Data analyses and criteria were pre-registered (https://osf.io/fkuyj/). The pre-registration was date-stamped on August 19, 2024. In addition to the analyses reported in the manuscript, we examined a pre-registered hypothesis (originally H4) concerning three additional predictors of inter-individual differences in well-being trajectories: the perceived valence of moving out of the parental home, ending a relationship, and entering a new romantic relationship. Due to the small number of participants who experienced these events in the present sample, all analyses and results related to this hypothesis are reported in the online supplementary material rather than in the main manuscript.
AI statement
No generative AI tools were used to create texts, analyze data, or create figures for this manuscript.


 Open access