


1. Introduction
1.1. Context of reuse in the building sector
In France and across Europe, the construction sector, encompassing both building activities and infrastructure projects, is the primary source of waste. It also accounts for approximately 38% of total waste in Europe (Europa, 2023) and nearly 70% in France, where it generated around 300 million tons in 2020. Within this, the building sector alone is responsible for 48 million tons annually (ADEME, 2023). In response, the French anti-waste law for a circular economy (Ministère de la transition écologique et solidaire, 2020) introduced the concept of Products, Equipment, Materials, and Waste (PEMW). By distinguishing reusable elements (PEM) such as doors, windows, flooring, sinks, and even entire walls from non-reusable waste (W), this concept emphasises reuse as the most desirable treatment option (CSTB & OREE, 2022). However, despite multiple initiatives supporting reuse, such as guides, technical sheets, and reference documents developed by various organisations (ADEME, 2024; North-West Europe, 2021), the development of reuse-oriented supply chains remains slow and fragmented (Reference Chileshe, Rameezdeen, Hosseini and LehmannChileshe et al., 2015). Although actors across different levels, such as economic, institutional, and social, are increasingly involved, territorial coordination is limited. Existing platforms for reuse (e.g., Cycle Up, Recyclo’Bat, Opalis) struggle to match supply with demand due to the lack of an established market for reused components (Reference Rakhshan, Morel, Alaka and CharefRakhshan et al., 2020).
This situation reveals a structural disconnect between the increasing volume of construction waste and the limited progress in reuse practices, despite supportive legislative frameworks. Although the PEMW classification and national environmental targets (ADEME, 2020) provide clarity for waste management strategies, reuse remains marginal because territorial actors lack the operational and forward-looking tools needed to identify reuse opportunities and coordinate their actions. Addressing this issue requires modelling approaches that evaluate circularity not only by considering material flows but also by incorporating the influence of systemic obstacles, organisational constraints, and actor interdependencies on these flows (Reference Gallaud, Laperche and GallaudGallaud & Laperche, 2016; Reference KampelmannKampelmann, 2016). Such models could help practitioners understand where and how components lose their reuse potential during reuse activities and the impact this has on overall component flows.
Territorial estimations of building component flows could offer insights for construction and deconstruction companies to identify new business opportunities and strengthen existing activities. For example, if forecasts indicate that large quantities of wooden window frames will become available in the coming years, a deconstruction firm could choose to specialise in their selective removal, or a contractor could develop a dedicated reuse-based renovation offer. End-of-life specialists, such as reuse centres and waste disposal sites, could anticipate and adapt their strategies to address building components specifically, with new, sufficient storage centres and logistics. Local authorities could support both end-of-life, construction, and deconstruction actors by planning adequate infrastructures, facilitating coordination mechanisms, and designing territorial strategies aligned with the actual reuse potential of their built environment. At the governance level, national policymakers could draw on these territorial indicators to refine regulatory frameworks, adjust incentives, and design more precise, better-targeted circular economy policies that reflect the operational realities and constraints observed on the ground. More broadly, the development of territorial flow-prediction models also opens the possibility of coupling such approaches with environmental and social impact assessment tools. Integrating predictions of component availability with assessments of lifecycle impacts, pollution risks, and social value creation would enable a more comprehensive evaluation of reuse strategies and their implications for territorial sustainability.
This study thus raises the following research question:
-
• How can a territorial modelling approach of reuse activities support actors across the building sector in identifying reuse potentials and coordinating their actions to increase the reuse of building components?
To address this research question, the paper proceeds in three stages. First, it examines the circularity models and indicators currently applied to end-of-life components in buildings at the territorial scale and assesses their capacity to support stakeholder coordination. Second, it identifies the key factors influencing the performance of the reuse task, such as dismantling, performance assessment, and toxicity diagnostics, and their effects on component flows. Third, based on these insights, it develops a model that represents these tasks and their associated performance factors, groups them into component-scale indicators, and aggregates them into territorial-scale circularity indicators.
2. Literature review
2.1. Review of territorial circularity representations
2.1.1. Urban metabolism model
The concept of urban metabolism was first introduced by Reference WolmanWolman (1965), applying the analogy of biological metabolism to cities to describe and quantify flows of energy, water, solid materials, and waste for a population of one million. Since then, numerous urban metabolism and material flow models have been developed to characterise the materiality of the built environment and to anticipate its evolution over time. For example, Reference Schandl, Marcos-Martinez, Baynes, Yu, Miatto and TanikawaSchandl et al. (2020) proposed a neighbourhood-scale metabolism model in Sydney, integrating urban planning parameters to assess material consumption and waste generation. Reference Augiseau and KimAugiseau and Kim (2021) focused on mapping existing building stocks in the Paris region, while Reference Zheng, Wu, Zhang, Duan, Wang, Jiang, Dong, Liu, Zuo and SongZheng et al. (2017) extended this perspective to the national scale by estimating material stocks across China based on annual deconstruction rates. More recently, Reference Schiller, Gruhler, Zhang and BlumSchiller et al. (2024) introduced the Materiality Informed City Information Modelling (mCIM) framework, which integrates cadastral data and promotes co-design processes with stakeholders while addressing key challenges of scalability and transferability.
Despite these significant advances, most existing urban metabolism and material flow approaches remain highly operational and data-intensive. They often rely on high-resolution datasets such as LIDAR scans (Reference Schandl, Marcos-Martinez, Baynes, Yu, Miatto and TanikawaSchandl et al., 2020) or detailed cadastral records (Reference Schiller, Gruhler, Zhang and BlumSchiller et al., 2024), which considerably limit their replicability on other territories. Furthermore, these models generally overlook the processes through which the material flows are generated and managed. Finally, the models rarely incorporate the role of actors, institutional mechanisms, or systemic barriers that influence the potential for circularity and generally focus on material flows at the scale of specific territories (Reference Augiseau and KimAugiseau & Kim, 2021; Reference Schandl, Marcos-Martinez, Baynes, Yu, Miatto and TanikawaSchandl et al., 2020) or on raw material dynamics (Reference Zheng, Wu, Zhang, Duan, Wang, Jiang, Dong, Liu, Zuo and SongZheng et al. 2017).
2.1.2. Circularity indicators
Indicators such as the Material Circularity Indicator (Ellen MacArthur Foundation, 2019) and the Whole Building Circularity Indicator and its derivatives (Reference Khadim, Agliata, Thaheem and MolloKhadim et al., 2023, Reference Khadim, Agliata, Han and Mollo2025; Reference VanVan Vliet, 2018; Reference VerbeneVerbene, 2016) provide frameworks to assess circularity at the product or building scale. However, a large share of indicators fails to clearly specify their intended scale of application, leading to inconsistencies in boundary definitions. Moreover, their connection to specific circularity loops—such as prevention, reuse, or recycling—often remains weak or implicit. In many cases, the operational function and scope of these indicators are ambiguous. For instance, disassembly scores (Reference Falah, Falah, Marrero and Solis-GuzmanFalah et al., 2025; Reference Jiménez-Rivero and García-NavarroJiménez-Rivero & García-Navarro, 2016; Reference VanVan Vliet, 2018) are typically confined to the component level and lack an embedded broader systemic understanding of reuse processes.
At the territorial scale, circularity indicators such as material collection and recycling rates, renovation rates, total material inputs and outputs, or the number of firms involved in reuse practices (Reference Cader, Koneczna and MarciniakCader et al., 2024; Reference Falah, Falah, Marrero and Solis-GuzmanFalah et al., 2025; Reference Gravagnuolo, Angrisano and GirardGravagnuolo et al., 2019) provide valuable macro-level insights. Nevertheless, they do not capture the detailed flows of components or the mechanisms that drive them. The limited, heterogeneous nature of the data further constrains their practical application. Similar conclusions are drawn in studies encompassing construction, renovation, and deconstruction phases (Reference Anastasiades, Blom and AudenaertAnastasiades et al., 2023), which emphasise the persistent difficulty in adopting a systemic perspective by linking indicators to the actual processes and performances that shape material and component dynamics.
2.1.3. Circularity measurements in the context of urban metabolism: conclusion
Overall, these observations point to several structural limitations in the existing approaches. Current models are constrained by their limited capacity to represent the organisational and decision-making processes that govern material and component flows. At the same time, most circularity indicators are developed independently of these representations, leading to a lack of integration between analytical tools and operational strategies. Consequently, existing frameworks remain insufficient to assess the potential for reuse comprehensively or to support coordinated, territory-specific actions for a circular economy. To better measure circularity at the territorial scale, an approach that considers material flows, actor interactions, and the performance factors influencing reuse flows could be implemented.
2.2. Challenges and factors influencing the reuse of building components
According to Reference Adams, Osmani, Thorpe and ThornbackAdams et al. (2017), Reference Hobbs and AdamsHobbs et al. (2017), and Reference Rakhshan, Morel, Alaka and CharefRakhshan et al. (2020), the challenges affecting the reuse of building components can be categorised into six main areas: technical, logistical, social, governmental, economic, and environmental. In this study, three of these dimensions—social, environmental, and governance-related factors—are not retained. Social factors, such as stakeholder perception, are beyond the scope of this operationally focused analysis. Environmental considerations, although recognised as a major driver of reuse (Reference Rakhshan, Morel, Alaka and CharefRakhshan et al., 2020), are excluded because circularity is approached here from a flow-optimisation perspective. Governance-related barriers are also omitted, as they operate at the actor-network level rather than at the level of component-specific tasks.
Within this framework, three categories of challenges are considered—technical, organisational and economic—each associated with specific component-scale factors.
A technical challenge is an intrinsic component characteristic that influences its suitability for reuse. This challenge is influenced by factors such as the residual performance estimation (Reference Cabral and BlanchetCabral & Blanchet, 2024) and the disassembly potential (Reference Durmisevic, Ciftcioglu and AnumbaDurmisevic et al., 2003). The toxicity of the considered component is also considered a technical challenge, since during the deconstruction of a building, or while treating a component for reuse, there is a risk of encountering hazardous, banned or contaminating coatings on the reused component (Reference Foster, Kreinin and StaglFoster et al., 2020; Reference Rakhshan, Morel, Alaka and CharefRakhshan et al., 2020; Reference Tatiya, Zhao, Syal, Berghorn and LaMoreTatiya et al., 2018). Organisational challenges are linked to the capability of territorial actors to manage component flows under suitable conditions, particularly in relation to the components’ transportability (Reference Coenen, Santos, Fennis and HalmanCoenen et al., 2021) and the storage requirements these flows require (Reference Chinda and AmmarapalaChinda & Ammarapala, 2016; Reference Pilipenets, Kin Peng Hui, Gunawardena, Mendis and AyePilipenets et al., 2024). Economic challenges arise from the higher labour intensity of reuse activities (Reference Chileshe, Rameezdeen, Hosseini and LehmannChileshe et al., 2015), especially during time-consuming processes such as deconstruction (Reference Dantata, Touran and WangDantata et al., 2005). Influential economic factors include operational task costs (e.g., dismantling, transport, labour) (Reference Rakhshan, Morel and DaneshkhahRakhshan et al., 2021), the price competitiveness of reused components compared to new ones (Reference Dunant, Skelton, Drewniok, Cullen and AllwoodDunant et al., 2019), and the absence of a mature market for reused components (Reference Chileshe, Rameezdeen, Hosseini and LehmannChileshe et al., 2015). Purchasing decisions are further influenced by buyers’ willingness to reuse, which perceived environmental benefits may influence (Reference Chileshe, Rameezdeen, Hosseini and LehmannChileshe et al., 2015), visual appearance (Reference Dunant, Drewniok, Sansom, Corbey, Allwood and CullenDunant et al., 2017), or perceived risk (Reference Dunant, Drewniok, Sansom, Corbey, Allwood and CullenDunant et al., 2017, Reference Dunant, Drewniok, Sansom, Corbey, Cullen and Allwood2018).
These components and territorial scale factors form the basis of the proposed model. The following section presents the methodology for translating these factors into performance indicators at both component and territorial scales.
3. Overall methodology
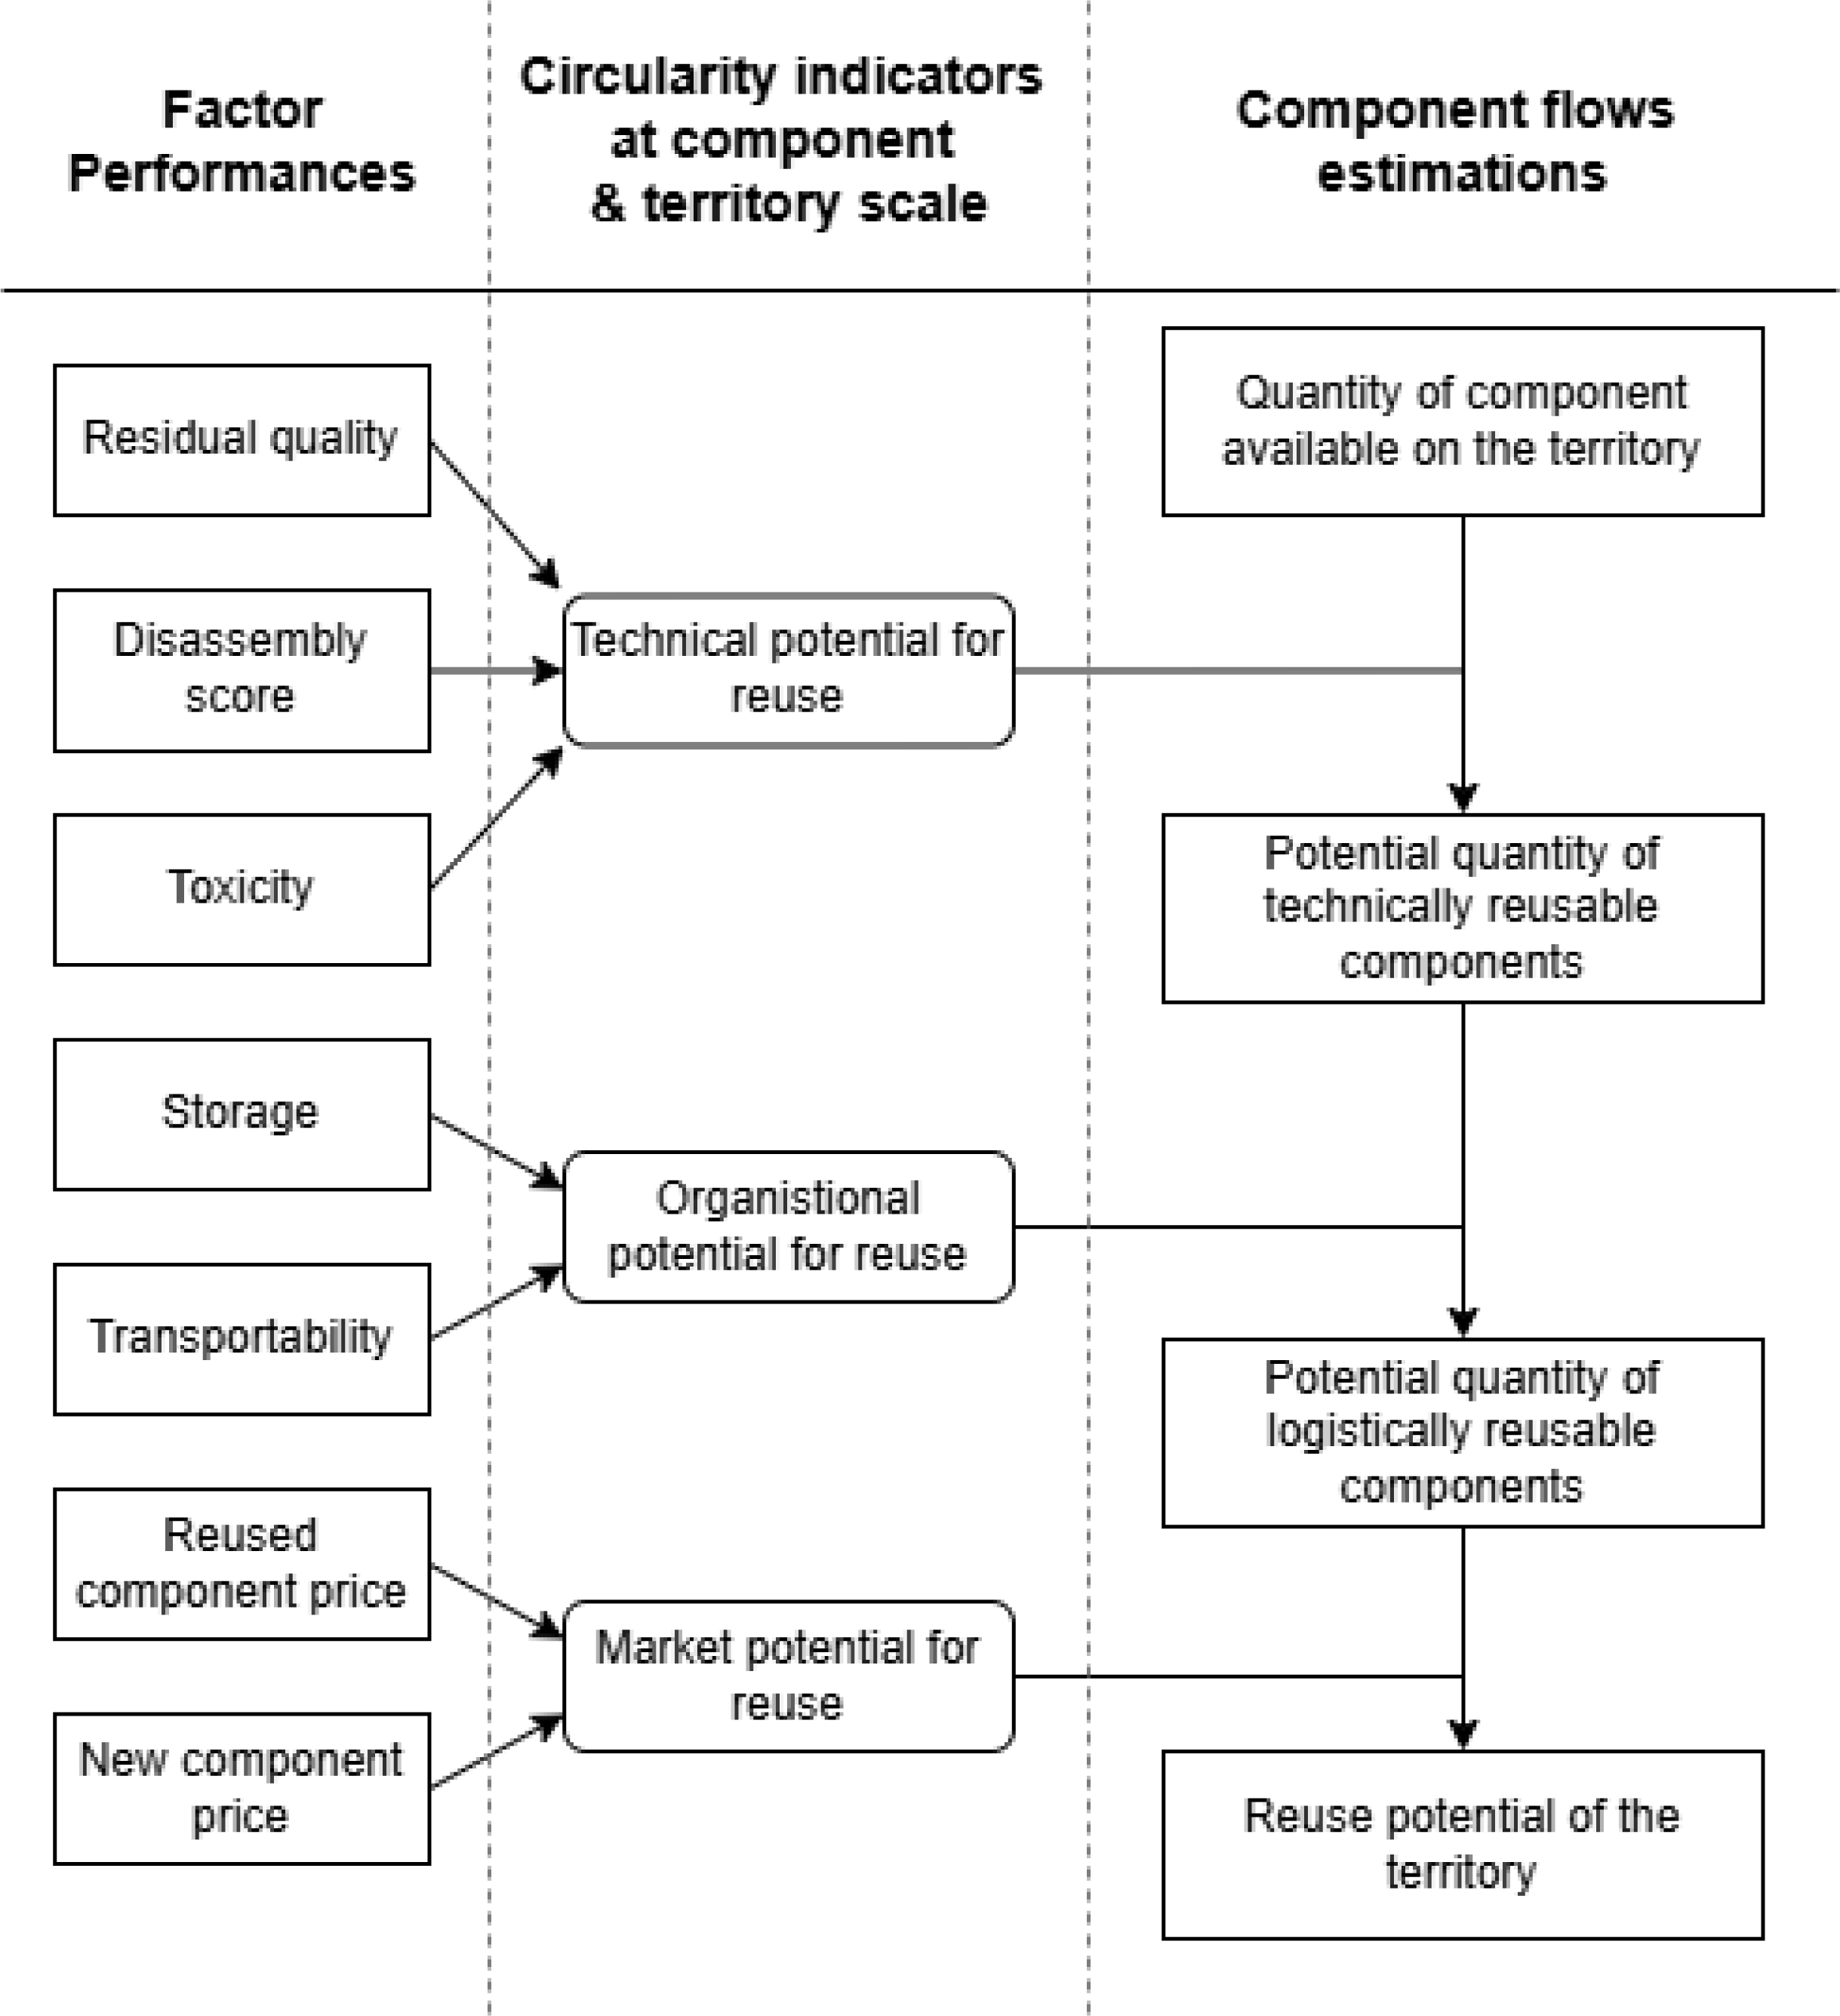
The methodology developed in this study follows a stepwise approach to model reuse activity and aims to model its influence on the flows of reused components. An overview of the model, including the step-by-step progression from technical to logistical and then economic potentials, is presented in Figure 1.
Reuse performance model representation

Figure 1 Long description
A diagram representing the reuse performance model for construction components. The diagram is divided into three main columns: Factor Performances, Circularity Indicators at Component and Territory Scale, and Component Flows Estimations. Factor Performances include Residual quality, Disassembly score, Toxicity, Storage, Transportability, Reused component price, and New component price. These factors influence the Circularity Indicators, which are Technical potential for reuse, Organisational potential for reuse, and Market potential for reuse. The Component Flows Estimations column shows the Quantity of component available on the territory, Potential quantity of technically reusable components, Potential quantity of logistically reusable components, and Reuse potential of the territory. Arrows indicate the flow and relationship between these factors and indicators, illustrating how they contribute to the overall reuse potential of construction components.
First, the reuse activity is separated into its main stages: selective deconstruction, transportation and storage, and component commercialisation. Second, the specific tasks carried out during these stages are characterised. These tasks include dismantling, estimation of residual performance, toxicity diagnostics, deposit, transport, storage (CSTB & OREE, 2022), and selling, which confirms the successful reuse of the component. All tasks are arranged chronologically, and both the influencing factors and their associated performance assessments are structured in this order.
Based on the decomposition of challenges regarding the reuse of end-of-life building components (Reference Rakhshan, Morel, Alaka and CharefRakhshan et al., 2020), the identified factors are regrouped in the following component flows:
-
1. The technical potential quantity of components , linked to the intrinsic characteristics of the component, including performance (Reference Cabral and BlanchetCabral & Blanchet, 2024), dismantlability (Reference Durmisevic, Ciftcioglu and AnumbaDurmisevic et al., 2003), and toxicity (Reference Foster, Kreinin and StaglFoster et al., 2020; Reference Tatiya, Zhao, Syal, Berghorn and LaMoreTatiya et al., 2018).
-
2. The organisational potential quantity of components is the technical potential quantity of components available in the territory that can be transported (Reference Coenen, Santos, Fennis and HalmanCoenen et al., 2021) and stored (Reference Chinda and AmmarapalaChinda & Ammarapala, 2016) under appropriate conditions (Reference Pilipenets, Kin Peng Hui, Gunawardena, Mendis and AyePilipenets et al., 2024).
-
3. The reused potential quantity of components is the previous organisational potential quantity of components that are sold and effectively reused (Reference Cabral and BlanchetCabral & Blanchet, 2024; Reference Cader, Koneczna and MarciniakCader et al., 2024; Reference Chinda and AmmarapalaChinda & Ammarapala, 2016; Reference Ferronato, Moresco, Guisbert Lizarazu, Gorritty Portillo, Conti and TorrettaFerronato et al., 2023; Reference Gravagnuolo, Angrisano and GirardGravagnuolo et al., 2019).
Third, the study seeks to estimate these three potential flows by modelling the performance of the factors identified in the literature. Based on this categorisation, the model generates a set of component-level and territorial-level indicators. These indicators are then aggregated into technical, organisational, and economic reuse indicators, reflecting the sequential evaluation of reuse potential. The resulting values are used to estimate the corresponding component flows.
4. Building end-of-life component flows estimation
4.1. Quantity of technically reusable components
4.1.1. Reuse potential technical of a component
The Reuse Potential Technical (RPT) reflects the component’s intrinsic suitability for reuse. It is defined as the combined performance across three key technical dimensions: residual performance, disassembly potential, and toxicity compliance. The resulting indicator, denoted as
 is expressed in Equation (1) as the product of the individual performance potentials:

Here,
 represents the residual performance potential,
 reflects the conformity to toxicity requirements, and
 denotes the disassembly score.
Residual performance accounts for multiple functional attributes of the evaluated component, including mechanical resistance, durability, fire resistance, thermal performance, watertightness, water permeability, acoustic performance, and maintenance considerations (Reference Cabral and BlanchetCabral & Blanchet, 2024). To be reused in a new construction project, a component must comply with all legally associated performance requirements. The reuse potential for residual performance therefore adopts a binary structure, as shown in Equation (2):

With:
-
•
 considers the overall performance of the end-of-life building component.
 -
•
the requirement performances the component needs to comply with applicable standards or norms.


The toxicity potential
 reflects whether the component meets regulatory health and safety thresholds. It is evaluated against mandatory French toxicity testing requirements (e.g., asbestos, lead), and may optionally include additional assessments, such as mould or pest infestation (Reference Cabral and BlanchetCabral & Blanchet, 2024; Reference Foster, Kreinin and StaglFoster et al., 2020). A component that does not meet all toxicity thresholds must be treated, thereby becoming waste. It is similarly modelled as a binary indicator in Equation 3.

With:
-
•
the toxicity rates of the end-of-building considered component. -
•
the toxicity thresholds established by regulatory standards for the component.


The disassembly potential
 of the component is related to the disassembly score
 of the entire component type flow. Proposed by Reference Durmisevic, Ciftcioglu and AnumbaDurmisevic et al. (2003), this score evaluates the ease with which a component can be separated from the building without significant damage. This score, ranging from 0 (non-dismountable) to 1 (fully dismountable), aggregates 17 sub-criteria related to connection types, accessibility, reversibility, and assembly logic. This score has been widely used in circularity assessments of components and complex systems (Reference Anastasiades, Blom and AudenaertAnastasiades et al., 2023; Reference Khadim, Agliata, Thaheem and MolloKhadim et al., 2023; Reference VerbeneVerbene, 2016). In this study, the disassembly score indicates the probability that a component will be dismantled while remaining in satisfying conditions; thus,
 follows a Bernoulli distribution with parameter DS for success.
4.1.2. Component flows estimation
The quantity of components that pass the technical reuse filter is determined by aggregating all components available within the considered territory, weighted by their respective technical reuse potentials. This aggregation is expressed in Equation (4):

With:
-
•
the total quantity of components available yearly in the territory. -
•
the technical reuse potential of the ith component. -
•
indicates the total initial quantity of components available yearly in the territory.


This step provides the first filtered estimation of components that are technically eligible for reuse before introducing logistical and economic constraints in subsequent stages.
4.2. Quantity of logistically reusable components
4.2.1. Organisational potential for reuse
The organisational potential for reuse captures a territory’s ability to manage the flow of a specific reusable component successfully. Unlike the technical potential, which is component-based, this concept adopts a more macroscopic, flow-oriented perspective that better suits the territorial approach.
The Reuse Potential Organisational
 accounts for several territorial conditions that influence the circulation of reusable components. It assumes that the territory has sufficient storage capacity to accommodate all technically reusable components (
 ). It also integrates average storage conditions across the territory, ensuring components are preserved under suitable conditions (SCI). Finally, it considers the ease with which a given component type can be transported to its next point of use (
 . The reuse potential organisational for a component type flow is shown in Equation 5:

Where
 represents the transportability potential of the considered component flow,
 refers to overall storage capacity performance within the territory,
 is the Stock Risk Indicator (Reference Pilipenets, Kin Peng Hui, Gunawardena, Mendis and AyePilipenets et al., 2024), ranging from 0 to 1, combining 13 risks that may cause degradation of the flow during its storage and thus hinder reuse.
The importance of component transportability has been highlighted by Reference Coenen, Santos, Fennis and HalmanCoenen et al. (2021), who developed the Bridge Circularity Indicator that accounts for two main logistical constraints: the volume and weight of bridge components. When considering building end-of-life components, heavier components are more difficult to move and may require super-heavy trucks for transportation (e.g., concrete foundations). Similarly, if the components are too large to fit on a standard construction truck, an oversized load would be required (e.g. concrete or wood beams). However, super-heavy trucks or oversized loads cannot always access every deconstruction site or storage facility, thereby significantly reducing the potential for reusing component flows.
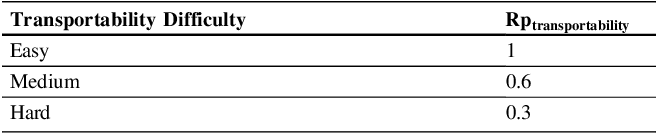
However, modelling these constraints precisely remains challenging. To provide a practical assessment, a first approximation is proposed in Table 1, categorising transport difficulty as easy, medium, or high, with the associated values for
 .
.
Transportability Reuse Potential of a specific component type

Storage capacity potential, as indicated by the
 accounts for whether the territory can accommodate the cumulative volume of components awaiting reuse. It is modelled as the yearly percentage of all component flows in the territory that can be stored. It is defined in Equation (9).

Where:
-
•
is the total available storage capacity in the territory, -
•
is the total storage need, defined as the previously calculated yearly quantity of reusable components that passed the technical considerations.


4.2.2. Component flows estimation
The quantity of logistically reusable components
 is the quantity of components technically reusable
 that can be transported and stored in acceptable risk conditions (Reference Pilipenets, Kin Peng Hui, Gunawardena, Mendis and AyePilipenets et al., 2024), as shown in Equation 10.

Where
 is the flow of technically reusable component type j, and
 is the organisational potential reflecting the capacity of actors to handle, transport, and store the flow of component type j appropriately, and
 is the number of different component type flows considered in the territory.
4.3. Quantity of reused components
4.3.1. Market potential for reuse
As previously discussed, the economic considerations for assessing the economic reuse potential of components are influenced by numerous factors (Reference Rakhshan, Morel, Alaka and CharefRakhshan et al., 2020). However, some of these factors are difficult to model without further investigation, for example, the environmental value and the component’s visual appearance. To simplify the overall approach, the economic potential of a component type is defined in Equation (11) as a comparison between the average price of all the components in the component flow and that of its new equivalent:

With:
-
•
is the price of the new component considered. -
•
is the average price of the reused component, including any costs associated with its recovery and preparation for reuse.


This formulation provides a normalised measure of the economic feasibility of reuse, accounting for the relative cost advantage of using a reused component over purchasing a new one, and assuming that a cheaper reused component will be purchased.
4.3.2. Component flows estimation
Components that successfully pass through all three stages: technical, logistical, and market, and are ultimately integrated into a new building life cycle, are considered reused. Equation 12.

Where
 is the flow of logistically reusable component of type j,
 represents the economic potential of that component type, and
 is the total number of component types within the territory.
5. Contributions and discussions
This study develops a territorial-scale model to estimate flows of reusable building components. The model sequentially filters end-of-life components through technical, logistical, and economic stages, producing indicators of how many components can realistically be reused within a given region. Unlike existing material flow or urban metabolism approaches, it accounts not only for material quantities but also for the performance of reuse activities and the operational conditions that shape the circulation of components. A second contribution lies in formalising reuse barriers into measurable indicators: technical, logistical, and economic constraints are quantified. This enables the comparison of abstract challenges across component types and territories, providing a basis for evaluating where reuse losses occur along the component flow. Finally, the model proposes a method for aggregating component-level indicators into territorial circularity indicators. This creates a link between the micro-scale properties of individual components and the macro-scale, aiming to support research and analysis for territorial circular economy strategies. Beyond its methodological structuring, the model also offers potential operational applications for the different categories of actors involved in the building sector. The model’s factor-based structure provides actionable insights for a wide range of building-sector actors. Technical indicators, such as disassembly potential, residual performance, or compliance with toxicity standards, help practitioners identify which component types can be prioritised for selective dismantling or early integration into design strategies. Logistical indicators, including transportability and storage-related degradation risks, support assessments of whether territorial infrastructures are adequate and where operational constraints could hinder reuse. Economic indicators, derived from price competitiveness between new and reused components, offer valuable inputs for both local authorities and national policymakers: locally, they can guide investment in infrastructures or support schemes targeting component types with the highest economic potential; nationally, they can inform regulatory adjustments or incentive mechanisms to strengthen the market conditions for reused components. In this way, the model acts as a shared knowledge infrastructure, supporting coordinated decision-making across actors involved in the circular transition of the building sector.
Despite these contributions, the model presents several limitations. A full implementation requires extensive and often fragmented datasets. Although diagnostics such as asbestos, lead, or performance tests are frequently conducted, the absence of centralised data prevents their systematic use at the regional scale. A second limitation relates to the heterogeneity of units used to describe component quantities, such as square meters, linear meters, units, or mass, which remain necessary but complicate aggregation and comparison across component categories. Simplifications were also made in the economic potential, which is currently reduced to a price comparison between new and reused equivalents. A more comprehensive economic model would need to incorporate component stocks, mandatory regulations, and incentives from territories to increase the reuse quantities.
Furthermore, this explicit decomposition of processes, parameters, and sequential losses can serve as a consistent baseline for environmental and social impact assessments, by enabling the coupling of predicted flows with lifecycle impact metrics (e.g., emissions, resource use, pollution risks) and social indicators (e.g., job creation potential, occupational safety, local value retention).
The model has not yet been validated through a use case. Applying it to a specific territory is necessary to test the feasibility of data collection, verify the relevance and calibration of the proposed parameters, and assess the model’s actual capacity to support the practices and decisions of the actors identified above. Such validation is necessary to determine the extent to which the model improves coordination and planning and, ultimately, increases component reuse at the territorial level.
6. Conclusion
This study presents a territorial-scale model to estimate flows of reusable building components by sequentially filtering for technical, logistical, and economic potentials. Unlike traditional material flow approaches, it integrates the performance of reuse activities and operational conditions, providing an assessment of components that can be reintegrated into the construction sector.
The model formalises reuse barriers into measurable indicators, linking component-level factors, such as toxicity, transportability, and price competitiveness, to territorial circularity performances. The model proposes a framework to inform decision-making and improve the circularity of building components at the territorial scale.

 Open access

