


A suboptimal diet is a major modifiable risk factor contributing to global deaths(Reference Forouzanfar and Alexander1). Overall dietary intake is often evaluated using diet quality indices, which are summary scores of dietary intake based on previous knowledge or hypotheses concerning the health effects of dietary components(Reference Waijers, Feskens and Ocke2). For example, the Healthy Eating Index was developed based on dietary guidelines in the USA(Reference Krebs-Smith, Pannucci and Subar3) and was then, followed by the development of the Alternate Healthy Eating Index by considering evidence on diet and chronic disease(Reference Chiuve, Fung and Rimm4). To date, various diet quality indices have been developed, and their inverse associations with mortality have been reported(Reference Miller, Webb and Micha5–Reference Chan, Yu and Leung21). In Japan, where dietary habits have attracted global interest due to the longevity of the Japanese(Reference Tsugane22), two types of index have been associated with lower mortality: indices assessing adherence to the Japanese diet(Reference Matsuyama, Sawada and Tomata9–Reference Okada, Nakamura and Ukawa12) and the Japanese Food Guide Spinning Top (JFGST), which assesses adherence to national dish- and food-based dietary guidelines in Japan(Reference Kurotani, Akter and Kashino13,Reference Oba, Nagata and Nakamura14) .
These Japanese indices, however, did not necessarily reflect evidence on diet-health associations in their development process. For example, the Japanese Diet Index, including the twelve-item Japanese Diet Index (JDI12), assesses adherence to traditional dietary patterns in Japan, including higher intake of rice (mainly refined rice) and lower intake of coffee(Reference Zhang, Otsuka and Tomata23,Reference Tomata, Watanabe and Sugawara24) , which may contradict the associations of these with health outcomes, including mortality(Reference Schwingshackl, Schwedhelm and Hoffmann25,Reference Poole, Kennedy and Roderick26) . Similarly, the JFGST categorises foods with possibly different health effects as belonging to the same category (e.g., whole grains or refined grains as a staple dish and fish or processed meat as a fish and meat dish)(Reference Krebs-Smith, Pannucci and Subar3,Reference Chiuve, Fung and Rimm4,Reference Schwingshackl, Schwedhelm and Hoffmann25) . Accordingly, diet quality indices that are consistent with evidence on foods and health outcomes may show stronger associations than those examined. Recently, the evidence-based index Diet Quality Score for Japanese (DQSJ) was developed by integrating existing diet quality indices from Western countries with the characteristics and health impact of dietary intake in Japan(Reference Oono, Murakami and Fujiwara27). A previous study suggested that the DQSJ has stronger associations with cardiometabolic status than the JFGST(Reference Oono, Murakami and Uenishi28), but its associations with other health outcomes have not yet been examined.
In addition, considering the similarity of dietary concerns in Japan and worldwide(Reference Oono, Murakami and Fujiwara27), diet quality indices that showed consistent associations with lower mortality worldwide may also be beneficial in Japan. These include the Healthy Eating Index, Alternate Healthy Eating Index, Mediterranean diet scores and Dietary Approaches to Stop Hypertension (DASH) scores(Reference Miller, Webb and Micha5–Reference Morze, Danielewicz and Hoffmann8). To our knowledge, however, no Japanese study has examined associations of these indices with all-cause mortality. Additionally, while nutrient-based indices, such as the Nutrient Rich Food Index 9.3 (NRF9.3)(Reference Fulgoni, Keast and Drewnowski29,Reference Murakami, Livingstone and Fujiwara30) , may have the advantage of being independent of specific food groups, making them applicable to various populations(Reference Waijers, Feskens and Ocke2,Reference Burggraf, Teuber and Brosig31) , their associations with mortality have been little examined(Reference Streppel, Sluik and van Yperen15–Reference Hashemian, Farvid and Poustchi17), particularly in non-Western countries(Reference Hashemian, Farvid and Poustchi17). It remains largely unknown which diet quality indices are more effective for predicting mortality in individual countries(Reference Lim, Neelakantan and Lee18–Reference Chan, Yu and Leung21), especially in Japan.
Here, as part of efforts to explore diet quality indices for predicting health outcomes in Japan, we examined associations of various diet quality indices, including DASH, alternate Mediterranean diet (AMED) score, Healthy Eating Index-2015 (HEI-2015), Alternate Healthy Eating Index-2010 (AHEI-2010), NRF9.3, DQSJ, JFGST and JDI12, with all-cause and cause-specific mortality in the Japanese population. We sought to present comparable estimates of associations with mortality for these indices, with the hypothesis that the six newly examined indices (DASH, AMED, HEI-2015, AHEI-2010, NRF9.3 and DQSJ) show inverse associations with mortality at least comparable to those of JDI12 and JFGST.
Methods
Study design and participants
We analysed data from the Takayama study. This prospective study was designed to investigate associations of diet and other lifestyle factors with the incidence of cancer, other chronic diseases and death. Details of the study design and the baseline characteristics of participants are described elsewhere(Reference Shimizu32–Reference Yamakawa, Wada and Koda34). The target population was all residents of Takayama City (Gifu Prefecture, Japan) aged 35 years or more, who numbered 37 287 as of 1 July 1992. A self-administered questionnaire was distributed to 36 990 residents in September 1992 after exclusion of those in hospital, away from the city, deceased or for other miscellaneous reasons. Of the 34 018 who returned the questionnaire, after excluding those who left many blanks or provided highly implausible responses(Reference Nagata, Wada and Yamakawa33,Reference Yamakawa, Wada and Koda34) , the fixed cohort consisted of 31 552 individuals (participation rate, 85 %). We then excluded 2473 participants who reported a previous diagnosis of chronic heart disease, stroke or cancer at baseline, leaving 29 079 participants (13 355 men and 15 724 women), accounting for 78 % of all residents aged 35 years or more at the time (online Supplementary Figure 1). The Takayama study was approved by the ethical committee of Gifu University Graduate School of Medicine.
Dietary assessment and calculation of diet quality indices
Dietary intake during the past year was assessed using a semi-quantitative FFQ at baseline. The FFQ asked about the intake frequency of foods, beverages and dishes (169 items) and usual portion size. Nutrient intake was estimated using the fifth revised and enlarged edition of the Japanese Standard Tables of Food Composition(35). Intakes of trans-fat and added sugars were estimated using composition databases(Reference Murakami, Livingstone and Fujiwara30,Reference Yamada, Sasaki and Murakami36) . Dietary supplements were excluded from the calculation of nutrient intake. Details and validity of the FFQ were previously described(Reference Shimizu, Ohwaki and Kurisu37).
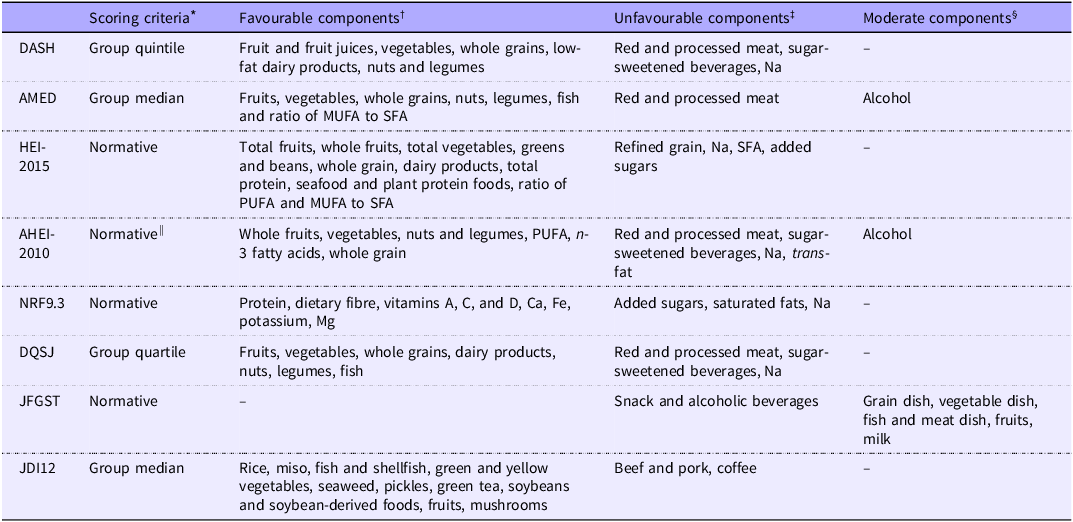
We calculated the eight diet quality indices, namely, the DASH(Reference Fung, Chiuve and McCullough38), AMED(Reference Fung, McCullough and Newby39), HEI-2015(Reference Krebs-Smith, Pannucci and Subar3), AHEI-2010(Reference Chiuve, Fung and Rimm4), NRF9.3(Reference Fulgoni, Keast and Drewnowski29,Reference Murakami, Livingstone and Fujiwara30) , DQSJ(Reference Oono, Murakami and Fujiwara27), JFGST(Reference Nishimura, Murakami and Livingstone40) and JDI12(Reference Zhang, Otsuka and Tomata23). The components and scoring criteria are shown in Table 1. For all indices, a higher score indicated a better-quality diet. The indices were calculated as in previous research(Reference Zhang, Otsuka and Tomata23,Reference Oono, Murakami and Fujiwara27,Reference Oono, Murakami and Uenishi28,Reference Nishimura, Murakami and Livingstone40,Reference Oono, Murakami and Shinozaki41) (for details, see online Supplementary Methods section and Supplementary Table 1). To examine the validity of diet quality indices from the FFQ, we calculated correlations between seven indices from the FFQ and 12-d dietary records in thirty-seven adults; the JFGST was not calculated because the dietary records retained only food items, not dish names. The details of participants and dietary assessment are described elsewhere(Reference Shimizu, Ohwaki and Kurisu37). Spearman correlation coefficients between indices from the FFQ and 12-d dietary records in thirty-seven adults were 0·86 for the DQSJ, 0·79 for DASH, 0·74 for AHEI-2010, 0·72 for JDI12, 0·68 for NRF9.3, 0·59 for HEI-2015 and 0·52 for AMED. The validation sample showed higher scores and a larger sd of diet quality indices than the whole sample (online Supplementary Table 2).
Components and scoring criteria of the eight diet quality indices used in this study

DASH, Dietary Approaches to Stop Hypertension; AMED, alternate Mediterranean diet; HEI-2015, Healthy Eating Index-2015; AHEI-2010, Alternate Healthy Eating Index-2010; NRF9.3, Nutrient Rich Food Index 9.3; DQSJ, Diet Quality Score for Japanese; JFGST, Japanese Food Guide Spinning Top; JDI12, twelve-item Japanese Diet Index.
* Criteria (cut-off values) of each component: normative (predefined servings or grams) or group intake.
† Higher intake receives a higher component score.
‡ Lower intake receives a higher component score.
§ Intake within the predefined range receives a higher component score.
|| Except for Na (scored using group decile).
Follow-up and endpoints
The Takayama study collected information about death or moving away from Takayama City using residential registers or family registers. These data were collected from baseline (1 September 1992) to 1 October 2008. Cause of death was identified from death certificates provided by the Legal Affairs Bureau and classified according to the International Classification of Diseases, 10th Revision (ICD-10). The endpoints were mortality from all causes, all types of cancers (ICD-10 codes: C00–D48), CVD (I00–I99) and all other causes. We also analysed site-specific cancer mortality for major sites with at least 100 deaths in this cohort, including trachea, bronchus and lung cancer (C33–C34), stomach cancer (C16), colorectal cancer (C18–C21), liver cancer (C22) and pancreatic cancer (C25). Injury-related deaths (S00–T88) were analysed separately, with the hypothesis of no associations of diet quality indices with injury-related mortality. Within the study period, 1781 individuals (6·1 %) were censored on the day they left the city; if the leaving date was unknown (n 104), the date of last known residence was used. Mean (sd) of DQSJ for these 1781 individuals was 13·4 (3·7), similar to that of all other participants.
Covariate measurement
The self-administered questionnaire at baseline included questions on sociodemographic factors, medical and reproductive history and lifestyle factors such as smoking, physical activity and sleep duration. Unmarked medical history was treated as ‘no’. Physical activity score (metabolic equivalent hours per week) was calculated by multiplying the time spent per week in various kinds of activities during the past year by their corresponding energy expenditure requirement, expressed as a metabolic equivalent, and summing these values. Missing responses for the time spent on physical activity were assigned with median values: 0 h/week for vigorous activity/physical labour and 0·5 h/week for moderate activity. Details and validity of this method have been reported elsewhere(Reference Suzuki, Kawakami and Shimizu42). BMI (kg/m2) was calculated using self-reported height and weight.
Statistical analysis
Means, sd and frequency of participant characteristics were described as quartiles of diet quality indices. The distributions of the eight indices were not markedly skewed (online Supplementary Figure 2). Therefore, we calculated Pearson correlation coefficients among diet quality indices. Additionally, Spearman correlation coefficients were calculated to examine associations of each diet quality index with intakes of selected foods and nutrients.
Cox proportional hazard models were used to calculate hazard ratios (HR) and 95% CI for mortality from all causes, CVD, total cancer, major cancer and other causes per 1 sd difference in each diet quality index(Reference Livingstone, Milte and Torres43), under the hypothesis that each 1 sd increment in diet quality indices has beneficial effects. The proportional hazard assumption was confirmed by visual inspection of Schoenfeld residuals. The basic model was adjusted for sex and age at baseline. The adjusted model further included energy intake (continuous), a physical activity score (continuous), smoking (pack-year, continuous), BMI (continuous), hours of sleep per night (continuous: < 5 assigned 5, 6, 7, 8, 9, 10 < assigned 10), marital status (married or not), years of education (categories: less than 12, 12–14, 15 or more), history of hypertension (yes or no) and diabetes (yes or no), multivitamin use (yes or no) and menopause status (postmenopausal or premenopausal, women only, using sex and menopause status as an interaction term). BMI and sleep hours were included as quadratic terms in the model, considering their potential U or J-shaped associations with mortality(Reference Angelantonio and Bhupathiraju44–Reference Svensson, Inoue and Saito46). Similar results were obtained when they were included as linear terms. To maximise data availability, we conducted ten rounds of multiple imputations for missing covariates (1·3% for marital status, 1·4 % for duration of education, 2·4% for menopause status, 4·1% for sleep duration, 5·6% for BMI, 6·1% for multivitamin use and 9·2% for pack-years of smoking) and then combined the estimates using the SAS PROC MI and MIANALYZE procedure.
We conducted several sensitivity analyses for all-cause, CVD and cancer mortality. Considering the possibility that associations of diet quality indices with mortality were not linear, we also examined HR across the quartiles of diet quality indices with tests of linear trend across increasing quartiles of indices by assigning the mean value to each category and treating them as continuous. Additionally, the HR for all-cause mortality per interquartile range were presented. To confirm the robustness of the associations, we also conducted the following sensitivity analyses for associations of diet quality indices with mortality: (1) exclusion of deaths in the first three years from baseline, to reduce the possibility of reverse causation; (2) analysis limited to participants without multivitamin use; (3) addition of alcohol intake (continuous, log-translation) as a covariate; (4) maximum follow-up period of 8 years (until 1 October 2000, approximately halfway through the total follow-up period) in consideration of a change in dietary intake after baseline; and (5) analysis limited to participants who reported all covariates (complete case analysis).
Stratified analysis was conducted to investigate whether HR were similar across various types of basic characteristics. Effect modification was tested using an interaction term of diet quality indices and the selected characteristics (multiplicative scale). The selected characteristics were sex, age (categorised as < 60 or ≥ 60 years), smoking status (never smoker or ever smoker) and BMI (underweight < 18·5 kg/m2, normal weight 18·5–24·9 kg/m2 or overweight ≥ 25 kg/m2). To examine whether observed associations were explainable by a single component in the indices, we examined associations of scores that removed each component from the diet quality indices with all-cause mortality, with adjustment for the removed component score.
Two-sided P values < 0·05 were regarded as statistically significant. We did not adjust for multiple comparisons because the primary aim was to present the HR for mortality across indices using the same analytical method and population, rather than to identify at least one statistically significant association among the eight indices. We used the SAS software, version 9.4. (SAS Institute) for data analysis.
Results
Study population and characteristics
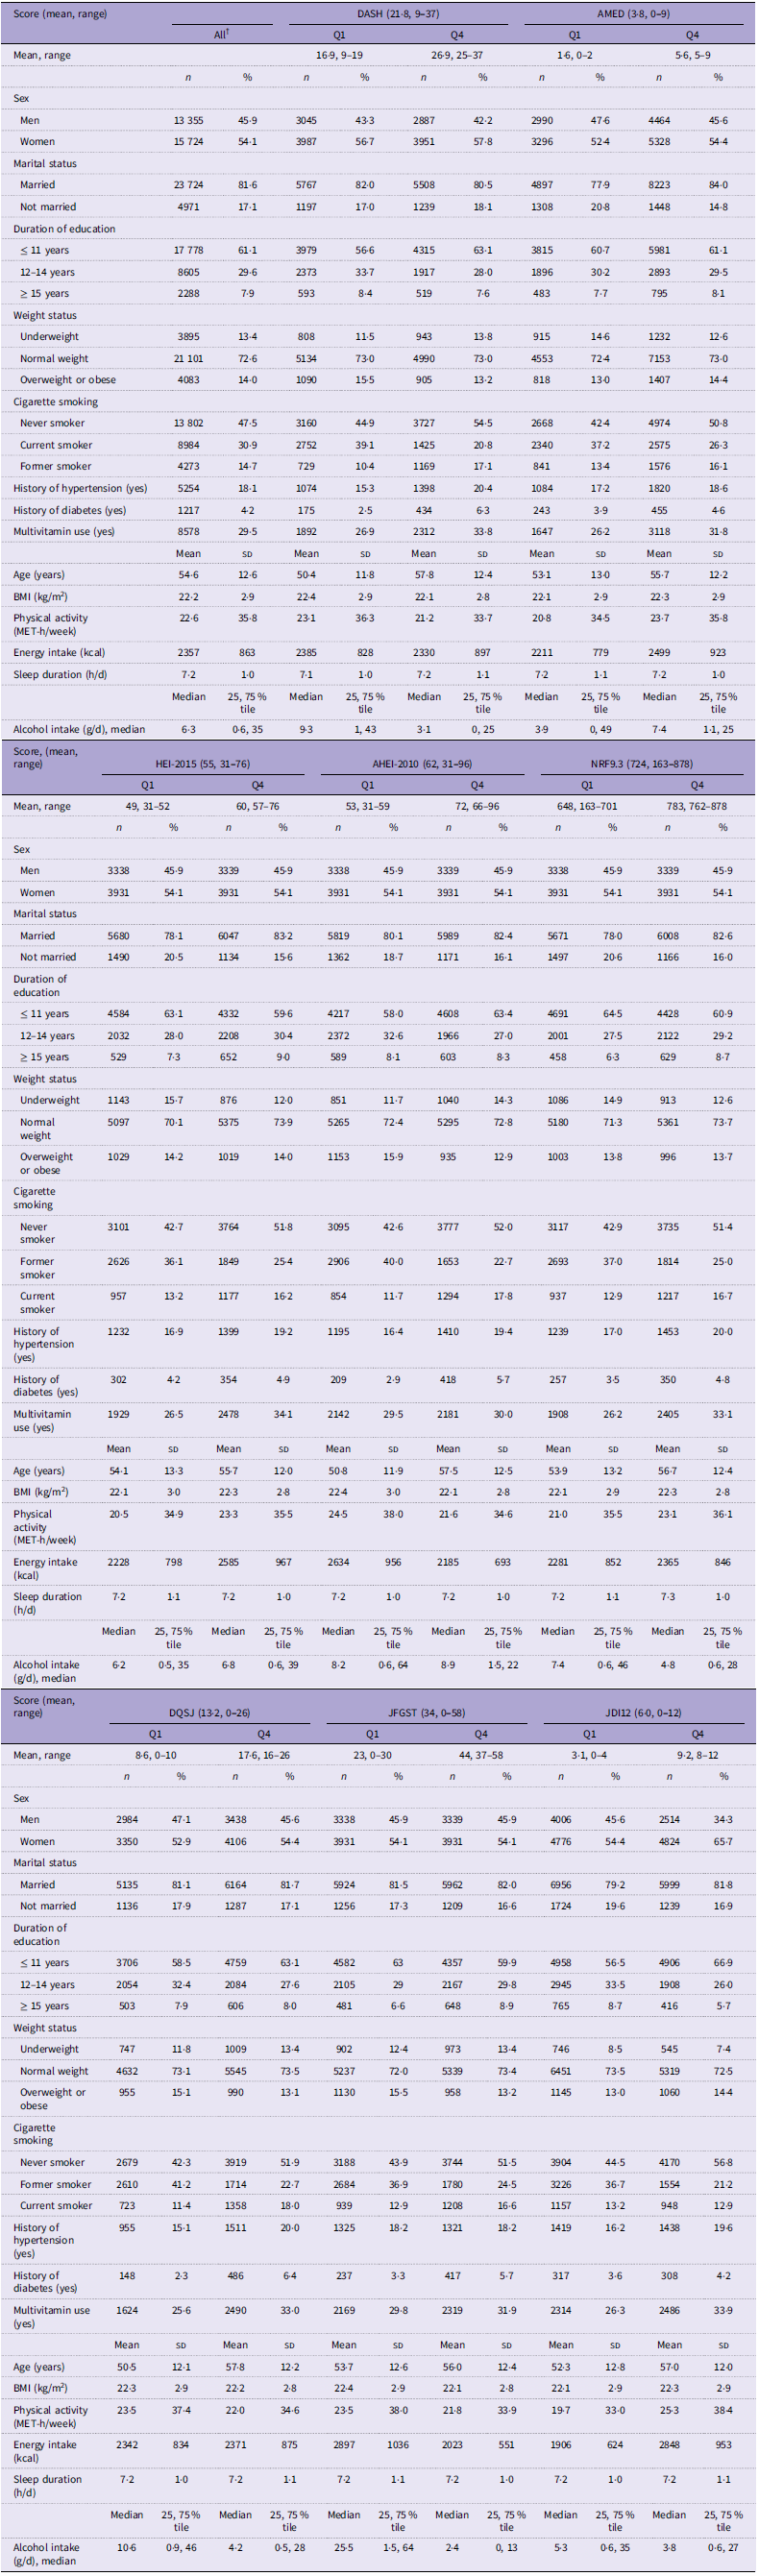
This study included 13 355 men and 15 724 women at baseline. Table 2 shows the basic characteristics of the study population according to quartiles of the diet quality indices. For each of the eight diet quality indices, participants with higher scores were more likely to be older and use multivitamins and less likely to be current smokers. Higher scores were also associated with having a history of hypertension (except for JFGST) and a history of diabetes (except for HEI-2015). Associations with other characteristics varied among diet quality indices.
Basic characteristics across the quartile of the 8 diet quality indices among Japanese adults (n 29 079)*

DASH, Dietary Approaches to Stop Hypertension; AMED, alternate Mediterranean diet; HEI-2015, Healthy Eating Index-2015; AHEI-2010, Alternate Healthy Eating Index-2010; NRF9.3, Nutrient Rich Food Index 9.3; DQSJ, Diet Quality Score for Japanese; JFGST, Japanese Food Guide Spinning Top; JDI12, twelve-item Japanese Diet Index; MET, metabolic equivalent; Med, median; Q1, Quartile 1 (25 % tile); Q3, Quartile 3 (75 %tile).
* The participants were first categorised into four groups based on sex-specific quartiles of the indices and then analysed together.
† 28 695 for marital status; 28 671 for duration of education; 27 309 for multivitamin use; 27 896 for sleep duration; 27 438 for BMI.
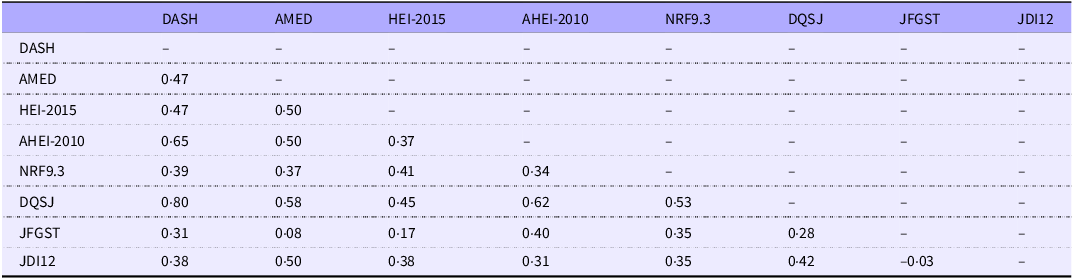
As shown in Table 3, except for almost zero correlation between JFGST and JDI12, the eight diet quality indices showed correlations with each other that ranged from very low (Pearson’s correlation coefficient = 0·08 between AMED and JFGST) to strong (0·80 between the DASH and DQSJ). Correlations with intakes of nutrients and food groups were partially consistent across the diet quality indices, although some differences were observed (online Supplementary Figure 3). All eight indices were positively correlated with intakes of fibre (point estimate of Spearman correlation coefficients range: 0·34–0·53), Mg (0·26–0·55), Fe (0·26–0·55), fruits (0·20–0·65), Ca (0·24–0·51), vitamin C (0·23–0·54) and protein (0·15–0·43). Although Na was included as an unfavourable component of the DASH, HEI-2015, AHEI-2010, NRF9.3 and DQSJ, Na intake was positively correlated with these indices (0·09–0·35), as well as the other three (0·16 for JFGST, 0·46 for AMED and 0·47 for JDI12).
Pearson correlation coefficients between diet quality indices in Japanese adults (n 29 079)

DASH, Dietary Approaches to Stop Hypertension; AMED, alternate Mediterranean diet; HEI-2015, Healthy Eating Index-2015; AHEI-2010, Alternate Healthy Eating Index-2010; NRF9.3, Nutrient Rich Food Index 9.3; DQSJ, Diet Quality Score for Japanese; JFGST, Japanese Food Guide Spinning Top; JDI12, twelve-item Japanese Diet Index.
Diet quality indices and mortality
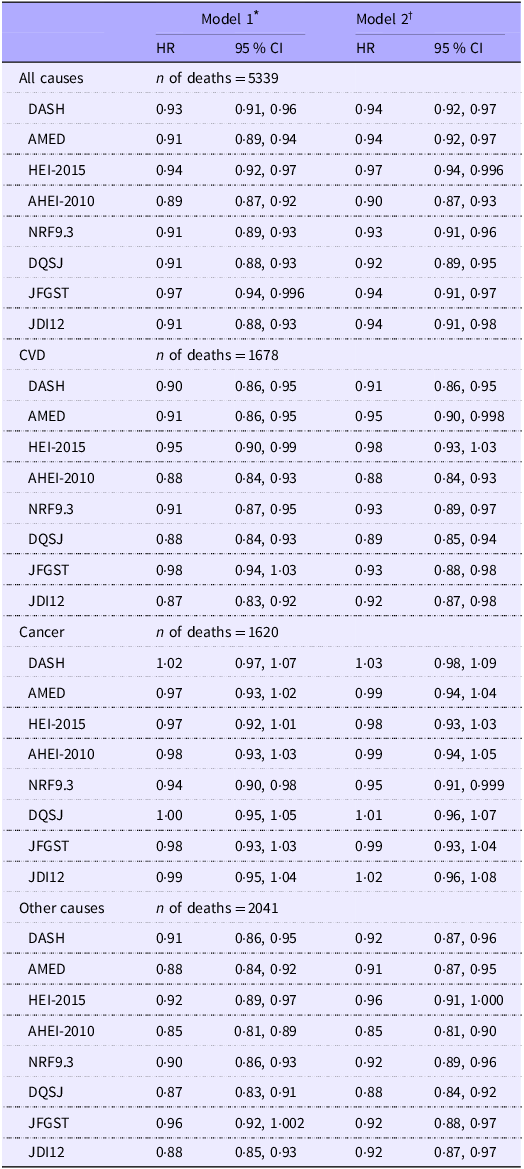
The mean duration of follow-up was 14·1 years. During 410 352 person-years of follow-up, 5339 deaths (including 1678 from CVD and 1620 from cancer) were recorded. For each 1-sd higher diet quality index, the HR (95 % CI) for all-cause mortality were 0·90 (0·87, 0·93) for AHEI-2010, 0·92 (0·89, 0·95) for DQSJ, 0·93 (0·91, 0·96) for NRF9.3, 0·94 (0·92, 0·97) for AMED and DASH, 0·94 (0·91, 0·97) for JFGST, 0·94 (0·91, 0·98) for JDI12 and 0·97 (0·94, 0·996) for HEI-2015 in the fully adjusted model (Table 4). Similar results were obtained for mortality from CVD and other causes with wider ranges of 95 % CI. In contrast, cancer mortality was associated with none of the indices except NRF9.3 (HR: 0·95, 95 % CI: 0·91, 0·999). Associations with site-specific cancer mortality were generally inconsistent across indices (online Supplementary Table 3). During follow-up, 370 deaths from injury were observed; none of the indices was associated with injury-related mortality, with HR (95 % CI) ranging from 0·95 (0·84, 1·07) for DQSJ to 1·00 (0·90, 1·12) for AHEI-2010.
Hazard ratios of mortality of all causes, CVD, cancer and other causes for 1 sd increments in the eight diet quality indices among Japanese adults (n 29 079)

DASH, Dietary Approaches to Stop Hypertension; AMED, alternate Mediterranean diet; HEI-2015, Healthy Eating Index-2015; AHEI-2010, Alternate Healthy Eating Index-2010; NRF9.3, Nutrient Rich Food Index 9.3; DQSJ, Diet Quality Score for Japanese; JFGST, Japanese Food Guide Spinning Top; JDI12, twelve-item Japanese Diet Index.
The values of sd for each score are presented in online Supplementary Table 2.
* Adjusted for age and sex.
† Adjusted for age, sex, total energy intake (continuous), BMI (continuous, as quadratic term), physical activity (continuous), smoking (packs per year, continuous), education (less than 12 years, 12–14 years, 15 years or more), marital status, sleep duration (continuous, as quadratic term), history of hypertension (yes or no), history of diabetes (yes or no), multivitamin use (yes or no) and menopause status (yes or no, only for women).
Sensitivity analysis
Similar associations were obtained when analysing using the interquartile range or the quartiles of diet quality indices instead of 1 sd of diet quality indices. The HR for all-cause mortality per interquartile range were as follows: 0·87 (0·84, 0·90) for AHEI-2010, 0·89 (0·85, 0·93) for DQSJ, 0·91 (0·86, 0·96) for JDI12, 0·92 (0·90, 0·95) for NRF9.3, 0·92 (0·88, 0·96) for JFGST, 0·93 (0·89, 0·96) for DASH, 0·93 (0·90, 0·96) for AMED and 0·96 (0·92, 0·99) for HEI-2015. The HR (95 % CI) for all-cause mortality in the highest quartiles of diet quality indices compared with the lowest quartiles were 0·78 (0·82, 0·85) for AHEI-2010, 0·82 (0·75, 0·89) for DQSJ, 0·84 (0·78, 0·91) for NRF9.3, 0·87 (0·80, 0·94) for JFGST, 0·87 (0·80, 0·95) for DASH and JDI12, 0·88 (0·81, 0·95) for AMED and 0·93 (0·86, 1·004) for HEI-2015 (online Supplementary Table 4). For AHEI-2010 and DQSJ, higher quartile appeared to be gradually associated with lower HR: 0·93 (0·85, 1·01) for Q2, 0·88 (0·81, 0·95) for Q3, 0·78 (0·72, 0·85) for Q4 in AHEI-2010 and 0·89 (0·82, 0·96) for Q2, 0·86 (0·79, 0·94) for Q3 and 0·82 (0·75, 0·89) for Q4 in DQSJ. The HR of NRF9.3 for cancer mortality were 0·79 (0·68, 0·91) in Q2, 0·85 (0·74, 0·97) in Q3 and 0·89 (0·78, 1·01) in Q4 (online Supplementary Table 5). Sensitivity analysis under various assumptions showed that HR for all causes, CVD and cancer per 1 sd difference of each diet quality index were similar to those in the main analysis (online Supplementary Table 6).
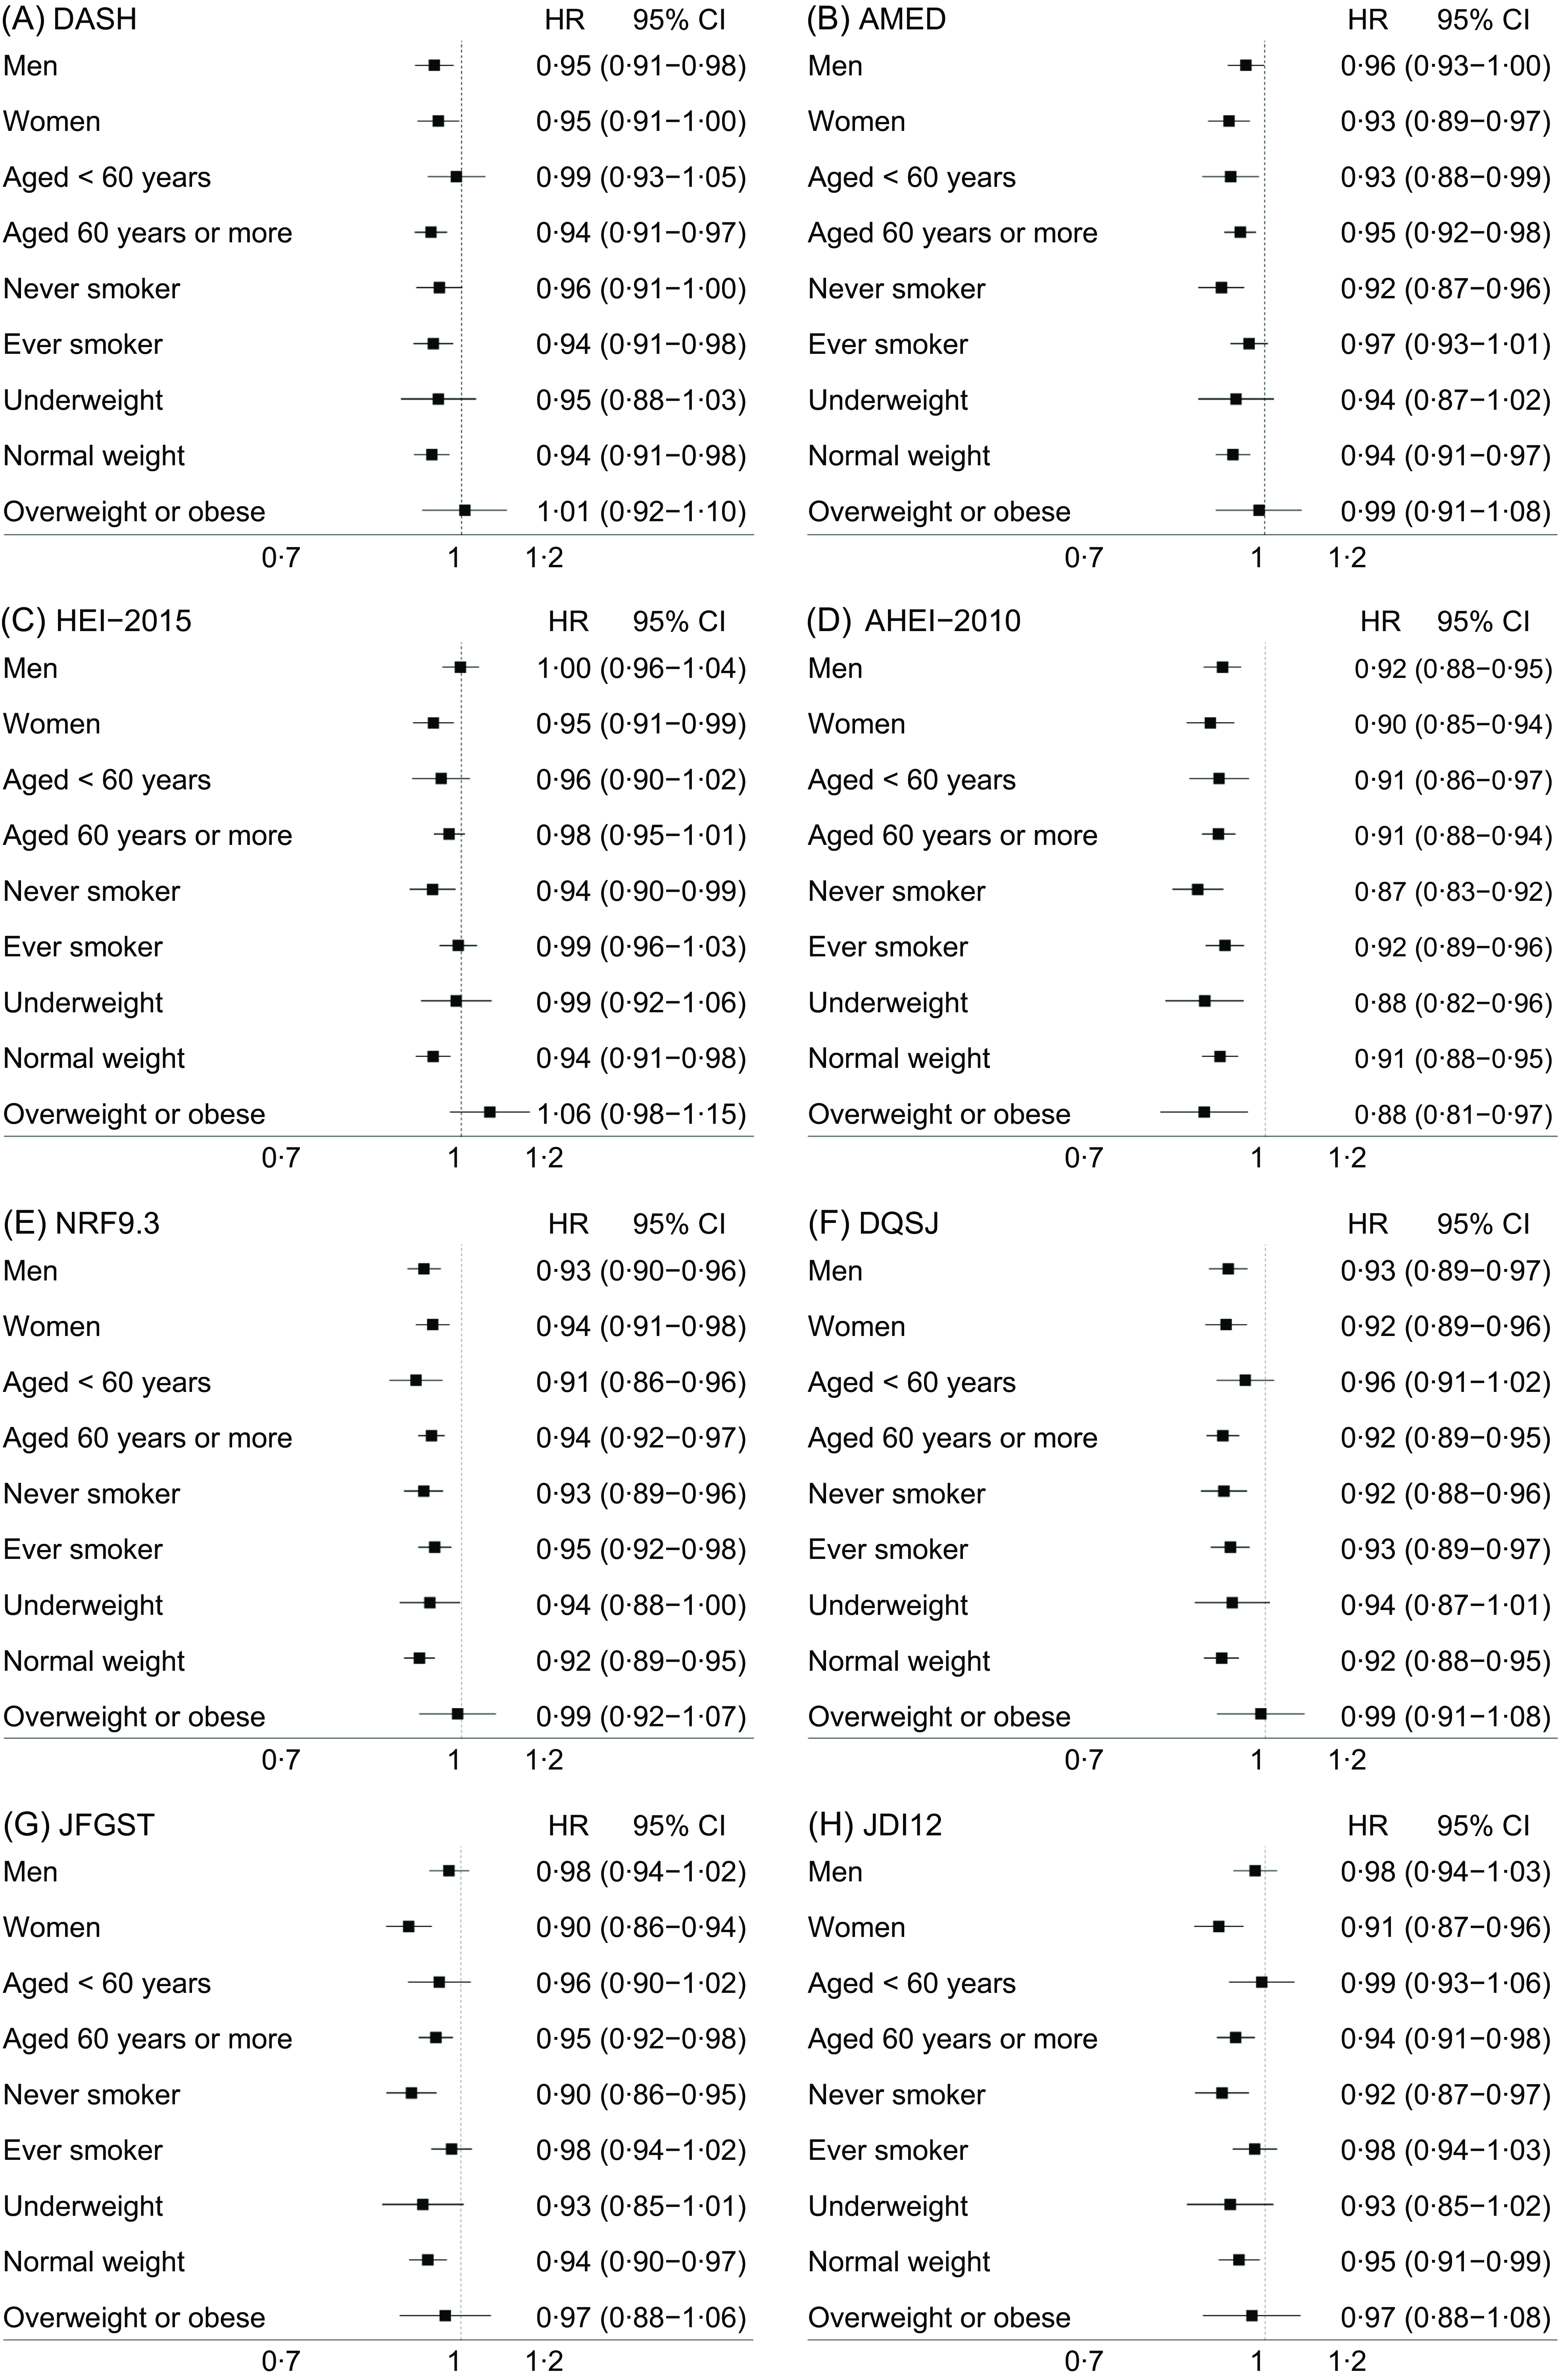
When stratified by basic characteristics, the AHEI-2010 showed significant associations with all-cause mortality across all strata (Figure 1). Except for AHEI-2010, no indices were associated with all-cause mortality among individuals with overweight or obesity, but interactions were significant only for HEI-2015. HEI-2015 and JDI12 showed interactions with several characteristics, including sex (weaker associations in men than in women). Similar associations were obtained for HR for CVD (online Supplementary Figure 4). Only NRF9.3 was associated with cancer mortality in some strata (men, ever smokers and age below 60 years) (online Supplementary Figure 5).
Hazard ratios (HR) on all-cause mortality per 1 sd higher score of each diet quality index among Japanese adults (n 29 079), stratified by basic characteristics (sex, age, smoking status and weight status)a. DASH, Dietary Approaches to Stop Hypertension; AMED, alternate Mediterranean diet; HEI-2015, Healthy Eating Index-2015; AHEI-2010, Alternate Healthy Eating Index-2010; NRF9.3, Nutrient Rich Food Index 9.3; DQSJ, Diet Quality Score for Japanese; JFGST, Japanese Food Guide Spinning Top; JDI12, twelve-item Japanese Diet Index. aThe horizontal axis for HR is scaled logarithmically. Cox proportional hazards models to estimate HR and 95 % CI were adjusted for age, sex, total energy intake (continuous), BMI (continuous, as quadratic term), physical activity (continuous), smoking (packs per year, continuous), education (less than 12 years, 12–14 years, 15 years or more), marital status, sleep duration (continuous, as quadratic term), history of hypertension (yes or no), history of diabetes (yes or no), multivitamin use (yes or no), menopause status (yes or no, only for women). Participant number and cases were 13 355 and 2901 for men, 15 724 and 2438 for women, 19 128 and 1212 for participants younger than 60 years, 9951 and 4127 for participants 60 years old or more, 13 802 and 1976 for never smokers, 13 257 and 2785 for ever smokers, 3895 and 1416 for underweight, 21 101 and 3343 for normal weight and 4083 and 580 for overweight. Interactions were observed in HEI-2015 with sex (P = 0·02) and overweight or obesity status (v. normal and underweight, P = 0·01), JFGST with smoking status (P = 0·053) but not with sex (P = 0·20) and JDI12 with sex (P = 0·01) and smoking status (P = 0·048).

When one component was omitted from the diet quality indices, the point estimates of HR for all-cause mortality per 1 sd difference did not change markedly, ranging from 0·89 to 0·94 for AHEI-2010, 0·90 to 0·94 for NRF9.3, 0·92 to 0·95 for DQSJ, 0·93 to 0·96 for AMED, 0·94 to 0·96 for JFGST, 0·93 to 0·97 for JDI12, 0·94 to 0·97 for DASH and 0·95 to 0·98 for HEI-2015 (online Supplementary Figure 6).
Discussion
In this study in Japan, all eight diet quality indices were associated with lower all-cause mortality. The HR (95 % CI) for all-cause mortality per 1 sd higher index ranged from 0·90 (0·87, 0·93) for AHEI-2010 to 0·97 (0·94, 0·996) for HEI-2015. These findings suggest that these eight indices are beneficial for longevity but that they differ in the strength of their associations.
Previous studies have examined the associations of the Japanese Diet Index and JFGST with all-cause mortality in Japan(Reference Matsuyama, Sawada and Tomata9,Reference Abe, Zhang and Tomata10,Reference Kurotani, Akter and Kashino13) . Point estimates of HR for the highest v. lowest quartiles were 0·91 for the JFGST(Reference Kurotani, Akter and Kashino13) and 0·86(Reference Matsuyama, Sawada and Tomata9) and 0·91(Reference Abe, Zhang and Tomata10) for the Japanese Diet Index. These are similar to our study (0·87 for both indices), despite some differences in how scores were calculated. In contrast, another study did not observe an association of AHEI-2010 with CVD mortality in Japan(Reference Nohara, Muraki and Sobue47), which contradicts our results. This difference may be partly explained by differences in the FFQ used (40 items in the previous study(Reference Nohara, Muraki and Sobue47) v. 169 in the present study). In the present study, AHEI-2010 showed a high correlation between the FFQ and 12-d dietary records, whereas the validity of the FFQ for assessing AHEI-2010 was not examined in the previous study. The lack of research on associations of Western-origin indices with mortality in Japan might reflect challenges in assessing these indices using the FFQ employed in Japanese cohort studies. FFQ with a small number of food items(Reference Abe, Zhang and Tomata10,Reference Nakamura, Ueshima and Okamura11,Reference Nohara, Muraki and Sobue47) may focus primarily on commonly consumed foods, thereby potentially omitting foods that are rarely consumed in Japan but included in Western-origin indices, such as whole grains and nuts.
The DASH, Mediterranean diet, Healthy Eating Index and Alternate Healthy Eating Index have been generally associated with lower all-cause mortality in not only Western but also non-Western countries, including China(Reference Yu, Zhang and Xiang19), Iran(Reference Hashemian, Farvid and Poustchi17) and Chinese adults in Singapore(Reference Neelakantan, Koh and Yuan48). The Western-origin indices include broader food groups and nutrients rather than specific food items, which may contribute to their generalizability to non-Western countries. However, given that meta-analyses have reported substantial heterogeneity in associations of these indices with all-cause mortality(Reference Soltani, Jayedi and Shab-Bidar6–Reference Morze, Danielewicz and Hoffmann8), the effect sizes may vary by index and region. A meta-analysis suggested that the association of Mediterranean diet scores with all-cause mortality may be weaker in non-Mediterranean countries, and the HR of 0·92 per 2-point increments in non-Mediterranean countries was similar to our finding of an HR of 0·94 per 1 sd (1·6 points)(Reference Soltani, Jayedi and Shab-Bidar6). Similarly, a meta-analysis showed that the Healthy Eating Index may have weaker associations with all-cause mortality in non-US countries, and HR were similar to those in our study and in non-US countries (0·93 for Q4 v. Q1 in the present study and 0·90 for the highest v. lowest categories in a meta-analysis)(Reference Hao and Li7). Although region-specific HR have not reported for the Alternate Healthy Eating Index or DASH, the HR in our study were similar to the estimates from the meta-analysis for the Alternate Healthy Eating Index but somewhat higher than those for DASH(Reference Morze, Danielewicz and Hoffmann8). Regarding NRF9.3, similar associations to our present findings were observed in a study in the Netherlands(Reference Streppel, Sluik and van Yperen15). Taken together, the most appropriate index may vary by region, warranting studies to identify optimal choices in each region or country.
When stratified by basic characteristics, AHEI-2010 showed the most consistent associations with lower all-cause mortality across all strata. Among individuals with overweight or obesity, except for AHEI-2010, all indices showed null associations with all-cause mortality. One possible explanation is that individuals with obesity may overestimate their diet quality, as they tend to underreport their intake of fatty or sugary foods(Reference Heitmann and Lissner49). In addition, other factors such as excessive energy intake, obesity itself and obesity-related diseases may play a more important role in all-cause mortality among individuals with obesity, although we adjusted for BMI, energy intake and history of self-reported diabetes and blood pressure. It is unclear why only AHEI-2010 was associated with all-cause mortality among individuals with overweight or obesity. However, compared with the other indices, the AHEI-2010 includes a larger proportion of unfavourable components (four unfavourable, one moderate and six favourable components; Table 1), which may partly explain the observed associations in this group. Further, several indices had weaker associations with all-cause mortality in men than in women. Further research is needed to explore optimal diet quality indices according to individual characteristics.
In our study, except for NRF9.3, none of the diet quality indices examined was associated with cancer mortality. These null associations may be at least partly due to heterogeneity in the association of dietary intake with cancer across sites and types of cancer. Previous studies also observed that, compared with mortality from all causes and CVD, cancer mortality was only weakly or not significantly associated with diet quality indices in Japan(Reference Matsuyama, Sawada and Tomata9,Reference Nakamura, Ueshima and Okamura11–Reference Oba, Nagata and Nakamura14,Reference Nohara, Muraki and Sobue47,Reference Kobayashi, Sasazuki and Shimazu50) and other non-Western countries(Reference Hashemian, Farvid and Poustchi17,Reference Yu, Zhang and Xiang19,Reference Neelakantan, Koh and Yuan48) . Regarding NRF9.3, we observed higher total cancer mortality in the lowest quartile. Additionally, our results suggest inverse associations with mortality from lung, colorectal and pancreatic cancer, although these associations were non-significant due to the small number of deaths. The NRF9.3 may capture suboptimal intakes of nutrients that may contribute to increasing mortality from or risks of lung, colorectal and pancreatic cancer, such as retinol, vitamin C, fibre and SFA(51–53).
We found moderate to strong correlations between Western-origin indices and DQSJ (Spearman’s coefficients ranged from 0·3 to 0·8), whereas the JDI12 and JFGST showed none or weak to moderate associations with the other indices (–0·0 to 0·5). Correlations with intakes of food groups and nutrients also somewhat differed across indices. Nevertheless, all diet quality indices showed beneficial associations with all-cause mortality. Therefore, these indices may capture somewhat different aspects of diet that are beneficial for longevity in the Japanese population. Additionally, the results of omitting one component from the indices suggest that no single component is indispensable in assessing diet quality.
We examined eight diet quality indices using the same dataset and statistical methods; nevertheless, there are no established criteria determining the superiority of any particular index, and we did not statistically compare associations with mortality across indices as in previous studies(Reference Chiuve, Fung and Rimm4,Reference Hashemian, Farvid and Poustchi17,Reference Yu, Zhang and Xiang19–Reference Chan, Yu and Leung21,Reference Livingstone, Milte and Torres43,Reference Neelakantan, Koh and Yuan48) . Although it was difficult to determine a clear superiority of particular indices, associations tended to be strongest for the AHEI-2010, followed by the DQSJ, and weakest for the HEI-2015. The AHEI-2010 and DQSJ were developed relatively recently based on evidence of associations of diet with mortality and risks of chronic diseases, which may explain the relatively strong associations with mortality. Nevertheless, the HR were not markedly different between these indices and the existing Japanese indices (JFGST and JDI12). One possible explanation is that both the AHEI-2010 and DQSJ include components that were rarely consumed in this population (e.g., whole grains), which may have limited their ability to capture diet quality in this setting. On the other hand, the HEI-2015 is a measure of adherence to dietary guidelines for Americans that are based on food intake data from the US population(54), which may lead to a lesser ability to assess healthy dietary patterns in Japan compared with the other indices. The comparable estimates for multiple indices in this study may be informative for future research and practical settings, such as interventions, dietary counselling and policy making. In such contexts, it may be appropriate to select indices that show stronger associations with health outcomes. Further research should still examine multiple diet quality indices simultaneously to identify optimal indices regarding health outcomes in Japan, as well as other countries(Reference Barrett, Afrin and Rayner16,Reference Livingstone, Milte and Torres43) .
The main strengths of this study are the assessment of various types of diet quality indices using the same analysis methods and participation by a high proportion of the entire population of Takayama City, with a low rate of loss during follow-up. Several limitations should be mentioned. First, dietary intake and other covariates were assessed only at baseline. Although we confirmed that associations of diet quality indices with mortality did not substantially differ between the two follow-up periods (8 and 16 years), subsequent changes in dietary intake and other covariates during follow-up may have led to the under- or overestimation of associations. Second, we cannot rule out the possibility of residual or unadjusted confounders. For example, although we carefully adjusted for education level and lifestyle factors such as smoking, physical activity and sleep duration, we did not assess economic status. Third, we conducted multiple statistical analyses, and some significant associations may accordingly have arisen by chance. Also, our sample size might have been insufficient for detecting interactions of sociodemographic factors and diet quality indices on mortality. However, since our aim was not to detect these interactions but to examine associations of diet quality indices with mortality, we assessed the consistency of the observed associations across various characteristics and under different assumptions. Given these limitations and the restricted study area, further research is needed to confirm the observed associations in other Japanese populations.
Conclusions
This study in a Japanese population showed that higher scores on eight diet quality indices (DASH, AMED, HEI-2015, AHEI-2010, NRF9.3, DQSJ, JFGST and JDI12) were associated with lower all-cause and CVD mortality but were not consistently associated with cancer mortality. Beneficial associations of the indices cannot be explained by a single food or nutrient component, suggesting the importance of assessing overall dietary patterns, rather than a single food or nutrient. Although it is difficult to determine a clear superiority of any particular index, the AHEI-2010 showed relatively strong and consistent associations, which were followed by the DQSJ, whereas the HEI-2015 appeared to have relatively weaker associations in this Japanese population. Our results may be informative for future research and practical settings, such as interventions, dietary counselling and policy making. Nevertheless, further research is needed to examine the reproducibility of these findings in other Japanese populations, as well as the associations of these indices with other health outcomes.
Supplementary material
For supplementary material/s referred to in this article, please visit https://doi.org/10.1017/S0007114525106077.
Acknowledgements
This study was supported in part by grants from the Ministry of Education, Culture, Sports, Science and Technology, Japan, and by Japan Society for the Promotion of Science (to FO, JSPS KAKENHI grant no. 24KJ0098). The funders had no role in the design, analysis or writing of this article.
F.O. contributed to the concept of the study, analysed and interpreted the data, prepared the first draft of the manuscript and had primary responsibility for the final content; K.W. contributed to interpretation of data and provided critical input into the final draft of the manuscript; M.Y., M.S. and T.M. provided critical input into the final draft of the manuscript; S.O. contributed to calculate JFGST and provided critical input into the final draft of the manuscript; K.M. provided database for calculating HEI-2015 for Japanese diet and critical input into the final draft of the manuscript; C.N. contributed to data collection and management and interpretation of data and provided critical input into the final draft of the manuscript.
There are no conflicts of interest.


 Open access