


Highlights
-
T2* weighted and FLAIR MRI imaging showed high specificity but low sensitivity for diagnosing ALS.
-
No association was observed between imaging abnormalities and disease severity measured by ALS functional rating scale.
-
Findings suggest limited diagnostic value of these conventional MRI sequences in routine clinical practice.
Introduction
Amyotrophic lateral sclerosis (ALS) is a rapidly progressive and disabling neurodegenerative disease of motor neurons. It is characterized by the progressive degeneration of both upper motor neurons (UMN) and lower motor neurons (LMN), leading to a combination of bulbar, limb, thoracic and abdominal muscle weakness. Reference Rizzo, Marliani and Battaglia1 Early diagnosis of ALS is important for initiating disease-modifying treatments, optimizing symptom management and improving quality of life. However, achieving an accurate early diagnosis is particularly challenging due to the nonspecific and highly heterogeneous nature of early symptoms and signs, as well as significant symptom overlap with other neurological conditions. Reference Rizzo, Marliani and Battaglia1,Reference Logroscino, Tortelli, Rizzo, Marin, Preux and Malaspina2
The current gold standard for ALS diagnosis is the Revised El Escorial Criteria (rEEC) established by the World Federation of Neurology. To enhance the sensitivity of ALS diagnosis, the Awaji criteria and the Gold Coast criteria were subsequently introduced in 2008 and 2019, respectively. Reference Ferullo, Risi and Caria3 These diagnostic frameworks rely on evidence of both UMN and LMN dysfunction. Reference Brooks, Miller, Swash and Munsat4 However, the lack of a reliable biomarker for UMN degeneration poses a challenge as its clinical signs can be masked by LMN degeneration. In view of this limitation, there remains a need for a biomarker of UMN degeneration.
Certain conventional MRI sequences of the brain may serve as potential biomarkers of UMN degeneration in ALS. Characteristic findings may include hyperintensity along the corticospinal tract (CST) on T2w/FLAIR and atrophy on T1w. Reference Rizzo, Marliani and Battaglia1 However, the sensitivity and specificity required for clinical utility are inadequately established, and thus, MRI of the brain is predominantly used to rule out disorders that mimic ALS. Advanced imaging methods like diffusion tensor imaging, magnetic resonance spectroscopy and cortical thickness quantification have provided insights into disease pathogenesis; Reference Agosta, Spinelli and Filippi5 with ongoing development, these may move out of the research realm and into the clinic to provide diagnostic biomarkers. For the time being, two conventional MRI sequences that show potential are T2* weighted and fluid-attenuated inversion recovery (FLAIR). T2* weighted sequences such as susceptibility-weighted imaging (SWI) can detect abnormal iron accumulation in areas like the motor cortex (MC), which is affected in ALS. Some studies have identified MC hypointensity on SWI as a valuable but inconsistent sign of UMN involvement in ALS. Reference Adachi, Sato and Saito6,Reference Roeben, Wilke, Bender, Ziemann and Synofzik7 FLAIR is particularly useful for detecting white matter abnormalities. In ALS, FLAIR has been employed to visualize hyperintensities in areas such as the CST, which are indicative of UMN demyelination or axonal loss. Reference Rizzo, Marliani and Battaglia1 The precise relationship between ALS diagnosis, disease severity and T2* weighted and FLAIR sequence changes remains to be fully elucidated.
Despite some evidence of MRI changes in ALS, few studies have described whether qualitative findings on MRI, particularly T2* weighted or FLAIR, can serve as a reliable diagnostic tool for ALS. To the best of the authors’ knowledge, no studies of this nature have utilized prospectively collected data. Therefore, the purpose of this study was to determine the sensitivity and specificity of brain T2* weighted and FLAIR MRI in diagnosing ALS in a Canadian cohort using prospectively collected data. The secondary aim was to determine whether findings on MRI were associated with the ALS Functional Rating Scale-Revised (ALSFRS-R) score, which is the standard assessment tool used in both clinical practice and clinical trials. These findings may help inform clinical decision-making, improve diagnostic accuracy and ultimately reduce delays in ALS diagnosis.
Methods
Patients
Data were included from the Edmonton participants enrolled in the Canadian ALS Neuroimaging Consortium 1 (CALSNIC- 1) study. Reference Kalra, Khan and Barlow8 Of the 45 Edmonton site participants in the CALSNIC-1 study, 20 adult participants who met the (rEEC) revised El Escorial research criteria for possible, probable, probable-laboratory supported or definite ALS and 20 healthy controls were included. Two participants were excluded due to missing T2* weighted or FLAIR imaging. An additional three participants were excluded due to diagnoses of progressive muscular atrophy (PMA, n = 1), primary lateral sclerosis (PLS, n = 1) or spinocerebellar ataxia (SCA, n = 1).
MRI images
As part of the CALSNIC-1 prospective study, 3T MRI was performed at three time points (0, 4 and 8 months) following a standardized protocol Reference Kalra, Khan and Barlow8 including the recording of detailed clinical information. For the purpose of our analysis, we extracted data regarding demographics including age and sex and disease characteristics including the ALSFRS-R score and disease duration (months from symptom onset until time of recruitment to the study). In cases where there were multiple MRI images available, we analyzed the MRI obtained closest to the time of ALS diagnosis.
MRI data included de-identified 2D axial susceptibility-weighted echo planar imaging (SWEPI) (TE/TR, 25 ms/7540 ms; flip angle, 60°; number of slices, 100; slice thickness, 1.5 mm; voxel size 1.5 × 1/5 × 1.5 mm3; matrix, 150 × 150 pixels; acquisition time 30 s) and 2D axial FLAIR (TE/TR, 80 ms/9000 ms; refocusing flip angle, 165°; number of slices, 50; slice thickness, 3 mm; voxel size 0.94 × 0.94 × 3 mm3; matrix, 256 × 192 pixels, acquisition time, 3:20 min). From each MRI, one axial slice at the level of the MC (SWEPI), one axial slice at the level of the midbrain (FLAIR) and one axial slice at the level of the internal capsule (FLAIR) were selected by a member of the research team (P.C.) using predefined anatomical landmarks to ensure consistency across participants. These images, with their corresponding sagittal and coronal slices, were independently assessed by a radiologist (M.C., with 5 years of post-training experience) and a neurologist (A.G., with 13 years of post-training experience). Contrast settings for each scan were determined by P.C., and the raters were not permitted to modify them. The observers were blind to the diagnosis (ALS vs control) status of the participant and were unaware of the total number of cases and controls. The features of interest were the presence or absence of unilateral or bilateral CST FLAIR hyperintensity in the internal capsule and midbrain and of SWEPI hypointensity in the MC (Figure 1). The raters were not permitted to consider additional factors in their rating. We acknowledge that SWEPI hypointensity can be influenced by cortical atrophy. However, volumetric corrections were not applied because the focus of this study was on the practical value of radiological signs as a diagnostic/prognostic marker for use in day-to-day practice and not as a quantitative study. Based on this visual assessment, each clinician generated two separate ratings to reflect the likelihood of an ALS diagnosis for each patient: one for the FLAIR images and one for the SWEPI image. The FLAIR and SWEPI images were labeled with different participant IDs, so the raters were unable to link the images or be influenced by observations from one imaging modality when assessing the other. The ratings were made using an ordinal scale: “Yes” (definite ALS diagnosis), “Possible” (possible evidence of ALS) or “No” (definite lack of evidence of ALS).
Example of abnormal MRI features (arrows) in a patient with amyotrophic lateral sclerosis. (A) motor cortex T2* weighted hypointensity on susceptibility-weighted echo planar imaging, (B) corticospinal tract fluid-attenuated inversion recovery (FLAIR) hyperintensity at the level of the midbrain and (C) corticospinal tract FLAIR hyperintensity at the level of the internal capsule.

Statistical analysis
Descriptive statistics were calculated for both the control and ALS populations to summarize the demographic and clinical characteristics. Continuous variables were summarized as means with standard deviations, while categorical variables were presented as frequencies and percentages.
Inter-rater reliability between the radiologist’s and neurologist’s ratings was assessed using Cohen’s kappa statistic to evaluate agreement on image abnormalities. Sensitivity and specificity were calculated to assess the performance of the neuroimaging ratings in distinguishing clinically diagnosed ALS from control cases. The two raters assigned a separate rating for both FLAIR and SWEPI images for each participant, using the categories “no,” “possible” or “yes” to reflect the likelihood of an ALS diagnosis based on neuroimaging. For statistical analysis, the “possible” and “no” categories were collapsed into the “no” category, while “yes” was retained as is. Additionally, for sensitivity and specificity analyses, “yes” was only assigned if both the neurologist and radiologist had rated “yes.” This allowed images to be rated as “abnormal” only when the raters were highly confident in their assessment.
To investigate the relationship between imaging findings and clinical outcomes, a linear regression was performed to assess the association between the radiologist’s FLAIR or SWEPI rating and the ALSFRS-R score. p < 0.05 was considered statistically significant. All analyses were conducted using SAS Studio (SAS Institute Inc., Cary, NC).
Results
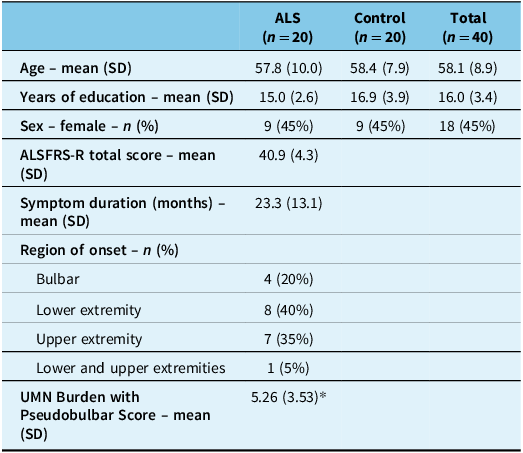
Demographic and clinical data from the 20 patients with ALS and 20 controls are summarized in Table 1. Demographic characteristics were similar between the two groups. The mean age was 57.9 (SD 10.0) years in ALS patients and 58.4 (SD 7.9) years in controls. The groups had an average of 15.0 (SD 2.6) years and 16.9 (SD 3.9) years of education, respectively. About half (45%) of each group consisted of females. Among ALS patients only, the average ALSFRS-R score was 40.9 (SD 4.3), with a symptom duration of 23.3 (SD 13.1) months. Four patients with ALS underwent genetic testing, of whom three had pathogenic mutations involving the C9orf72 gene.
Demographic characteristics in patients with amyotrophic lateral sclerosis (ALS) (n = 20) and controls (n = 20)

Note: ALSFRS-R = ALS Functional Rating Scale-Revised; UMN = upper motor neuron.
* UMN Burden with Pseudobulbar Score value is based on ALS participants with available data (n = 19).
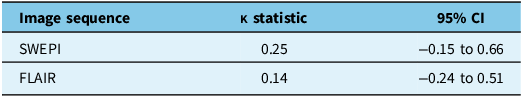
The inter-rater reliability results for the FLAIR and SWEPI image ratings demonstrate low agreement between raters (Table 2). For SWEPI, the kappa statistic was 0.25 (95% CI: –0.15 to 0.66), reflecting a slight to fair level of agreement. For FLAIR, the kappa statistic was 0.14 (95% CI: –0.24 to 0.51), suggesting poor agreement.
Inter-rater reliability of SWEPI and FLAIR image ratings

SWEPI = susceptibility-weighted echo planar imaging; FLAIR = fluid-attenuated inversion recovery.
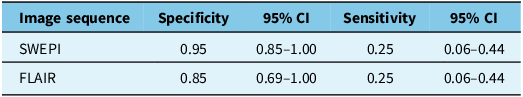
Further analysis shows that this neuroimaging technique is highly specific but not sensitive for ALS diagnosis, when considering the assessment of both the neurologist and radiologist (Table 3). For SWEPI, the specificity was 0.95 (95% CI: 0.85–1.00), and the sensitivity was 0.25 (95% CI: 0.06–0.44). For FLAIR, the specificity was 0.85 (95% CI: 0.69–1.00), and the sensitivity was 0.25 (95% CI: 0.06–0.44).
Diagnostic performance of neuroimaging techniques for amyotrophic lateral sclerosis diagnosis

SWEPI = susceptibility-weighted echo planar imaging; FLAIR = fluid-attenuated inversion recovery.
To investigate our secondary aim, we conducted a linear regression to determine the potential association between neuroimaging rating and ALSFRS-R score among patients with an ALS diagnosis. There was no significant association found between radiologist-read FLAIR or SWEPI and ALSFRS-R score (p > 0.05).
Discussion
The results of this study demonstrated that susceptibility-weighted (SW) and FLAIR MRI sequences had good specificity for ALS, but they lacked sufficient sensitivity to serve as reliable diagnostic tools for the disease. Furthermore, these advanced MRI sequences showed poor predictive value for ALS severity as measured by the ALSFRS-R. These results suggest that SW and FLAIR MRI changes do not reliably reflect functional impairments in patients with ALS, limiting their utility as diagnostic or prognostic biomarkers in patients with ALS. This is consistent with a 2023 study by Chung et al. that demonstrated clinical outcomes were not significantly different between ALS patients with or without an imaging abnormality called motor band sign. Reference Chung, Melkus, Bourque and Chakraborty9 Recent literature also suggests that disease severity and functional impairment in ALS may be less tightly related to focal radiological correlates and more to extra-motor network involvement. Reference Kleinerova, Querin, Pradat, Siah and Bede10 This perspective may explain the lack of correlation between MRI findings and ALSFRS-R scores observed in our cohort and supports the need for multimodal imaging approaches that assess both motor and extra-motor regions. However, the high specificity of SW and FLAIR MRI imaging modalities may still be valuable in conjunction with other clinical assessments, helping to confirm the diagnosis of ALS and reduce unnecessary diagnostic procedures. In other words, the high specificity indicates that FLAIR and SW MRI findings could contribute to supporting an ALS diagnosis in patients who do not fully meet the rEEC due to the absence of UMN signs. Additionally, these conventional MRI sequences may reflect different subtypes of patients with varying pathologies or disease mechanisms. This is evidenced by the fact that some patients diagnosed with ALS showed abnormalities on SW and/or FLAIR images, while others did not.
In the area of ALS, our findings are consistent with the current clinical practice standards, where neuroimaging is primarily used to exclude other potential neuropathologies rather than confirm a diagnosis of ALS. The rEEC, Awaji and Gold Coast criteria for ALS diagnosis do not include any specific neuroimaging findings. Reference Ferullo, Risi and Caria3,Reference Brooks, Miller, Swash and Munsat4 This supports the expectations of poor sensitivity for detecting ALS. The heterogeneity of ALS presentation and progression across individuals may account for the challenges in detecting consistent neuroimaging changes since patterns of brain involvement likely differ as well. Given this variability, neuroimaging may still serve a complementary role in ALS management, helping to inform clinical judgment when integrated with other diagnostic criteria and biomarkers. This highlights the ongoing need for continued research to refine imaging techniques, enabling more accurate detection and monitoring of ALS.
Our results are inconsistent with some other related neuroimaging studies. A previous study using visual assessment of SWI, a type of T2* weighted sequence, found that the bilateral posterior bank of the MC hypointensity score exhibited high sensitivity but low specificity in differentiating patients with ALS from controls. Reference Sheelakumari, Madhusoodanan, Radhakrishnan, Ranjith and Thomas11 However, Sheelakumari et al.’s study classified any magnitude of hypointensity, even if mild, as “presence.” This approach inherently enhances the sensitivity of their findings but reduces specificity. In contrast, the clinicians in our study were instructed to assign a rating of “yes” (definite ALS diagnosis) only when they were very confident that ALS was present. This methodological choice was intended to prioritize specificity over sensitivity to ensure greater diagnostic accuracy. Similarly, Sheelakumari et al.’s study evaluated specific parts of brain structures including the posterior bank of the MC. In contrast, our study employed a broader approach where a single snapshot of the MC was assessed. A qualitative study by Rizzo et al. reported that CST FLAIR hyperintensity and MC SWI hypointensity were more frequently visualized in ALS patients compared to control. Reference Rizzo, Marliani and Battaglia1 Although participant demographics including ALS duration and severity were similar to those of our study, Rizzo et al.’s study included a much larger sample size (ALS n = 93, control n = 89). Additionally, these studies used high-resolution 3D SWI sequences, whereas we used SWEPI, which has lower resolution but a much shorter acquisition time. Together, these differences in assessment methods and sample sizes may at least partially explain the discrepancies in our findings.
A quantitative study by Endo et al. reported significantly lower signal intensity in the precentral gyrus on SW MRI in patients with ALS compared with controls. Additionally, clinical scores, including ALSFRS-R, were significantly correlated with susceptibility changes. Reference Endo, Sekiguchi and Shimada12 In contrast, our analysis revealed no significant correlation between SW and FLAIR imaging findings and ALSFRS-R scores. Given the poor sensitivity of these MRI techniques for detecting ALS in our study, the lack of correlation was not surprising. This discrepancy may stem from our use of qualitative analysis, compared to Endo et al.’s use of quantitative analysis to assess susceptibility changes. The Endo et al. study used disease controls, whereas we used healthy controls, which further hinders our ability to compare diagnostic performance. Furthermore, the mean age of patients with ALS was 7.9 years older than in our study. Although the disease duration and ALSFRS-R scores were similar between studies, brain changes attributed to age may be more prevalent in the Endo et al. patients. Together, these studies suggest that structural brain changes can be visualized in ALS through various analysis techniques. However, our results suggest that qualitative changes detected on SW and FLAIR MRI may not be pronounced enough to reliably distinguish ALS patients from controls. The findings of this study support the current clinical standards of practice, where MRI is primarily used to exclude ALS mimickers rather than as a tool for ALS diagnosis.
The inter-rater reliability was low in the diagnostic assessment of both FLAIR and SW images. This discrepancy in ratings of ALS diagnosis highlights the challenge of relying on qualitative MRI assessment for ALS diagnosis, especially when the test lacks sensitivity. This is especially true in the absence of established criteria for interpreting neuroimaging changes specific to ALS. Although including multiple neurologist and radiologist raters could have improved reliability, our study design aimed to reflect clinical practice where scans are typically reviewed by a single neurologist and radiologist. Perhaps inter-rater reliability and diagnostic performance would have improved if two raters from the same specialty (i.e., two neurologists or two radiologists) had rated the scans because their interpretive framework would be more alike. However, this might limit the generalizability of results to routine multidisciplinary practice where both specialties are involved.
While our study offers insight into the potential limited utility of T2* weighted and FLAIR MRI in ALS diagnosis, several limitations should be considered when interpreting the results. It is important to acknowledge that our study used healthy controls as comparators. However, in clinical practice, the distinction between ALS and ALS mimics such as PLS and hereditary spastic paraplegia is often challenging. Among the potentially eligible Edmonton participants of the CALSNIC-1 dataset, only three individuals had a related motor neuron disease other than ALS – one each with PMA, PLS and SCA. Given this small number, it would not be appropriate to draw conclusions regarding the specificity of MRI findings for ALS versus disease mimics. Furthermore, ALS mimics represent a heterogeneous group of disorders rather than a single entity, and inclusion of such a group could have introduced additional variability and limited the ability to draw meaningful conclusions. Therefore, we focused on delineating ALS from healthy individuals in this study. The inclusion of a disease-control cohort would likely reduce apparent specificity, as overlapping imaging abnormalities may be seen across these conditions. Future studies evaluating MRI biomarkers for ALS should incorporate large disease-control cohorts to more accurately assess diagnostic specificity and clinical applicability. Additionally, the small sample size of 40 participants limits the generalizability of our findings. This is especially true given the heterogeneous presentations of ALS. Our cohort had an average symptom duration of >23 months at enrollment, which may limit generalizability to early disease stages. Reference Armstrong, Hansen and Schellenberg13 Our sample size was too small to reliably assess sensitivity and specificity based on the region of onset of ALS symptoms. Future studies would benefit from a larger cohort to capture a broader range of ALS manifestations, allowing for a reliable assessment of sensitivity and specificity based on the region of symptom onset and better establishment of biomarkers for patients with ALS. We were also unable to adjust for vascular risk factors such as smoking, diabetes or hypertension, which may influence FLAIR hyperintensity. These variables were not available in our dataset and should be considered in future studies. Another major limitation of this study was its deviation from real-life practice as the neurologist and radiologist were provided with three images per patient rather than all the images. Consequently, they could not scroll through multiple images to ascertain their impression, and this likely contributed to the low sensitivity and predictive value observed. Additionally, while efforts were made to standardize slice selection by using anatomical landmarks, we acknowledge that slight variability may remain, which could influence reproducibility. Our study did not incorporate qualitative susceptibility mapping (QSM) pipelines, which recent studies have reported to have excellent diagnostic sensitivity and potential as a neuroimaging biomarker for ALS. Reference Schweitzer, Liu and Gupta14,Reference Ghaderi, Fatehi, Kalra, Mohammadi and Batouli15 While advanced methods like QSM are valuable in research, our focus was on the practical clinical utility of these radiological signs in everyday practice. Such methods are not yet feasible for daily use. Therefore, we selected T2* weighted and FLAIR MRI as they are widely available and can easily be used in clinical settings. Despite these limitations, our study represents a novel contribution to the field as, to the best of the author’s knowledge, it is the first to analyze prospectively collected data of this kind.
Conclusion
While T2* weighted and FLAIR MRI sequences may have some specificity for ALS, our study suggests they are not sufficiently sensitive to be used as reliable diagnostic tools for ALS in daily clinical practice. Although we found no evidence of correlation between MRI changes and ALSFRS-R scores, studies using multiple image slices per patient and a larger sample size are required for confirmation. Reliable neuroimaging biomarkers for ALS diagnosis are still necessary, and future studies should explore a wider range of neuroimaging modalities, such as high-resolution 3D SWI, as well as quantitative techniques for analysis. This work is essential for improving the diagnostic, prognostic and therapeutic abilities for patients with ALS.
Data availability statement
Raw data were generated at the University of Alberta in Edmonton, Canada. Derived data supporting the findings of this study are available upon reasonable request from the corresponding author (A.G.).
Acknowledgments
We gratefully acknowledge the Canadian Institute of Health Research, the ALS Society of Canada, the Brain Canada Foundation and the Shelly Mrkonjic Research Fund for their support of the CALSNIC study from which the raw data for this project were derived. We also thank the CALSNIC study team for providing the raw data used for analysis in this study.
Author contributions
P.C. contributed to study design, prepared image slices, drafted the primary manuscript and reviewed and revised the manuscript for intellectual content and clarity. M.L. contributed to study design, performed data analysis and participated in manuscript review and revision for intellectual content and clarity. M.C. contributed to image evaluation and participated in manuscript review and revision for content and clarity. A.H.W. and S.K. were involved with data collection and participated in manuscript review and revision for intellectual content and clarity. A.A.G. supervised the study, contributed to its conception and design, completed image evaluation and reviewed and revised the manuscript for intellectual content and clarity. All authors provided critical conceptual input and approved the final version of the manuscript.
Funding statement
The study was not funded.
Competing interests
The authors report no conflict of interest.


 Open access
Target article
Exploring the Value of Brain T2* Weighted and FLAIR Imaging for Diagnosing Amyotrophic Lateral Sclerosis
Related commentaries (1)
Reviewer Comment on Cooper et al. “Exploring the Value of Brain T2* Weighted and FLAIR Imaging for Diagnosing Amyotrophic Lateral Sclerosis”